CLIMATE CHANGE
Scientific Assessment and Policy Analysis
WAB 500102 018
Assessment of Bottom-Up Sectoral and
Regional Mitigation Potentials
This study has been performed within the framework of the Netherlands Research Programme on Climate Change (NRP-CC), subprogramme Scientific Assessment and Policy Analysis, project
‘Options for (post-2012) Climate Policies and International Agreement’
Report
500102 018
Authors
Monique Hoogwijk Stephane de la Rue du Can
Aleksandra Novikova Diana Urge-Vorsatz
Eliane Blomen
September 2008
This study has been performed within the framework of the Netherlands Research Programme on Scientific Assessment and Policy Analysis for Climate Change (WAB), project “Comparison of
bottom-up and top-down sectoral greenhouse gas mitigation potentials”.
CLIMATE CHANGE
SCIENTIFIC ASSESSMENT AND POLICY ANALYSIS
Assessment of Bottom-Up Sectoral and
Regional Mitigation Potentials
Page 2 of 40 WAB 500102 018
Wetenschappelijke Assessment en Beleidsanalyse (WAB) Klimaatverandering
Het programma Wetenschappelijke Assessment en Beleidsanalyse Klimaatverandering in opdracht van het ministerie van VROM heeft tot doel:
• Het bijeenbrengen en evalueren van relevante wetenschappelijke informatie ten behoeve van beleidsontwikkeling en besluitvorming op het terrein van klimaatverandering;
• Het analyseren van voornemens en besluiten in het kader van de internationale klimaatonderhandelingen op hun consequenties.
De analyses en assessments beogen een gebalanceerde beoordeling te geven van de stand van de kennis ten behoeve van de onderbouwing van beleidsmatige keuzes. De activiteiten hebben een looptijd van enkele maanden tot maximaal ca. een jaar, afhankelijk van de complexiteit en de urgentie van de beleidsvraag. Per onderwerp wordt een assessment team samengesteld bestaande uit de beste Nederlandse en zonodig buitenlandse experts. Het gaat om incidenteel en additioneel gefinancierde werkzaamheden, te onderscheiden van de reguliere, structureel gefinancierde activiteiten van de deelnemers van het consortium op het gebied van klimaatonderzoek. Er dient steeds te worden uitgegaan van de actuele stand der wetenschap. Doelgroepen zijn de NMP-departementen, met VROM in een coördinerende rol, maar tevens maatschappelijke groeperingen die een belangrijke rol spelen bij de besluitvorming over en uitvoering van het klimaatbeleid. De verantwoordelijkheid voor de uitvoering berust bij een consortium bestaande uit PBL, KNMI, CCB Wageningen-UR, ECN, Vrije Univer-siteit/CCVUA, UM/ICIS en UU/Copernicus Instituut. Het PBL is hoofdaannemer en fungeert als voorzitter van de Stuurgroep.
Scientific Assessment and Policy Analysis (WAB) Climate Change
The Netherlands Programme on Scientific Assessment and Policy Analysis Climate Change (WAB) has the following objectives:
• Collection and evaluation of relevant scientific information for policy development and decision–making in the field of climate change;
• Analysis of resolutions and decisions in the framework of international climate negotiations and their implications.
WAB conducts analyses and assessments intended for a balanced evaluation of the state-of-the-art for underpinning policy choices. These analyses and assessment activities are carried out in periods of several months to a maximum of one year, depending on the complexity and the urgency of the policy issue. Assessment teams organised to handle the various topics consist of the best Dutch experts in their fields. Teams work on incidental and additionally financed activities, as opposed to the regular, structurally financed activities of the climate research consortium. The work should reflect the current state of science on the relevant topic.
The main commissioning bodies are the National Environmental Policy Plan departments, with the Ministry of Housing, Spatial Planning and the Environment assuming a coordinating role. Work is also commissioned by organisations in society playing an important role in the decision-making process concerned with and the implementation of the climate policy. A consortium consisting of the Netherlands Environmental Assessment Agency (MNP), the Royal Dutch Meteorological Institute, the Climate Change and Biosphere Research Centre (CCB) of Wageningen University and Research Centre (WUR), the Energy research Centre of the Netherlands (ECN), the Netherlands Research Programme on Climate Change Centre at the VU University of Amsterdam (CCVUA), the International Centre for Integrative Studies of the University of Maastricht (UM/ICIS) and the Copernicus Institute at Utrecht University (UU) is responsible for the implementation. The Netherlands Environmental Assessment Agency (PBL), as the main contracting body, is chairing the Steering Committee.
For further information:
Netherlands Environmental Assessment Agency MNP, WAB Secretariat (ipc 90), P.O. Box 303, 3720 AH Bilthoven, the Netherlands, tel. +31 30 274 3728 or email: wab-info@pbl.nl.
This report has been produced by: Monique Hoogwijk, Eliane Blomen. Ecofys Netherlands BV
Stephane de la Rue du Can
Lawrence Berkeley National Laboratory (LBNL), USA
Aleksandra Novikova, Diana Urge-Vorsatz Central European University (CEU), Hungary
Name, address of corresponding author: Monique Hoogwijk, PhD
Ecofys Netherlands BV Tel: +31(30) 280 83 00 Kanaalweg 16-G
P.O. Box 8408 3503 RK Utrecht, The Netherlands Internet: www.ecofys.com
E-mail: info@ecofys.nl
Disclaimer
Statements of views, facts and opinions as described in this report are the responsibility of the author(s).
Copyright © 2008, Netherlands Environmental Assessment Agency, Bilthoven
All rights reserved. No part of this publication may be reproduced, stored in a retrieval system or transmitted in any form or by any means, electronic, mechanical, photocopying, recording or otherwise without the prior written permission of the copyright holder
Contents
Summary 7
Samenvatting 9
1 Introduction 11
2 General approach 13
2.1 Definition of the sectors 13
2.2 Sectoral and Aggregated Baseline 13
2.3 Emission Reduction Options 14
2.4 Type of Mitigation Potential and Costs included 14
2.5 Aggregated Mitigation Potential 14
3 Transport 15
3.1 Baseline 15
3.2 Mitigation Measures 15
3.2.1 Heavy and Medium Duty Vehicle 15
3.2.2 Marine 16
3.2.3 Biofuels 16
3.3 Costs of Emission Reduction 16
3.4 Mitigation potential of the transport sector 17
4 Residential and services 19
4.1 Baseline 19
4.2 Mitigation measures 20
4.3 Aggregation to global figures in cost ranges 22
5 Industry 25
5.1 Baseline 25
5.2 Reduction measures 26
5.3 Costs of Emission Reduction 27
5.4 Aggregated mitigation potential 27
6 Energy supply 29
6.1 Baseline 29
6.2 Reduction Measures 30
6.3 Costs of Emission Reduction 30
7 Correction for Double Counting 31
8 Main Findings Overall Mitigation Potential 33
9 Discussion and Conclusions 37
9.1 Discussion 37
9.2 Conclusions 38
References 39
List of Tables
1: Summary of main baseline characteristics. 14
2: General list of most important emission reduction options per sector 14 3: Overview of emission reduction measures for the HDV based on Elliott et al.,
2006 and Lensink and De Wilde, 2007 15
4: Main results of the mitigation potential for the transport sector divided per transport
mode in Mton CO2eq. 17
5: Greenhouse gas emissions reduction potential ranges for the buildings stock in
Page 6 of 40 WAB 500102 018
6 Potential for CO2 emission reductions in buildings globally and by country group
in 2030 23
7. Mitigation Percentage Estimates for the Energy Intensive Industries 26 8. Mitigation Percentage Estimates from CCS and for Other Industries 27 9: The total mitigation potential for the different energy carriers for the industry sector 27 10: The main assumptions for the correction of the baseline for electricity savings 31 11: The Baseline of the energy supply sector from the World Energy Outlook and
corrected for the energy savings from residential and industry sector 32
List of Figures
1: Baseline emissions of the transport sector in 2002 and 2030. 15 2 Comparison of the baseline CO2 emissions according to the IPCC SRES A1 and
B2 scenarios, World Energy Outlook (2004), and the IPCC AR4 Chapter 6 forecast
adjusted to the business-as-usual case 19
3 CO2 baseline emissions of the buildings sector in different world regions in the base year 2000 and the target year of the projects 2030 20 4 Potential for CO2 mitigation in buildings related to electric and fuel end-uses split
into cost categories, 2030 (presented as shares of respective fuel- and electricity
associated baseline CO2 emissions) 23
5: Baseline emissions of the Industry sector in 2005 and 2030 25 6: Baseline emissions of the Industry sector in 2030 broken down by CO2 source. 26 7: Total global estimate electricity supply in TWh for different fuel mix based on the
WEO2004 29
8: GHG emissions from the energy supply sector for the centralised heat and the
electricity supply 29
9: The aggregated sectoral baseline emissions in comparison with the WEO2004, and the marker SRES A1 and B2 scenarios for the year 2000 and 2030. Please note that for WEO2004 and SRES baselines only CO2 emissions are included. The allocation to point of emission is done by allocating all emissions from electricity to the energy supply sector. Source: this study and Price et al. (2006) 33
10: Main results per sector at different cost levels 33
11: Main results per sector and aggregated and compared with the AR4 figures 34 12: The sectoral mitigation potential for the different regions relative to the baseline 34 13: The mitigation potential in 2030 for different sectors are costs below 0 and 100
Summary
This report estimates the mitigation potentials of different economic sectors in three world regions. The estimates are an update of the values reported in the IPCC AR4. This report is part of a larger project on comparing mitigation potential using a bottom up and a top-down approach. This report is the background report of the bottom-up estimates. It includes the energy related sectors: energy supply, transport, industry and residential and service sector. Important aspects of the general approach are:
There is a good sectoral and regional definition. These definitions ensure that emissions and mitigation potentials are not double counted when aggregating over the regions and sectors.
There is a consistent baseline used. All potentials are expressed relative to a reference situation, the baseline. If this reference situation differs among sectors, the results are not comparable or cannot be aggregated. In this study the baseline from the IEA World Energy Outlook is used for most sectors.
We corrected the aggregated potential for potential double counting. Interactions between the energy supply measures and the energy saving measures can cause double counting in the aggregated mitigation potential. For an estimate without double counting, a certain ordering is needed. The potential from energy saving in the end use sectors was calculated first using the emission factor from the energy supply baseline. The savings were subsequently extracted from the energy supply baseline. After that, the mitigation potential from the fuel switching options in the energy supply sector was calculated.
The mitigation potential for the energy related sectors range from 11 to 16 GtCO2. Relative to the baseline in 2030, this is 25 – 40%. At negative costs, the largest share can be found in the residential and service sector. The total potential at negative costs is estimated at 5 – 8% relative to the baseline. These (negative) costs should be considered in the context that technical barriers have not been included in this study. The transport sector has the lowest reduction potential. After that the industry sector has the lowest reduction potential. The largest reductions are estimated for the energy supply sector.
Samenvatting
Dit rapport geeft schattingen van emissie reductiepotentiëlen voor verschillende economische sectoren en drie wereld regio’s. De schattingen zijn deels een aanvulling en deels een vernieuwing van eerdere getallen gepubliceerd in het IPCC vierde assessment rapport (AR4). Het rapport is een onderdeel van een project met als doel reductiepotentiëlen in te schatten op basis van twee afzonderlijke methoden: van onderaf (bottom-up) en van bovenaf (top-down). In dit achtegrondrapport worden de schattingen gegeven en onderbouwd van de bottom-up benadering.
Dit rapport berekent de reductiepotentiëlen voor vier energie gerelateerde sectoren: de energie sector, transport sector, industrie sector en de huishoud en service sector. Belangrijk bij de gebruikte methode is dat:
Er een goede sectorale en regionale definitie is. Deze definities dragen zorg dat bepaalde emissies of reducties niet toegerekend worden aan meerdere regio’s of sectoren.
Er een consistente referentiesituatie wordt aangenomen voor alle sectoren. Alle potentiëlen worden uitgedrukt als reductie ten opzichte van een referentiesituatie (baseline). Als deze baseline sterk verschilt per regio of sector geeft dit onderling niet vergelijkbare en aggregeerbare potentiëlen. In deze studie wordt vooral gebruik gemaakt van de baseline uit het IEA rapport World Energy Outlook.
Er rekening wordt gehouden met mogelijke dubbeltellingen van potentiëlen bij het optellen van alle sectoren. Er bestaan interacties tussen het inschatten van reducties van energiebesparing en als gevolg van verandering naar minder koolstofintensieve energievoorziening. In deze studie wordt gecorrigeerd voor deze mogelijke dubbeltellingen.
In deze studie wordt gevonden dat het potentieel van energiegerelateerde sectoren varieert van 11 tot 16 GtCO2. Relatief ten opzichte van de baseline, dit is 25 – 40%. Deze potentiëlen zijn berekend bij koolstof prijzen van 100 US$/tCO2 of lager. Het potentieel dat kan worden bereikt tegen negatieve kosten is geschat op 5 – 8 % relatief ten opzichte van de baseline. Deze (negatieve) kosten moeten gezien worden in het licht dat er geen kosten van mogelijke niet technische barrières zijn meegenomen. Van de sectoren bekeken, heeft de transport sector het laagste potentieel gevolgd door de industrie sector. De energie sector heeft het grootste potentieel.
1 Introduction
An important question for climate policy making is how much GHG emissions and energy can be saved, in which sectors and at what costs? Traditionally, two different approaches are used to answer this question: the bottom-up and the top-down approach. The bottom-up approach is characterised by technological and sectoral detailed information and mostly physical indicators. The top-down approach focuses on the processes within the economy as a whole including interactions on the basis of calibrating historical behavioural.
The IPCC fourth assessment report (AR4) (IPCC, 2007) include both approaches to assess the medium-term sectoral potentials and costs of GHG mitigation. The results of the two approaches were found comparable on the global level. However, at a regional and sectoral level the results could not be compared due to different data formats. This report is part of a project in which bottom-up and top-down assessments of the sectoral and regional mitigation potentials are compared. This report estimates a robust number for the emission reduction potential at different costs levels for the timeframe 2030 using a bottom-up approach.
The potentials are presented for four cost levels (0, 20, 50 and 100 US$/tCO2) and three world regions (OECD, EIT and non-OECD1). The focus here is on the energy related economic sectors: energy supply, transport, residential and services and industry.
The report starts with a description of the general approach including the sectoral definition. In the chapters 3 – 6 the sectoral approaches are described. Chapter 7 explains how is corrected for potential overlap. The main findings and discussion and conclusions are presented in Chapters 8 and 9.
1
OECD includes all the countries that are part of the Organisation for Economic Co-operation and Development excluding the economies in transition. The EIT (Economies in Transition) includes the Eastern European countries as well as the countries formerly part of the Soviet Union. Non OECD includes all other countries.
2 General
approach
The general approach can be summarised by the following five steps: 1. Definition of the sector boundaries to avoid overlap between sectors. 2. Construction of the baseline for each sector.
3. Identification of the mitigation measures and related costs.
4. Assessment of the sectoral mitigation potential at different cost levels.
5. Aggregation of the sectoral potential to total potential including a correction of double counting potentials.
Below we describe the definitions of the sectors, estimate for the baseline and the emission reduction potential per sector and the approach for the cross sectoral aggregation. Detailed description can be found in Chapters 3 – 6 on transport, residential and service, industry and energy supply sector.
2.1 Definition of the sectors
Energy supply
The energy supply sector includes emissions from fuel use of centralised power and heat supply. It includes emissions from Combined Heat and Power (CHP) if these are included in energy statistics as centralised supply. Emissions of extraction and distribution are not included.
Transport
The transport sector includes emissions from fuel use of passenger and freight transport, like light duty vehicles (LDV), medium and heavy duty vehicles (MDV and HDV), emissions from public transport, motorcycles and emissions from aviation and navigation both inland and international.
Residential and Service 2
The residential and service sector includes emissions from fuel use form space and water heating and electricity-associated emissions from space and water heating, space cooling and conditioning, appliances and lighting. Emissions from district heating which result from space heating in buildings are included into the buildings sector baseline but neither other emissions from district heat nor options aimed to improve district heat production and distribution are studied. The research did not cover non-CO2 emissions in the buildings sector (HFCs, HCFCs, and CFCs) because their forecast and potential mitigation were recently reviewed in the IPCC/TEAP report (2005).
Industry
The industry sector includes emissions from all industrial activities, both from fuel use and from processes. Refineries are included in the industry sector. Both CO2 and non-CO2 emissions are included.
2.2 Sectoral and Aggregated Baseline
The baseline is taken exogenously. For all sectors except the residential and service sector, the world energy outlook 2004 (IEA, 2004) baseline has been used. For the residential and service sector a new baseline is constructed based on different aggregated literature sources. The baseline is further disaggregated into more sub sectors or technology detail where needed (see
2
The category of non-residential buildings is referred to by different names in the literature, including commercial, service, tertiary, public, office, and municipal. In this report, all non- residential buildings under considered under the title of the “service” sector.
Page 14 of 40 WAB 500102 018
Table 1). In addition, for all sectors the baseline is split between heat and power to enable different representation, i.e. allocation to point of emission or to end use sectors.
Table 1 provides the main characteristics of the baseline. Below we give a short description per sector.
Table 1: Summary of main baseline characteristics.
Sector Baseline Remark, additional adjustments
Energy supply WEO2004 Split between heat and power
Transport WEO2004 and
WBCSD2004
Split in different transport modes Residential and service
sector
Own baseline Own baseline constructed from various
regional literature sources.
Industry sector WEO2004 Split between heat and power and
different industry sub sectors
2.3 Emission Reduction Options
The emission reductions are estimated relative to the baseline. Three types of emission reduction options are identified:
• Energy demand options, i.e. energy savings (both fuel and electricity).
• Energy supply options, i.e. substitution to technologies with a lower emission factor.
• Reduction of non-CO2 emissions, e.g. reductions of emissions in processes.
Table 2: General list of most important emission reduction options per sector
Energy supply Substitution to carbon free technologies: renewable energy as wind, biomass, nuclear.
Transport Efficiency improvements and conversion to biofuels
Buildings Building shell retrofit, efficiency improvements, fuel switch
Industry Efficiency improvements in motors, retrofit, fuel substitution, Carbon Capture and Storage (CCS), feedstock substitution, process innovation
2.4 Type of Mitigation Potential and Costs included
The type of potential that is estimated can be described as a deployment potential at different cost levels. It includes the technically maximum deployment at different carbon cost categories. The costs are based on technical cost parameters using a discount rate in the order of 3 – 10 %. The potential is based on physical and technical constraints as well as of the size of the market. Non technical costs as social or market costs are not included. The reduction potential at a sectoral level is estimated for a low and a high range representing the main uncertainties in the assumptions.
2.5 Aggregated Mitigation Potential
Interactions between the energy supply measures and the energy saving measures can cause double counting in the aggregated mitigation potential. To assess the potential from energy savings assumptions are required on the emission factor which is influenced by supply measures. To assess the potential of the fuel switch options in the energy supply sector, assumptions are required on the total energy demand which is influenced by the energy savings measures. For an estimate without double counting, a certain ordering is needed. The potential from energy saving in the end use sectors was calculated first using the emission factor from the energy supply baseline. The savings were subsequently extracted from the energy supply baseline. After that, the mitigation potential from the fuel switching options in the energy supply sector was calculated. This is further explained in Chapter 7.
3 Transport
3.1 Baseline
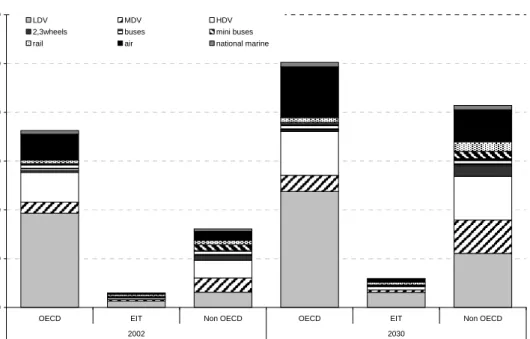
The baseline of the transport sector is estimated for different transport modes, as is given in Figure 1. The largest emissions are from light duty vehicles. The baseline for LDV is taken from the AR4 (IPCC, 2007), based on WBCSD (2004). The remaining of the baseline emissions are taken from the WEO2004 (IEA, 2004). Data from the WBCSD (2004) are used to split the emissions between the different modes.
0.0 1.0 2.0 3.0 4.0 5.0 6.0
OECD EIT Non OECD OECD EIT Non OECD
2002 2030 Bas e line e m is s io n s (Gt C O2 ) LDV MDV HDV
2,3wheels buses mini buses rail air national marine
Figure 1: Baseline emissions of the transport sector in 2002 and 2030.
3.2 Mitigation Measures
We calculate the mitigation potential from MDV, HDV and international and national marine. Reductions and costs for LDV and aircraft is taken from IPCC AR4 (IPCC, 2007). The emission reduction from LDVs and international air are taken from the IPCC AR4. The mitigation potential from the other transport modes is not included due to lack of good data. The emissions from the modes included contribute 70% to the total transport emissions in 2030. In the description we focus on the modes that were analysed additional to the IPCC AR4.
3.2.1 Heavy and Medium Duty Vehicle
The emission reductions from the HDV and MDV are taken from two sources; Elliott et al., 2006 and Lensink and De Wilde, 2007. The result of both studies is summarised in Table 3. The mitigation potential for these measures cannot be aggregated because of overlap. But based on these sources it is assumed that heavy-duty freight can improve fuel economy by 39% in 2030. Based on the same sources, it is assumed that medium-duty freight can improve fuel economy by 50% in 2030 mainly due to the use of hybridization.
Table 3: Overview of emission reduction measures for the HDV based on Elliott et al., 2006 and Lensink and De Wilde, 2007
Page 16 of 40 WAB 500102 018
General saving measure Type of technology %mpg gain
rolling resistance wide-based tires; pneumatic blowing I 1-3%
Engine
thermal management, friction reduction, increased peak cylinder pressure, more efficient
combustion 2-10%
auxiliaries fuel-cell auxiliaries, electrical auxiliaries 2-6%
Weight vehicle mass 8%
aerodynamics
cab top deflector, pneumatic blowing, gap
closing 2-5% The fuel saving is given with reference to the current fuel economy. The relative savings are
therefore estimated relative to a frozen reference scenario. This frozen reference scenario is constructed using the growth rates of the WBCSD scenario for activity indicator, i.e. the amount of ton-km per year, and assuming a constant energy and emission intensity. The energy and emission intensity is defined as the fuel consumptions per activity indicator. The savings are extracted from this frozen reference scenario resulting in a reduced reference scenario.
We are interested in the emission reduction potential compared to the WEO2004 baseline. The reduction compared to frozen reference is an overestimate of the emission reduction compared to the baseline. The difference between the WEO2004 baseline and the reduced reference scenario is taken as the emission reduction potential relative to the baseline.
3.2.2 Marine
The emission reduction for shipping has also been based on two studies: Lensink and De Wilde, 2007 and Marintek, 2000. Lensink and De Wilde, 2007 estimate 20% savings in 2030 for inland navigation as a realistic potential. With current available technology, efficiency savings up to 30% with respect to the current fleet are possible.
International shipping may reduce 28% savings in 2020 due to technical measures and 24% savings in 2020 due to operational measures. The total maximum fuel saving is estimated at 46%, Marintek, 2000 and Buhaug, 2008. Based on this, we assume 20% minimum and 46% maximum savings (with respect to the frozen technology scenario) for international shipping and 30% maximum savings for national shipping.
The frozen reference scenario is recalculated from the WEO2004 scenario assuming an autonomous efficiency improvement of 1% per year. The difference between the WEO2004 baseline and the reduced reference scenario is taken as the emission reduction potential relative to the baseline.
3.2.3 Biofuels
The emission reductions due to biofuels was only included in the AR4 on a global scale. Here the emission reductions from biofuels are included for both LDVs, HDVs and MDVs. For all modes it is assumed that of the fuel demand after energy savings, between 10 and 25% biofuels can be blended. The emission reductions for the biomass are assumed to substitute between 50 – 100% of CO2 emissions. The ranges results in the overall low and high mitigation potential.
3.3 Costs of Emission Reduction
For LDV the data represented in the AR4 are used. For freight, medium and heavy duty and for shipping the costs are derived from literature.
For freight, the costs were taken from Elliot et al., 2006. Costs for HDV were reported per measure in $ per gallon saved which is converted to $ per CO2 avoided for each of the
measures. This was done for all individual measures reported by Elliott et al. This list was used to estimate the cost distributed. It was assumed that 75% of the reduction can be achieved at costs below 50 US$/tCO2 and 25% at costs below 100 US$/tCO2. For MDV Elliot report that at a discount rate of 5% and a fuel price of 2.05 US$/gallon the measures are cost effective after about 3 years. It is therefore assumed that all savings are cost effective.
For shipping no costs were reported except that the costs for all abatement options are “moderate”. It is therefore assumed that all costs are below 100 US$/tCO2.
Costs of biofuels are not separately calculated and the assumption from the IPCC has been used here, assuming that the biofuels are available at costs below 25 US$/tCO2.
3.4 Mitigation potential of the transport sector
The main results for the transport sector are summarised inTable 4. The largest potential is found in the energy savings in the light duty vehicle. Of the total global potential almost 40% is found at negative costs all estimated for the light duty vehicles.
Table 4: Main results of the mitigation potential for the transport sector divided per transport mode in Mton CO2eq. Low High < 0 0 - 20 20 - 50 50 - 100 < 0 0 - 20 20 - 50 50 - 100 OECD-EIT 253 270 0 0 523 0 0 48 EIT 28 0 0 21 28 21 0 0 non OECD 88 30 20 8 146 0 0 0 LDV Global 369 300 20 29 697 21 0 48 OECD-EIT 3 0 0 0 138 0 0 0 EIT 0 0 0 0 15 0 0 0 non OECD 42 0 0 0 307 0 0 0 MDV Global 45 0 0 0 460 0 0 0 HDV OECD-EIT 0 0 16 5 0 0 202 67 EIT 0 0 0 0 0 0 10 3 non OECD 0 0 52 17 0 0 227 76 Global 0 0 67 22 0 0 439 146 OECD-EIT 0 0 41 0 0 0 301 0 EIT 0 0 4 0 0 0 29 0 non OECD 0 0 49 0 0 0 368 0 Biofuels HDV & MDV Global 0 0 94 0 0 0 698 0 OECD-EIT 0 0 90 0 0 0 464 0 EIT 0 0 13 0 0 0 65 0 non OECD 0 0 48 0 0 0 241 0 Biofuels LDV Global 0 0 152 0 0 0 770 0 OECD-EIT 0 0 0 0 0 0 0 7 EIT 0 0 0 0 0 0 0 0 non OECD 0 0 0 0 0 0 0 7 International shipping Global 0 0 0 0 0 0 0 160 OECD-EIT 0 0 0 0 0 0 0 0 EIT 0 0 0 0 0 0 0 0 non OECD 0 0 0 0 0 0 0 0 International Aircrafts Global 0 0 0 277 0 0 0 277 OECD-EIT 256 270 147 5 661 0 966 122 Total EIT 28 0 17 21 43 21 104 4
Page 18 of 40 WAB 500102 018 Low High < 0 0 - 20 20 - 50 50 - 100 < 0 0 - 20 20 - 50 50 - 100 non OECD 130 30 169 25 453 0 835 82 Global 414 300 333 328 1157 21 1906 632
4
Residential and services
4.1 Baseline
For the regional and global potential for CO2 emission reduction in the residential and service sector the approach was based on Ürge-Vorsatz and Novikova (2008). The potential was estimated through aggregation of the potential reduction of emission baselines (%) in different world countries based on a number of country/region-focused studies. To ensure the consistency of the baseline emission forecast with the mitigation potential estimates, the aggregated baselines of the reviewed studies were used, i.e. not other exogenous scenarios.
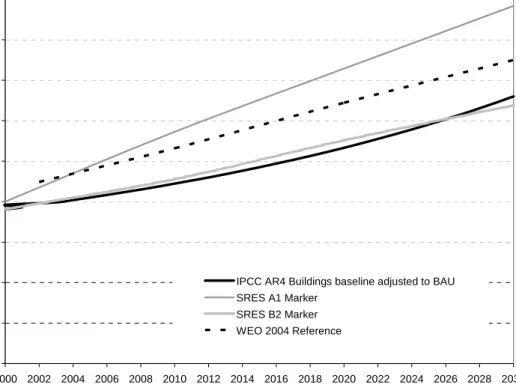
As described in Ürge-Vorsatz and Novikova (2008), the global sectoral baseline in 2000 – 2020 was derived through the aggregation of the baselines of seven regions with similar economic and climate conditions; each regional baseline was estimated through exponential extrapolation of the year 2000 SRES B2 (Nakicenovic et al., 2000) emission data using the respective emission growth rates. These growth rates were calculated through the population weighted average CO2 baseline growth rates of the two - four sub regions which were represented by marker countries for which the studies were available. In cases when studies used a frozen efficiency baseline, an autonomous efficiency improvement of 1% was applied to adjust them for a business-as-usual case. Assuming that the emission growth rates over the 2020-2030 period will be the same as for the 2000-2020 period, the 2000-2020 emission trends were extrapolated to the period 2020-2030. The baseline forecasted lied in 2030 above SRES B2 scenario but below SRES A1 (Nakicenovic et al., 2000) and WEO2004 as illustrated on Figure 2 below. 0 2,000 4,000 6,000 8,000 10,000 12,000 14,000 16,000 18,000 2000 2002 2004 2006 2008 2010 2012 2014 2016 2018 2020 2022 2024 2026 2028 2030 Glo b a l C O 2 emissio n s ov er t im e (M t C O 2)
IPCC AR4 Buildings baseline adjusted to BAU SRES A1 Marker
SRES B2 Marker WEO 2004 Reference
Figure 2 Comparison of the baseline CO2 emissions according to the IPCC SRES A1 and B2 scenarios,
World Energy Outlook (2004), and the IPCC AR4 Chapter 6 forecast adjusted to the business-as-usual case
Page 20 of 40 WAB 500102 018
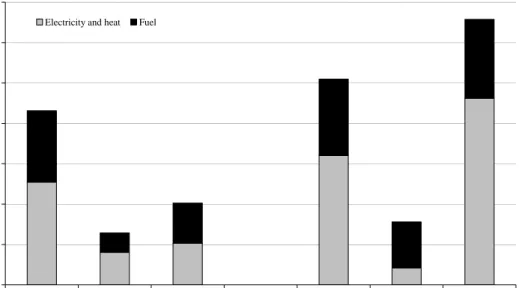
Figure 3 illustrates the results of the forecast of CO2 emissions in the buildings sector in the base and target years. The figure attests that in 2000 developed countries contributed the largest share to buildings-related CO2 emissions whereas by 2030 developing countries take the lead. It is also found that the importance of emissions associated with electricity will grow in developed and developing countries.
0 1000 2000 3000 4000 5000 6000 7000
OECD (-EiT) EiT non-OECD OECD (-EiT) EiT non-OECD
R egional CO 2 e m issions fo r 2000 and 203 0 (Mt C O 2-eq )
Electricity and heat Fuel
2000 2030
Figure 3 CO2 baseline emissions of the buildings sector in different world regions in the base year 2000
and the target year of the projects 2030
4.2 Mitigation measures
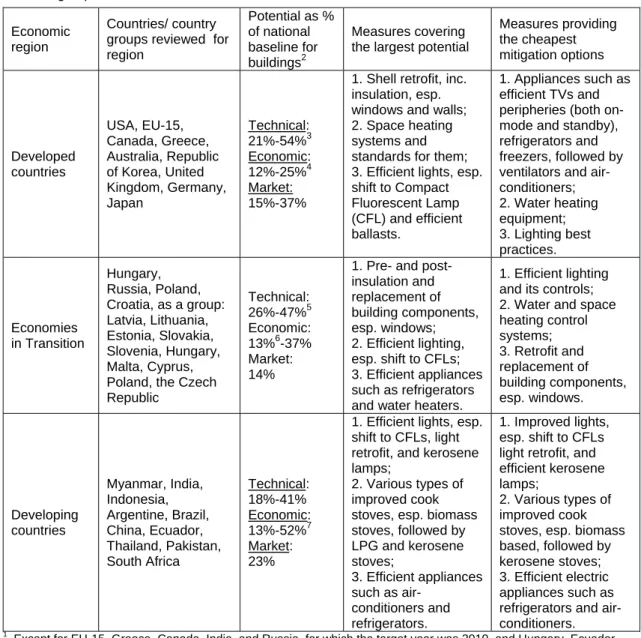
The regional and global estimates of potential CO2 emission reductions in buildings relied on the analysis of about 80 bottom-up country- and region-oriented studies as reported in Ürge-Vorsatz and Novikova (2008). Table 5 provides a short summary of the analysis and reports ranges of the estimates of different types of CO2 mitigation potential in different world regions and countries from the implementation of mitigations options; the table also ranks the options in terms of the size of potential and its mitigation cost. It should be noted that for each country assessed the number and types of measures are different since they were provided by different reports. In total, more than 150 measures were assessed with on average 5-10 options per country study.
Table 5 concludes that efficient lighting are both cost-effective and represent a significant potential for emission reductions in all world regions. In developing countries, efficient stoves rank second, while the second-place measures differ in transition economies and industrialized countries by climatic and geographic region. In terms of cost-effectiveness, in transition economies with colder climates, heating-related measures are very cost-effective, especially insulation of walls, roofs, windows, and floors, as well as improved heating controls for district heat; in developed countries, appliance-related measures are identified as the most beneficial, with cooling-related equipment upgrades ranking high in the warmer climates. In terms of the size of savings, improved insulation and district heating in the colder climates and efficiency measures related to space conditioning in the warmer climates come first in almost all studies, along with cooking stoves in developing countries. Other measures that rank high in terms of savings potential are solar water heating, efficient lighting, and efficient appliances, as well as building energy management systems.
Table 5: Greenhouse gas emissions reduction potential ranges for the buildings stock in 20201 by country groups
Economic region
Countries/ country groups reviewed for region Potential as % of national baseline for buildings2 Measures covering the largest potential
Measures providing the cheapest mitigation options Developed countries USA, EU-15, Canada, Greece, Australia, Republic of Korea, United Kingdom, Germany, Japan Technical: 21%-54%3 Economic: 12%-25%4 Market: 15%-37%
1. Shell retrofit, inc. insulation, esp. windows and walls; 2. Space heating systems and standards for them; 3. Efficient lights, esp. shift to Compact Fluorescent Lamp (CFL) and efficient ballasts. 1. Appliances such as efficient TVs and peripheries (both on-mode and standby), refrigerators and freezers, followed by ventilators and air-conditioners; 2. Water heating equipment; 3. Lighting best practices. Economies in Transition Hungary, Russia, Poland, Croatia, as a group: Latvia, Lithuania, Estonia, Slovakia, Slovenia, Hungary, Malta, Cyprus, Poland, the Czech Republic Technical: 26%-47%5 Economic: 13%6-37% Market: 14%
1. Pre- and post- insulation and replacement of building components, esp. windows; 2. Efficient lighting, esp. shift to CFLs; 3. Efficient appliances such as refrigerators and water heaters.
1. Efficient lighting and its controls; 2. Water and space heating control systems; 3. Retrofit and replacement of building components, esp. windows. Developing countries Myanmar, India, Indonesia, Argentine, Brazil, China, Ecuador, Thailand, Pakistan, South Africa Technical: 18%-41% Economic: 13%-52%7 Market: 23%
1. Efficient lights, esp. shift to CFLs, light retrofit, and kerosene lamps;
2. Various types of improved cook stoves, esp. biomass stoves, followed by LPG and kerosene stoves; 3. Efficient appliances such as air-conditioners and refrigerators. 1. Improved lights, esp. shift to CFLs light retrofit, and efficient kerosene lamps;
2. Various types of improved cook stoves, esp. biomass based, followed by kerosene stoves; 3. Efficient electric appliances such as refrigerators and air-conditioners.
1 Except for EU-15, Greece, Canada, India, and Russia, for which the target year was 2010, and Hungary, Ecuador, and South Africa, for which the target was 2030.
2
The fact that the market potential is higher than the economic potential for developed countries is explained by limitation of studies considering only one type of potential so information for some studies likely having higher economic potential is missing.
Note: the detailed description of the studies, which are the input into the table, and their references are discussed in Ürge-Vorsatz and Novikova (2008).
3
Both for 2010, if the approximate formula
(
)
10202020 1 1 2010
Potential = − −Potential is used to extrapolate the
potential as percentage of the baseline into the future (the year 2000 is assumed as a start year), this interval would be 38%-79%.
4
Both for 2010, if extrapolation formula suggested above is used, this interval would be 22%-44%.
5
The last figure is for 2010, corresponds to 72% in 2020 if the extrapolation formula above is used.
6
The first figure corresponds to 24% in 2020 if the extrapolation formula above is used.
7
The last figure is for 2030, corresponds to 38% in 2020 if the extrapolation formula suggested above is applied to derive the intermediate potential.
Page 22 of 40 WAB 500102 018
4.3 Aggregation to global figures in cost ranges
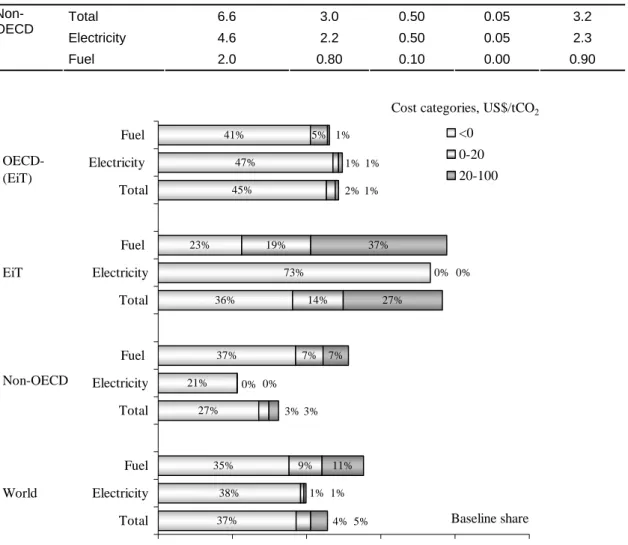
The global potential estimates as a percentage of the CO2 baseline emissions were calculated based on the set of selected country/regional studies as described in the previous section. The potential from the individual measures reported in the studies were summarised into three cost categories: below 0 US$/tCO2 (net negative costs), 0-20 US$/tCO2, and 20-100 US$/tCO2. Analogously with the baseline construction, a CO2 potential as a percentage of the baseline in the respective cost categories were calculated using the method of a population weighted average potential in the subregions for each cost category, and for each of the seven world regions. The absolute value of the potentials in seven world regions were calculated based on the CO2 emission baseline projections and the potential estimates as baseline shares. The potential figures then were aggregated into three country groups: developed countries, economies in transition, and developing countries and divided by the respective baselines to derive the relative potential of country group. The potential was split into the fuel- and electricity-associated emissions applying the average structure of CO2 mitigation potential in each cost category in each country group based on those studies which allow such reporting. Since there was a limited number of studies looking at 2030, the potential estimates in this year were derived by extrapolating the 2020 figures to 2030. For this, a modified exponential function8 was used which allows regulating the maximum potential considered theoretically achievable for different regions.
Based on the methodology described above, it was found that globally approximately 37% of the sectoral baseline emissions can be avoided cost-effectively in 2030 through mitigation measures. Additionally, at least 4% of baseline emissions can be avoided at costs of up to 20 US$/tCO2, and 5% more if costs up to 100 US$/tCO2 are considered. These estimates represent a reduction of app. 4.9, 5.4, and 6.0 billion tons of CO2eq. in 2020, at zero, 20 US$/tCO2, and 100 US$/tCO2, respectively, assuming the baseline developed on the basis of the reviewed studies. Due to the numerous opportunities at low costs, the high-cost potential has been assessed to a limited extent, and therefore the high cost potential is underestimated. It should be noted, that due to the limited number of demand-side end-use efficiency options considered by the studies, the omission of non-technological options, the often significant co-benefits, as well as the exclusion of advanced integrated highly efficient buildings, the real potential is likely to be higher. The results of the calculations by region, by fuel/electricity source, and by cost category are presented in Table 6 and Figure 4.
8 X t( )=XSaturation−Ce−kt
(reached from the differential equation:
( Saturation ) x k X x t ∂ = − ∂ ), saturation
illustrates that the closer potential is to this upper limit, the lower potential growth rate is experienced, and the potential does not exceed the maximum judged reasonable. C can be found from the starting conditions (in year 2000); thus if we know the potential in 2020, then:
2020 2030 30 X (1 (1 )) 20 Saturation Saturation X X EXP LN X = − −
Table 6 Potential for CO2 emission reductions in buildings globally and by country group in 2030
Mitigation potentials split into sources in cost categories in 2030, million tons CO2
Region Type of energy savings Baseline emissions in 2030, million tons CO2 <0 0-20 20-100 <100 Total 13.2 4.9 0.50 0.60 6.0 Electricity 8.2 3.2 0.50 0.05 3.3 Global Fuel 5.0 1.8 0.45 0.55 2.8 Total 5.1 1.4 0.15 0.15 1.7 Electricity 3.2 0.70 0.00 0.00 0.70 OECD (-EiT) Fuel 1.9 0.70 0.15 0.15 1.0 Total 1.6 0.55 0.20 0.40 1.2 Electricity 0.40 0.30 0.00 0.00 0.30 EiT Fuel 1.1 0.25 0.20 0.40 0.90 Total 6.6 3.0 0.50 0.05 3.2 Electricity 4.6 2.2 0.50 0.05 2.3 Non-OECD Fuel 2.0 0.80 0.10 0.00 0.90 37% 38% 35% 27% 21% 37% 36% 73% 23% 45% 47% 41% 9% 7% 14% 19% 5% 11% 7% 27% 37% 4% 3% 1% 2% 1% 0% 0% 5% 3% 1% 1% 1% 1% 0% 0% 0% 20% 40% 60% 80% 100% Total Electricity Fuel Total Electricity Fuel Total Electricity Fuel Total Electricity Fuel Baseline share <0 0-20 20-100 OECD-(EiT) EiT Non-OECD World
Cost categories, US$/tCO2
Figure 4 Potential for CO2 mitigation in buildings related to electric and fuel end-uses split into cost
categories, 2030 (presented as shares of respective fuel- and electricity associated baseline CO2 emissions)
5 Industry
5.1 Baseline
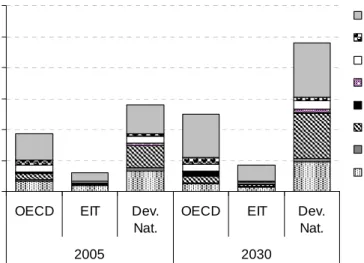
Similarly to the transport and the energy sectors, the WEO2004 reference scenario provided the energy use and CO2 emissions baseline in the industry sector. Energy use was then broken down into six energy intensive subsectors: iron and steel, aluminum, cement, paper, ammonia, ethylene. The petroleum product refining industry was added to the six energy intensive industries, giving that this sub-sector is not included in the industry sector but in the energy supply sector in the WEO2004 data. For each subsectors in each region, carbon intensities in terms of carbon emitted per ton of industrial production was estimated through a literature review. Then, commodities production in the energy intensive industries were projected based on ratio of per capita level an economic development (Price et al, 2006, Groenenberg, 2005). The other industrial energy use is treated as a remainder, representing light energy intensive industries. -2,000 4,000 6,000 8,000 10,000 12,000
OECD EIT Dev.
Nat.
OECD EIT Dev.
Nat. 2005 2030 B a sel ine em is s ions ( M tC O 2) Others
Pulp and Paper Petroleum Products Ammonia Ethylene Cement Primary Aluminium Steel
Figure 5: Baseline emissions of the Industry sector in 2005 and 2030
The baseline of the industry sector per energy intensive sub sectors is given in
Figure 5
. The iron and steel industry represents the largest source of CO2 emissions with 22% in 2005, followed by the cement industry representing 18% and the petroleum product refining industry, representing 9%. Total projection of the industry sector is based on the WEO2004 reference scenario data, to which CO2 emissions from the refining sector was added as well CO2 emission from industrial processes (CO2 from cement clinker). Emissions from non CO2 gasses (N2O, CH4 en F-gas) are added from the AR4 estimates. Projections of industrial energy intensive sub-sectors are based on commodities production growth to 2030 (Price et al, 2006). The energy intensive industry baseline scenario based on expert judgements from literature search and in case where no information was available, it is calculated assuming an autonomous efficiency improvement of 0.05% per year. In 2030, the energy intensive industries represent slightly less than in 2005, 55% in 2030 instead of 61% in 2005.A few updates were performed since the publication of IPCC fourth assessment report. First, a new baseline was calculated with data from the WEO2004, instead of A1 and B2 scenarios used in the IPCC AR4 report. Additionally, new data were collected to estimate the energy use for each subsector and each region broken down by fuel type and to separate fuel use from electricity use. Figure 6 shows the 2030 CO2 emission projection baseline broken down by source of emissions. Fuel use represents the largest source, especially in energy intensive industries, while CO2 emissions from electricity used represent the second largest source with
Page 26 of 40 WAB 500102 018
light energy intensive industries representing by far the largest share (70%). Finally CO2 emissions from cement represent a considerable source of CO2 emissions with 11% of total industry CO2 emissions in 2030. -1,000 2,000 3,000 4,000 5,000 6,000 7,000 8,000 9,000 CO2 from Fuel CO2 from Elec CO2 form Process (cement) Non CO2 B a s e line em is s ion s ( M tC O 2) Total Others
Pulp and Paper Petroleum Products Ammonia Ethylene Cement Primary Aluminium Steel
Figure 6: Baseline emissions of the Industry sector in 2030 broken down by CO2 source.
5.2 Reduction measures
Global energy-related industrial emissions have grown by 65% since 1971 (Price et al, 2006). Industry has continuously improved its energy efficiency over the past decades. Energy efficiency is still potentially the most important and cost-effective factor to mitigate greenhouse gas emissions in industry over the next decades.
Source of reduction measures are multiple in the industry sector. They range from sector wide technology improvements, such as the use of more efficient motor systems, to sub-sector specific technology improvements, such as the use of basic oxygen furnace instead of the older technology of open heart furnace in the iron and steel industrial sub-sector. Other measures include the substitution of feedstock, such as the use of blended cement in which clinker is replaced by alternative cementitous materials, thus lowering process emissions; the substitution of fuel, for example the use biomass in the pulp and paper industry; the capture of carbon and its sequestration (CCS) which is more easily applicable in some industry such as ammonia production where CO2 emissions is a by-product. Table 7 summarizes the reduction potential included in the bottom up scenario and is based on the work described in the IPCC Chapter on industry (IPCC, 2007) and further described by Worrell et al. (forthcoming).
Table 7. Mitigation Percentage Estimates for the Energy Intensive Industries
Steel Primary
Aluminium Cement Ethylene Ammonia
Petroleum Refining Pulp and Paper Global 15–40% 15–25% 11–40% 20% 25% 10–20% 5–40% OECD 15–40% 15–25% 11–40% 20% 25% 10–20% 5–40% EIT 25–40% 15–25% 11–40% 20% 25% 10–20% 5–40% Dev. Nat. 25–40% 15–25% 11–40% 20% 25% 10–20% 5–40% Source: IPCC, 2007
Table 8. Mitigation Percentage Estimates from CCS and for Other Industries
Carbon, Capture and Storage Ammonia Petroleum
Refining Cement Steel
Other Industries Elec. conservation Global 100% 50% 6% 20% 17% OECD 100% 50% 50% 20% 19% EIT 100% 50% 50% 20% 23% Dev. Nat. 100% 50% 50% 20% 20%
Source: IPCC, 2007, calculation updates.
5.3 Costs of Emission Reduction
Costs estimates of individual technical abatement options and comprehensive abatement strategies are reported through cost curve in the literature for some of the most energy intensive industries sub-sectors (Worrell et al, 2000, 2001) .Cost curve report reduction measure cost per reduction measure in $ per energy unit saved which is converted to $ per CO2 avoided for each of the measures. However, this type of detailed analysis is not available for all sectors, and often is only available for a specific county. Other analysis distinguish between theoretical, technical and economical potential where theoretical potential represents achievable energy savings under theoretical considerations of thermodynamics; the technical potential represents achievable energy savings that result from implementing emerging technology, regardless of cost considerations; and economic potential that include efficiency improvement that can be expected under the current market consideration. This type of analysis was also used along with expert judgements to assess at which carbon price the reduction measure is cost effective. The values are the same as presented in IPCC AR4 (IPCC, 2007)
5.4 Aggregated mitigation potential
The total mitigation is summarised in Table 9. It can be seen that the reduction potential for fuel, electricity savings and CCS and process emissions are all in the same order of magnitude. The largest share of the all reductions are at costs between 20 – 50 US$/tCO2.
Table 9: The total mitigation potential for the different energy carriers for the industry sector
Low High Baseline < 0 0-20 20-50 50-100 < 0 0-20 20-50 50-100 OECD-EIT 2,114 0 29 23 100 0 91 53 137 EIT 857 0 18 22 70 0 28 34 77 non OECD 3,903 0 77 102 413 0 117 150 433 Electricity Global 6,874 0 125 147 583 0 236 237 647 OECD-EIT 2,614 0 91 78 0 0 142 225 0 EIT 785 0 14 30 0 0 18 91 0 non OECD 4,256 0 101 289 0 0 137 924 0 Fuel (heat) Global 7,655 0 206 398 0 0 298 1,240 0 OECD-EIT 235 0 0 95 27 0 0 204 27 EIT 79 0 0 39 10 0 0 80 10 non OECD 1,406 0 0 301 174 0 0 818 174 Other (CCS, Process) Global 1,721 0 0 434 210 0 0 1,102 210 OECD-EIT 123 24 8 0 123 24 8 0 EIT 53 25 2 1 0 25 2 1 0 non OECD 310 93 81 12 0 93 81 12 0 Non CO2 Global 668 242 107 21 0 242 107 21 0
Page 28 of 40 WAB 500102 018 Low High Baseline < 0 0-20 20-50 50-100 < 0 0-20 20-50 50-100 OECD-EIT 5,268 123 144 204 127 123 258 490 164 EIT 1,774 25 35 92 79 25 48 206 86 non OECD 9,876 93 259 704 587 93 335 1,903 607 TOTAL Global 16,918 242 438 999 793 242 640 2,599 857
6 Energy
supply
6.1 Baseline
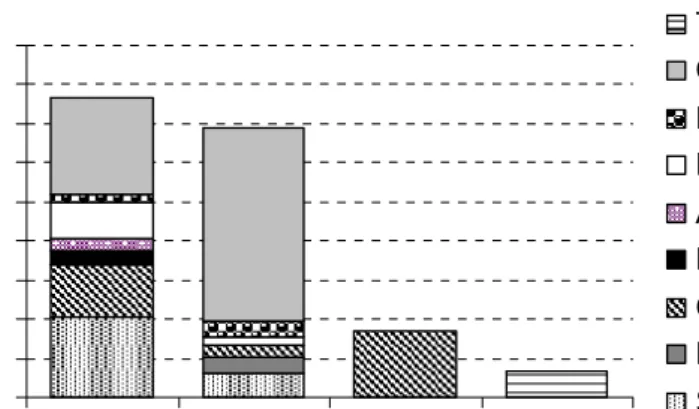
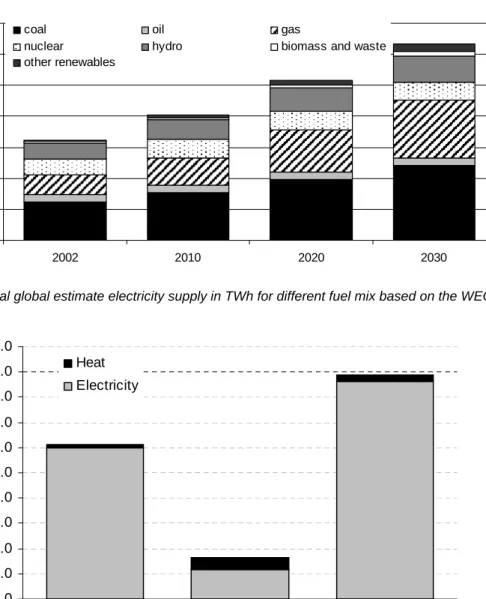
For the energy supply sector, the baseline was also taken from the WEO2004. For inclusion in this analysis, the baseline should report the fuel mix at a regional scale for primary fuel use for electricity and heat separated. As reported in the AR4 (IPCC, 2007), the WEO2004 report provides statistics on primary energy supply for electricity and heat combined and final energy use for electricity only not separated for different fuels. The implicit supplies required for heat have been estimated and removed as described in the AR4. The primary energy consumption for electricity supply only has been calculated, based on the efficiencies of combined heat and power and a correction for the share of heat in total final energy consumption. The share of heat was calculated from the IEA Balances for the year 2002 (IEA, 2004b) and assumed to remain constant over time. The total final estimated electricity supply over time is presented in Figure 7. The total GHG emissions from centralised electricity and heat supply are given in Figure 8.
0 5000 10000 15000 20000 25000 30000 35000 2002 2010 2020 2030 E s ti m a ted f inal el ec tr ic it y s upp ly ( T W h /y )
coal oil gas
nuclear hydro biomass and waste other renewables
Figure 7: Total global estimate electricity supply in TWh for different fuel mix based on the WEO2004
0.0 1.0 2.0 3.0 4.0 5.0 6.0 7.0 8.0 9.0 10.0
OECD EIT non OECD
GH G e m is s ion s en er gy s upp ly s e c to r (G tC O 2 e) Heat Electricity
Page 30 of 40 WAB 500102 018
6.2 Reduction Measures
The reduction measures included are fuel switch options to low carbon technologies: wind, other renewables, biomass and nuclear. It is assumed that these can be implemented for newly required capacity from 2010 onwards. To estimate the newly required capacity, the revised baseline, i.e. the WEO2004 corrected for energy savings (see Section 7) has been used. The required new capacity to 2030 was calculated from 1) additional capacity between 2010 and 2030 to meet new demand and 2) capacity replaced in the period 2010 – 2030 after retirement. For the retirement an average plant lifetime of 50 years and an equally distributed stock was assumed.
For the highest range of savings it is assumed that the total new capacity is replaced by either biomass, wind other renewable or nuclear. It was checked with the technical potential of each of the resources whether the technical potential is sufficient to supply a combination of technologies. For the lowest range of the potential, the maximum shares of the ETP2006 (IEA, 2006) report were used. In the AR4 report, this was used as the highest range of the reduction potential. Here we decided to use this as the lowest range as the focus is on what technically possible is at different cost levels (the economic potential) and not of the implementation potential.
6.3 Costs of Emission Reduction
The highest share of the reduction potential is assumed to be the replacement of the total additional capacity by carbon free technologies. The contribution of each of the technologies to this potential is not further quantified. Therefore, the costs are also difficult to quantify. In the AR4, the costs are taken based on the distribution from the ETP report. We decided to use the same cost distribution for both the lowest and the highest range as reported in the AR4. This assumes that the model applied in the ETP report results in the least cost division of technologies.
7
Correction for Double Counting
The mitigation potentials from the sectors above cannot simply be added up to get the overall total as explained in Chapter 2. Adding up would results in double counting of reductions. Before estimating the GHG mitigation levels from the energy supply sector, the energy savings from the industry and the residential and service sectors have been extracted from the energy supply baseline. The energy savings from these end use sectors were taken as relative GHG emission reductions for the electricity production only, see Table 10.
Table 10: The main assumptions for the correction of the baseline for electricity savings
OECD EIT Non OECD
Share of industry sector in total electricity supply 35 52 42
Share of residential and service sector in total electricity supply 65 48 58
Electricity savings in the industrial sector 12 15 17
Electricity savings in the residential sector 16 30 29
The relative energy savings have been applied to the baseline using the share of the electricity consumption of the sectors in the total electricity consumption (see Table 10). In this step, it was furthermore assumed that the savings were equally distributed over the different power sources, including low-carbon sources. In fact, it can be expected that electricity savings would reduce relatively more fossil fuel electricity generation compared to generation with low marginal cost such as renewables and nuclear. This is because in the usual operation of electricity systems, low cost fuels are dispatched before high cost fuels. But the system operation depends on local conditions and it is not appropriate to consider these here. This implies that the emission reductions for electricity savings reported here are underestimated. With higher carbon prices, and higher marginal costs of fossil fuels, this underestimation increases.
Finally, the amount of primary fuels needed for power generation has been updated, resulting in lower emissions. This updated baseline is used for the mitigation potential estimates originating from the energy supply sector.
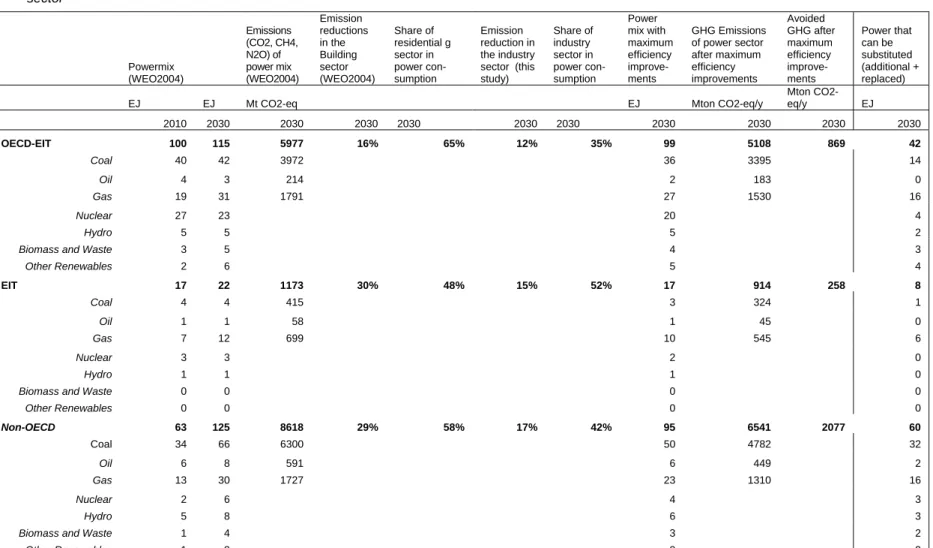
Page 32 of 40 WAB 500102 018
Table 11: The Baseline of the energy supply sector from the World Energy Outlook and corrected for the energy savings from residential and industry sector Powermix (WEO2004) Emissions (CO2, CH4, N2O) of power mix (WEO2004) Emission reductions in the Building sector (WEO2004) Share of residential g sector in power con-sumption Emission reduction in the industry sector (this study) Share of industry sector in power con-sumption Power mix with maximum efficiency improve-ments GHG Emissions of power sector after maximum efficiency improvements Avoided GHG after maximum efficiency improve-ments Power that can be substituted (additional + replaced)
EJ EJ Mt CO2-eq EJ Mton CO2-eq/y
Mton CO2-eq/y EJ 2010 2030 2030 2030 2030 2030 2030 2030 2030 2030 2030 OECD-EIT 100 115 5977 16% 65% 12% 35% 99 5108 869 42 Coal 40 42 3972 36 3395 14 Oil 4 3 214 2 183 0 Gas 19 31 1791 27 1530 16 Nuclear 27 23 20 4 Hydro 5 5 5 2
Biomass and Waste 3 5 4 3
Other Renewables 2 6 5 4 EIT 17 22 1173 30% 48% 15% 52% 17 914 258 8 Coal 4 4 415 3 324 1 Oil 1 1 58 1 45 0 Gas 7 12 699 10 545 6 Nuclear 3 3 2 0 Hydro 1 1 1 0
Biomass and Waste 0 0 0 0
Other Renewables 0 0 0 0 Non-OECD 63 125 8618 29% 58% 17% 42% 95 6541 2077 60 Coal 34 66 6300 50 4782 32 Oil 6 8 591 6 449 2 Gas 13 30 1727 23 1310 16 Nuclear 2 6 4 3 Hydro 5 8 6 3
Biomass and Waste 1 4 3 2
8
Main Findings Overall Mitigation Potential
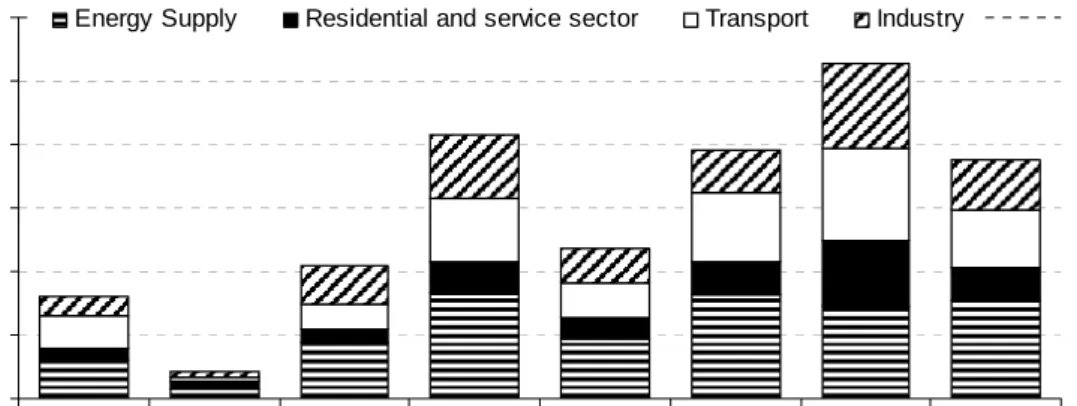
This chapter presents the main findings of the mitigation potential per sector and region. The aggregated baseline for the emissions years 2000 and 2030 is presented in Figure 9. In this figure the baseline is compared to the total WEO2004 and the IPCC SRES marker scenarios for the year 2030 (Price et al., 2006). Please note that for WEO2004 and SRES baselines only CO2 emissions are included. The growth of the GHG emissions of the aggregated baseline from 2000 to 2030 is 75%. The difference between the A1 baseline and the other baselines is because of differences in the industry and the residential and service sectors.
0 10 20 30 40 50 60
OECD EIT Non-OECD Total this study Total this study in 2000 WEO2004 A1 B2 B a s e line e m is s ions i n 2030 ( G t C O 2
eq) Energy Supply Residential and service sector Transport Industry
Figure 9: The aggregated sectoral baseline emissions in comparison with the WEO2004, and the marker SRES A1 and B2 scenarios for the year 2000 and 2030. Please note that for WEO2004 and SRES baselines only CO2 emissions are included. The allocation to point of emission is done by allocating all emissions from electricity to the energy supply sector. Source: this study and Price et al. (2006)
In Figure 10 the main results per sector and cost levels are presented. It can be seen that the energy supply sector has the largest potential and the residential and service sector has the highest cost effective potential. The total aggregated potential ranges from 10 to 16 GtCO2e at costs below 100 US$/tCO2.
0 1 2 3 4 5 6 7 8
Low High Low High Low High Low High Energy supply Transport Industry Residential and
service Mi tig a tion pot en tial at di ff e rent c o s t l e v e ls in 2 030 pe r s e c tor ( M to n C O2e ) <0 0-20 20-50 50-100
Page 34 of 40 WAB 500102 018
The data presented in Figure 10 are based on the end use sector allocation. When allocating everything to the sectors where the emissions occur (point of emission allocation) the results are different per sector as can be seen in Figure 11. This type of allocation is used by top-down approaches. In Figure 11 the results for both allocation approaches are compared with the data from the IPCC AR4. When comparing these figures with the numbers represented in the IPCC AR4, it can be seen that the data have not been altered significantly. For the industry sector the data of this study are higher because the ranges have been revised based on new available data. 0 2 4 6 8 10 12
Low High Low High Low High Low High
IPCC This study IPCC This study
Point of emission Point of end use
G H G em is s ion s a v ings B U appr oac h ( G ton C O2 e)
Energy supply Transport Residential and Services Industry
Figure 11: Main results per sector and aggregated and compared with the AR4 figures
In previous figures the results are presented in absolute terms. In absolute terms the energy supply sector is by far the sector with the largest potential. When comparing the reductions with the baseline, the residential and service sector has the largest reduction potential as can be seen in Figure 12. This figure also shows the regional differentiation. For most sectors the relative reduction is in the same range. The energy supply sector has the highest relative potential. In the residential and service sector in the EIT region the largest reduction can be found. 0.00 0.10 0.20 0.30 0.40 0.50 0.60 0.70 OE C D EI T N on-OE C D OE C D EI T N on-OE C D OE C D EI T N on-OE C D OE C D EI T N on-OE C D
Energy supply Transport Industry Residential and service M it igat ion p o tent ia l c o m p a red t o t he bas el ine at regi ona l l e v e l Low High
In the AR4 the mitigation potential of the other economic sectors as agriculture, forestry and waste is also estimated. When adding these reductions to the values of the energy related sectors included in this report shows that:
• The largest overall reductions are estimated for the energy related sectors
• The most cost effective potentials are estimated for the energy related sectors.
• The ranges of the agriculture and forestry sector is larger than the energy related sectors.
• The total reduction ranges from 15 – 28 GtCO2..
0 5 10 15 20 25 30 <0 <100 <0 <100 Low High M it igat ion pot ent ia l i n 2030 ( G tC O2e )
Energy sectors Argiculture Forestry Waste
9
Discussion and Conclusions
9.1 Discussion
The bottom-up approach did not use a consistent modelling approach but rather focused on many literature sources. This had as advantage that it covers the most important and recent literature, it is transparent and can be validated and easily adjusted if needed. However, the approach used also resulted in some additional uncertainties in the results described below.
Different baseline was used and the baseline was difficult to simulate.
There is no baseline scenario available in the literature that captures all sectors in a disaggregated way so it can be used for bottom up analyses. The World Energy Outlook scenario was used as a basis. For each sector, this baseline was disaggregated to activity indicator levels and the sub sectors needed for the bottom-up assessment, e.g. production units, passenger kilometres etc. For the residential and service sector this was not possible and a different approach and even baseline was needed. Each sector disaggregating the baseline with exogenous information results in slightly different interpretations per sector. This results in small differences among sectors at a value that cannot be estimated. However it is not expected to be significant.
Cost and regional data are limited, especially for non-OECD region.
For all sectors the data on the reduction potential and especially the regional specific data and related costs are limited. For the transport sector the cost distribution was based on individual measures for the EU and the US situation applied to all regions. The figures from the industrial and energy supply sector are also based on reductions and related costs for the OECD region. The residential and service sector has the best regional representation as it is based on different studies on countries level, aggregated to regions.
Different approaches have been used to analyse the potential
The main difference in approach is for the residential and service sector. The other sectors estimate the potential based on the activity indicator levels in the baseline and relative reductions compared to these activity levels. The residential sector estimates the reductions based on country studies aggregated to a regional scale. Most representative countries per region are assumed. Most of the country studies estimate reductions for the year 2020. The potential estimates were extrapolated to the year 2030 according to the reverse exponential formula as described in Section 4.3, but this approach has advantages and disadvantages. On one side, it takes into account the technological progress, on another hand it might it may capture a part of the baseline. Due to this reason, the 2020-year potential estimates for the buildings sector are more reliable to use.
No non technical barriers included.
As also described in IPCC (2007), efficiency penetration and supply options is hindered by the number of barriers, which has probably the strongest effect in the residential and service sector as compared to the other sectors. The potential estimates did not take in account the impact of these barriers as well as they did not take into account the phenomenon of the rebound effect which is sometimes considered by the top-down studies. This results in estimates at cost effective levels which is not the case for top down approaches that do include these barriers and feedbacks in their analyses.
In addition, there are still some reductions not included that should be included in a potential follow up. The potentially largest reductions not included are:
• reductions in the non-CO2 emissions in the residential and service sector as well as the energy supply sector
Page 38 of 40 WAB 500102 018
9.2 Conclusions
Based on the considerations outlined above and the findings described in Section 8, it can be concluded that:
The mitigation potential for the energy related sectors range from 11 to 16 GtCO2. Relative to the baseline in 2030, this is 25 – 40%. At negative costs, the largest share can be found in the residential and service sector. The total potential at negative costs is estimated at 5 – 8% relative to the baseline. The transport sector has the lowest reduction potential. After that the industry sector has the lowest reduction potential. The largest reductions are estimated for the energy supply sector. Including the other sectors shows that the mitigation potential is the largest for the sectors included in this report. The land use sectors have significant potential but also larger ranges due to uncertainties in the estimates.