Toxaphene exposure in the Netherlands | RIVM
44
0
0
Hele tekst
(2) page 2 of 44. RIVM report 604502 003. Abstract The present report describes the exposure of the Dutch population to toxaphene based on a literature survey and the EUSES modelling program. The literature survey shows that toxaphene is distributed widely over the world. It suggests that human toxaphene exposure predominantly occurs by intake of fish. The mean total daily dietary toxaphene intake in the Netherlands is estimated to be 1 – 2 ng/kg bodyweight. The finding that intake occurs via fish is checked using the EUSES program that models emission, distribution and exposure to organic chemicals. The EUSES outcome confirms the selective exposure via fish..
(3) RIVM report 604502 003. Contents Samenvatting 4 Summary 5 1.. Introduction 7. 2.. Literature review 9 2.1 Toxaphene - composition and physical-chemical properties 9 2.1.1 2.1.2 2.1.3 2.1.4 2.1.5. Chemical composition 9 Physical-chemical properties 10 Emission 12 Distribution 13 Concentrations in air, water and biota 14. 2.2 Concentrations in food 17 3.. Dietary intake 21. 4.. Source-to-effect chain: EUSES 1.0 25 4.1 EUSES 1.0 25 4.2 EUSES and toxaphene 26 4.3 Input parameters 28 4.4 Exposure patterns 30. 5.. Discussion 33. 6.. Conclusions 37. References 38 Appendix 1 Mailing list 41 Appendix 2 Scientific, English and Dutch common names of fish species 42 Appendix 3 Calculation of the dietary toxaphene intake 43. page 3 of 44.
(4) page 4 of 44. RIVM report 604502 003. Samenvatting Het onderhavige rapport beschrijft de blootstelling van de Nederlandse bevolking aan toxafeen, gebaseerd op gegevens uit een literatuurstudie en een voorspelling van het modeleringsprogramma EUSES. Toxafeen is feitelijk een uiterst complex mengsel van gechlorineerde bornanes, bornenes and bornadienes. De literatuurstudie geeft aan dat toxafeen over de hele wereld verspreid is. De emissie vertoond een piek rond 1975, maar een vergelijking tussen de huidige niveaus en de niveaus in 1970-1980 laten geen afname van de concentratie toxafeen in lucht zien. Een overzicht van potentiële blootstellingsroutes laat zien dat de consumptie van vis voor het merendeel van de blootstelling lijkt te zorgen. De gemiddelde dagelijkse inname via de voeding wordt geschat op 1-2 ng/kg lichaamsgewicht, op basis van gegevens in de literatuur. Voor mensen die regelmatig vis eten ligt de schatting zeven maal hoger. De bevinding dat de consumptie van vis de voornaamste blootstelling vormt is gecontroleerd met EUSES, een programma dat emissie, verspreiding en blootstelling aan organische verbindingen modelleert. Voor deze exercitie werden twee soorten toxafenen onderscheiden: lipofiele, vluchtige toxafenen en wateroplosbase, niet zo vluchtige toxafenen. De uitkomsten van EUSES ondersteunen de literatuur: verreweg de meeste toxafeen komt via visconsumptie in het lichaam. Dit geldt voor beide typen toxafenen. De voorspelling van EUSES voor concentraties toxafeen in voedsel, water en lucht komen goed overeen met in de literatuur opgegeven waarden..
(5) RIVM report 604502 003. page 5 of 44. Summary The present report describes the exposure of the Dutch population to toxaphene based on a literature survey and the EUSES modelling program. Toxaphene is actually a highly complex mixture of mostly chlorinated bornanes, bornenes and bornadienes. The literature survey shows that toxaphene is distributed widely over the world. The emission peaks around 1975, but comparisons of recent levels with baseline levels from the 1970s and 1980s show no significant decline in ambient air. An overview of possible exposure routes shows that most of human toxaphene exposure is attributed to intake of fish. The mean total daily dietary toxaphene intake in the Netherlands is estimated to be 1 – 2 ng/kg bodyweight, based on literature data. For consistent fish consumers this intake is seven time’s larger. The finding that intake occurs via fish is checked using the EUSES program that models emission, distribution and exposure to organic chemicals. Two types of toxaphenes were defined for the modeling exercise: one lipophilic, volatile group and one water soluble, less volatile group. The EUSES outcome confirms the selective exposure via fish for both types of toxaphenes. Concentrations in intake media calculated by EUSES compare reasonably well to values reported in the literature..
(6) page 6 of 44. RIVM report 604502 003.
(7) RIVM report 604502 003. 1.. page 7 of 44. Introduction. Toxaphene (also known as camphechlor, chlorocamphene, polychlorocamphene and chlorinated camphene) is a pesticide with a multitude of applications. After the usage of DDT was forbidden in the early 1970s, toxaphene was its major replacement as an agricultural insecticide. During the years between 1972 and 1984, it has been the worlds most commonly used pesticide with different applications. Its primary use was on cotton in the southern and southeastern states of the US, but it has also been used on soybeans, peanuts and as a piscicide (Saleh, 1991; Nordic council of Ministers, 1997; de Geus et al., 1999). Toxaphene is a very stable and lipophilic substance. During the eighties the first signals of toxaphene as a global pollutant came from Canada and Scandinavia. In these regions, located thousands of kilometres from the main application sites, toxaphene could be detected in the tissues of many species especially in lipid rich polar fish and mammals (Gregor, 1993). In addition to this, it became known that toxaphene was acutely and chronically toxic to aquatic life and posed a carcinogenic risk to humans (Saleh, 1991). Due to its toxicity, persistence and widespread distribution on a global scale, also far from its application sites, its production was banned in many western countries in the beginning of the eighties. It is now realized that toxaphene represents a global threat similar to DDT, PCBs and other organochlorines. It is still applied, however, in many East-European, South American and African countries (Saleh, 1991; Nordic Council of Ministers, 1997). In the Netherlands, toxaphene has already been forbidden in the late sixties. In Europe, toxaphene has not been used on a scale like in the US, except in countries like Eastern Germany and the former USSR (Voldner & Li, 1993). In the early nineties residues of toxaphene were detected in North Sea fish destined for the Dutch market (De Boer & Wester, 1991). This finding resulted in an extensive discussion about toxaphene by representatives from the responsible Dutch ministries and scientists. In 1993, a first risk-evaluation was performed by the RIVM, focussing on the toxicology of the toxaphene mixture. It was concluded that long-term exposure to toxaphene is undesirable because of its persistent and accumulative nature. With use of the lowest known NOAEL a safe value for short-term exposure was determined. Under the assumption that fish is the only source of exposure, the estimated intake of the Dutch population was far below this NOAEL. However, still little clarity existed on routes and amount of exposure of the general population. Therefore, in 1996 in the Dutch Lower Chamber questions were asked about the risks of the presence of toxaphene in Dutch fish to the Minister of Agriculture, Nature Management and Fisheries. All of these actions made clear that much disperse information about the sources, distribution, analysis and the toxicology of toxaphene is available. However, no coherent picture existed of.
(8) page 8 of 44. RIVM report 604502 003. the exposure profiles of humans and hardly any quantative data was available about the exposure of the Dutch population. For risk assessment purposes, it is necessary to combine toxicology data with exposure data. The present report describes the exposure of the Dutch population to toxaphene based on a literature survey and the EUSES modelling program. Objectives • contribute to a more coherent picture of available information about toxaphene, with a focus on the exposure of the Dutch population • quantify the exposure of the Dutch population to toxaphene These objectives resulted in some more specific research questions: • What is the main route of exposure and what is its relative importance? • What is the range in exposure within the Dutch population? • What are specific groups at risk? • What is the relation of intake in the Dutch population to existing health based exposure limits (like a TDI) when available?.
(9) RIVM report 604502 003. 2.. page 9 of 44. Literature review. Extensive literature reviews of toxaphene have been published the last few years. In 1996 the United States ATSDR has published a toxicological profile on toxaphene (ATSDR, 1996). In 1997 the Nordic Council of Ministers published results of a project named Risk Assessment of Toxaphene, based on existing literature on toxaphene toxicology and residues in foods. Recently an overview of recent developments in knowledge about environmental occurence, analysis and toxicology of toxaphene compounds was published by de Geus et al. (1999). In the present report, these three reviews have been used as a basis for the literature review with a focus on exposure assessment aspects. Additional information has been obtained by a literature search (Medline, Current Contents, Internet) with a focus on emission, transport and environmental concentrations.. 2.1 Toxaphene - composition and physical-chemical properties 2.1.1. Chemical composition. Toxaphene is a reaction mixture of chlorinated camphenes containing 67-69% chlorine, which does not naturally occur in the environment. Toxaphene is a complex mixture of mostly chlorinated bornanes, chlorinated bornenes and chlorinated bornadienes (figure 2.1). Theoretically, it can consist of over 32,000 different components. However, manufactured (technical) mixtures consists usually only of 20 to 120 different components, mostly Cl7 to Cl9-congeners. The approximate chemical formula of the technical mixtures are C10H10Cl8 with an average molecular mass of 413.8 (Saleh, 1991; Nordic Council of Ministers, 1997). CH3 CH3. Clx CH3 Figure 2.1 Chemical structure of toxaphene Because of environmental (metabolic) modification the number and pattern of congeners in environmental samples is substantially different from the technical mixture (De Geus et al.,.
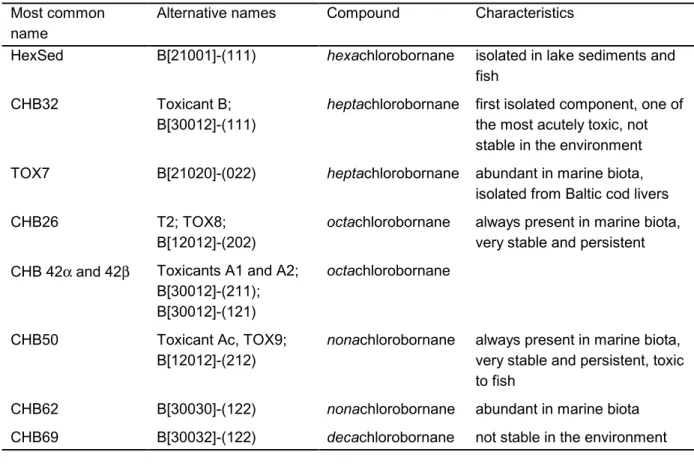
(10) page 10 of 44. RIVM report 604502 003. 1999). Some components are very persistent while others degrade rapidly by both abiotic and biotic processes (Nordic Council of Ministers, 1997). Only a relative small part (less than 700) of all the possible congeners (32,768) have been identified (Vetter, 1993). At present, only 30 individual congeners are commercially available (De Geus et al., 1999). Nomenclature of toxaphene congeners is extensively discussed in the review of the Geus et al. (1999). In table 2.1 some of the most common congeners with their characteristics are listed. Table 2.1 Isolated congeners in the environment (after Nordic Council of Ministers, 1997; De Geus, 1999) Most common name HexSed. Alternative names. Compound. Characteristics. B[21001]-(111). hexachlorobornane. isolated in lake sediments and fish. CHB32. Toxicant B; B[30012]-(111). heptachlorobornane. first isolated component, one of the most acutely toxic, not stable in the environment. TOX7. B[21020]-(022). heptachlorobornane. abundant in marine biota, isolated from Baltic cod livers. CHB26. T2; TOX8; B[12012]-(202). octachlorobornane. always present in marine biota, very stable and persistent. CHB 42α and 42β. Toxicants A1 and A2; B[30012]-(211); B[30012]-(121). octachlorobornane. CHB50. Toxicant Ac, TOX9; B[12012]-(212). nonachlorobornane. always present in marine biota, very stable and persistent, toxic to fish. CHB62. B[30030]-(122). nonachlorobornane. abundant in marine biota. CHB69. B[30032]-(122). decachlorobornane. not stable in the environment. 2.1.2. Physical-chemical properties. In its original form (technical mixture) toxaphene is a yellow to amber waxy solid that smells like turpentine. It consists of many congeners of diverse character, which display a wide range of solubility’s, vapour pressures and octanol-water coefficients. This makes it impossible to set physical-chemical properties for the mixture as a whole. Furthermore, the validity of average values will be questionable (Wania & Mackay, 1993). A complicating factor is the drastic change the technical mixture undergoes in the environment once it is released. For example, during atmospheric transport extreme weathering of the mixture takes place. Evenmore, within the food chain metabolic modification by organisms causes a significant change in composition of the mixture. The.
(11) RIVM report 604502 003. page 11 of 44. physical-chemical properties reported in the literature are mainly of the technical toxaphene mixture. Rarely, values are reported for single congeners. However, these values are very important when you want to assess mixtures, which are actually present in the environment and to which humans are exposed. Molecular weight The average molecular weight of the technical toxaphene mixture is 413.8 g/mol. This is based on the chemical formula of C10H10Cl8 (Saleh, 1991). Depending on the composition of the mixture in the environmental compartments, the mean molecular weight will differ from this value. A mixture which predominantly consists of less chlorinated congeners (Cl6 and Cl7) will have a molecular weight of about 360 g/mol and a mixture consisting of higher chlorinated congeners (Cl9) will have a molecular weight of 450 g/mol. Water solubility Water solubility as measured in different studies can vary from none (IPCS, 1993) to 0.4 mg/L (Saleh, 1991) to 3 mg/L (Saleh, 1991; ATSDR, 1996). A water solubility of 3 mg/L is stated by Saleh to be the most commonly used value. Compared to DDT which has a solubility of 0.2 µg/L at 25°C, toxaphene is relatively soluble (Saleh, 1991). Volatility Disagreement was found among sources for the value of vapour pressure (ATSDR, 1996). Values are either at the 0.2-0.4 mmHg level or on the other hand at the 10-6 or 10-7 mmHg level (Saleh, 1991; ATSDR, 1996). Recent measurements of the average vapour pressure of toxicants A and B show a value of 8.6x10⁻⁴ Pa at 25°C (≈ 7x10⁻⁶ mm Hg) (Nordic Council of Ministers, 1997). Wania & Mackay (1993) found an almost similar value for these congeners of 1.6x10⁻³ Pa (≈1x10⁻⁵ mm Hg). De Geus et al. (1999) state that the vapour pressure of toxaphene is comparable to hexachlorobenzene (HCB), i.e. 1.73x10⁻³ Pa (≈1x10⁻⁵ mm Hg). Octanol-Water Coefficient The partition coefficients (log Kow) reported for toxaphene differ from 3.3 (ATSDR, 1996) and 5.5 (Nordic Council of Ministers, 1997) to 6.44 reported by Saleh (1991). The value of Saleh is more representative for octa- and nonachlorobornanes, which predominate in the environment (Muir & De Boer, 1995). The log Kow is higher than that of p, p’-DDT, making that the bioconcentration of toxaphene is high (De Geus et al., 1999). Table 2.2 summarises the physical-chemical properties reported in the literature..
(12) page 12 of 44. RIVM report 604502 003. Table 2.2 Overview of reported physical-chemical properties of toxaphene. 2.1.3. Physical property. Range in reported values. CAS no. Formula Molecular Weight [g/mol] Melting point [°C] Boiling point [°C] Water solubility [mg/L] Vapour pressure [mmHg] Log Kow. 8001-35-2 C10H10Cl8 (approx.) 413.8 (average) 65-90 NA 0.4 – 3.0 -7 0.4 – 1x10 3.3 – 6.4. Emission. After it became apparent that toxaphene posed a global threat to the environment because of its persistence and toxicity, in the beginning of the eighties the usage of toxaphene was banned in most western countries. However, it is still used in the former Soviet Union for certain applications and probably also in Mexico. Information about toxaphene usage in African countries is lacking (Voldner & Li, 1993). Voldner & Li (1993) collected data about the toxaphene usage in more than 50 countries in the world. They estimated an interpolated usage of 1,330,000 tonnes from 1950 to 1993 and of 670,000 tonnes from 1970 to 1993. Wania & Mackay (1993) used an emission scenario based on total production estimates, the annual consumption rate in the US and profiles of toxaphene deposition in North American peat bogs for modelling the global distribution of toxaphene. Because this scenario mainly reflects toxaphene usage in the US, it may underestimate actual global emission rates. Wania & Mackay’s scenario is reflected by the following formula:. E (t ) =. 4 E max ⋅ exp((t max − t ) / A) (1 + exp((t max − t ) / A)) 2. E(t) = total emission rate in kg/h in a certain year Emax = 4000 kg/h tmax = 245280 h A = 78840 h for t < tmax A = 52560 h for t > tmax. In figure 2.2 the emission scenario of Wania & Mackay is outlined..
(13) RIVM report 604502 003. page 13 of 44. total emission rate in kg/h. 5000 4000 3000 2000 1000 0 1947. 1955. 1965. 1975. 1985. 1995. Figure 2.2 Global emission scenario of toxaphene (after Wania & Mackay, 1993). 2.1.4. Distribution. During application of toxaphene as an agricultural pesticide, releases to air and soil take place. After application, toxaphene is still released to the atmosphere by volatilisation from treated crop and soil surfaces (ATSDR, 1997). In several environmental media toxaphene has been detected (air, fresh water, seawater, soil, aquatic organisms). However, the highest concentrations have been found in marine biota like fish and sea mammals (Alder & Vieth, 1996). To date, input into the environment is still ongoing, despite the fact that most countries restricted or banned toxaphene usage. Volatilisation from previously contaminated soils and continuing usage in some countries are responsible for this input (Bidleman et al., 1995). The most important environmental medium for transport of toxaphene is the atmosphere. Toxaphene appears to be very persistent in the atmosphere (ATSDR, 1996). Comparisons of recent levels in the environment with baseline levels from the 1970s and 1980s show no significant decline in ambient air concentrations. Atmospheric toxaphene can be transported back into water and soil by dry and wet deposition (ATSDR, 1996). Consequently, toxaphene is introduced into local and regional environments far from sites where it was originally applied. The widespread and relatively uniform occurrence of CHBs in lichens, marine mammals and fish in northern areas of Canada points to atmospheric deposition as the primary source in remote regions (Bidleman et al. 1995). Many other studies have reported long-range transport of toxaphene to remote locations which are thousands kilometres from application sites (ATSDR, 1996). Recently it has been shown that the environment (air, water, biota) in northern areas are more polluted than more southern located areas. The mechanism behind this phenomena is that at lower temperatures toxaphene changes from a chemical which is largely in the gas-phase to one that is largely.
(14) page 14 of 44. RIVM report 604502 003. aerosol-adsorbed. So, at colder temperatures toxaphene in air condenses onto particles and becomes subject to wet and dry deposition. This is called the global distillation system and is suspected to be the main mechanism of atmospheric transport of toxaphene (Wania & Mackay, 1993). During long-range transport by air extreme weathering of the toxaphene mixture is occurring. The most volatile and least soluble congeners remain in the atmosphere for the longest period. So at the site of deposition the composition of the toxaphene mixture is completely different from the original technical mixture, it swifts to congeners with a lower molecular weight, a high volatility and a low solubility (Nordic Council of Ministers, 1997). As these congeners are relatively insoluble, they will adsorb to sediments, particles and aquatic organisms after deposition. In tissues of aquatic organisms toxaphene is bioconcentrated (ATSDR, 1996). Studies on pesticide residues in marine biota in the northern Atlantic, far from application sites revealed very high concentrations in several species (see 2.1.5). Bioaccumulation and the subsequent biodegradation in higher organisms will further enhance the change in composition of the toxaphene mixture (Nordic Council of Ministers, 1997). The composition of the toxaphene mixture found in tissues of animals differs quite markedly, i.e. are usually simpler as compared to the original. CHB26, 50 and 62 have found to be major congeners in marine biota and to a lesser extent CHBs 40, 41 and 44, all octa- or nonabornanes (highly chlorinated). Next to atmospheric distribution, transport by marine currents is another important factor in the worldwide distribution of toxaphene. However, this mostly concerns congeners which are relatively soluble. In conclusion, it has to be said that there is a lack of information concerning the distibution of specific congeners (Gregor, 1993). As they differ so much in nature with respect to emission, transport, transformation, uptake and accumulation (and toxicity) this lack of information is essential when making exposure assessments of toxaphene.. 2.1.5. Concentrations in air, water and biota. Air A comparison of recent toxaphene air levels measured in the US and Canada with baseline concentrations from the 1970s and early 1980s does not suggest a significant decline. This phenomenon is even more distinct in the higher latitude (arctic) areas (ATSDR, 1996). Several researchers have produced time series of ambient air concentration. In this paragraph, an overview will be given from the most recent ones. Measurements of toxaphene levels in the European air are scarce. From 1983 to 1985 concentrations have been measured in Sweden (11 samples of Stockholm and 24 samples of a rural site). The geometric mean concentration was 25 pg/m3. Examination of air trajectories suggested that some of the toxaphene present in the Swedish air originated from Eastern Europe (Bidleman, 1987)..
(15) RIVM report 604502 003. page 15 of 44. Because of the presence of toxaphene in remote areas (especially in arctic regions) far from application sites, many air measurements have been performed in these regions. Hinckley & Bidleman (1991) reports results from measurements in the Bering and Chuckchi Seas. A mean August concentration of 38 pg/m3 was measured (four samples). In the Canadian North in winter lower concentrations were measured than in summer (Barrie et al., 1993). Toxaphene concentrations ranged from less than 1.6 pg/m3 in January to 27 pg/m3 in June (the end of the measurement period). Bidleman et al. (1995) measured a somewhat lower mean August concentration in the Canadian Arctic of 6.9 pg/m3. At lower latitudes, toxaphene air levels have been measured in both Russia, Canada and the US. Hoff et al. (1993) found an annual cycle in toxaphene concentrations measured in southern Ontario (Canada), with a maximum in summer. The monthly average concentration ranged from 110 pg/m3 in July to 0.08 pg/m3 in February. This corresponds to the pattern found in the Canadian Arctic by Barrie et al. (1993). McConnell et al. (1993) measured concentrations in the Baikal Region in Russia, where agricultural activity is limited. Therefore, like in the Arctic, long-range atmospheric transport was considered the most prominent source for toxaphene input in this region. The mean concentration was 16 ± 4 pg/m3 (n=7) which is similar to concentrations measured in arctic regions. Jantunen et al. (1997) measured concentrations in both Lake Superior in the northern US as in Alabama in the southern US (in 1996). In the air at Lake Superior, August concentrations ranged from 17 to 41 pg/m3. In Alabama concentrations ranged from 120 pg/m3 in winter to 406 pg/m3 in summer. Glassmeyer et al. (1997) also measured toxaphene air concentrations at Lake Superior (1996/97) and found a monthly average ranging from 83.1 pg/m3 in September to 1.08 pg/m3 in January. Water McConnell et al. (1993) measured the surface water concentration of toxaphene in Lake Baikal in Russia (1991). The mean concentration of seven samples was 64 ± 37 pg/l. In this area, the prime source of toxaphene is wet deposition through long-range air transport. There are no direct sources of toxaphene. In arctic Canadian sea water comparable concentrations ranging from 25 to 145 pg/l, have been measured (Bidleman et al., 1995; Muir et al., 1997). In Lake Superior concentrations were a magnitude higher, ranging from 560 to 1400 pg/l (measured in 1996, Jantunen et al., 1997). Drinking water Data of toxaphene concentrations in drinking water have been monitored in the U.S. Toxaphene could be detected in only 2 of 5,279 public drinking water sources sampled from 1984 to 1992, at mean and maximumconcentrations of 0.30 and 0.50 µg/l (Storm 1994 in ATSDR, 1996)..
(16) page 16 of 44. RIVM report 604502 003. Soil As toxaphene was primary applied on agricultural crops, a substantial amount eventually ended up in the soil. It has been found that toxaphene is relatively immobile in soil (tightly bound to soil particles). However, it may eventually be released into the environment by soil erosion and sediment transport. Furthermore, years after application it could be detected in groundwater (Saleh, 1991). Soil concentrations will not be extensively discussed here, because of the underlying assumption that toxaphene has not been applied on a large scale in Western Europe. Exposure to toxaphene in this region is predominantly determined by concentrations in air and water. Biota De Geus et al. (1999) recently reported an extensive overview of the presence of toxaphene in biota. In summary, most information considering toxaphene levels in biota originates from freshwater systems and from Arctic waters in Canada and the US. In various levels of the food chain (zooplankton, amphipodes, fish) toxaphene appeared to be the most abundant pesticide. Levels were at the least equivalent, but mostly even higher than PCB and DDT levels. In mammals, like dolphins, whales and seals also high toxaphene levels have been reported. Next to waters in Canada and the US, toxaphene has been detected in biota of numerous other watersystems all over the world. In all types of fish and fish products from Europe toxaphene is present, with the highest concentrations in herring and mackerel. Even in untouched aquatic environments like lakes in the Alps and Sweden, toxaphene has been detected in fish. Because all these systems are hundreds of kilometres away from main application sites, this indicates a widespread and even global pollution with toxaphene. The presence of the same toxaphene patterns in fish from different areas in Sweden and the Baltic Sea, indicates that atmospheric transport and wet and dry deposition is the main input in these systems. In North Sea fish, from the south to the north a positive trend can be found in toxaphene levels. This might point to the fact that toxaphene is distributed by the global distillation system (see 2.1.4). When chromatograms of fish samples from researched areas in the US and Canada, were compared with that of the technical mixture, an extensive transformation could be seen. The two most abundant congeners in aquatic biota appeared to be CHB26 and CHB50 accounting for 28 - 34% of total toxaphene in arctic char, 53% in turbot and 81 to 89% in whale blubber for the Canadian arctic. Congener patterns in narwhals consisted mainly of octo- and nonabornanes. These patterns also indicated an exposure to the more volatile compounds..
(17) RIVM report 604502 003. 2.2. page 17 of 44. Concentrations in food. U.S. As part of the Pesticide Monitoring Program of the U.S. Food and Drug Administration (FDA), toxaphene in domestic and imported products is monitored on a yearly basis. The researched product groups are grains and grain products, milk/dairy products and eggs, fish and shellfish, fruits, vegetables and a category with so-called other products. In 1998 toxaphene could not be detected in any of the researched products (3597 domestic and 4969 imported) (FDA, 1999a). Additionally, the FDA determines pesticide residues in foods prepared for consumption, in so-called total diet studies. The analytical methods in these studies are more sensitive than in the regular monitoring programme. Residues present at the 1 ppb level (1 µg/kg) can be measured. A summary of residues detected in the total diet studies performed from 1991 to 1997 shows that in some specific products toxaphene could be detected more than once (FDA, 1999b). These products were peanut butter, roasted peanuts, cantaloupe (‘meloen’), collards (‘boerenkool’), cucumber, cucumber pickles and squash (‘pompoen’). In the 1998 Total Diet Study the FDA analysed a number of baby foods (83 samples). In one sample toxaphene was detected at a level of 0.013 ppm (13 µg/kg) (FDA, 1999a). Germany In Germany much research on contaminant levels in food products has been performed. The Federal Institute for Health Protection of Consumers and Veterinary Medicine (BgVV) and the Federal Research Centre for Fisheries (BFA Fi) conduct research on toxaphene levels in food products. In an extensive study on toxaphene levels in fish, three indicator toxaphene compounds CHB26, 50 and 621 were determined in more than 100 fishsamples from fish with a marketshare of more than 1% on the German fishmarket. Samples were collected from all major fishing areas important for supply to the German market (Alder et al., 1997). The highest residue levels were found in fish species with a moderate to high fat content like halibut, herring, redfish and mackerel. Fresh water and marine fish with a low fat content were less contaminated. No relationship between fishing ground and toxaphene concentrations could be found. However, contamination levels of most species appeared to be depended on age (length) of the fish. In addition to this research performed by the BgVV and BFA Fi, more research activities concerning toxaphene levels in fish have been performed the last few years in Germany. In the foundations of the proposal to the Codex Alimentarius Commission for an EMRL for toxaphene in fish by Germany, a German database of 1,128 fish samples is mentioned. This 1. The toxaphene pattern found in biota is different to that of technical toxaphene. In fish the three congeners CHB26, 50 and 62 are found to dominate with at least 25-50% (Alder et al., 199?). Instead of total toxaphene, in many studies these indicator congeners have been measured. In Germany these congeners are also used as indicator compounds to set a maximum level of toxaphene in fish, being 0.1 mg/kg wet weight for the sum of the tree compounds..
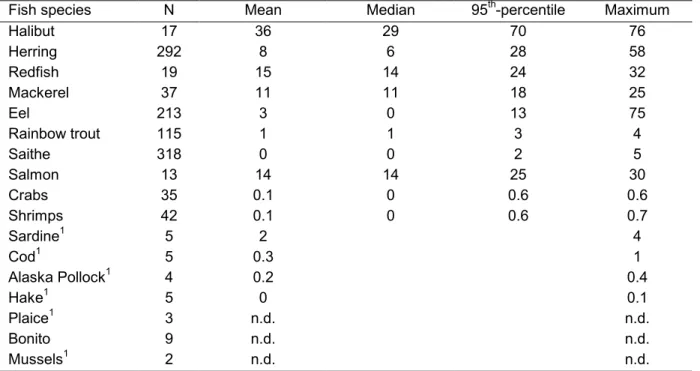
(18) page 18 of 44. RIVM report 604502 003. database comprises data of the German Monitoring Program of the German Federal Health Office, the research of the BgVV/BFA Fi, a research project of the German Fish Industry and data from the Veterinärungsamt Cuxhaven (Codex Alimentarius Commission, 1999). Table 3.3 is a representation of all available data of these researches. Food products other than fish have hardly been analysed. In the German Monitoring Program of 1995, 18 samples of Emmenthaler and Gouda cheese have been investigated. No toxaphene could be detected in these products (concentrations were below 0.1 µg/kg wet weight) (pers comm. of L. Alder to J. De Boer, 1996). Table 2.3 German database of toxaphene indicator 1 – 3 concentrations (in µg/kg wet weight) in fish species (after Codex Alimentarius Commission, 1999 and pers comm. of L. Alder to J. De Boer, 1996) Fish species N Mean Median Halibut 17 36 29 Herring 292 8 6 Redfish 19 15 14 Mackerel 37 11 11 Eel 213 3 0 Rainbow trout 115 1 1 Saithe 318 0 0 Salmon 13 14 14 Crabs 35 0.1 0 Shrimps 42 0.1 0 1 5 2 Sardine 1 5 0.3 Cod 1 4 0.2 Alaska Pollock 1 5 0 Hake 1 Plaice 3 n.d. Bonito 9 n.d. 1 2 n.d. Mussels 1 number of specimens too small to calculate distribution. th. 95 -percentile 70 28 24 18 13 3 2 25 0.6 0.6. Maximum 76 58 32 25 75 4 5 30 0.6 0.7 4 1 0.4 0.1 n.d. n.d. n.d.. The Netherlands In the Netherlands, most measurements of toxaphene in food have been performed in fish, supposedly the main source for exposure of humans. However, the State Institute for Quality Control of Agricultural Products (RIKILT-DLO) conducted a survey with respect to the presence of toxaphenes in animal fat including milk. No residues could be detected in 10 cattle meat samples, 10 pork meat samples, 10 lamb meat samples and 10 milk samples. The limit of detection for most congeners was 4 µg/kg in animal fat and 0.03 µg/kg in milk (Tuinstra, 1995). The Netherlands Institute for Fisheries Research (RIVO-DLO) is responsible for the available measurements of toxaphene concentrations in fish species available for the Dutch market. In 1989, concentrations in pooled samples of about 25 fishes of fish species caught in Dutch inland waters and adjacent marine areas have been analysed (Van der Valk & Wester, 1991)..
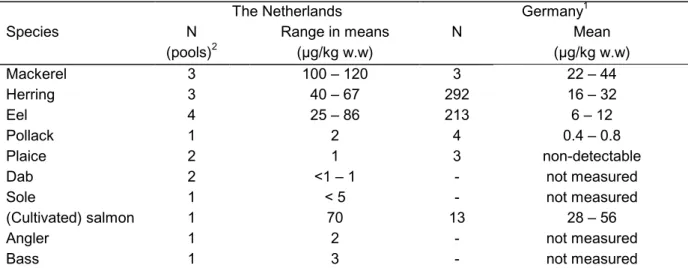
(19) RIVM report 604502 003. page 19 of 44. Next to this, pooled fish samples (consisting of 25-50 fishes caught from 1990 - 1992) from the northeastern Atlantic and North Sea have been analysed for toxaphene compounds (De Boer & Wester, 1993). Concentrations were calculated by comparing the total area of the toxaphene area in the total ion chromatograms of the samples with the total area of the toxaphene pattern in the technical mixture, a semi-quantitative determination. Consistent with the German researches, the highest toxaphene concentrations could be found in fat species like herring and mackerel. Toxaphene concentrations in lean fishspecies like dab, sole and plaice were all around the 1 µg/kg. In contrast to Alder et al. (1997) geographical variations in concentrations could be found. In fish from northern North Sea waters, higher concentrations could be detected than in fish from southern North Sea waters. The highest concentrations were detected in fish from Irelands’ and Scotland’s’ coastal waters. Table 2.4 reports the levels found in the Dutch researches in comparison to levels described in the German database. Table 2.4 Toxaphene concentrations in fish species from Dutch inland waters, North Sea and northeastern Atlantic, important for consumption in the Netherlands (adapted from Van der Valk & Wester, 1991; De Boer & Wester, 1993) in comparison to German levels. The Dutch levels are based on the determination of the total toxaphene concentration (a semiquantative method). German levels are based on the determination of three indicator congeners. Species Mackerel Herring Eel Pollack Plaice Dab Sole (Cultivated) salmon Angler Bass 1 2. N 2 (pools) 3 3 4 1 2 2 1 1 1 1. The Netherlands Range in means (µg/kg w.w) 100 – 120 40 – 67 25 – 86 2 1 <1 – 1 <5 70 2 3. 1. N 3 292 213 4 3 13 -. Germany Mean (µg/kg w.w) 22 – 44 16 – 32 6 – 12 0.4 – 0.8 non-detectable not measured not measured 28 – 56 not measured not measured. total toxaphene has been reported as a range, based on the assumption that it consists for 25 - 50% of the indicators 1 – 3 each pool consists of 25 to 50 fishes. In other countries some more small-scale researches concerning the concentration of toxaphene in food have been performed. In Denmark 18 fish samples from the monitoring programme for 1996, have been analysed for the indicator compounds 1 – 3 (Fromberg et al., 1998) (table 2.5)..
(20) page 20 of 44. RIVM report 604502 003. Table 2.5 Toxaphene concentrations measured in the Denmark monitoring program of 1996 (after Fromberg et al., 1998). Fish species. N. Herring Eel Mackerel Salmon. 10 2 2 2. Mean of Σ ind. 1 – 3 (µg/kg fat) 45 5 30 43. Mean of Σ ind. 1 – 3 1 (µg/kg wet weight) 5 1 5 9. Mean ‘total toxaphene’ 2 (µg/kg wet weight) 10 – 20 2–4 10 – 20 18 – 36. 1. based on mean fat percentage of: herring 12 g/100g; eel 26 g/100g; mackerel 18 g/100g; salmon 21 g/100g (Alder et al., 1997) 2 total toxaphene has been reported as a range, based on the assumption that it consists for 25 - 50% of the indicators 1 – 3. Fish meal and fish oil Fish meal and fish oil is used as raw material for poultry, pig, fish and shrimp feed. Poultry and pigs consume the major part of the world’s fishmeal production. For production of fish oil and fishmeal next to various fish species such as anchoveta, sardine and mackerel, also fish-processing waste is used (Oetjen & Karl, 1998). Oetjen & Karl (1998) found the levels of the indicator compounds 1-3 in fish meal originating from European countries to be low, ranging between 1.9 and 7.3 µg kg wet weight (n=8). Fishmeal produced in South America contained no detectable levels of the indicator compounds. In fish oils the toxaphene compound varied considerable from 13 to 206 µg/kg fat (n=9). In sample of pig feed no traces of toxaphene could be detected. Nine samples of trout and salmon feed, however, contained the indicator compounds with concentrations ranging from 1.0 to 9.3 µg/kg wet weight. The presence of toxaphene in farmed trout, which never has been in contact with open water, indicates a transfer from the feed to the fish. Feed can contribute to toxaphene found in farmed fish (trout, salmon)..
(21) RIVM report 604502 003. 3.. page 21 of 44. Dietary intake. The dietary intake of a chemical in a population can be considered as a function of the concentration of that chemical in food items and the food consumption pattern within the population. Concentrations of contaminants in foodproducts can be obtained via direct measurements in food products (duplicate diet studies, regular residue monitoring programs), or by indirect methods as searching existing literature or Internet for concentrations in food items. Toxaphene has not been part of regular monitoring programs in the Netherlands. The indirect method of obtaining concentrations was therefore applied in this research for calculating the dietary toxaphene intake of the Dutch population. As concentrations in products change in time, only data on concentrations not older than 10 year have been considered. Results from the review in chapter 2 show that in European countries most research on toxaphene concentrations in food items was performed on fish and fish products. Recent data on concentrations in European fish are available from German, Dutch and Danish research and monitoring programs. Other products have hardly been analyzed and when they are analyzed for toxaphene compounds (meat, milk, cheese), no toxaphene could be detected. Consequently, the calculation of the dietary intake of toxaphene in the Netherlands is based on concentrations in fish and the intake of fish products. The most recent and complete data are of German origin. These data are within range of the data of the other countries. Therefore, the German database mentioned in paragraph 2.2 has been used for the calculation of the dietary intake (table 2.3). Information on the consumption of fish and fish products in the Netherlands, is provided by The Dutch National Food Consumption Survey (VCP) (Kistemaker et al., 1998; Voedingscentrum, 1998). In the Netherlands, consumer food is coded and described (nutrients, energy content) in the Dutch Nutrient Database (NEVO). The VCP provides data on the consumption of NEVO food-items. The most recent survey has been performed in 1997/1998. The VCP contains data of 5958 persons ranging from 1 to 75 years of age (Kistemaker et al., 1998). The survey includes a description of the daily consumption over two consecutive days and a recording of age, sex and body weight for each individual. Data from this survey were used for the calculation of the dietary toxaphene intake. Toxaphene is a lipophilic substance. Therefore, daily intake of toxaphene is determined by a person’s fat consumption. Concentrations are mostly measured in fresh, unprepared products on a wet weight basis. The NEVO food-items, however, are predominantly consumable, prepared products. The processing of raw products (frying, drying, steaming) will change the fatpercentage. The fat intake via a NEVO food-item will therefore be different from the fat intake of the raw equivalent. Therefore, for fat-soluble substances like toxaphene, the dietary.
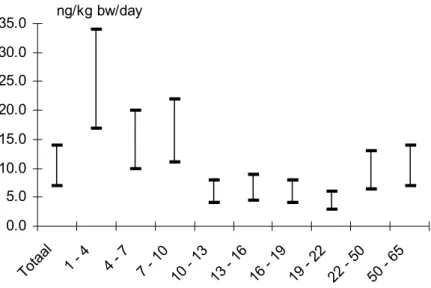
(22) page 22 of 44. RIVM report 604502 003. intake based on concentrations per unit fat is more appropriate than a calculation on a wet weight basis. Finally, the calculation of the dietary intake of toxaphene in the Dutch population consisted of five different steps (described in detail in appendix 3): • of each toxaphene containing product, concentrations per kg fat were calculated based on the fat content of that product, • based on the fat content of the corresponding NEVO food item and the mean consumption of that item of the VCP-population, the fat intake through that item was calculated, • corrections were made to combine concentrations in raw products with the intake of corresponding (prepared) NEVO food-items, • the toxaphene intake via a NEVO food-item was calculated by multiplying the corrected fat intake through that item with the known concentration per kg fat in the corresponding raw product, • to calculate the mean total daily intake within the Dutch population these intakes were summarized. The results of the calculation of the dietary toxaphene intake in the Dutch population via fish and fish products, are described in table 3.1. Both the mean intake of the total population as the mean intake of persons who actually consumed fish during the consumption survey has been reported. Table 3.1 The mean daily intake of toxaphene in the Dutch population (in ng/day) Total population. Fish consumers. 36. 222. 72 – 144. 444 – 888. 1–2. 7 – 14. Σ indicator 1 – 3 ‘total’ toxaphene. 2 3. intake per kg bodyweight. 1. 1. 16% of the population (Voedingscentrum, 1998) Σ indicator 1 – 3 is considered 25 to 50% of total toxaphene 3 based on a mean bodyweight of the VCP-population of 65 kg 2. Figures 3.1.a and b depict the mean dietary intake of toxaphene via fish and fish products per VCP-age group in men and women who actually consume fish. Both in men and women, because of their low bodyweight the highest intakes are found in the youngest age groups. The highest fish intake, however, is found in the age groups 22-50 and 50-65. Because of their higher bodyweight, the daily intake of toxaphene per kg bodyweight is not as high as in children..
(23) RIVM report 604502 003. page 23 of 44. ng/kg bw/day. 35.0 30.0 25.0 20.0 15.0 10.0 5.0. -6 5. 50. -5 0. 22. -2 2. 19. -1 9. 16. -1 6. -1 3. 13. 7. 10. -1 0. -7 4. To. 1. ta. -4. al. 0.0. Figure 3.1.a Mean dietary toxaphene intake of male fish consumers by age group (ranges depict the assumption that total toxaphene consists for 25 – 50% of the actual measured indicator congeners) ng/kg bw/day. 35.0 30.0 25.0 20.0 15.0 10.0 5.0. -6 5. 50. -5 0. 22. -2 2. 19. -1 9. 16. -1 6. 13. -1 3. 10. -1 0 7. -7 4. -4 1. To. ta. lp. op. .. 0.0. Figure 3.1.b Mean dietary toxaphene intake of female fish consumers by age group (ranges depict the assumption that total toxaphene consists for 25 – 50% of the actual measured indicator congeners).
(24) page 24 of 44. RIVM report 604502 003.
(25) RIVM report 604502 003. 4.. page 25 of 44. Source-to-effect chain: EUSES 1.0. One of the objectives of the present research is to give insight in the exposure of the Dutch population to the toxaphene mixture, in order to perform risk assessments. Considering human exposure, the present literature focusses on toxaphene transport and on the presence of toxaphene in fish. The question is, whether this is a valid approach and if there are other, alternative routes of exposure. The risk assessment tool ‘EUSES’, might provide an answer to these questions and is therefore used to give a first insight in the behavior of toxaphene in the environment after application and the possible exposure routes of humans.. 4.1. EUSES 1.0. In 1994, the first version of the Uniform System for Evaluation of Substances (USES1.0) became available for making risk assessments of new and existing substances, biocides and plant protection products. Subsequently, USES was attuned to the EU guidance documents for new and existing substances. This process has led to EUSES1.0, the European System for Evaluation of Substances. EUSES is a system, which facilitates risk assessments required for new and existing substances in the European Union (EC, 1996). The risk assessment by EUSES is carried out in a stepwise procedure. It starts with data input and estimation, after which estimation of emissions, prediction of environmental distribution, calculation of human and environmental exposure, derivation of no-effect levels and risk characterization follows (figure 4.1). INPUT INPUT. RELEASE ESTIMATION. ENVIRONMENTAL DISTRIBUTION. EFFECTS ASSESSMENT. EXPOSURE ASSESSMENT. RISK CHARACTERIZATION. Figure 4.1. Structure of the risk assessment process by EUSES.
(26) page 26 of 44. RIVM report 604502 003. The exposure assessment in EUSES covers the whole life cycle of substances as well as their fate in environmental compartments. Three spatial scales can be distinguished (figure 4.2): • the personal scale for consumers and workers, • the local scale for man and ecosystems near point sources, • the regional scale for man and ecosystems and the regional scale for man and ecosystems exposed as a result of releases in a large region. Figure 4.2 Relationship between continental, regional and local scale exposure assessments (EC, 1996) The exposure assessment aims at ‘reasonable worst case’ results by applying unfavorable, but not unrealistic standard exposure scenarios and, as much as possible, mean, median or typical parameter values. The end-point of EUSES is a quantitative comparison per substance of the results of the effects and the exposure assessment (EC, 1996).. 4.2. EUSES and toxaphene. The risk assessment model EUSES has been used to describe the source-to-effect chain of toxaphene. EUSES can provide an insight of the behavior of substances in the environment and the total human exposure. Concerning toxaphene, it is a useful tool to determine main exposure routes and their relative importance for humans. As the assessment of human exposure to toxaphene is the primary objective if this study, the effect assessment and risk characterization modules of EUSES were not considered. Evenmore, it is assumed that toxaphene has not been used on a large scale in the Netherlands (EUSES’ local scale). This implies that for toxaphene only the continental and regional scales are relevant. Therefore, the specific risk assessment process for toxaphene consisted of the following steps: 1. enter basic input parameters: • the physical-chemical properties • emission figures • release fractions to the environmental compartments (air, water, soil).
(27) RIVM report 604502 003. page 27 of 44. 2. calculation of the concentration in the environmental compartments 3. calculation of the concentration in intake media (drinking water, fish, leaf crops, root crops, meat, milk air) 4. calculation of doses in the several intake media 5. calculation of the relative contribution of the several intake media to the total daily intake The complexity of the toxaphene mixture makes it difficult to perform modeling activities. At first, the selection of physical-chemical properties for toxaphene presents several difficulties. Toxaphene components display a wide range of vapor pressures, water solubility’s and octanol-water partition coefficients. The use of a single value for each parameter describing the mixture is questionable. However, even for the mixture as a whole, existing data are incomplete or even non-existent (Wania & Mackay, 1993). Another complicating factor for modeling activities is the weathering of the mixture that takes place during long-range transport. Each exposure route has its own weathering processes (see 2.1.4). Two exposure scenarios have been used to apply EUSES on the toxaphene mixture. One set comprises the volatile, highly lipophilic ones. The other set the low volatile, water soluble ones. These two scenarios with their physical-chemical properties do not aim at actual toxaphenes, but characterize sets of toxaphenes and emphasize the main differences within toxaphenes. Relatively insoluble toxaphene components with a high volatility will be transported through air. As there are no direct sources at this moment in or nearby the Netherlands, long-range atmospheric transport followed by deposition will be an important exposure route. Relatively soluble components will be mainly transported by water. By marine water currents, they will reach the Dutch coast. To assess exposure by EUSES these two sets of components with their own physicalchemical properties have been modeled (table 4.1), using typical values for the physicalchemical properties (see 2.1.2). Table 4.1 The two exposure scenario’s typical for the Dutch situation modeled by EUSES. Scenario 1, ‘volatile’ Scenario 2, ‘water-soluble’. water solubility (µg/L). volatility (Pa). Log Kow. 0.4. 40. 6.44. 3. 1.10. -3. 3.3.
(28) page 28 of 44. 4.3. RIVM report 604502 003. Input parameters. For both scenarios, a different set of parameters serves as input for the modelling exerctions with EUSES. Physical-chemical properties In table 4.1 the physical-chemical properties, which serve as the main input in the EUSES model, have been outlined for the two exposure scenarios. Release estimation As a starting point for the release estimation in EUSES, the emission scenario of Wania & Mackay (1993) has been used (see 2.1.3). Because toxaphene is a very persistent substance in the environment and it has a great ability to accumulate in living tissues, it is considered a persistent organic pollutant. Years after its release, toxaphene is still present in the environment. Therefore, for the half-life of toxaphene a value similar to other persistant organical pollutants like for instance the dioxins, was used in the modeling exercise, i.e. 10 years (Bremmer, 1999). With use of the emission scenario of Wania & Mackay (1993) and the estimated half-life of toxaphene (10 years), the contribution of the emission in a certain year to the amount of toxaphene present in the environment nowadays (1999) can be calculated. As a starting point, 1947 has been used. This results in an estimated cumulative worldwide amount of toxaphene in 1999 of approximately 120.000 tonnes. In EUSES as input parameter, a release amount per year is required. Therefore, the cumulative amount is averaged over 52 years. This results into a release of 2300 tonnes/year. Using Wania & Mackay’s (1993) estimate for the zonal distribution of releases (12.5% is released in the Northern Temperate Zone) and the surface of Europe (roughly 1/10th of the Temperate Zone), the amount of toxaphene present in Europe can be estimated 0.1 * 300 = 30 tonnes per year. This is the value used as input in EUSES.. Next to this, an estimate had to be made for the distribution of the emission over the various environmental compartments. In the global distribution model of Wania & Mackay (1993), a distribution scheme of 70% to soil, 25% to air and 5% to water was used. This distribution has also been applied to the EUSES model. Table 4.2.a and b summarize the input parameters for the two scenarios..
(29) RIVM report 604502 003. page 29 of 44. Table 4.2.a Input parameters scenario 1: air-transported volatile but relatively water insoluble components Input parameters Physical-chemical properties. Molecular weight Melting point Boiling point Vapour pressure at 25°C Water solubility Octanol-water partition coefficient * Henry’s law constant. Release estimation. Tonnage of substance released in Europe Fraction of tonnage released to air, surface water and industrial soil - air - water - industrial soil Number of emission days per year. *. Value. Unit. 413.8 78 40 0.4 6.44 4.14E+04. g.mol °C Pa µg/L log10 3 -1 Pa.m .mol. 30. tonnes/yr. 0.25 0.05 0.70 10. -. -1. calculated by EUSES. Table 4.2.b Input parameters scenario 2: water transported relative soluble components with a low volatility Input parameters Physical-chemical properties. Molecular weight Melting point Boiling point Vapour pressure at 25°C Water solubility Octanol-water partition coefficient * Henry’s law constant. Release estimation. Tonnage of substance released in Europe Fraction of tonnage released to air, surface water and industrial soil - air - water - industrial soil Number of emission days per year. * calculated by EUSES. Value. Unit. 413.8 78 -3 1.10 3 3.3 0.138. g.mol °C Pa µg/L log10 3 -1 Pa.m .mol. 30. tonnes/yr. 0.25 0.05 0.70 10. -. -1.
(30) page 30 of 44. 4.4. RIVM report 604502 003. Exposure patterns. Concentrations in the environment and intake media Table 4.3 describes both the environmental concentrations and the concentrations in the intake media calculated by EUSES and compares them to actually measured concentrations (preferably in Europe). This comparison checks the reality of the modeling exercitions.. Table 4.3 Toxaphene concentrations in environmental compartments and intake media calculated by EUSES and compared to measured concentrations. Scenario 1. Scenario 2. Literature Mean (Range). Environmental compartments 3 Air (pg/m ) Water (pg/l). 149 248. 93 39300. ~ 30 (<0.1 – 580) ~ 50 (25 – 200). Intake media Wet fish (µg/kg). 11. 5. 0.0003 0.0003 31 0.004 0.00007. 0.079 0.032 39000 0.0002 0.00007. EUSES. Root tissue of plant (µg/kg) Leaves of plant (µg/kg) Drinking water (pg/l) Meat (µg/kg) Milk (µg/kg) *. *. lean fish: ~ 0.5 – 1 * moderate fat: ~ 2 – 4 * fatty fish: ~ 20 – 40 <1 <1 ? < 0.4 < 0.4. total toxaphene has been reported as a range, based on the assumption that it consists for 25 to 50% of the indicators 1 – 3. As table 4.3 shows, most estimates for concentrations in the environmental compartments and in intake media of both scenario 1 and 2 are within the range of reported values in the literature. Total Daily Intake The calculated concentrations in the environmental compartments and intake media result in a calculation of the total daily intake for humans. For scenario 1, EUSES calculated a total daily intake of 18 ng/kg bodyweight/day. For scenario 2, EUSES calculated a somewhat lower total daily intake of 10 ng/kg bodyweight/day. Relative contribution of intake media to total daily intake The relative contribution of the intake media to the total daily intake gives an idea of the importance of the several exposure routes for human exposure. Figures 4.3 and 4.4, show the fractions of the total dose to which humans are exposed, in the several intake media. These figures demonstrate that for both exposure scenarios, fish is by far the greatest contributor to the total daily toxaphene intake (80 to 99%)..
(31) RIVM report 604502 003. page 31 of 44. Root crops 0% Meat 0,1%. Leaf crops 0%. Milk 0,06% Fish 99,4%. Other 0,6% Air 0,4%. Drinking water 0%. Figure 4.3 Main routes of exposure of relative volatile toxaphene congeners. Root crops 4%. Meat 0%. Milk 0%. Air 0%. Drinking water 11%. Leaf crops 5%. Fish 80%. Figure 4.4 Main routes of exposure of relative soluble toxaphene congeners.
(32) page 32 of 44. RIVM report 604502 003.
(33) RIVM report 604502 003. 5.. page 33 of 44. Discussion. The modeling exercition with EUSES of the exposure to toxaphene confirms that for humans the consumption of fish is by far the most important route of exposure. This applies to different sets of typical toxaphene congeners, with widely different physical-chemical properties. Toxaphene’s main exposure routes explain the predominant presence of toxaphene in fish. Toxaphene is worldwide distributed by atmospheric transport. In EUSES, no local or regional exposure has therefore been considered. Consequently, soil and crops did not contain toxaphene compounds. Furthermore, because of its lipophilic nature, toxaphene will be readily distributed to fish after deposition on water surfaces. Concentrations in intake media calculated by EUSES compare reasonably well to values reported in the literature (table 4.3). The results for the highly water soluble toxaphene congeners with a low volatility show concentrations in water which are almost a 1000 times higher than actual measured concentrations in water surfaces. The estimates for the volatile, relatively water insoluble components, show both water and air concentrations within the range of actual measured concentrations. This could lead to the conclusion that the alternative exposure route by air and the following deposition and bioaccumulation in the foodchain is the most important one. Actual measurements seem to support this finding. Toxaphene appears to be present in almost all fishsamples measured in European research or monitoring programs. In food items other than fish, except from some products in the USA, toxaphene could not be detected. Measured concentrations in other environmental media (air, water) are also much lower than concentrations in fish. Surprisingly, the modeling exercises also show drinking water as a possible exposure route. As there are no known measurements of toxaphene in drinking water, the calculated values can’t be compared with actual measurements. However, as there is also an overestimation of surface water concentrations, an overestimation of drinking water concentrations can be expected. Because of the complexity of the toxaphene mixture, modelling activities are difficult to perform. The question is whether the modelled scenarios are realistic. One of the most uncertain input parameters in the modelling exercise was the annual release rate of toxaphene. Data on emission rates about toxaphene are incomplete and not always reliable. However, the environmental concentrations calculated by EUSES (especially of the first scenario) appeared not to be totally unrealistic. Furthermore, the most interesting figure, the relative contribution of the several intake media, is independent of absolute emission figures. In this research, we estimate the mean dietary toxaphene intake in the Dutch population to be in the order of 1 – 2 ng/kg bodyweight. For fish consumers (of the VCP-population) this.
(34) page 34 of 44. RIVM report 604502 003. intake is seven time’s larger, 7 – 14 ng/kg bodyweight. These estimates have predominantly been based on data for fish. A modeling assessment with EUSES confirms that intake by fish is by far the most dominant exposure route. In Germany, a mean daily intake of the toxaphene indicators 1 – 3 of 1.4 ng/kg bodyweight has been estimated (Alder et al., 1997). In their calculation almost the same concentrations in fish has been used. The calculated intake corresponds with a total toxaphene intake of 2.8 – 5.6 ng/kg bodyweight. Compared to the intake calculated in this research, the estimated intake in Germany is almost three times higher. Their calculation, however, was based on marketshares of fishspecies in Germany instead of actual consumption data. The German calculation has been based on an average daily fish consumption of 20 g/day which is two times higher than the average consumption in the Netherlands (10 g/day; Voedingscentrum, 1998). In other countries, estimated toxaphene intakes were also higher. Based on an average fish consumption of 30 g/day (assumed for normal fish consumers) and a toxaphene concentration in fish of 7 – 100 µg/kg wet weight, the Nordic Council of Ministers (1997) estimated a daily toxaphene intake of 3.5 – 60 ng/kg bodyweight. In the United States, toxaphene intakes have been calculated through the total diet analyses. In 1991 an intake was calculated of 3.3, 5.9 and 2.4 ng/kg bodyweight for 6-11-month-old infants, 14 – 16-year-old-males, and 60 – 65year-old females, respectively (ATSDR, 1996). In conclusion, it can be said that the estimated toxaphene intake in the Netherlands is comparable to other countries, which might be expected because of the exposure routes (global distribution) and the lack of local sources. Furthermore, as the main source for toxaphene intake is fish, the average fish consumption in a country determines its mean toxaphene intake. However, as fish eaters are posed to the greatest risks, an estimate of the mean intake of fish eaters is much more relevant than an estimate of the population mean intake. For toxaphene, there is no offical established toxicological tolerable daily intake (TDI). In Canada, a TDI of 0.2 µg/kg/day (200 ng/kg/day) is employed. The total daily intake calculated in this research is far below this TDI. However, as the calculation in this research of the intake of ‘actual’ fish consumers per age group shows (figure 3.1), the toxaphene intake of fish-eating children is relatively high compared to other age groups. The intake is still far below the Canadian TDI of 200 ng/kg/day. Because of their low bodyweight children are especially fulnerable for exposure. The highest daily toxaphene intake in this research has been calculated in the youngest age groups (children below 10). Their toxaphene intake was never higher than 35 ng/kg bw/day, still far below the Canadian TDI of 200 ng/kg bw/day. There are uncertainties in the estimated toxaphene intake for the Dutch population. The used toxaphene concentrations were of German and not of Dutch origin. This could introduce some bias in the calculation. However, probably concentrations in fish caught for the Dutch market differ not much from fish caught for the German market. In 1999, new, extensive.
(35) RIVM report 604502 003. page 35 of 44. measurements have been performed on toxaphene concentrations in Dutch fish by the Dutch Fisheries Institute (RIVO-DLO). If fine-tuning is necessary, it is recommended to perform a new toxaphene intake calculation with these new concentrations. Some assumptions made for the intake calculation could have introduced some more bias. For some fish species, mentioned in the VCP, no toxaphene concentrations were known. For these species concentrations have been used of fish species with a similar fatpercentage and biology (appendix 3). The intended species (like anchove) were, however, only consumed by a very small number of persons. In case of some prepared products, the percentage added ingredients (for intstance fat of different origin) introduced uncertainty. This difficulty only accounted for a few products. However, for some age groups exactly these products contribute most to the total fishconsumtpion (like ‘lekkerbekje’ and ‘fishsticks’). Finally, in some VCP age groups the amount of fish-eaters was relatively small. This has to be considered when interpreting the calculated intakes for these groups..
(36) page 36 of 44. RIVM report 604502 003.
(37) RIVM report 604502 003. 6.. • • • • •. • •. page 37 of 44. Conclusions. The consumption of fish and fish products are the main source of the intake of toxaphene, In this research, the mean total daily dietary toxaphene intake in the Netherlands has been estimated to be 1 – 2 ng/kg bodyweight, The toxaphene intake of fish consumers is therefore on average seven times’ higher than the intake of the average population, This intake is comparable to other countries, Both the dietary toxaphene intake of the total Dutch population as the intake of the most vulnerable groups within this population (fish-eating children below 10 years), are far below the only known employed TDI, that of Canada of 200 ng/kg bodyweight/day, Because the consumption of fish is the most important contributor to the dietary toxaphene intake, monitoring toxaphene concentrations in fish is useful, The intake calculations in this report should only be considered as a first indication of toxaphene intake in the Netherlands..
(38) page 38 of 44. RIVM report 604502 003. References. Alder L, Beck H, Khander S, Karl H, Lehmann I. 1997. Levels of Toxaphene Indicator Compounds in fish. Chemosphere 34(5-7): 1389-1400. Andersson Ö, Linder C-E, Olsson M, Reutergårdh, Uvemo U-B, Wideqvist U (1988). Spatial Differences and Temporal Trends of Organochlorine Compounds in Biota from the Northwestern Hemisphere. Arch Environ Contam Toxicol 17: 755-765. ATSDR. Toxicological Profile for Toxaphene. 1996. Atlanta: Agency for Toxic Substances and Disease Registry. Barrie L, Bidleman T, Dougherty D, Fellin P, Grift N, Muir D, Rosenberg B, Stern G, Toom D. 1993. Atmospheric Toxaphene in the High Arctic. Chemosphere 27 (10): 2037-2046. Bidleman TF, Wideqvist U, Jansson B, Söderlund R. 1987. Organochlorine pesticides and polychlorinated biphenyls in the atmosphere of southern Sweden. Atmos Environ 21(3): 641-654. Bidleman TF, Falconer RL, Walla MD. 1995. Toxaphene and other organochlorine compounds in air and water at Resolute Bay, N.W.T., Canada. Sci Total Environ 160/161: 55-63. Bidleman TF, Olney CE (1975). Long range transport of toxaphene insecticide in the atmosphere of the western North Atlantic. Nature 257: 475-477. De Boer J, Wester PG (1993). Determination of Toxaphene in Human milk from Nicaragua and in fish and Marine Mammals from the Northeastern Atlantic and the North Sea. Chemosphere 27(10): 1879-1890. Codex Committee on Pesticide Residues (1999). Draft and Proposed Draft Extraneous Maximum Residue Limits. Need for EMRL for Toxaphene in Fish. Codex Alimentarius Commission. Codex Committee on Pesticide Residues, Thirty-first session, The Hague, The Netherlands, 12-17 April 1999. Agenda Item 6(b). CX/PR 99/8. De Geus H-J, Besselink H, Brouwer A, Klungsøyr, McHugh B, Nixon E, Rimkus GG, Wester PG, De Boer J. 1999. Environ Health Perspect 107(Suppl 1): 115-144..
(39) RIVM report 604502 003. page 39 of 44. EC. 1996. EUSES, the European Union System for the Evaluation of Substances. National Institute of Public Health and the Environment (RIVM), the Netherlands. Available from the European Chemicals Bureau (ECB/JRC), Ispra, Italy. Food and Drug Administration. (1999a). Food and Drug Administration pesticide program – residue monitoring – 1998. FDA Center for Food Safety and Applied Nutrition, WWW report. Food and Drug Administration. (1999b). Food and Drug Adminstration Total Diet Study: Summary of Residues Found Ordered by Food Market Baskets 91-3 – 97-1. FDA Center for Food Safety and Applied Nutrition, WWW report. Fromberg A, T Cederberg, G Hilbert. 1998. Determination of toxaphene congeners in fish from Danish waters. Organohalogen Compounds 35: 259-262. Glassmeyer ST, Brice K, De Vault DS, Hites RA. 1997. Toxaphene in Great Lakes Fish and Air. Organohalogen Compounds 33: 28-33. Gregor DJ. Workgroup report on environmental transport and fate (leaders: Swackhamer DL, McConnell LL. 1993. Chemosphere 27(10): 1835-1840. Hinckley DA, TF Bidleman. 1991. Atmospheric Organochlorine Pollutants and Air-Sea Exchange of Hexachlorocyclohexane in the Bering and Chuckchi Seas. J Geophys Res 96 (C4): 7201-7213. Hoff RM, Muir DCG, Grift NP, Brice KA. 1993. Measurement of PCCs in air in southern Ontario. Chemosphere 27(1): 2057-2062. IPCS. 1993. International Chemical Safety Cards. Camphechlor. ICSC: 0843. http://www.cdc.gov/niosh/ipcs/ipcs0843.html Jantunen L, Harner T, Bidleman T, Wideman J. 1997. Sources and Air-Water Gas Exchange of Toxpahene to Lake Superior. Organohalogen Compounds 33: 285-289. Kistemaker C, M Bouman, KFAM Hulshof. 1998. De consumptie van afzonderlijke produkten door Nederlandse bevolkingsgroepen- Voedselconsumptiepeiling 1997-1998. Zeist: TNO-Voeding. TNO-rapport V98.812. 12 pp. McConnell LL, JR Kucklick, TF Bidleman, MD Walla. 1993. Longe-Range Atmospheric Transport of Toxaphene to Lake Baikal. Chemosphere 27: 2027-2036..
(40) page 40 of 44. RIVM report 604502 003. Muir D, K Kidd, K Koczanski, G Stern, M Alaee, L Jantunen, T Bidleman. 1997. Bioaccumulation of Toxaphene Congeners in Freshwater and Marine Food Webs. Organohalogen Compounds 33: 34-38. NEVO. 1996. Nederlands Voedingsstoffenbestand 1996. Den Haag, Stichting Nederlands Voedingsstoffenbestand & Voorlichtingsbureau voor de Voeding. Nordic Council of Ministers. 1997. Nordic Risk Assessment of Toxaphene Exposure. Copenhagen: Nordic Council of Ministers. TemaNord 1997: 540. 70 pp. Oetjen K, K Horst. 1998. Levels of toxaphene indicator compounds in fish meal, fish oil and fish feed. Chemosphere 37: 1-11. Saleh MA. 1991. Toxaphene: Chemistry, Biochemistry, Toxicity and Environmental Fate. Rev Environ Contam Toxicol 118: 1-85. Tuinstra LGMTh. 1995. Survey of pesticides and veterinary drugs 1994/1995 under the auspices of the National Platform Critical Compounds: toxaphenes, pyrethroids, organophosphorus pesticides, chlorophenols and olaquindox in animal products (in Dutch). Wageningen: State Institute for Quality Control of Agricultural Products (RIKILTDLO). Report 95.33: 22 pp. Vetter W. 1993. Toxaphene theoretical aspects of the distribution of chlorinated bornanes including symmetrical aspects. Chemosphere 26(6): 1079-1084. Van der Valk F, Wester PG (1991). Determination of Toxaphene in Fish from Northern Europe. Chemosphere 22(1-2): 57-66. Vakgroep Humane Voeding, Landbouwuniversiteit Wageningen & TNO-Voeding, Zeist (1999). Maten, Gewichten, Codenummers. Wageningen 1997. Voedingscentrum (1998). Zo eet Nederland. Resultaten van de Voedselconsumptiepeiling 1997 – 1998. Den Haag, Voedingscentrum. 219 pp. Voldner EC, Li YF. 1993. Global Usage of Toxaphene. Chemosphere 27 (10): 2073-2078. Wania F & Mackay D. 1993. Modelling the global distribution of toxaphene: a discussion of feasibility and desirability. Chemosphere 27(10): 2079-2094.
(41) RIVM report 604502 003. page 41 of 44. Appendix 1 Mailing list 1-5 Hoofdinspecteur voor de Gezondheidszorg 6-7 Directeur-Generaal Volksgezondheid 8 Plv. directeur-generaal Milieubeheer 9 Hoofdinspecteur Gezondheidsbescherming 10 Directeur Voeding en Veiligheid van Voeding en Producten, Ministerie van VWS 11 Voorzitter van de Gezondheidsraad 12 Dr.ir. G. Kleter, Ministerie van VWS/Inspectie W&V 13 Drs. H.J. Jeuring, Ministerie van VWS/Inspectie W&V 14 Drs. H. de Sitter, Ministerie van VWS/Inspectie W&V 15 Dr. J. de Boer, RIVO 16 Dr. F.X.R. van Leeuwen, WHO 17 Depot Nederlandse Publikaties en Nederlandse Bibliografie 18 Directie RIVM 19 Dr. ir. G. de Mik 20 Dr. ir. E. Lebret (hLBO) 21 Dr. P. van Zoonen (hLOC) 22 Dr. A. Opperhuizen (hLEO) 23 Dr. W.H. Könemann 24 Dr. A.K.D. Liem 25 A. Piersma 26 M. Pieters 27 M. Zeilmaker 28 Dr. C.E.J. Cuijpers 29 Drs. B.A.M. Staatsen 30 C.J. van Leeuwen 31 W. Slooff 32 T. Vermeire 33 Dr. J.I. Freijer 34 Dr. A.J.A.M. Sips 35 Dr. R. Hoogerbrugge 36-37 Auteurs 38 SBD/Voorlichting & Public Relations 39 Bureau Rapportenregistratie 40 Bibliotheek RIVM 41-66 Bureau Rapportenbeheer 66-76 Reserve exemplaren.
(42) page 42 of 44. RIVM report 604502 003. Appendix 2 Scientific, English and Dutch common names of fish species. English name. Dutch name. Scientific name. Alaska Pollock, Saithe. Koolvis. Pollachius virens. Angler. Zeeduivel. Lophius piscatorius. Bass. Zeebaars. Dicentrarchus labrax. Bonito. Bonito, tonijn. Sarda chiliensis. Cod. Kabeljauw. Gadus morhua. Dab. Schar. Limanda limanda. Eel. Paling. Anguilla anguilla. Hake. Stokvis, Heek. Urophycis tenuis. Halibut, Flounder. Heilbot. Atheresthers evermanni. Herring. Haring. Harengus clupea. Mackerel. Makreel. Scomber scombrus. Plaice. Schol. Pleuronectus platessa. Pollock. Pollok. Pollachius pollachius. Redfish. Roodbaars. Sebastus marinus. Shrimps. Garnalen. Pandalus borealis and others. Sole. Tong. Solea solea.
(43) RIVM report 604502 003. page 43 of 44. Appendix 3 Calculation of the dietary toxaphene intake. 1. of each toxaphene containing product, based on the fatcontent of that product concentrations per kg fat were calculated Based on fatpercentages of raw fish as found in the literature (Alder et al., 1997) and in the NEVO-table (NEVO, 1996), toxaphene concentrations were expressed in µg/kg fat. Of some VCP-fish-items, however, no toxaphene or fat concentration could be found in the literature. To these items the concentration of an item with a similar fatpercentage of which the concentration was known has been assigned. For instance, no value for the toxaphene concentration could be found for Sole. A fish-specie with a similar fatpercentage and biology is Plaice. Therefore, the concentration of Plaice was also assigned to Sole. 2. based on the fatcontent of the corresponding NEVO food item, the fatintake through that item was calculated In the NEVO-table the total fatcontent of each NEVO food item is reported (NEVO, 1996). Combined with the reported intake (in g/day) of each item (Kistemaker, 1998), the fatintake can be calculated. 3. corrections were made to combine concentrations in raw products with the intake of corresponding NEVO food items. When contaminant concentrations are only available in raw products and have not been directly measured in the NEVO food-items, conversions have to be made. For instance, when a NEVO food-item is a fried product (like ‘fried mussels’), fat of such an item is from different origins. In this research, the assumption has been made that for such products per 100 g, 95% of the intake originates from the product itself and 5% is added fat (corresponds with 5 g fat). Sometimes, NEVO food-items consist of more than one ingredient (for instance ‘mackerel in tomatosauce’ or ‘fishsticks’) percentages of each ingredient have been derived from standard recipes used for the compilation of the NEVO food-item list (Vakgroep Humane Voeding, LUW & TNO-Zeist, 1997). Canned fishproducts in oil received the same fatpercentage as their equivalents which were canned in their own fluids. When that percentage was not known (in case of ‘canned sardines in oil’ and ‘canned anchove in oil’) the fatpercentage of the raw fishproduct has been used for the calculation. 4. the toxaphene intake via a NEVO food-item was calculated by multiplying the corrected fat intake through that item with the known concentration per kg fat in the corresponding raw product..
(44) page 44 of 44. RIVM report 604502 003. 5. finally, intakes were summarized to calculate the total daily intake within the Dutch population. To express the calculated total daily intakes in ng/kg bodyweight, the mean bodyweight of the total VCP-population and of the different age groups was used..
(45)
Afbeelding


+7


GERELATEERDE DOCUMENTEN
We aim to contribute to an (i) understanding on how in-network processing can accelerate real-time data analytics and (ii) assess what models of in-network computing can
Furthermore, this thesis also aims to measure some of the environmental factors such as breastfeeding and gluten intake in early life considered to play a role in the prevention
In order to develop the FQ-gluten, we added gluten-containing food products according to the database of a recent food consumption study among young children aged 9 – 18 months
Netherlands Cancer Registry NKR, account: Association of Comprehensive Cancer Centers VvIK Eindhoven Cancer Registry IKZ, account: Comprehensive Cancer Center South; note: NKR
In deze notitie wordt voor stikstofdioxide, fijn stof PM10, zwarte rook, zwaveldioxide, lood, koolstofmonoxide, benzeen en benzoapyreen een beeld van de luchtkwaliteitsituatie
berekeningen en CBS-data. Op landelijke schaal is de overeenkomst tussen 1986 en 2000 redelijk. Verschillen betreffen vooral dierlijke mest en worden veroorzaakt door het geringe
Wanneer de criteria van het Vinkje vergeleken worden met indelingscriteria voor voorkeur-middenweg-uitzondering die het Voedingscentrum hanteert wordt duidelijk dat na de
Van de 300 bedrijven in het derogatiemeetnet zijn van zeven bedrijven geen gegevens opgenomen: vier bedrijven hebben afgezien van derogatie in 2006, twee bedrijven konden
