Dutch Health Care P
erformance Report 2010
Access to Dutch health care is overall good. Essential health services are within easy reach and well accessible. The number of people who forego care because of costs is small. Still, despite this easy access, the overall use of services is low in
international perspective. In the period 2007-2009, health care expenditures rose substantially. The growth in health care expenditures resulted largely from an increase in the volume of care – that is, more services were delivered. Although the quality of care stands out in many ways, remarkable variations in quality and price exist between care providers. The DHCPR shows many examples of this variation.
Since 2006, RIVM has monitored the performance of the Dutch health care system. With the help of roughly 125 indicators, RIVM describes the quality, accessibility and costs of the Dutch health care system.
GP Westert, MJ van den Berg, SLN Zwakhals, R Heijink, JD de Jong, H Verkleij
This is a publication of:
National Institute for Public Health and the Environment (RIVM) PO Box 1 3720 BA Bilthoven The Netherlands www.rivm.nl/gezondheidszorgbalans May 2010
Dutch Health Care Performance Report 2010
Dutch
Health Care
Performance
Report
Dutch Health Care Performance
Report 2010
Editors: GP Westert, MJ van den Berg, SLN Zwakhals, JD de Jong, H Verkleij
Centre for Prevention and Health Services Research Public Health and Health Services Division
National Institute for Public Health and the Environment P.O. Box 1, 3720 BA Bilthoven, The Netherlands
T +31 30 274 9111
A publication by the
National Institute for Public Health and the Environment P.O. Box 1
3720 BA Bilthoven The Netherlands www.rivm.nl
All rights reserved
© 2010 National Institute for Public Health and the Environment, Bilthoven, The Netherlands The report was originally published in Dutch under the title: Zorgbalans 2010. De prestaties van de Nederlandse zorg.
The greatest care has been devoted to the accuracy of this publication. Nevertheless, the editors, authors and the publisher accept no liability for incorrectness or incompleteness of the information contained herein. They would welcome any suggestions concerning improvements to the information contained herein.
All rights reserved. No part of this publication may be reproduced, stored in an automated database or made public in any form or by any means whatsoever, whether electronic, mechanical, using photoco-pies, recordings or any other means, without the prior written permission of the National Institute for Public Health and the Environment.
In as much as the production of copies of this publication is permitted on the basis of Article 16b, 1912 Copyright Act in conjunction with the Decree of 20 June 1974, Bulletin of Acts, Order and Decrees 351, as amended by the Decree of 23 August 1985, Bulletin of Acts, Orders and Decrees 471, and Article 17, 1912 Copyright Act, the appropriate statutory fees should be paid to the Stichting Reprorecht (Publishing Rights Organization), PO Box 882, 1180 AW Amstelveen, The Netherlands. Those whishing to incorporate parts of this publication in anthologies, readers and other compilations (Article 16, 1912 Copyright Act) should contact RIVM.
RIVM: 260602006 ISBN: 978-90-6960-247-9
The Dutch health care system is in full swing. Major reforms have been introduced in the past few decades. In many ways it is a ‘work in progress’. In addition, the present economic crisis is more than likely to affect health care. Still, the ambitions of the Ministry of Health, Welfare and Sport (Ministry of Health) in the field of public health and health care are and will remain unflaggingly high, despite the crisis. We want a health care system of high quality, with good access, which is effective and which remains affordable.
It is therefore important that at some distance from health policy and the field of health care, RIVM periodically takes the pulse of the health care system and examines the state of affairs regarding the quality, accessibility and affordability of Dutch health care from an independent position. The present Dutch Health Care Performance Report (DHCPR) describes the situation in 2008 and 2009 based on 125 indicators. The DHCPR shows how the Netherlands has been doing internationally and whether there have been positive developments.
I am pleased with the results of the third DHCPR. The Dutch health care system fares well, the RIVM concludes. Accessibility is excellent; quality is above average in many areas and for years the costs of health care have not been significantly diverging from those in neighbouring countries. Still, there is no reason to sit back and relax. Despite these positive results, we are facing huge challenges for the near future. The sharp increase in the number of older people affects the demand for care at the population level and increases its complexity. The number of chronically ill people is also rising fast. The labour shortages are increasing, making it necessary to deploy the increasingly scarce human resources as efficiently as possible. Innovation can make an important contribution to reducing the workload. Innovative new treatment modalities are increasing, but this comes at a price. And, all of this is
ning in a period when major cuts are inevitable. How can we maintain our strong position in the next few years? Working more efficiently is the best way to cut costs. ‘Saving lives and costs,’ president Obama said. Better health care at lower costs by rewarding quality, improving safety and preventing over- and undertreatment.
The DHCPR also reminds us of what does not go well or goes less well. The cost benefit relationship in health care in 2008 and 2009 was not convincingly beneficial. Understandably so, because the system reforms are a long-term process that is still ongoing. More efforts are needed to achieve competition on the basis of quality in Dutch health care.
The DHCPR offers a wealth of empirical data on the performance of preventive, curative and long-term care in the Netherlands. This is not only useful for the Ministry of Health and the House of
Representatives, but also for anyone who thinks about the future of health care.
Besides the DHCPR, the fifth edition of the Health Status and Forecast report (VTV) Van Gezond naar Beter (From Healthy to Better) recently appeared. While the DHCPR presents an overview of the performance of health care and developments in the performance, the VTV focuses on health in all its aspects with an eye to the future. Together the DHCPR and the VTV present a clear picture of health care and health in the Netherlands.
Many have been involved in the realisation of the present DHCPR. The DHCPR provides a solid empirical foundation for the policy of the Ministry of Health for the challenging period ahead. I sincerely thank everyone who has contributed to laying this foundation.
Ab Klink,
Contents
Foreword 3
Executive summary 9
1 Background and approach 19
2 Quality of care 25
2.1 What is quality of care? 25
2.2 Effectiveness of prevention 27
2.3 Effectiveness of curative care 40
2.4 Effectiveness of long-term care 53
2.5 Patient safety 63
2.6 Responsiveness 77
2.7 Co-ordination and co-operation 86
2.8 Palliative care 94
3 Access to care 101
3.1 What is access to care? 101
3.2 Financial access 102
3.3 Geographical access 111
3.4 Timeliness of acute care 116
3.5 Timeliness of regular care 121
3.6 Access according to needs 130
3.7 Personnel availability 136
3.8 Freedom of choice 144
4 Health expenditure and efficiency 151
4.1 Health expenditure and efficiency 151
4.2 Trends in health expenditure 153
4.3 Efficiency 169
4.4 The financial position of health care organisations and health insurers 198
5 Impact of the Dutch health care system reforms 205
5.1 Introduction 205
5.2 Regulated competition in the health care system 206
5.3 Effects of regulated competition 210
5.5 Potential risks from a lack of transparent quality information 216
5.6 Conclusion and discussion 218
Appendix 5.1 Progress towards regulated competition. Situation in 2010 222 6 Towards the next Dutch Health Care Performance Report 231
6.1 Introduction 231
6.2 Improvements and gaps in this Dutch Health Care
Performance Report 232
6.3 The usefulness of the Dutch Health Care Performance Report 239 6.4 The Dutch Health Care Performance Report continued 240
References 242
Appendix 1 Members of Project Groups
Members of Scientific Advisory Group 259
Appendix 2 Indicators 262
Executive summary
From a policy perspective, it is important to monitor how well the various parts of the health care system are functioning and whether all the people are benefiting equally from the resources provided. In view of the rising costs of health care, it is also relevant to find out whether those resources are producing sufficient returns – how efficient is the health care system? To monitor trends in the quality, accessibility and costs of health care, the Dutch Ministry of Health has commissioned RIVM to produce the Dutch Health Care Performance Report (DHCPR) every two years. Using a finite set of indicators, this third edition of the report assesses the performance of the health care system in 2008 and 2009 and compares it to previous years and to other countries.
What findings stand out in the 2010 Performance Report? First of all, many strong points could be identified. Access to Dutch health care is mostly excellent. Many parts of the system are delivering good-quality care, and demonstrable improvements have been made. Most users are consistently positive about the services they receive. The rising costs of health care are mainly due to the greater volume of services delivered. As the 2010 Health Status Forecast has reported, Dutch people are living longer, and the two additional life years gained are spent in good health (Van der Lucht and Polder, 2010). Disease prevention and health care are both critical factors in these health gains.
In contrast with positive findings like these, there is also evidence that Dutch health care is not living up to the high ambitions and expectations in every way. Accessibility is unsatisfactory in some areas, as evidenced by persistent waiting lists in certain sectors and the difficulty of reaching GP practices by telephone during office hours. Wide variations exist amongst health care providers in terms of both price and quality. The co-operation and co-ordination between different providers are not as good as they should be. Although quality improvement goes hand in hand with cost savings in some instances, this cannot be firmly concluded for the system as a whole. In fact, the total costs of care continue to grow at a fast rate, while the quality of care improves slowly. One prerequisite for a well-functioning system is that quality data must be available – and that it must also be put to use. The amount of available data has increased, but it is still insufficient for comparing health care providers in terms of quality and patient outcomes.
Excellent performance in many areas ...
Health care accessibility is a strong point
The Dutch health insurance system includes a broad basic benefits package under which practically all residents of the country are insured for health care costs. Co-payments are amongst the lowest in the OECD-countries. In comparison with six other affluent countries, the Netherlands has reported the smallest percentages of residents (1%) and people with chronic illnesses (3%) who forego a visit to the doctor for financial reasons. The essential health care services are also within easy reach.
Figure1: Average driving times to the nearest care service of a certain kind, 2008/2009
Physiotherapists 2008 Pharmacies 2008
General practitioners 2008
Primary care midwives 2008 Nursing homes and residential homes 2008 Hospitals 2009
Driving time in minutes
0 - 1 1 - 3 3 - 5 5 - 7 7 - 10 10 - 15 > 15
Most people (85%) say they generally experience no problems with access to health care. Some 90% of respondents queried about their health care experiences report that they always or almost always get the help they need. Such figures have remained more or less stable in recent years. In terms of health care utilisation (with the exception of dentistry), there is little difference between low- and high-income groups or between ethnic Dutch and ethnic minority groups.
Quality of care stands out in many ways
The overall quality-of-care ratings for 2008 were much like those in 2004 and 2006. On many indicators, the Netherlands compared well with other affluent Western nations. Uptake of preventative screenings was high. Rates of avoidable hospital admissions were low, pointing to a strong primary care and outpatient clinical care. In almost two thirds of cases, GPs prescribed medicines in conformity with professional guidelines. Infant mortality further declined in 2008 to 3.8 per 1000 live births, thereby improving the Dutch standing on that indicator. The 5-year survival rate for cancer was high in interna-tional comparison.
General public remains positive about the health care system
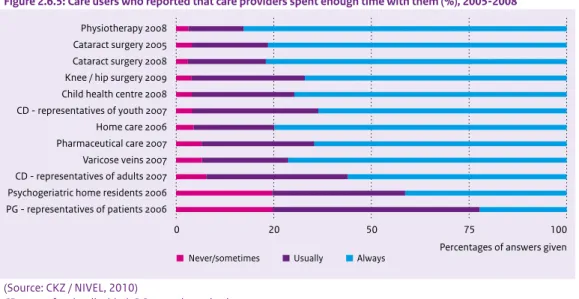
Nine out of ten people surveyed gave favourable ratings to the Dutch health care system. More than 90% was satisfied with the interaction between them and health care providers, a percentage that has remained steady over the years. This finding is based on questions about whether professionals are polite and respectful, take patients seriously, listen attentively, allow enough time and explain things understandably. Clients in nursing or residential facilities, clients receiving home care and the representa-tives of clients in psychogeriatric care generally rated the services as professional and safe.
Figure 2: Care users who reported that they were involved in decision making about care and treatment (%), 2005-2008
0 25 50 75 100
Home residents 2006 Representatives of psychogeriatric patients 2006 Slipped disk 2008 Home care 2006 Breast condition (malignant) 2007 Physiotherapy 2008 Rheumatism 2007 Rheumatism 2008 Cataract surgery 2005 Cataract surgery 2008
Percentages of answers given
Never/sometimes Usually Always
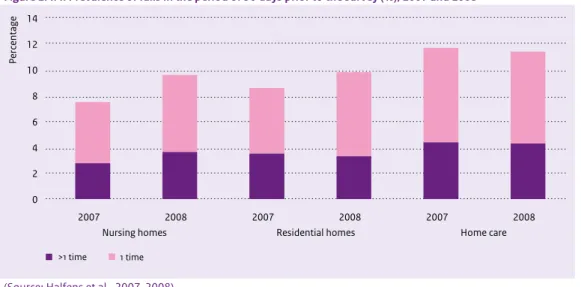
Safety is firmly on the agenda
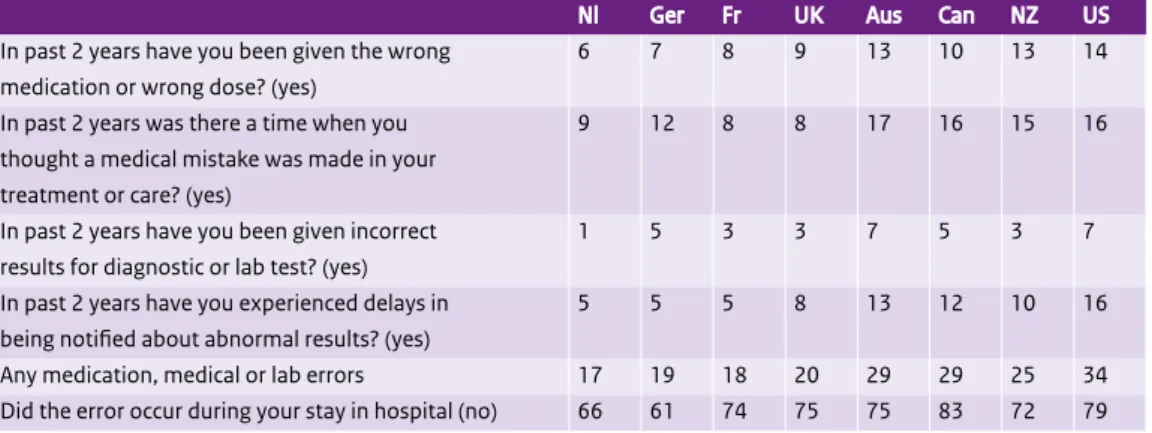
In terms of health care safety, a number of positive trends have been evident in recent years. The percentage of nursing home and general hospital patients with pressure ulcers was halved in the past six to ten years. The percentage of malnourished patients in nursing or residential facilities declined somewhat. The number of structured consultation groups of pharmacists, GPs and other doctors about the safety of medication dispensation steadily grew. The standardised mortality rate in hospitals declined in the 2003-2008 period. The percentage of patients with chronic diseases who believed that one or more errors had been made in their treatment (17%) was the lowest in an international comparative study with six other affluent countries.
Figure 3: Hospital standardised mortality rate, 2003-2008
20 40 60 80 100 120 140 160 2003 2004 2005 2006 2007 2008
Average Minimum Maximum
(Source: Prismant; data analysis by RIVM)
Growth in health care expenditures mainly due to increase in the volume of care
In the period 2007-2009, health care expenditures grew at a faster rate than in the preceding years. The most recent OECD time-series (2000-2007) shows that the growth in Dutch real expenditures was about average as compared to other countries. It resulted largely from an increase in the volume of care – that is, more services were delivered. Since 2002, the volume of care provided by Dutch hospitals has mounted by 4.2% yearly, as compared to the average price rise of 1.6%. Inpatient admissions grew by 3% and day-patient admissions by 10%. At the same time, the volume of Dutch hospital care has remained relatively low in an international perspective. Interestingly, medicine prices have fallen dramatically inrecent years, but the volume of medication prescribed (the number of prescriptions filled) increased in 2008 by almost 15%. The volume of care for the elderly grew by yearly averages of 5.5% for outpatient care and 3.4% for nursing and residential homes. In mental health care, outpatient treatments increased by about 8% per year. The growth of care for the disabled was seen mainly in outpatient care, averaging 9% per year since 2004.
… but ambitions are high and improvement is feasible
High ambitions and expectations
“Dutch government policy shows high ambitions. ‘The Dutch government believes the performance potential of the health care system can be substantially boosted if centralised state control makes room where possible for a more decentralised system of regulated competition’ (VWS, 2004). One ambitious measure has been the comprehensive health care reform implemented in the past decade. Its primary aim was to secure a better balance between costs and benefits, thus preserving the affordability and accessibility of health care for present and future generations. The Dutch general public has high expectations as well; all people want the best possible health care, and at a reasonable cost. This makes it essential to detect any signals that parts of the system are not functioning adequately and need improvement.
Waiting times and reach of services are not optimal in all cases
Although overall accessibility is good, several indicators in this report point to problems with accessibility. For 25% to 33% of clients in the mental health sector, waiting times for treatment were longer than the agreed standard. One quarter of hospital outpatient clinics reported that their waiting times exceeded the standard. The number of problematic cases on waiting lists in long-term care stood at 4500, unchanged in recent years. Poor telephone access to GP practices during office hours was reported as a problem by many people; one third of emergency calls to GP practices were not answered within the 30-second standard. A preventive intervention for depression was found to have improved its reach, but that still remained very small at 2%. Population screening for cervical cancer scored well in comparison to other countries, but had still not surpassed the 66% mark. The numbers of hard-to-fill vacancies in the health system mounted steadily, foreshadowing serious accessibility problems for patients and clients in the future.
Figure 4: Patients who reported that they experienced problems with access to health care in eight areas (%), 2008
0 25 50 75 100
Travelling for care Waiting for care Getting care Telephone access during out-of-office hours Telephone access during office hours Appointment with specialist Referral to specialist Finding general practitioner
Percentages of answers given
Big problem Small problem No problem
(Source: CKZ / NIVEL, 2010)
Quality not always up to par
A number of indicators suggested room for improvement in the quality of care. Patients undergoing surgery for cataracts, varicose veins, slipped discs and hip or knee problems did not always experience improvement after the operation. Hip surgery and cataract operations scored best, with 65% of patients reporting improvement in functioning. The death rate within 30 days of hospital admission for an acute condition (heart attack, brain haemorrhage, stroke) was about twice as high in the Netherlands as in the European countries with the lowest rates.
Figure 5: 30-day hospital mortality rate for acute myocardial infarction (%), 2005 for the Netherlands and 2006-2007 for other countries; the Netherlands, United States, Western Europe, highest and lowest scoring countries Percentage 0 1 2 3 4 5 6 7
Netherlands United States Western Europe1 Sweden / Denmark
((Source: OECD Health Data)
1 Austria, Denmark, Finland, Ireland, Italy, the Netherlands, Norway, Spain, Sweden, United Kingdom
Although concerted efforts have been made to preserve good practice in the long-term care sector, a combination of factors is threatening the quality and the safety of the care delivered in nursing and residential care facilities: hard-to-fill vacancies, increasing care intensity and heavy workloads for nurses and care workers. Although the (often highly dependent) residents generally expressed satisfaction with the care they received, one quarter of the representatives of psychogeriatric patients reported that staff ‘never’ had enough time for the clients, and only 22% answered ‘always’. Research on moral dilemmas has shown that many nurses and caretakers in long-term care feel they cannot provide the care that is needed and that they wage a constant struggle with understaffing and work pressures. Only one third of the representatives of psychogeriatric patients rated the physical care of their charges as ‘always good’. When clients had suffered falls, insufficient preventative measures were taken to avert a recurrence. The co-ordination of care also needed improvement. Four out of ten patients with rheumatoid arthritis reported having to tell the same story several times to different health care providers, as compared to only 10% of patients with diabetes. In terms of safety, the Dutch health care system scored favourably in international terms, but some unsafe conditions persisted nonetheless: one patient in six reported having experienced minor or major medical errors during treatment, and in nursing or residential care facilities at least 7% of clients experienced a medication incident during one month.
Wide variations in price and quality
At €184, the highest consultation fee for an out-of-hours GP cooperative was over five times the lowest fee of €35 in 2008. Average hospital charges for a hernia operation ranged from €1000 up to €2500. GPs differed by nearly 30 percentage points (49% versus 77%) in the numbers of their medication prescriptions that conformed to the professional guidelines. The percentages of hip fracture operations within 24 hours of hospital admission varied between 67.5% and 100% across hospitals. The percentages of unplanned Caesarean sections performed on low-risk women varied widely from 7% to 30%. For some conditions being treated in the mental health sector, the percentages of patients dropping out of therapy ranged from below 5% to 28%. In nursing and residential care, the numbers of fall incidents varied between facilities, with 15% of the care homes sharply diverging from the average.
Balance between costs and quality could be better
From the indicators we used to measure the performance of the Dutch health system and compare it to that in other Western countries, we may conclude that the Netherlands lies somewhere in the middle. Our two previous performance reports reached a similar conclusion. Clear progress has been made in certain areas. Quality has improved in some respects, while the health care expenditures grew at an average annual rate of 6% to 7% between 2007 and 2009.
Figure 6: Annual nominal growth in health expediture (%), 2000-2009
0 2 4 6 8 10 12 14 2000 2001 2002 2003 2004 2005 2006 2007 2008 2009
Health expenditure growth (%)
SHA Health Accounts BKZ
(Source: VWS, 2009b; VWS, 2010a; CBS, 2009b; OECD Health Data)
BKZ (Budgettair Kader Zorg) = Health Care Budgetary Framework (= gross BKZ = net BKZ + co-payments); SHA = System of Health Accounts
If we illustrate this with a direct cost-benefit comparison between health care expenditures and avoid-able deaths, then the Netherlands does not stand out in the comparison. Avoidavoid-able mortality declined rather rapidly in most countries between 1995 and 2008, whilst health care expenditures rose at a comparable pace. As avoidable mortality is an indicator of the rate of death from illnesses such as asthma, influenza or appendicitis that could have been effectively treated in an adequately functioning health care system, the avoidable mortality rate reflects the unique contribution of health care to health.
Figuur 7: Avoidable mortality per 100,000 population and real health expenditure per capita (in US$ PPP), 1996-2007 96 99 01 03 07 60 80 100 120 140 160 180 0 1000 2000 3000 4000 5000 6000
Real health expenditure per capita
Avoidable mortality per 100,000 population
Australia '98-'05 Denmark '96-'06 Germany '98-'06 Finland '96-'06 France '00-'06 Japan '96-'06 Netherlands '96-'07 New Zealand '00-'05 Norway '96-'06 Austria '02-'06 Spain '99-'05 United Kingdom '01-'06 United States '99-'05 Sweden '97-'06
(Source: OECD Health Data; WHO, 2009b, data analysis RIVM)
PPP (Purchasing Power Parities) = US$ PPP is an exchange rate that corrects for differences in purchasing power between countries
Since 2005, Dutch hospitals have been allowed to freely negotiate with health insurance companies about the price of a number of designated services – the ‘B-segment’. The question now is whether this has led to more efficient care in comparison with the state-regulated A-segment. This report concludes that while price trends in the B-segment have been moderate, the total expenditures have nevertheless increased due to expansion in the volume of care. That does not seem to bode well in terms of cost containment. Still, it remains difficult to interpret figures and draw firm conclusions on the basis of the limited data now available.
Quality of care lacks transparency and is not yet a driving factor
The Dutch health care reforms implemented in recent years were intended to foster a system of regu-lated competition. An underlying aim was to give health care consumers a more pivotal role in the market, thus resulting in affordable and good-quality health care for all. Such an outcome will require time and patience. At present, insurance companies are mainly competing to limit the prices of insurance policies and the costs of health care services. The quality of the care is still of limited influence in the purchasing process. This applies to both curative and long-term care. Regulated competition assumes that insurers and consumers alike have complete, transparent information available on the quality as well as the price of health care products. However, suitable information about quality of care, and about patient outcomes in particular, is still lacking.
Concerns about the availability of data on health care and public health
The data currently available cannot yet be adequately analysed in terms of demographic characteristics such as socioeconomic status and ethnic background. That makes it difficult to judge whether all people have equal health care opportunities (equity). Much of the current information about health care providers is based on self-reports, and the quality of that information is subject to dispute. There are also concerns about the continuity of some important data registries; failure to maintain these would threaten the ability to monitor developments in the health care system. Subsequent editions of the DHCPR will further assess the trends identified in the present report. They will also provide more detailed analysis of the effects of the recent health care reforms.
For ‘government at a distance’, reliable data is of the essence. The report ends by pointing out the current gaps in the available information systems and knowledge.
The commission
The Dutch Health Care Performance Report (DHCPR) has been compiled by RIVM and was commissioned by the Ministry of Health, Welfare and Sport (further referred to as the Ministry of Health).
The DHCPR comprises two informative products:
• The summarising report the ‘DHCPR’, which with the help of roughly 125 indicators describes the quality, accessibility and costs of Dutch health care from a macro-perspective.
• The Dutch website http://www.gezondheidszorgbalans.nl, which, besides the findings about the performance levels of Dutch health care per indicator used, also provides a scientific justification.
The approach
For the purpose of the DHCPR-series, the Ministry of Health provided a large set of indicator domains that are crucial for assessing the performance achieved and the actual status of health care. RIVM ranked the set of indicator domains across the three objectives for which the Ministry of Health bears overall system responsibility: quality, accessibility and costs (Westert, 2004).
The DHCPR makes use of a conceptual framework for performance indicators (see Figure 1.1) that is
1
Background and
approach
Health care is defined as activities aimed at alleviating, reducing, compensating and/or preventing deficiencies in the health status or autonomy of individuals (Van der Meer and Schouten, 1997). In this report, health care includes preventive, curative and care services for both somatic and mental conditions and complaints. Welfare has not been included in the DHCPR.
based on the report Bakens zetten (Positioning beacons; Delnoij et al., 2002) and an extensive international literature review (Arah et al., 2005 and 2006). In the applied framework, health care is divided into four specific health care needs: staying healthy (prevention), getting better (cure), living independently with a chronic illness or disability (long-term care), and end-of-life care. For each separate care demand, health care performance is presented and analysed for the aspects quality, accessibility and affordability. The indicator framework developed and used is well accepted internationally. The Organisation for Economic Co-operation and Development (OECD) has adopted this framework for the further development of international comparisons of health care system performance (OECD, 2009).
Figure 1.1: Conceptual framework of health care system performance Health
How healthy are the Dutch?
Healthcare system performance
Non-healthcare determinants of health
Healthcare needs
Effectiveness Safety
Quality
Efficiency
Equity
Design and contextual information specific to the Dutch healthcare system that is necessary for interpreting health system performance
Responsiveness Accessibility
Access Costs
Dimensions of Healthcare Performance
Staying healty Getting better Living with illness or disability End-of-life care
The structure of the Dutch Health Care Performance Report
The DHCPR has a graded structure. The first layer consists of the three system objectives, namely quality, accessibility and controlled cost development and efficiency. These three objectives are then subdivided into thirteen indicator domains based on (international) literature.
Indicator domains Quality
• Effectiveness, Safety, Co-ordination, Responsiveness Access
• Financial access, Geographical access, Timeliness, Access according to needs, Availability of personnel, Freedom of choice
Costs and efficiency
• - Health care expenditure, Efficiency, Financial position of care providers and health insurers
System goals
The Ministry of Health has system responsibility for three major interests: quality, accessibility and affordability. One of the ways to attain this is through a regulated market.
Quality
The government has a duty to safeguard the public interest of a good-quality health care and has tools to do so. By means of the Quality of Care Institutions Act (Kwaliteitswet zorginstellingen (Kzi)) and the Health Care Professions Act (Wet beroepen individuele gezondheidszorg (BIG)), the legislator puts health care providers / professionals under a number of obligations. They must provide appropriate care, i.e. organise their work, provide personnel and equipment, and allocate responsibilities, such that this does or should lead to appropriate care. They should systematically monitor, control and improve quality of care. And, they should account for their actions in this respect. So, it is primarily the responsibility of caregivers to deliver good-quality care. Whether they act in accordance with this responsibility, is monitored by the Health Care Inspectorate (IGZ) in line with both acts. Quality involves:
• Effectiveness • Safety • Co-ordination • Responsiveness.
Access
The government is committed to equal access to health care for all people irrespective of their lifestyle (VWS, 2005a). The Health Insurance Act (Zorgverzekeringswet (Zvw)) provides tools to ensure basic access. Access involves:
• Financial access • Geographical access • Timeliness
• Access according to needs • Availability of personnel • Freedom of choice. Health expenditure and efficiency
Controlled cost development and an efficient health care system are central to the Health Care Market Regulation Act (Wet marktordening gezondheidszorg (Wmg)), introduced in 2006. As part of the system reforms, rules for the regulation of the market and its supervision are laid down in this act. A responsible expenditure growth ensures that health care remains affordable for society and does not heap pressure on public resources.
Improved efficiency can help to control expenditure, but it goes beyond that. Efficiency is about the relationship between the costs and revenues of the care provided. A further increase in expenditure can be effective, provided the yields are accordingly. In the new health system the insured and insurers have an important role to play in the area of efficiency: they are expected to choose care with the most favourable price-quality ratio.
Health care expenditures and efficiency involve: • Health care expenditures
• Efficiency
• Financial position of health care providers and health insurers.
Tension between system goals
Between different system goals, tensions may exist, for example between a controlled cost development and a necessary, good quality, universally accessible health care and between risk solidarity and freedom of choice (VWS, 2001). Regarding the former, it is put forward that quality demands should not increase the price such that the affordability of care is strained. The health insurer will have to assess the reasona-bleness of the desired quality improvement. The supervisor of the insurers will monitor whether the insurers act in accordance with this mission (VWS, 2002a). More in general is chosen for guaranteeing minimal levels. Quality and accessibility need to reach a sufficient level and to be in accordance with expenditures. Quality supersedes accessibility (VWS, 2008a).
To avoid adverse effects of market forces and to achieve the system goals of accessibility and affordabil-ity, conditions must be formulated as to the insurers’ duty to accept, risk equalisation, premium levels and health insurance coverage (VWS, 2004b). The Health Insurance Act offers appropriate tools for doing so.
Indicators
For each indicator domain, indicators were selected that have a signalling function for the domain concerned. An indicator is a measurable aspect of care that gives an indication of a specific performance aspect, such as quality of care (Colsen and Casparie, 1995). The selection of indicators is primarily based on (a combination of) two criteria:
• the intrinsic relationship between the indicator and a specific care aspect to be investigated, • the availability of data.
Each indicator eventually leads to a key finding.
Connecting themes
In the third DHCPR the following connecting themes are addressed: efficiency and the effects of health system reforms. The themes link system goals with indicator domains.
The theme ‘efficiency’ considers whether an optimal output is produced with the resources invested. Accordingly this theme attempts to link the public goals of ‘affordability’ and ‘quality’. Are the Dutch getting value for money? The theme is to be found in Section 4.3, as part of the chapter on health expenditures.
The second theme addresses the health system reforms. In the present DHCPR, the effects of the health insurance system reforms, which were introduced 1 January 2006, are evaluated. Since the first DHCPR (2006) described the situation in 2004 and the second DHCPR (2008) the situation in 2006/2007, the present DHCPR attempts to provide an answer to the question about what effects these system reforms have had to date on the quality, accessibility and affordability of the entire health system, seen from a macro perspective.
The purpose of the Dutch Health Care Performance Report
The aim of the DHCPR is to make a contribution to the strategic decision-making of the Ministry of Health in the area of health care. To realize this objective the DHCPR attempts, in accordance with its commission, to paint a broad picture, to present trends over time, to compare the Netherlands to other countries and where possible to state (policy) standards and benchmark data, so that policymakers have the information they need to make their own assessment of the performance of the Dutch health system.
An important requirement of the DHCPR is to minimize the number of indicators used. Consequently, during the selection of the indicators not all of the data available in the Netherlands were included. Therefore the DHCPR mainly has a signalling function at a global level, without fully considering all specific components and aspects of the health system. The ultimate goal of presenting all these measurements is to create a representative picture of the general system performance of the Dutch health system, in line with the system objectives of the Ministry of Health policy.
Outline of the Dutch Health Care Performance Report
Chapters 2, 3 and 4 describe the three system objectives, namely quality, access and health care expendi-tures and efficiency. Each chapter starts with a section ‘What is…’ (Sections 2.1; 3.1; 4.1), in which quality, access and cost of care are defined and the indicator domains are explained. The consistent arrangement of the sections across the indicator domains in these three chapters is:
• Key findings
• How indicators are used to determine performance of a specific aspect • The current state of affairs in measurements and counts
• Conclusion.
The thirteen indicator domains are eventually considered in nineteen sections. In several cases a given indicator domain is further divided, as is the case for effectiveness and timeliness.
Chapter 5 addresses the connecting theme ‘The effects of the health system reforms’. The concluding chapter, Chapter 6, describes improvements and gaps in the provision of the information needed and the usefulness of the DHCPR, and looks ahead to the next DHCPR.
2.1 What is quality of care?
Good-quality care is one of the three health care system goals, next to accessibility and affordability. There are various definitions of the concept of quality. The Institute of Medicine (IOM) defines quality as “doing the right thing, at the right time, in the right way, for the right person, and having the best possible results” (IOM, 2001). This interpretation refers to a number of concepts, which are considered in the literature as essential to quality: effectiveness, safety, timeliness and responsiveness (Arah, 2005). The Care Institutions Quality Act (Kwaliteitswet Zorginstellingen (Kzi)) also uses concepts like effectiveness (efficacy) and patient orientation.
The government has formulated three priorities for improving the quality of care: to make quality transparent and measurable, to increase the influence of patients and clients and to make health care safer. Hence these issues will be extensively discussed in the present DHCPR. To make quality more transparent and measurable various important initiatives have been taken in recent years. The indicators in the DHCPR are in line with these initiatives. Examples are the indicators used by nursing homes, residential homes and home care in the framework of the standards for responsible care, the OECD health indicators and information about client experiences in health care collected by means of the so-called CQ-index questionnaires.
As is discussed in Chapter 5, the transparency of quality of care is also a crucial prerequisite for the health care system to function properly. Indeed, one of the major reasons for the introduction of the Health Insurance Act (Zorgverzekeringswet (Zvw)) in 2006 was that health care users need to make informed choices as to health care providers and health insurance policies and that health insurers purchase care
2
on a critical basis. Since the late 1990s, more and more initiatives have been taken to improve the measurability and transparency of quality of care. The approach taken depends strongly on the goal. In 2007 the Health Care Transparency Programme (Zichtbare Zorg) was launched. In the framework of this programme, various indicator sets have been developed or are under development that will yield information for health care users, health insurers and government. Depending on the goals the various parties pursue in making quality of care transparent, we distinguish:
• choice information (for health care users) • purchasing information (for insurers)
• accounting information (for Health Care Inspectorate, policy makers and politics) • steering information (for health care providers and policy makers)
• referral information (for health care providers).
These indicator sets tend to be organised along sectoral lines: the quality of a nursing home, a hospital, a Municipal Health Service, etc. This is done for practical reasons; a care user must be able to look for a specific hospital and any health care institution must be accountable to the Health Care Inspectorate for the quality of care it delivers. Although there are very good reasons for adopting a sectoral classification, there are often multiple health care providers and institutions involved in the care process of an indi-vidual patient. Sometimes the various forms of care are in line with one another, sometimes they run parallel and they often do both. Patients do not always experience care as organised in sectors. To be able to say something about the quality of the care process, it is important to use intersectoral indicators as well.
The DHCPR does not seek to measure the performance of individual care providers or institutions, but rather to present a broad picture of the performance of the health system as a whole with the care user playing a pivotal role in it. So, rather than choosing a sectoral approach, this chapter uses a format that is based on intersectoral concepts such as safety, co-ordination, and responsiveness. When addressing effectiveness of care, we do distinguish between curative care and long-term care. The reason is that the goal of curative care is clearly different from that of long-term care.
Outline of the chapter
• Effectiveness of prevention (Section 2.2) • Effectiveness of curative care (Section 2.3) • Effectiveness of long-term care (Section 2.4) • Patient safety (Section 2.5)
• Responsiveness (Section 2.6)
• Co-ordination and co-operation (Section 2.7) • Palliative care (Section 2.8)
The indicator domains are not strictly defined or mutually exclusive. It goes without saying that unsafe care is usually less effective and that a misalignment of care processes within a care pathway is by definition not demand-oriented. Hence, the classification of an indicator under a specific domain may be inspired by pragmatic reasons.
Finally, we would like to point out some differences with the previous DHCPR. Because the
DHCPR is a monitoring tool, we strive for continuity. At the same time, system reforms are an ongoing process and we aim for continuous improvement. Hence, the old format was somewhat adapted to accommodate for these seemingly contradictory aims. Two indicator domains were dropped, namely ‘the effectiveness of mental health care and addiction care’ and ‘innovation in health care’. These issues were incorporated in the sections on effectiveness, patient safety, etc. Innovation is discussed in Section 4.3 on efficiency. Two subjects that were not addressed as separate issues in the previous DHCPRs are ‘co-ordi-nation and co-operation’ and ‘responsiveness’.
2.2 Effectiveness of prevention
Key findings
• The uptake of preventive screening has been high and is still rising. More than eight out of ten women of the target group participated in breast cancer screening, two thirds in cervical cancer screening and almost all newborns had a heel prick
• The vaccination rates ranged from 91% for the acellular pertussis vaccine to 96% for the meningo-coccal C vaccine. Still, the vaccination rate in some provinces was below the WHO standard of 90% • The number of people receiving preventive help for depression doubled between 2005 and 2007 • Over 18% of primary schools and 31% of secondary schools participated in the prevention
programme ‘The healthy school and drugs’
• The number of smokers has been slowly decreasing; by 2008 almost 27% of the population smoked. Approximately 13% of the population drank too much
• The percentage of children under 16 years of age that sometimes drank alcohol halved in eight years time
• Although obesity was less prevalent in the Netherlands than in many other European countries, almost 47% of the population was overweight. This percentage has been quite stable
• Almost all children under five years of age were in contact with preventive child health care; rates ranged from 100% in the first year of life to 80.6% in the fifth year of life
How we determine the effectiveness of prevention
The aim of prevention is to ensure that people remain healthy by promoting and protecting health and to prevent diseases and disorders or to detect them in as early a stage as possible, so that treatment can be started sooner. Prevention also includes the prevention of disease complications. The priorities of the prevention policy are described in the prevention memorandum Kiezen voor gezond leven (Opting for a healthy life; VWS, 2007a) and the vision report on prevention Gezond zijn, gezond blijven (Being healthy and staying healthy; VWS, 2007b). The greatest health effects are expected for the priorities that were chosen as spearheads: smoking, harmful alcohol use, obesity, diabetes and depression. The vision report on prevention states that the importance of prevention is not just to be found in health gains but also in being able to make a positive contribution to society by active participation. A second point the report makes, is that prevention ensures the viability of the health care system.
Indicators
• Participation rates of screening programmes • breast cancer
• cervical cancer • heel prick test
• Vaccination rates of the National Vaccination Programme • Uptake of preventive interventions for depression
• Percentage of schools that applied for the project ‘The healthy school and drugs’ • Lifestyle
• smoking • drinking alcohol • obesity
• Coverage of preventive child health care • Infant mortality
The current state of affairs
The uptake of preventive screening has been high and is still rising. More than eight out of ten women of the target group participated in breast cancer screening, two thirds in cervical cancer screening and almost all newborns had a heel prick
Table 2.2.1 shows the uptake of preventive screening programmes since 2001: the population-based breast cancer and cervical cancer screening programmes and the heel prick screening.
The uptake of the screening programme for breast cancer has increased slightly over the years. In 2007, 82.4% of the target group (women aged 50 to 75 years) had themselves screened. The EU set a participa-tion rate of 75% as standard, the Ministry of Health aims for a participaparticipa-tion rate of 80% (Rijksbegroting, 2008). Both standards are met by the Netherlands.
Cervical cancer is caused by an infection with the human papilloma virus (HPV). A precursor of cervical cancer can be detected by a Pap smear. Two thirds (66%) of women in the target group had a Pap smear in 2006 as part of the cervical cancer screening programme. This participation rate is relatively stable. The Ministry of Health is committed to a participation of more than 65.6% in 2008 and 2011 (Rijksbegroting, 2008). It is difficult to make international comparisons, because the age limits of the target group and the frequency of screening vary by country.
Although it is certain that cervical cancer and specifically its precursors can be detected by a smear, its effect on the incidence of cervical cancer has never been proven in a randomised trial. However, the incidence of cervical cancer in the period 1989-2003 decreased by almost one third, which is most likely due to the treatment of pre-cancerous stages detected by screening. More cases of cervical cancer could probably be detected, when the participation rate is increased and when an HPV test is used (Ronco et al., 2010). One third of the women who get cervical cancer never had a cervical smear test or had it a very long time ago (Van Kemenade and Casparie, 2009).
Table 2.2.1: Participation rates of screening programmes (%), 2001-2007
2001 2002 2003 2004 2005 2006 2007
Breast cancer screening (women aged 50-75 years)
78.7 79.1 80.8 80.8 81.7 81.8 82.4
Cervical cancer screening (women aged 30-60 years)
62 64 66 65,5 65.5 66
Heel prick test (neonates) 99.9 99.9 99.9 99.9 99.9 99.9 99.9
(Source: LETB, 2008; NPK, 2008 (LETB-data); Lanting et al., 2008)
Figure 2.2.1 shows the percentages of women screened for cervical cancer and breast cancer for a number of countries for which these figures were available. The percentages for the Netherlands differ somewhat from those in the table, because the age groups on which the figures are based differ somewhat. For cervical cancer screening the age group is 20 to 69 years and for breast cancer screening 50 to 69 years. Both screening participation rates were high in the Netherlands. As to participation in breast cancer screening the Netherlands is in second place, the participation rates for cervical cancer screening were slightly higher in the United Kingdom and New Zealand.
Figure 2.2.1: Particpation rates for breast cancer screening (women aged 50-69) and for cervical cancer screening (women aged 20-69) (%), most recent measurement year 2005-2007
0 20 40 60 80 100 Belgium Italy Australia New Zealand United Kingdom Ireland Netherlands Finland Percentage
Breast cancer screening Cervical cancer screening
(Source: OECD Health Data)
In 2007, almost all newborns were given a heel prick on or before the age of eight days. With a participa-tion rate of 99.9%, the heel prick screening is particularly successful. The percentage is well above the norm of 90% as stated in the heel prick guideline and the target of 99% of the Ministry of Health. In 2007, the heel prick was extended and now screens for 17 diseases. This extension has had no effect on the participation rate.
The vaccination rates ranged from 91% for the acellular pertussis vaccine to 96% for the meningococ-cal C vaccine. Still, the vaccination rate in some provinces was below the WHO standard of 90% The National Immunisation Programme (Rijksvaccinatieprogramma (RVP)) focuses on the prevention of infectious diseases and its complications. Most of these diseases constituted a major public health problem in the past and they almost disappeared with the advent of vaccinations. The vaccines are administered in several doses according to a schedule. For complete protection, it is important that the entire series is completed. The number of vaccinations varies from one for meningococcal C to five for, for example, diphtheria, tetanus and polio (DTP). The rates we present here concern the percentages of the target groups who have completed the series.
Figure 2.2.2 shows the percentages completed vaccination programmes for five vaccines. On average, the vaccination rate is high for all vaccines. Moreover, the coverage of a number of vaccines has increased slightly in recent years, as the figure shows.
In 2008, the rates of completed series ranged from 91% for the acellular pertussis vaccine to 96% for the meningococcal C vaccine. Although the vaccination rate in the Netherlands is usually sufficient, this is not exceptional in international terms. Virtually all OECD countries have high vaccination rates. For DTP, for example, the rate varied between 83% in Austria to more than 99% in Poland, Hungary and Sweden (OECD, 2008a).
Next to the protection of individual children, the RVP also seeks to further the collective interest by offering protection at the population level (preventing others from being infected). According to the WHO, a vaccination rate of at least 90% is needed for an adequate protection of the population. The national figures amply meet this standard, but if we look at the regional level, we see that some prov-inces fail to meet this standard. The provprov-inces of Zeeland and Gelderland do not meet the WHO standard for the diphtheria, pertussis, tetanus and polio (DKTP) vaccine. The provinces of Zeeland, Gelderland and Flevoland do not meet the WHO standard for the mumps, measles and rubella (BMR) vaccine. The lower coverage in some regions may almost certainly be explained by the clustering of people who because of religious reasons are against vaccinating (Zwakhals and Van Lier, 2009).
Figure 2.2.2: Fully completed vaccination programmes for various vaccines (%), 2006-2008
Percentage 86 88 90 92 94 96 98 100 2006 2007 2008 HIB MD AP DTP MMR
(Source: Van Lier et al., 2008)
HIB = haemophilus influenzae B, MD = meningococcal disease, AP = acellular pertussis, DTP = diphtheria, tetanus and polio, MMR = measles, mumps and rubella
In 2009, the HPV cervical cancer vaccine was added to the RVP. The target group for the HPV vaccine are 12 to 16 years old girls. These girls get a series of three vaccinations. So far, the turnout for the vaccination with the HPV vaccine, especially in comparison with other vaccines, has been low. Half of the girls who belonged to the target group obtained an initial vaccination, 49% a second vaccination and 45% completed the series. Ninety seven percent of the girls who were administered the first vaccination also got the second vaccination and 89% the third as well. So, almost 90% of the girls who started the series of vaccinations completed it (RIVM / NVI, 2009).
The number of people receiving preventive help for depression doubled between 2005 and 2007 Approximately 350,000 people per year suffer from depression (Meijer et al., 2006). This involves high social costs, both in terms of human suffering and in financial terms (Smith, 2007). In 2005, the cost of care for people with depression amounted to 773 million euros, this is excluding the cost of loss of productivity. The government has given depression a spearhead status and has set itself the target to
increase the reach of indicated preventive interventions. In 2007, more than 8000 people received indicated preventive help for depression (De Jonge and De Ruiter, 2009). That is about 2% of the people who eventually develop depression. Although the reach is still very limited, it has nearly doubled since 2005. For most of the preventive interventions it is unclear whether they are effective. Nevertheless, there are some interventions that are sufficiently evidence-based for them to be applied at a large scale. Several studies have more or less proven the effectiveness of the programme In de put, uit de put (In the doldrum, out of the doldrum). Effective denotes that the programmes can prevent depression or at least reduce the symptoms (Cuijpers et al., 2008; Van den Berg and Schoemaker, 2010). More than half of mental health care facilities offer the prevention programme ‘In the doldrum, out of the doldrum’ (De Jonge and De Ruiter, 2009). The programme is one of the three interventions that have been granted the ‘proven to be effective’ status by the independent Accreditation Commission Interventions under the auspices of RIVM and the Netherlands Youth Institute (Loket gezond leven, 2010).
Over 18% of primary schools and 31% of secondary schools participated in the prevention pro-gramme ‘The healthy school and drugs’
De gezonde school en genotmiddelen (The healthy school and drugs) is a two-tier prevention programme; one programme is aimed at primary schools and one is aimed at secondary schools. In elementary education, the project aims to prevent grade 7 and 8 pupils from starting to use tobacco and alcohol. In secondary education, the goal is described as ‘the students are willing and able to assess the risks of drugs and act responsibly to ensure their own health and that of others’.
In 2006 / 2007, 1823 primary schools had put in an application for this project, i.e. 18.3% of all primary schools, as well as 558 secondary schools, i.e. 30.6% of all secondary schools. The number of applications varies greatly across regions.
The effectiveness of this project is still subject of investigation. Effects have been reported in terms of knowledge and behaviour in dealing with drugs (Cuijpers et al., 2002). The programme was granted the status of ‘theoretically well-founded’ by the independent Accreditation Commission Interventions (Loket gezond leven, 2010).
The number of smokers has been slowly decreasing; by 2008 almost 27% of the population smoked. Approximately 13% of the population drank too much
Smoking
Figure 2.2.3 shows the percentage of smokers in the population for the period 2001-2008. In 2008, 26.7% of the population smoked. That is less than in 2006. There are more men who smoke than women, 29.8% and 23.8% respectively. Although the decline in recent years has not been spectacular, it has been statistically significant though. The ambition to reduce the proportion of smokers to 20% by 2010, as stated in the Prevention Report (VWS, 2007a), has not been fulfilled.
When viewed over a longer period of time, a decreasing trend in the number of smokers is evident. Fifty years ago, 60% of the population over 15 years old smoked, in 2008 this proportion had more than halved. Since the 1980s, the number of smokers has been on the decrease, but that decrease goes at a very slow pace and it is small with the occasional one percent decrease alternated by periods of several years in which the proportion of smokers remains stable.
Figure 2.2.3: Men and women who smoke or drink heavily (%), 2001-2008
Percentage 0 5 10 15 20 25 30 35 40 2001 2002 2003 2004 2005 2006 2007 2008
Men smoking Women smoking Men drinking > 3 glasses a day Women drinking > 2 glasses a day
(Source: Stivoro, 2010; CBS, 2009a)
Figure 2.2.4 shows that there are still a lot of people who smoke in the Netherlands compared with other countries. The proportion in this figure is slightly higher than that in Figure 2.2.2, because the OECD uses an age limit of 15 years. Among European countries, only Turkey and Greece have higher smoking rates than the Netherlands. The large number of smokers in the Netherlands explains to a large extent the relatively high prevalence of lung cancer compared with many other countries.
Figure 2.2.4: Smokers of 15 years and older (%), 2008; the Netherlands, United States, Western European avarage, European countries with lowest and highest number of smokers
Percentage 0 5 10 15 20 25 30 35 40 45
Sweden Western Europe1 Netherlands Greece United States
(Source: OECD Health Data)
1 EU-15, Norway and Switzerland
Alcohol
In recent years harmful alcohol consumption among adults has remained fairly constant. Although alcohol consumption is relatively low compared to many other countries, it is nevertheless responsible for 1% of total mortality (about 1,900 persons) and for 4.5% of the total disease burden in the
Netherlands (Busch et al., 2007). In 2008, 14.1% of the male population aged 12 years and over drank more than three drinks per day. This level of alcohol use is detrimental to health. In 2007, 10.7% of women drank more than two drinks per day. Figures for women for 2008 are not yet available. The percentage of children under 16 years of age that sometimes drank alcohol halved in eight years time
As the human brain is developing till the age of approximately 23 years, alcohol is much more damaging to teenagers than to adults. Through campaigns and legislation the government has been trying to prevent children under the age of 16 from starting to drink alcohol. That seems to have an effect. In 2008, 15% of children under 16 said to drink alcohol sometimes. In recent years this percentage has decreased significantly. In 2000, more than 30% of children under 16 sometimes drank alcohol, which is twice as much. After the age of 16, the number of drinkers increased rapidly; 47% of young people under 18 said to drink alcohol sometimes.
Figure 2.2.5: 12-18 year olds who reported that they drank alcohol occassionally (%), 2000-2008 Percentage 0 20 40 60 80 100 2000 2001 2002 2003 2004 2005 2006 2007 2008
Up to 16 years old Up to 18 years old
(Source: CBS Statline, 2009a)
Although obesity was less prevalent in the Netherlands than in many other European countries, almost 47% of the population was overweight. This percentage has been quite stable
In 2008, 46.9% of the population of 20 years and older was overweight. Overweight is defined as a BMI of 25 or higher. Men are more often overweight than women. Just over half (52%) of the men and 41% of the women have excess weight.
In the past eight years, the percentage of overweight people has remained fairly constant. Approximately one quarter of overweight people (11% of the population) has severe obesity, that is a BMI of 30 or higher. The percentage of obese people in the Netherlands is low compared with most other countries. Figure 2.2.6 shows that countries like the United Kingdom and the United States have significantly higher rates. Only Switzerland and Norway show significantly lower rates.
In the period 1997-2004, the prevalence of overweight rose from 8.3% to 10.0% in 5-year-old boys and from 9% to 14.6% in 5-year-old girls. For 10-year-olds, the prevalence in boys rose from 6.9% to 14.9% and in girls from 13.4% to 16.9% (Van den Hurk et al., 2006). The latest figures for 2- to 20-year-olds indicate a decline in the prevalence of overweight. In particular, the number of obese children decreased from 3.1% to 2.1% between 2008 and 2009 (CBS Statline, 2010a).
Figure 2.2.6: People who are seriously overweight (BMI>30) (%), 2007; the Netherlands, United States, Western European average, European countries with highest and lowest percentage
Percentage 0 5 10 15 20 25 30 35 40
Switzerland Netherlands Western Europe1 United Kingdom United States
(Source: OECD, 2009)
1 EU-15, Norway and Switzerland
Besides a healthy diet, enough exercise is essential to combat obesity. The Dutch Standard for Healthy Exercise (Nederlandse Norm Gezond Bewegen (NNGB)) is a standard for the amount of exercise that people of different age groups should have. For 18- to 55-year-old adults, for example, the standard is half an hour of moderate intensity exercise per day, five days a week. Figure 2.2.7 shows the percentages of men and women who were slightly overweight and failed to meet the healthy exercise standard in the period 2001-2008. More than four out of ten people (44%) did not exercise enough. There was little difference in the level of exercise between men and women. In the period 2001-2008, the percentage of people who exercised increased slightly; in 2001, 48% did not meet the exercise standard (CBS Statline, 2009b). Physical inactivity produces 4.1% of the total disease burden in the Netherlands (De Hollander et al., 2006).
Figure 2.2.7: Overweight men and women and men and women who do not meet the healthy exercise standard (%), 2001-2008 Percentage 0 10 20 30 40 50 60 2001 2002 2003 2004 2005 2006 2007 2008
Men who do not meet the healthy exercise standard Women who do not meet the healthy exercise standard
Overweight men Overweight women
(Source: CBS Statline, 2009b)
Almost all children under five years of age were in contact with preventive child health care; rates ranged from 100% in the first year of life to 80.6% in the fifth year of life
In the first year of life all children in the Netherlands are seen by preventive child health care at the child health centre. Thereafter, this percentage decreases slightly per year of life. In 2008, 98.6% of children in their second year of life visited the child health centre and 80.6% of children in their fifth year of life. Figure 2.2.8 shows the proportion of children that had contact with the child health centre in the period 2000-2008. The frequency of visits in the first three years of life seemed to be relatively stable. For 3- and 4-year-olds the pattern was somewhat more erratic.
Figure 2.2.8: Children who visited the child health centre, by age (%), 2000-2008 Percentage 50 60 70 80 90 100 2000 2001 2002 2003 2004 2005 2006 2007 2008
0 year 1 year 2 year 3 year 4 year
(Source: CBS Statline, 2009c)
In 2008, the infant mortality rate further declined to 3.8 per 1000 live births
In 2008, 184,634 children were born alive in the Netherlands and 698 children died in the first year of life (CBS Statline, 2009d). So, the infant mortality rate continued to fall. Figure 2.2.9 presents the infant mortality rate for the period 2001-2008. In 2005 the infant mortality rate was still 4.9 per 1000 live births, in 2008 this had fallen to 3.8 per 1000 live births.
The infant mortality rate reflects the effects of the economic and social situation on the health of mothers and newborn babies (Masuy-Stroobant and Gourbin, 1995). It is also an indicator for the effectiveness of the health care system (De Hollander et al., 2006).
The Netherlands has exchanged its former top position in the EU, with a low infant mortality (number of mortalities during the first year of life) and a low perinatal mortality (number of stillborns after a pregnancy of more than 24 or 28 weeks and number of deaths during the first week of life), after the 1990s for a position that is under the EU average (Waelput et al., 2006). Perinatal mortality in the Netherlands levelled off during the second half of the 1990s. This levelling off of the decrease can be seen in several high-income countries. Some reasons for the high infant mortality rate in the Netherlands are the relatively high age of mothers when giving birth and the associated increased risk of multiple births, the proportion of births among non-native Dutch mothers and the smoking by mothers (Waelput and Achterberg, 2006b). A recent study revealed that there is no relation between the high number of home births in the Netherlands and infant mortality (De Jonge et al., 2009).
The latest OECD Health Data statistics, which we use for international comparison, date from 2006. Figure 2.2.9 suggests that infant mortality rate in the Netherlands is currently at par with the European average.
Figure 2.2.9: Infant mortality per 1000 infants, 2001-2008; the Netherlands, Finland, United Kingdom, Western European average, United States
0 1 2 3 4 5 6 7 8 2001 2002 2003 2004 2005 2006 2007 2008
Number per 1000 infants
United States United Kingdom Netherlands Western Europe1 Finland
(Source: OECD Health Data; CBS Statline, 2009d)
1 EU-15, Norway and Switzerland
Conclusion
As in most Western countries, various forms of unhealthy behaviour are quite common in the Netherlands: smoking, drinking alcohol, eating unhealthy food and little exercising. The adverse consequences show in the form of chronic diseases, such as diabetes and COPD, lung cancer and obesity. Although these matters can still be regarded as serious public health problems, there is much positive to report. The number of smokers has been decreasing slowly but steadily. More and more people are exercising. The obesity problem in the Netherlands is (still) limited compared to many other countries, though almost half of the population is overweight. Although studies have shown that Dutch young people drink a lot of alcohol compared with their peers in other Western European countries (OECD, 2008a), the number of children under 16 years of age that starts drinking has halved since 2000. In addition, many schools pay attention to the use of drugs; more and more schools participate in a prevention programme to raise children’s awareness of the dangers of drug use.
Furthermore, there are positive results to report on the uptake of screening programmes. The
Netherlands is in the lead internationally. Participation rates are high and are even increasing. This might explain the relatively favourable survival rates for breast cancer and cervical cancer (see Section 2.3). Infant mortality has been decreasing again since 2005, and virtually all infants are regularly seen at the child health centre.