RIVM rapport 500025002/2005
Embedding soil quality in land-use planning
A.P. van Wezel, A.G.G. van der Weijden, H.J. van Wijnen, Ch. Mulder
Contact: HJ van Wijnen
Laboratory for Ecological Risk Assessment harm.van.wijnen@rivm.nl
Dit onderzoek werd verricht in opdracht en ten laste van directie MNP, in het kader van project 500025, Systeemanalyse landelijk gebied, mijlpaal relatie bodemgebruik en -kwaliteit
Het rapport in het kort
De rol van bodemkwaliteit in ruimtelijke ordening
Veranderingen in bodemgebruik zijn op grote schaal voorzien in Nederland. De kwaliteit van de bodem speelt echter nauwelijks een rol in de ruimtelijke ordening. Wij analyseerden de relatie tussen bodemgebruik en bodemkwaliteit, met gebruik van ecologische data en op nationaal schaalniveau.
Ondanks grootschalige veranderingen in bodemgebruik, is er nog steeds een verband tussen bodemtype en bodemgebruik. Bodembeheer, historisch bodemgebruik en de geografische situering beïnvloeden deze relatie, maar ook de invloed van bodemgebruik op verschillende bodemeigenschappen is herkenbaar. Zo wordt bodembiodiversiteit beïnvloed door de intensiteit van bodemgebruik door de landbouw. Bodemgebruik is niet altijd daar gesitueerd waar de voordelen in termen van opbrengst hoog zijn. Minder dan 20% van de akkerbouw en veeteelt is gesitueerd op ongeschikte bodem, terwijl dat geldt voor meer dan 40% van de bosbouw.
Gebiedsgericht milieubeleid biedt veel mogelijkheden om te differentiëren naar bodemgebruik, waardoor het mogelijk wordt het bodemgebruik af te stemmen op de (gewenste) bodemkwaliteit.
Trefwoorden: bodemkwaliteit; landgebruik; bodembeheer; geschiktheid; bodemeigenschappen
Abstract
Embedding soil quality in land-use planning
Changes in land use in the Netherlands are anticipated on a large scale. Soil quality, however, hardly plays a role in spatial planning, which was reason enough to analyse the relationship between land use and soil quality on a national scale using ecological data. Despite major changes in land use, the strong linkage between land use and soil type was seen to continue. Soil management practices, historical land use and the geographical situation influence the relationship between land use and soil properties; the influence of land use on several soil properties is also discernable. Thus soil biodiversity can be said to be influenced by farming intensity. Land use is not always situated in areas where benefits in terms of yield are high. Less than 20% of the arable farming and pasture is situated on unsuitable soil, whereas over 40% of the forests grow on unsuitable soil. Region-specific environmental policy offers many possibilities for differentiation according to land use. It is also possible to match occurring soil quality to both existing and desired land use.
Voorwoord
Het hier gerapporteerde werk is tot stand gekomen binnen het (deel) project ‘Integraal Bodembeheer’. De betrokkenheid van de directie ‘Bodem, Water en Landelijk Gebied’ van het Ministerie van VROM bij het project was groot. We willen hier vooral Niek de Wit, Jelka Appelman en Jan Roels bedanken voor hun input. Frans Lips en Onno Knol zijn wij dank verschuldigd voor hun bijdragen in de discussie en voorbereiding van de data analyse. Tenslotte bedanken we Peter C. de Ruiter voor de rol die hij heeft gespeeld in de begeleiding van het afstudeeronderzoek van Linda van der Weijden, dat mede een basis vormde voor deze rapportage. Delen van dit rapport zijn eerder gepubliceerd in Mulder et al. (1).
Contents
Samenvatting 6
Summary 8
1. Introduction 9
2. Material and Methods 12
2.1 Data 12
2.2 Geo-statistical analysis 12
2.3 Coincidence of actual land-use and suitability of land-use considering criteria of yield 12
3. Results 15
3.1 Relation between land-use and soil type in the Netherlands 15
3.2 Relation between land-use and individual soil properties 16
3.3 Influence of the intensity of land-use on biodiversity of nematodes 21
3.4 Requirements of land-use towards soil quality 21
4. Discussion 24
4.1 Data and method 24
4.2 Implications in spatial planning and management of soil quality 25
References 26
Annex 1. Soil property values per soil type 29
Annex 2. Soil property values per land-use type 30
Samenvatting
Het gebruik van de ruimte in Nederland is intensief. Veranderingen in bodemgebruik komen veelvuldig voor, en zijn ook voor de komende periode op grote schaal voorzien. De kwaliteit van de bodem, als substraat voor bodemgebruik, speelt nauwelijks een expliciete rol in de ruimtelijke ordening. Toch kunnen verschillende problemen rond bodemkwaliteit in relatie tot het bodemgebruik in het landelijk gebied in Nederland worden genoemd. Deels gebaseerd op de Europese bodemstrategie in wording (COM 2002 179), wordt een indicatorset voor bodemkwaliteit voorgesteld. Deze indicatoren belichten de verschillende functies van de bodem voor ecologie en menselijk gebruik. Het doel van deze studie is het in kaart brengen van de relaties tussen bodemgebruik en bodemkwaliteit om in de toekomst beter gefundeerde bodemgebruiksveranderingen te kunnen toepassen.
In deze rapportage is de relatie tussen bodemgebruik en bodemkwaliteit geanalyseerd, voornamelijk gebaseerd op gegevens uit het ecologische domein en op nationale schaal. Het actuele bodemgebruik in Nederland is beschreven door middel van de dataset ‘Landelijk Grondgebruik Nederland’ (LGN) van Alterra. Bodemeigenschappen zijn beschreven in de bodemkaart van Nederland. Abiotische data zijn betrokken van landsdekkende beelden in Nederland, gebaseerd op veldmetingen in het landelijk meetnet bodemkwaliteit (LMB). Voor bodembiodiversiteit is daarnaast gebruik gemaakt van additionele metingen. Ter vergelijking is een analyse gerapporteerd gebaseerd op alleen meetdata en geen geïnterpoleerde gegevens. Deze is beperkt tot de zuidelijke zandgronden in Noord-Brabant en Limburg. De gegevens voor bodemgebruik, bodemtype en bodemkwaliteit zijn gekoppeld op basis van de
coördinaten.
Voor de meeste vormen van bodemgebruik, is meer dan de helft van het areaal gesitueerd op één enkel bodemtype. Ondanks grootschalige verandering van bodemgebruik in Nederland de afgelopen decennia, is er daarmee toch nog een sterk verband tussen bodemgebruik en
bodemtype. Ook binnen een bodemtype, is er een duidelijk verband tussen bodemgebruik en karakteristieken van de bodem. De relatie tussen bodemgebruik en bodemeigenschappen is geanalyseerd, zowel binnen een bodemtype en voor Nederland als geheel. Wanneer de variatie van een bodemeigenschap tussen verschillende vormen van bodemgebruik binnen een bodemtype laag is in vergelijking met de variatie binnen Nederland als geheel, is dit beschouwd als een indicatie dat bodemgebruik een geringe invloed heeft of de betreffende bodemeigenschap –en vice versa. Daarnaast kreeg een eventueel systematisch verschil tussen natuur en landbouw aandacht. De relatie tussen bodemgebruik en individuele
bodemeigenschappen wordt beïnvloed door bodembeheer, door historisch bodemgebruik en door de geografische situatie. Een verschil tussen bodemgebruik binnen een bodemtype is gevonden voor verschillende bodemeigenschappen, en de bodembiodiversiteit wordt beïnvloed door de intensiteit van landbouw. De geschiktheid van bodem voor akkerbouw, veeteelt of bosbouw kan geografisch gespecificeerd worden, gebaseerd op opbrengstcriteria. Het bereiken van milieudoelen en dergelijke is niet meegenomen in dit geschiktheidcriterium. Geschiktheidkaarten van Nederland voor deze vormen van landbouwkundig bodemgebruik zijn vergeleken met het actuele bodemgebruik. Bodemgebruik blijkt niet altijd daar te zijn gesitueerd waar de opbrengst hoog is. Minder dan 20% van de akkerbouw en veeteelt is gesitueerd op ongeschikte bodem, terwijl meer dan 40% van de bosbouw gesitueerd is op ongeschikte bodem.
Voor de sturing van bodemgebruik in Nederland bestaan verschillende planfiguren, i.e. ruimtelijke ordening, milieuplannen en waterbeheersplannen. In de milieuregulering bestaat de differentiatie naar bodemgebruik niet in het preventieve spoor. Gebiedsgericht
milieubeleid, een veld dat aan belang wint in het Nederlandse milieubeleid, biedt meer mogelijkheden om te differentiëren naar bodemgebruik. Bijvoorbeeld in de grootschalige reconstructie van de intensieve veehouderij in de zandgebieden in Zuid- en Oost Nederland zijn er mogelijkheden om de bestaande bodemkwaliteit te laten aansluiten bij het gevraagde bodemgebruik.
Summary
In the Netherlands land is used intensively. Changes in land-use are common, and foreseen on a great scale. Soil quality as a substratum for a land-use hardly plays a role in spatial planning. Several examples of problems with soil quality related to land-use in the rural area of the Netherlands are mentioned. Partly based on the EU-paper on soil strategy, a synthesis of soil properties is proposed. The indicators highlight the various ecological and human-use related functions of soils. We analysed the relationship between land-use and soil quality, relying mainly on data from the ecological domain and at a national scale.
Actual land-use in the Netherlands is covered by the data-set LGN. Soil properties are described in the soil map of the Netherlands. Abiotic data were derived from interpolated maps of the Netherlands, based on field measurements within the framework of Dutch Soil Quality Network (DSQN) and additional plots for soil biodiversity. For an additional analysis restricted to the sandy soils in the province of Noord-Brabant and Limburg, only measured and no interpolated data are used. Data for land-use, soil type and soil quality were coupled based on their co-ordinates.
For most land-uses, over 50% of the area is located on a single soil type. Despite major changes in land-use in the Netherlands during the past decades, there is still a strong linkage between land-use and soil type. Within a soil type, there is also still a clear relation between land-use and soil characteristics. The relationship between land-use and a soil property is analysed, both per soil type and for the Netherlands overall. If the variability in a property between land-uses for a soil type is low compared to the variability for the Netherlands overall, this is an indication that land-use has a minor influence on that soil property and vice versa. In addition, we focussed on an eventual systematic difference between nature and agricultural land-uses. The relationship between land-use and individual soil properties are influenced by soil management practices, by historical land-use and by the geographical situation. However, a difference between land-uses within a soil type is observed for several soil properties. Soil biodiversity is influenced by the intensity of farming. The suitability of soil for arable farming, pastures or forestry can be modelled based on yield criteria only. Meeting environmental targets etc. is not taken into account in this suitability criterion. Suitability maps of the Netherlands for these agricultural land-uses were made and compared with the current actual land-uses arable farming, pasture or forestry. Land-use is not always situated where the benefits in terms of yield are high. Less than 20% of the arable farming and pasture is situated on unsuitable soil, whereas over 40% of the forestry is situated on unsuitable soil.
For land-use planning in the Netherlands, several planning systems exist, i.e. spatial planning, environmental planning and water management. In generic environmental planning, function attachment does not exist in the preventive track. Policy directed towards specific regions, which is a growing field in the environmental policy of the Netherlands, offers more possibilities to differentiate towards different land-uses. For example in the large-scale reconstruction of intensive livestock breeding in the sandy areas of the Netherlands, there are opportunities to match occurring soil quality with the demanded land-use.
1.
Introduction
The Netherlands are a small and densely populated country, where land is used intensively. Changes in land-use are common, and foreseen on a great scale in the coming decades. Transitions from agricultural land-use to nature, from conventional to organic farming, a more extensive agriculture, the combinations of several functions within an area (multiple land-use), and urbanisation, are examples of the foreseen changes. The realisation of these intentions depends amongst others on the availability and affordability of land. Contrary to earlier times, soil quality as a substratum for a land-use hardly plays a role in spatial planning. Yet, confidence in the suitability of the soil quality for the foreseen land-use is high.
Large parts of the Netherlands belong to the deltas of the rivers Rhine, Meuse, Eems and Scheldt, with fertile soils. Nevertheless, several examples of problems in soil quality related to land-use in the rural area of the Netherlands can be mentioned. After long-term and intensive agriculture entirely devoted to the cultivation of potatoes in the ‘Veenkoloniën’ (north-east of the Netherlands), there are currently problems with wind erosion. In the west part of the Netherlands, livestock farming has a practice of long-term drainage of peat resulting in large-scale soil compaction and peat oxidation. Although growing bulbs is economically attractive (making the use of pastures in order to grow bulbs for one season a common practice), the breaking of pastures leads to problems related to run-off of phosphate to surrounding surface water. Also maize cropping forces a depletion of carbon in the macro-organic fractions (2), which can only be recovered after a decade of pasture. In the wet parts of the Netherlands that are to be used for reforestation and development of nature, the environmental condition is insufficient to let nature develop as intended (3). Calculations for Gelderland –a province in the middle of the Netherlands- showed that at maximum, halve of the planned area for nature development is on soils where nutrient contents are too high to develop the type of ecosystem aimed at (unpublished results). The availability of nitrogen is the main problem, even after long term nature management measures. Approximately 75% of the current agriculture in sandy soils is on soils that are vulnerable to the leaching of nitrate, phosphate and pesticides. This limits the possibility to meet the requirements of ‘Good Agricultural Practice’, and thus the transition to sustainable agriculture. The given examples show that consideration of soil quality should be incorporated in land-use planning.
Land-use sets demands on soil quality, and otherwise influences soil quality (Figure 1). If soil quality is sub-optimal for the actual or foreseen land-use, benefits might be lowered or costs higher than aimed at. The effects of land-use on soil quality can also affect soil quality and land-use elsewhere or in the future. Soil quality can be defined in three domains, i.e.
ecological, economical and social-cultural. Each domain contains several stocks, consisting of independent properties. These can be concerned as a quantity, with inflow and outflow rates coupled to the renewability of the stock. A property has an actual value, and often a target value like a reference state or a policy goal. A synthesis of stocks and properties that are considered important for analysing the relationship between land-use and soil quality is given in Table 1. The choice is partly based upon the relevant topics discerned in the EU-paper on soil strategy (4). The indicators highlight the various ecological and human-use related functions of soils.
soil quality
actual
land-use
soil quality and
land-use possibilities
later
soil quality and
land-use possibilities
elsewhere
Figure 1. Mutual relationship between land-use and soil quality. An actual change in soil quality might influence soil quality and land-use possibilities later or elsewhere.
To optimise land-use and to prevent transfer of diminished quality to later or elsewhere, actual and future land-use choices could be co-determined by soil quality. If problems with soil quality are foreseen, one can seek for another spatial planning or improved soil
management. Land-use in the Netherlands is driven by economical, technological,
demographical and social-cultural developments. These factors can be used to model future land-use needs (5,6). Arguments of soil, water and environmental quality should be
considered together with these factors. This paper aims at clarifying the relationship between land-use and soil quality, relying mainly on data from the ecological domain and at a national scale.
Table 1. Relevant stocks and properties to describe soil quality.
Domain Stock Property
Soil organic matter Organic nitrogen Soil fertility
Net soil phosphate load
Biomass and biodiversity earthworms Biomass and functional diversity nematodes Biomass and feeding guilds micro-arthropods Biomass and activity bacterial population Soil biodiversity
Biomass arbuscular mycorrhizal (AM) fungi Granular size Bulk density Soil compressibility % Si Soil structure Surface erodability Groundwater level Water retaining capacity Soil hydrology
Brackishness Ecology
Soil chemistry ∑(heavy metals) ∑(biocides)
∑(persistent organic pollutants) pH
multi-substance PAF by pollution1
CEC Economic value Price of land
Labour duration Costs of use
Material costs Economy
Benefits of use Material yield
Archaeology Suspected catches/area × rareness Scale of use
Morphology
Soil structure associated to (historical) use Employment in agriculture
Employment in nature Soil-related
employment
Employment leisure industry Culture
Geological values Geological structures
2.
Material and Methods
2.1
Data
Actual land-use in the Netherlands is covered by the data-set LGN (www.lgn.nl), mainly based on remote sensing. Land-use in the year 2000 is given at a resolution of 25 m x 25 m. Per area one dominant land-use is given, multifunctional land-use is not included. Soil properties are described in the soil map of the Netherlands 1:250000 (8).
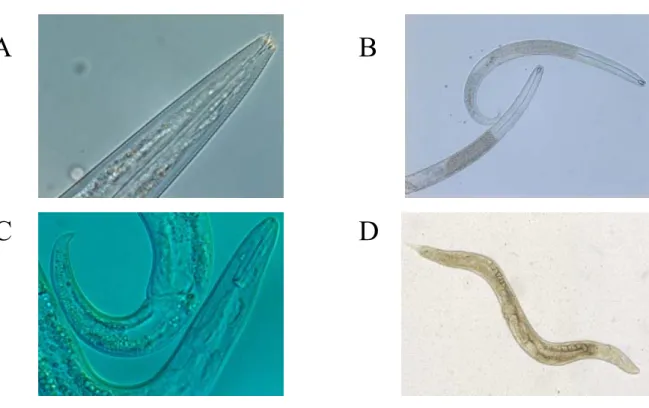
Abiotic data were derived from interpolated maps of the Netherlands, based on field measurements within the framework of Dutch Soil Quality Network (DSQN). DSQN is a monitoring infrastructure designed in 1993 to obtain information regarding soil status and trends. It covers a sample selection representing 70 % of the surface area of the Netherlands. Each complete sampling takes five successive years, and comprises 200 units, mainly farms. The sampling design comprises 20 farms acting as pseudo-replicates of land-uses and soil types.Biodiversity is regarded as an integrative indicator for soil quality, as both the taxonomic and the functional diversity are affected by environmental stressors. Nematodes (Figure 2) were sampled since 1993, in 1997 additional variables were included like nitrifying activity, diversity of microbial functions (9,10), abundance and diversity of earthworms, enchytraeids and micro-arthropods (10,11). Next to the DSQN sample points, for soil biodiversity 100 additional plots outside DSQN have been sampled, e.g. biological farms, nature areas and polluted areas. Together with the measurement of soil biodiversity, information was gained on the intensity of the agricultural land-use. The influence of the intensity of land-use on soil quality is analysed based on measured data only, as we do not dispose on a country covering database on the intensity of land-use. An overview of the type of data underlying the (interpolated) country-covering analyses is found in Table 2.
For an additional analysis restricted to the sandy soils in the provinces of Noord-Brabant and Limburg in the southern part of the Netherlands, only measured and no interpolated data are used (data from 12-17). The analysis was performed on the Pleistocene sandy soils, further subdivided in podzol, anthrosol, fluvisol and regosol. Land-uses concerned are pasture, pasture and maize, arable farming, horticulture, agriculture, forest and nature. Because of the different underlying data-sources, various classifications of land-use are used.
2.2
Geo-statistical analysis
Data for land-use, soil type and soil quality were coupled based on their coordinates. When necessary, due to differences in resolution, high-resolution files were scaled down to lower resolution. Analyses were performed using GIS software and SPSS. Relationships between land-use and soil properties were analysed per soil type and over the Netherlands as a whole.
2.3
Coincidence of actual land-use and suitability of land-use
considering criteria of yield
Suitability of soils for agricultural land-use is calculated based on the available data and criteria on suitability (18). The criteria on suitability are mainly based upon considerations of
yield. The suitability of soil for a certain land-use is compared with the actual land-use for arable farming, livestock farming and forestry.
Figure 2. Nematodes, indicators for soil quality and land management (18-21), can be identified both morphologically or taxonomically to either genus/species lever, r-K life strategy or feeding habits. A) Bacterial feeding genus Chiloplacus, the nematode is about 0.6 mm long; B) Predator nematode Clarkus papillatus, the length is about 1 mm; C) Plant feeding genus Paratylenchus, about 0.4 mm; D) Bacterial feeding nematode Pristionchus lheritieri, about 1 mm (LM-photos by Hanny van Megen).
A
B
Table 2. List of land-use types, soil types and soil properties that were used for the analyses.
Land-use Soil types Soil properties
bulb fields maize pastures agricultural peatlands potatoes orchards glasshouse / horticulture beets cereals other crops
natural herbaceous vegetation (pioneer) yellow dune complexes
dune scrub complexes maritime heath (Empetrion) coniferous woods
deciduous woods
heath (cf. Vaccinio-Callunetum) heath (cf. Genisto-Callunetum) bog (Oxycocco-Sphagnetea) forested fen (mainly birch carr) reed marsh (Phragmition) flooded woods (Alnion) back-shore marshes
peat
sand with peat underneath marine clay sandy soils river clay sand dunes loamy soil pH
organic matter content groundwater table soil compressibility
potentially affected fraction by heavy metals, PAF1
nematode diversity
3.
Results
3.1
Relation between land-use and soil type in the
Netherlands
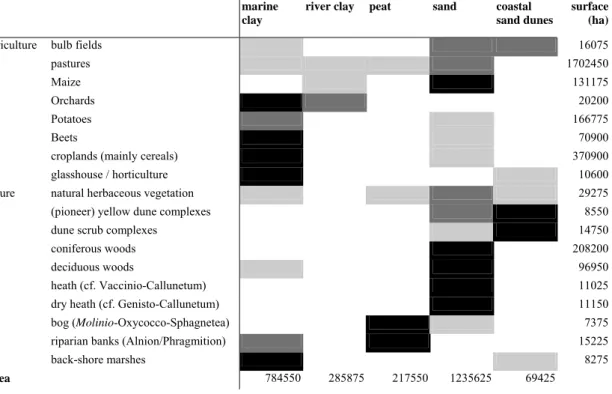
Agricultural land-uses occupy the largest part of the area in the Netherlands, with pastures being the dominant land-use type. From the agricultural land-use types, the arable farms are mainly located on marine clay, whereas pastures and maize can be found mainly on sandy soils in the eastern and southern part of the country (Table 3). Non-agricultural land-uses are located on several soil types, dependent on the type of vegetation. Backshore marshes, for example, occur on marine clays, whereas woodlands and dry heathlands mainly occur on sandy soils. Bogs, mires and freshwater marshes are located mostly on peat.
Table 3. Spatial analysis of the distribution of land-uses and soil types in the Netherlands. Black cells: >50% of the land-use is occurring on this given soil type; dark grey: 25%-50% and light grey: 10%-25%. Vegetation units according to Schaminée et al. (22,23).
marine
clay
river clay peat sand coastal sand dunes
surface (ha)
agriculture bulb fields 16075
pastures 1702450
Maize 131175
Orchards 20200
Potatoes 166775
Beets 70900
croplands (mainly cereals) 370900
glasshouse / horticulture 10600
nature natural herbaceous vegetation 29275
(pioneer) yellow dune complexes 8550
dune scrub complexes 14750
coniferous woods 208200
deciduous woods 96950
heath (cf. Vaccinio-Callunetum) 11025
dry heath (cf. Genisto-Callunetum) 11150
bog (Molinio-Oxycocco-Sphagnetea) 7375
riparian banks (Alnion/Phragmition) 15225
back-shore marshes 8275
Area 784550 285875 217550 1235625 69425
For most land-uses considered, over 50% of their area is located on a single soil type. Thus, despite the fact that there have been major changes in land-use during the past decades, there is still a strong linkage between land-use and soil type. Within a soil type, there is also a clear relation between land-use and soil characteristics, as shown in Figure 3 for some sandy soils.
Fluvisol Anthrosol Regosol Podzol Nature Horticulture Arable farming Pasture Regosol Anthrosol Podzol Fluvisol
Figure 3. Relation between land-use and soil characteristics within the Pleistocene sandy soils in Noord-Brabant and the northern part of Limburg (fields represent relative areas).
3.2
Relation between land-use and individual soil properties
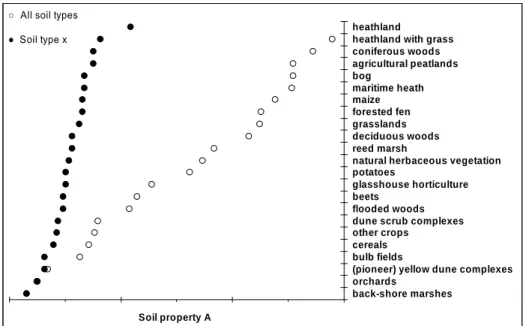
The relationship between land-use and a soil property is analysed for each soil type separately and for the Netherlands overall. If the investigated variation in a soil property A is low within a soil type x, when compared to the variation in property A over all areas, it indicates that soil property A is relatively little influenced by the type of land-use (Figure 4). When the
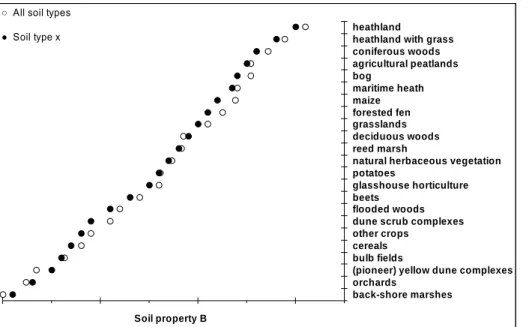
variation in soil property B between land-uses within a soil type x is high and comparable to the variation over all areas, this might indicate that soil property B is influenced by land-use (Figure 5). A given number of land-uses are required per analysis. In addition, we focused on a possible systematic difference in soil property between nature and agricultural land-uses.
Figure 4. Hypothetical variation: the soil property is low between land-uses in soil type x compared to all soil types together (all areas), indicating a minor influence of land-use on the soil property A.
heathland
heathland with grass coniferous woods agricultural peatlands bog maritime heath maize forested fen grasslands deciduous woods reed marsh
natural herbaceous vegetation potatoes
glasshouse horticulture beets
flooded woods dune scrub complexes other crops
cereals bulb fields
(pioneer) yellow dune complexes orchards
back-shore marshes Soil property A
○ All soil types ● Soil type x
.
Figure 5. The variation in the soil property B between land-uses within a soil type x is high and comparable to the variation over all areas, indicating that the soil property is influenced by land-use.
An examination of the actual variation in soil properties for all soils together, and for each soil type separately, shows that in general the variation in all soils is larger than the variation per individual soil type (Figure 6). Especially for soil acidity and for organic matter content, the variations between soil types become much larger than those between land-use types. Soil nematode diversity and PAF seem to rely more on land-use. The variations in these soil properties are also similar to those for all soils together. There are still soil types that clearly deviate from other soils in respect to these properties. Especially loamy soils and peat show higher nematode diversity than sand dunes and marine clays do. Moreover, peat has the highest Potentially Affected Fraction (PAF).
Average soil properties such as acidity and organic matter content can differ up to 3 orders of magnitude between the main soil types in the Netherlands (Figure 6; Annex 1). Other soil properties show less variation between soils. Peaty soils have a relatively low pH and nematode diversity, but high organic matter content, high groundwater table, high soil compressibility, and the aforementioned highest PAF. On the contrary, sandy soils (with a rather a comparably low pH) have a high nematode diversity, low organic matter content, low groundwater table, low compressibility, and low PAF. Clay-rich soils have properties
somewhere in between peat and sandy soils. Loamy soils are similar to sandy soils, although the pH is higher, the organic matter content lower and the groundwater table much lower.
heathland
heathland with grass coniferous woods agricultural peatlands bog maritime heath maize forested fen grasslands deciduous woods reed marsh
natural herbaceous vegetation potatoes
glasshouse horticulture beets
flooded woods dune scrub complexes other crops
cereals bulb fields
(pioneer) yellow dune complexes orchards
back-shore marshes Soil property B
○ All soil types ● Soil type x
Figure 6. Variation in soil-property values for all soils together and for each soil type separately. Points in the graphs are average values for each land-use type.
Acidity
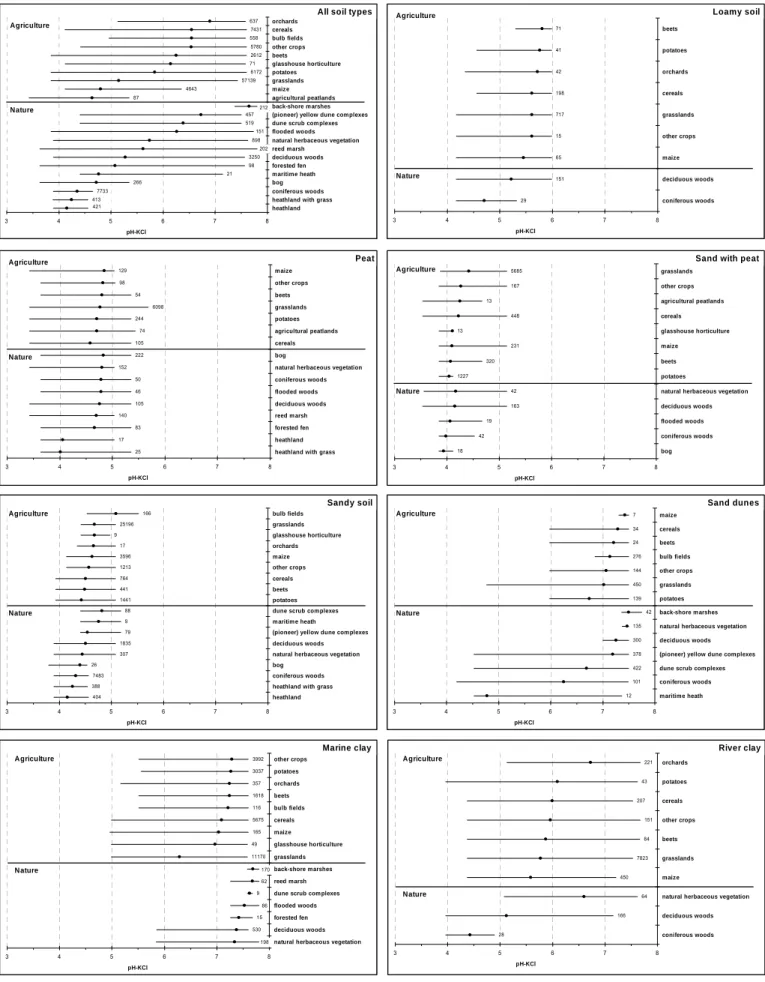
Soil acidity varies between a pH of 3.0 and 8.0, 5 orders of magnitude, when all soil types are taken into account (Figure 7). For each soil type separately, the variation is generally less then 2 orders, except for maritime sand dunes (Ca2+-enriched), and river clay where variation is over 3 orders of magnitude. The pH in areas with deciduous woods and heathlands is generally lower than in agricultural areas. For the analysis with measured data only on sandy soils in the southern part of the Netherlands, pH is significantly lower in nature than in agricultural land-uses. The interpolated data from Figure 7, however, do not reflect the custom of using lime in agricultural land-uses that would normally result in a higher pH.
0 0.2 0.4 0.6 0.8 1 0.1 1 10 100
GVG (m below surface level)
C u mu la ti ve o c cu rr en c e all soils marine clay river clay sandy soil sand dunes sand with peat peat loamy soil 0 0.2 0.4 0.6 0.8 1 0 50 100 150 Soil compressibility (cm) C u mu la ti ve o c cur re n ce all soils marine clay river clay sandy soil sand dunes sand with peat peat loamy soil 0 0.2 0.4 0.6 0.8 1 0.1 1 10 100
Soil organic matter (g/100g)
C u mul a ti ve occ u rr e nc e all soils marine clay river clay sandy soil sand dunes sand with peat peat loamy soil 0 0.2 0.4 0.6 0.8 1 3 4 5 6 7 8 pH-KCl C u m u la ti v e o c cu rr en c e all soils marine clay river clay sandy soil sand dunes sand with peat peat loamy soil 0 0.2 0.4 0.6 0.8 1 20 25 30 35 40
Nematode diversity (# genera)
C u mu la ti ve o c c u rr en ce all soils marine clay river clay sandy soil sand dunes sand with peat peat loamy soil 0 0.2 0.4 0.6 0.8 1 0.0001 0.001 0.01 0.1 1 PAF C u m u la ti ve o c cu rr en c e all soils marine clay river clay sandy soil sand dunes sand with peat peat loamy soil
Figure 7. Average soil pH for the Netherlands overall (all soil types) in relation to land-use, and for each soil
type separately. Ranges indicate the 5th and 95th percentile. Numbers in the graphs indicate the number of
samples used for the calculation.
All soil types
421 413 7733 266 21 98 3250 202 898 151 519 457 212 87 4643 57139 6172 71 2612 5780 558 7431 637 3 4 5 6 7 8 orchards cereals bulb fields other crops beets glasshouse horticulture potatoes grasslands maize agricultural peatlands back-shore m arshes (pioneer) yellow dune complexes dune scrub com plexes flooded woods natural herbaceous vegetation reed marsh deciduous woods forested fen maritime heath bog coniferous woods heathland with grass heathland pH-KCl Agriculture Nature Loamy soil 29 151 65 15 717 198 42 41 71 3 4 5 6 7 8 beets potatoes orchards cereals grasslands other crops m aize deciduous woods coniferous woods pH-KCl Agriculture Nature Peat 25 17 83 140 105 46 50 152 222 105 74 244 6098 54 98 129 3 4 5 6 7 8 m aize other crops beets grasslands potatoes agricultural peatlands cereals bog
natural herbaceous vegetation coniferous woods flooded woods deciduous woods reed m arsh forested fen heathland heathland with grass
pH-KCl Agriculture
Nature
Sand with peat
18 42 19 163 42 1227 320 231 13 448 13 167 5685 3 4 5 6 7 8 grasslands other crops agricultural peatlands cereals glasshouse horticulture maize beets potatoes
natural herbaceous vegetation deciduous woods flooded woods coniferous woods bog pH-KCl Agriculture Nature Sandy soil 404 388 7483 26 307 1835 79 9 88 1441 441 764 1213 3596 17 9 25196 166 3 4 5 6 7 8 bulb fields grasslands glasshouse horticulture orchards m aize other crops cereals beets potatoes dune scrub complexes m aritim e heath
(pioneer) yellow dune com plexes deciduous woods natural herbaceous vegetation bog
coniferous woods heathland with grass heathland pH-KCl Agriculture Nature Sand dunes 12 101 422 378 300 135 42 139 450 144 276 24 34 7 3 4 5 6 7 8 maize cereals beets bulb fields other crops grasslands potatoes back-shore m arshes natural herbaceous vegetation deciduous woods (pioneer) yellow dune complexes dune scrub com plexes coniferous woods maritime heath pH-KCl Agriculture Nature Marine clay 198 530 15 86 9 62 170 11170 49 165 5675 116 1618 357 3037 3992 3 4 5 6 7 8 other crops potatoes orchards beets bulb fields cereals maize glasshouse horticulture grasslands back-shore marshes reed marsh dune scrub com plexes flooded woods forested fen deciduous woods natural herbaceous vegetation
pH-KCl Agriculture Nature River clay 28 166 64 450 7823 84 151 207 43 221 3 4 5 6 7 8 orchards potatoes cereals other crops beets grasslands maize
natural herbaceous vegetation deciduous woods coniferous woods
pH-KCl Agriculture
Groundwater tables
Along an inland gradient from the coast to the south-east of the Netherlands, groundwater tables show large variability over all areas in the delta (40 to 1200 cm below surface level), as well as per soil type (Annex 2). Marine clay and maritime sand dunes always show shallow groundwater tables, related to their location in the west of Holland. Variations in groundwater table per soil type are the highest for river clay and sandy soil, for the latter soil type dry heathlands and pine plantations show the lowest tables. Variability – in time - in the groundwater table within a certain land-use per soil type may be high. For loamy and peat-related soils, agricultural uses show generally a lower groundwater table than other land-uses, as a result of drainage practices.
Soil compressibility
Soil compressibility varies grossly between 0 and 100 cm over all areas (Annex 2). The variability per soil type is comparable, although the actual compressibility as well as the variability is lower for sandy soil, loamy soil and river clay. Only for sand dunes there is a clear distinction in the compressibility associated with agricultural land-uses, which is higher than in the nature land-uses. For peat, pasture shows the highest compressibility within the agricultural land-uses.
Soil organic matter content
The soil organic matter content (SOM) varies over all areas between 0.3 to 67% (Annex 2). The variability over all areas is mainly caused by differences in soil type, not in land-use. Aside peat-related landscapes, the variation in SOM between different land-uses is generally very low. The result for Noord-Brabant and the northern part of Limburg shows a significant decrease in SOM for agricultural land-uses.
Nematode diversity
Nematode diversity, expressed as the number of genera, show low variability in all soil types (Figure 6; Annex 2). The variability of nematode diversity per soil type is comparable with the variability for all areas. For peat soils, the agricultural land-uses show somewhat lower diversity than nature land-uses, whereas for sandy soil, agricultural land-uses show higher nematode diversity than nature shows. Such a distinction is not evident for the other soil types. The nature land-uses in sandy soil are merely Scots pine plantations and the observed shift may be explained by a shift in soil acidity (24), resulting in a higher fungal abundance. Fungi play an important role in soil biodiversity, and are sensitive to acidification,
eutrophication and land management as soil tillage (24-26).
Potentially affected fraction by heavy metals
The variability in the potentially affected fraction by heavy metals, PAF, is high for peat and moderate for sand with peat underneath. This is explained for a major part by historical contamination. For all other soil types it is low. The results for Noord-Brabant and the
northern part of Limburg show for cadmium, chromium, copper and zinc that metal levels are significantly lower in nature than in agricultural land-use. However, also in this dataset historical contamination by smelters is of influence on the analysis.
In conclusion, analyses on the relationship between land-use and individual soil properties are influenced by soil management practices (such as liming and drainage), by historical land-use (metal contamination) and by the geographical situation (groundwater). Therefore, a prototypic situation as depicted in Figure 5 is exceptional. Nevertheless, a difference between land-uses within a soil type is observed for several soil properties.
3.3
Influence of the intensity of land-use on biodiversity of
nematodes
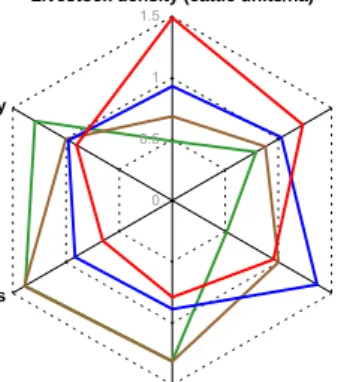
Soil biodiversity is influenced by the intensity of farming as shown in Figure 8. A more extensive overview and modelling of the effects of organic, conventional and intensive management in sandy pastures on functional diversity is described in (19). The total number of taxa is low for all types of nematodes in very intensive pastures (intensive+). The number of nematode taxa is increased for bacterial-feeders and decreased for plant- and hyphal-feeders in intensive farming compared to organic or extensive farming.
A higher soil biodiversity in plots with a biodynamic or bioorganic farming system compared to plots with a conventional farming was described by Mäder et al. (27). Soil biodiversity is often regarded as an integrative indicator for soil quality, as it is influenced by variable stress. Soil microbes and soil fauna strongly affects the composition of natural vegetation (27-31), and including its role might enhance the success of nature restoration projects.
Managed pastures
0 0.5 1 1.5
Livestock density (cattle units/ha)
Nutrients: P(mg/l)
Bacterivore nematodes
Fungivore nematodes Plant root-feeding nematodes
Nematode biodiversity
organic conventional semi-intensive intensive
Figure 8. Web-diagram of the influence of the intensity of farming on soil properties with emphasis on soil biology. Clock-wards, the axes stand for the yearly amount of livestock, the dry P content, the different types of nematodes (bacterial-, hyphal- and plant-feeders), and their number of taxa. Weighted averages according to farming regimes (n = 134).
3.4
Requirements of land-use towards soil quality
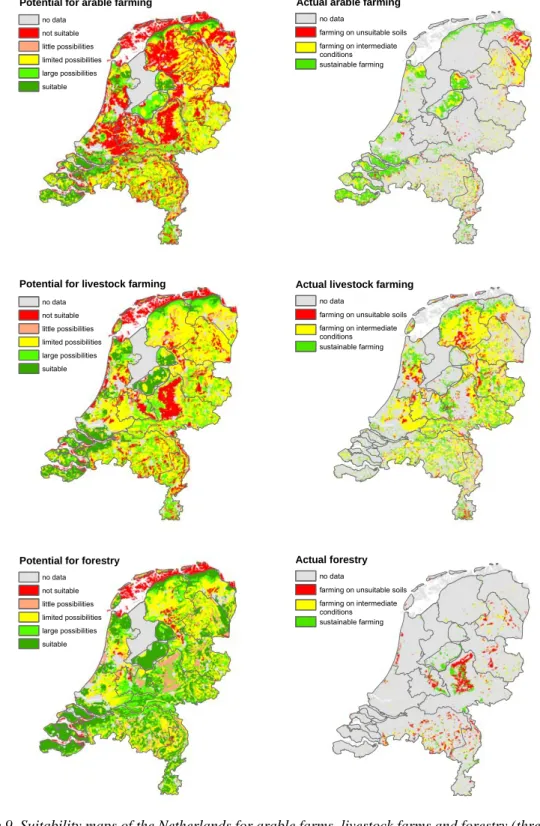
The suitability of soil for arable farming, livestock farming or forestry can be modelled according to (32). The suitability is based on yield criteria only; meeting environmental targets is not taken into account. Suitability maps of the Netherlands for these agricultural land-uses were made and compared with the actual land-uses arable farming, livestock farming or forestry (Figure 9). It can be concluded that land-use is not always situated where the soil is suitable and benefits in terms of yield are high.
Potential for forestry Actual forestry no data
farming on unsuitable soils
sustainable farming farming on intermediate conditions no data not suitable little possibilities limited possibilities large possibilities suitable
Actual livestock farming no data
farming on unsuitable soils
sustainable farming farming on intermediate conditions Potential for livestock farming
no data not suitable little possibilities limited possibilities large possibilities suitable no data not suitable little possibilities limited possibilities large possibilities suitable
Potential for arable farming Actual arable farming
no data
farming on unsuitable soils
sustainable farming farming on intermediate conditions
Figure 9. Suitability maps of the Netherlands for arable farms, livestock farms and forestry (three maps on the left-hand side) and suitability maps which were confronted with present land-use (three maps on the right-hand side).
Less than 20% (1500 km2) of all arable farming in the Netherlands is situated on unsuitable soil, whereas more than 40% (4000 km2) of all arable farming is located on suitable soils (Figure 10). More than 80% of all suitable soils, however, are actually used for arable farming (Figure 11). This means that, probably, arable farming on less suitable soils is only done because the suitable soils are already occupied. This might be explained by the gains that can be made in arable farming. Over 40% of the forestry is situated on unsuitable soil, which can be explained by the relative low gains that are to be made in forestry, so forestry cannot displace economically more powerful functions. Livestock farming is in between.
Figure 10. Actual surface area of three agricultural land-uses in the Netherlands (arable farming, livestock farming and forestry), compared to the suitability of the soil for that particular land-use based on optimal yield. Suitable soils were classes BC and C (see Figure 11), intermediate soils were class B and unsuitable soils were classes A and AB.
Soils that are most suitable for livestock farming are mainly used for arable farming (Figure 11). When soil suitability for livestock farming is intermediate, then livestock farming is mainly practiced. Soils that are unsuitable for livestock farming are used for forestry and nature. So, priority is given to arable farming. Forestry only occurs on less suitable soils.
Figure 11. Suitability classes of soils for four land-use types. A. Suitability of soils for arable farming. B. Suitability of soils for livestock farming. C. Suitability of soils for forestry.
Arable farming 0 20 40 60 80 100 A AB B BC C
Suitability classes for arable farming (A=unsuitable, C=suitable) P e rcen ta g e of act u a l l a n d u s e Arable farms Livestock farms Forestry Nature Livestock farming 0 20 40 60 80 100 A AB B BC C
Suitability classes for livestock farming (A=unsuitable, C=suitable) P e rc ent a ge of ac tu a l l a ndus e Arable farms Livestock farms Forestry Nature Forestry 0 20 40 60 80 100 A AB B BC C
Suitability classe s for fore stry (A=unsuitable , C=suitable ) Pe rc e n ta g e o f a c tu a l la n d u s e Arable farms Livestock farms Forestry Nature
A B
C
0 5000 10000 15000arable farming livestock farming forestry
L a n d -u se su rf ace ar ea ( k m 2 )
land-use on unsuitable soils
intermediate
4.
Discussion
4.1
Data and method
The results described here are based on analyses using interpolated data, or measured data only. For the soil properties pH and soil organic matter content, the distribution of the
measured and interpolated data are compared (Annex 3). The distributions of the interpolated data are smaller; the standard deviation is lower. Therefore, relationships with land-use can be more explicit using interpolated data. Where the analyses could be compared based on both interpolated and measured data - i.e. pH, SOM and heavy metals - it can be concluded that where locally measures are taken to influence soil properties such as liming and
drainage, measured data are more useful for the analysis than interpolated data. The DSQN is designed on a good coverage over the Netherlands, however not all land-uses are evenly covered. Agricultural land-uses are covered well, nature as main land-use is covered less.
The LGN data on use, used for the analyses on interpolated data, are recent data. If land-use is recently changed, the historical influence of other land-land-uses is not incorporated in the analysis. Also, multifunctional land-use and the intensity of land-use are not taken into account, due to absence of underlying data. Finally, influence of surrounding land-use as an explaining factor for soil quality is not incorporated in the analysis. In this report the
empirical relationship between land-use and soil quality is described. However, soil management such as tillage, cropping pattern, use of pesticides and fertiliser are important keys for soil quality. See for example Neff et al. (33) who show the influence of nitrogen addition on the dynamics of soil organic carbon fractions. Unfortunately our analysis did not include soil management, for lack of country-covering data.
We used data on soil properties and on land-use, for an empirical description of the relationship between both variables. The absence or presence of an empirical relationship does not per se point to a causal relationship. We are not able to discern the influence land-use has on a given soil property, from the fact that a specific land-land-use for a certain location is often chosen just because of the soil properties of that particular place. In other words, due to the high correlation, what can be considered as the dependent variable? By analysing both for all areas as well as per soil type, these drawbacks have partly been taken away (see Figure 5).
Country-covering data were only available for some of the properties mentioned in Table 1, so a true integral analysis including economical and social-cultural aspects could not be made. The data used represent physical, chemical and biological soil quality. The nematode diversity or soil biodiversity is often regarded as an integrative soil indicator (20-21). The analysis here showed that nematode diversity shows variability between different types of land-use, which is comparable with the variation over all areas, apart from clayey soils. This indicates that nematode diversity is indeed influenced by land-use. Soil biodiversity seems useful for distinction between intensive and extensive farming. Nematode diversity is
associated with quality and quantity of SOM. SOM can be measured against lower costs than soil biodiversity. Therefore, a combined or tiered approach seems sensible.
4.2
Implications in spatial planning and management of soil
quality
For land-use planning in the Netherlands, several planning systems exist, i.e. spatial planning, environmental planning and water management. Van der Vlist (34) describes the history, characteristics and dominant practices of the various systems. He points out that
environmental planning uses strategies such as separation of different land-uses, end-of-pipe and environmental licences that are well suited for industrial and urban pollution but not for the rural area and its diffuse emissions. In generic environmental planning, function
attachment does not exist in the preventive track, and only recently it is embedded in the curative track for soil (35). The different planning systems offer several possibilities to regulate agricultural land-use, but there is no total coverage. Policy directed towards specific regions, which is a growing field in the environmental policy of the Netherlands, offers more possibilities to differentiate towards different land-uses. For example in the large-scale reconstruction of intensive livestock breeding in the sandy areas of the Netherlands, there are opportunities to match occurring soil quality with the demanded land-use.
References
1) Mulder, Ch., Van Wezel, A.P. and Van Wijnen, H.J. 2005. Embedding soil quality in the planning and management of land use. Intern. J. Biodiv. Sci. Management 1, 1-8.
2) Römkens, P.F.A.M., Van der Plicht, J. and Hassink, J. 1999. Soil organic matter dynamics after the conversion of arable land to pasture. Biol. Fertil. Soils 28, 277-284. 3) Joosten, H. 1994. Turning the tides: experiences and perspectives of mire conservation in
The Netherlands. In: Mires and Man, Mire conservation in a densely populated country. Grünig, A. (ed.). Swiss Federal Institute for Forest, Snow and Landscape Research, Birmendorf, pp. 300-310.
4) EU 2002. ‘Towards a thematic strategy for soil protection’. Decision #1600/2002/EC of the European Parliament.
5) Schotten, K., Goetgeluk, R., Hilferink, M., Rietveld, P. and Scholten, H. 2001.
Residential construction, land use and the environment. Simulations for the Netherlands using a GIS-based land use model. Environ. Mod. Assess. 6, 133-143.
6) Rapport, D.J., Costanza, R. and McMichael, A.J. 1998. Assessing ecosystem health. Trends Ecol. Evolut. 13, 397-402.
7) Klepper, O., Bakker, H., Traas, T.P. and Van de Meent, D. 1998. Mapping the potentially affected fraction (PAF) of species as a basis for comparison of ecotoxicological risks between substances and regions. J. Hazard. Mat. 61, 337-344.
8) Steur, G.G.L., De Vries, F. and Van Wallenburg, C. (eds). 1985. Soil map of the Netherlands 1:250000. A short description of the mapunits. Stiboka, Wageningen (In Dutch).
9) Bloem, J. and Breure, A.M. 2003. Microbial indicators. In Bioindicators and biomonitors: principles, concepts and applications. Markert, B.A., Breure, A.M. and Zechmeister, H.G. (eds.). Elsevier Science, Oxford, pp. 259-282.
10) Mulder, Ch., Cohen, J.E., Setälä, H., Bloem, J. and Breure, A.M 2005. Bacterial traits, organism mass, and numerical abundance in the detrital soil food web of Dutch
agricultural grasslands. Ecol. Lett. 8, 80-90.
11) Breure, A.M., Rutgers, M., Bloem, J., Brussaard, L., Didden, W.A.M., Jagers op Akkerhuis, G., Mulder, Ch., Schouten, A.J. and Van Wijnen, H.J. 2003. Ecologische kwaliteit van de bodem. RIVM report 607604005, Bilthoven, The Netherlands (In Dutch).
12) Wiersma, D., Van Goor, B.J. and Van der Veen, N.G. 1985. Inventarisatie van Cadmium, Lood, Kwik en Arseen in Nederlandse gewassen en bijbehorende gronden. AB-DLO report 8-85, Haren, The Netherlands (In Dutch).
13) Van Toor, C.H. and Van der Vleuten, C.W.J.M. 1990. Rappport van het onderzoek naar de gehalten aan cadmium, koper, lood en zink in Nederlandse landbouwgronden. BGGO, Oosterbeek, The Netherlands (In Dutch).
14) Van Duijvenbooden, W., Van Driel, W. and Willems, W.J. 1994. Resultaten van een onderzoek naar de mogelijke opzet van een Landelijk Meetnet Bodemkwaliteit. Coordinatie-commissie voor metingen in het milieu. Bilthoven, The Netherlands (In Dutch).
15) Groot, M.S.M., Bronswijk, J.J.B., Willems, W.J., De Haan, T. and Del Castilho, P. 1996. Landelijk meetnet bodemkwaliteit; Resultaten 1993. RIVM report 714801007, Bilthoven, The Netherlands (In Dutch).
16) Groot, M.S.M., Bronswijk, J.J.B. and Van Leeuwen, T.C. 1997. Landelijk meetnet bodemkwaliteit, Resultaten 1994. RIVM report 714801017, Bilthoven, The Netherlands (In Dutch).
17) Postma, S. and Busink, E.R.V. 1996/1997. Uitvoering nulmetingen provinciaal meetnet bodemkwaliteit Noord-Brabant. Rapportage fase 2+4. CSO, Bunnik (In Dutch).
18) Schouten, A.J., Bloem, J., Didden, W., Jagers op Akkerhuis, G., Keidel, H. and Rutgers, M. 2002. Bodembiologische indicator 1999. Ecologische kwaliteit van graslanden op zandgrond bij drie categorien melkveehouderijbedrijven. RIVM report 607604003, Bilthoven, The Netherlands (In Dutch).
19) Mulder, Ch., De Zwart, D., Van Wijnen, H.J., Schouten, A.J. and Breure, A.M. 2003. Observational and simulated evidence of ecological shifts within the soil nematode community of agroecosystems under conventional and organic farming. Funct. Ecol. 17, 516-525.
20) Yeates, G.W. 2003. Nematodes as soil indicators: functional and biodiversity aspects. Biol. Fertil. Soils 37, 199-210.
21) Mulder, Ch., Dijkstra, J.B. and Setälä, H. 2005. Nonparasitic Nematoda provide evidence for a linear response of functionally important soil biota to increasing livestock density. Naturwissenschaften 92, 314-318.
22) Schaminée, J.H.J., Weeda, E.J. and Westhoff, V. 1995. De vegetatie van Nederland. Deel 2. Plantengemeenschappen van wateren, moerassen en natte heiden. Opulus Press,
Uppsala-Leiden, 360 pp .(In Dutch).
23) Schaminée, J.H.J., Stortelder, A.H.F. and Weeda, E.J. 1996. De vegetatie van Nederland. Deel 3. Plantengemeenschappen van graslanden, zomen en droge heiden. Opulus Press, Uppsala-Leiden, 356 pp. (In Dutch).
24) Mulder, Ch., Van Wijnen, H.J. and Van Wezel, A.P. 2005. Numerical abundance and biodiversity of below-ground taxocenes along a pH gradient across the Netherlands. J. Biogeogr. 32, 1775-1790.
25) Mulder, Ch., Breure, A.M. and Joosten, J.H.J. 2003. Fungal functional diversity inferred along Ellenberg’s abiotic gradients: Palynological evidence from different soil
microbiota. Grana 42, 55-64.
26) Jansa, J., Mozafar, A., Anken, T., Ruh, R., Sanders, I.R. and Frossaard, E. 2002. Diversity and structure of AMF communities as affected by tillage in a temperate soil. Mycorrhiza 12, 225-234.
27) Mäder, P., Fließbach, A., Dubois, D., Gunst, L., Fried, P. and Niggli, U. 2002. Soil fertility and biodiversity in organic farming. Science 296, 1694-1697.
28) Klironomos, J.N. 2002. Feedback with soil biota contributes to plant rarity and invasiveness in communities. Nature 417, 67-70.
29) Mulder, Ch., Van Wijnen, H.J., Den Hollander, H.A., Schouten, A.J., Rutgers, M. and Breure, A.M. 2004. Reference assemblages for soil ecosystems: Evaluating functions and services. RIVM report 607604006, Bilthoven, The Netherlands.
30) Wardle, D.A., Bardgett, R.D., Klironomos, J.N., Setälä, H., Van der Putten, W. and Wall, D.H. 2004. Ecological linkages between aboveground and belowground biota. Science 304, 1629-1633.
31) Kardol, P., Bezemer, T.M., Van der Wal, A. and Van der Putten, W.H. 2005.
Successional trajectories of soil nematode and plant communities in a chronosequence of ex-arable lands. Biol. Conserv. 126,317-327.
32) Boogaard, H.L. and Otjens, A.J. 2000. Gebruikershandleiding BODEGA 2.1./1.0: een digitaal kennissysteem voor het bepalen van de bodemgeschiktheid voor akker-, weide- en tuinbouw. Alterra-report 008, Wageningen, The Netherlands (In Dutch).
33) Neff, J.C., Townsend, A.R., Gleixner, G., Lehman, S.J., Turnbull, J. and Bowman, W.D. 2002. Variable effects of nitrogen additions on the stability and turnover of soil carbon. Nature 419, 915-917.
34) Van der Vlist, M.J. 1998. Land use planning in the Netherlands; finding a balance between rural development and protection of the environment. Landscape and Urban Planning 41, 135-144.
Annex 1. Soil property values per soil type
Soil property averages for the Netherlands overall and per soil type. Ranges indicate the 5th and 95th percentile. Numbers in the graphs indicate the number of samples used for the calculation. 43462 1330 2464 9311 8388 7642 27249 99846 0 50 100 150 200 all marine clay peat sand with peat river clay sand dunes loamy soil sandy soil Soil compressability (cm ) 2464 1329 43462 27249 9237 8388 7642 99771 0.1 1 10 100 all peat sand with peat river clay marine clay sandy soil loamy soil sand dunes
Soil organic matter (g/100g)
2464 27249 7642 8388 9311 43462 99846 1330 0.1 1 10 100 1000 all loamy soil sandy soil river clay sand with peat peat m arine clay sand dunes
GVG (m below surface level) 8388 43462 7642 1329 9237 27249 2464 99771 3 4 5 6 7 8 all sand dunes marine clay river clay loamy soil peat sandy soil sand with peat
pH-KCl 22328 3457 7021 35629 3077 1211 74676 15 20 25 30 35 40 45 all loam y soil sand with peat sandy soil river clay peat marine clay
Nem atode diversity (# genera)
2464 1330 43462 27249 9311 8388 7642 99846 0.0001 0.001 0.01 0.1 1 all peat sand with peat river clay marine clay sandy soil loam y soil sand dunes PAF
Annex 2. Soil property values per land-use type
Relation between land-use and individual soil properties, data for the Netherlands as a whole and per soil type.
Sand with peat
18 19 42 163 42 13 5685 231 448 167 1227 320 13 0.01 0.1 1 10 100 glasshouse horticulture beets potatoes other crops cereals maize grasslands agricultural peatlands natural herbaceous vegetation deciduous woods coniferous woods flooded woods bog
GVG (m below surface level)
Agriculture Nature Sandy soil 88 9 79 26 307 1835 7483 404 388 166 9 17 25196 1213 3596 1441 441 764 0.01 0.1 1 10 100 cereals beets potatoes maize other crops grasslands orchards glasshouse horticulture bulb fields heathland with grass heathland coniferous woods deciduous woods natural herbaceous vegetation bog
(pioneer) yellow dune complexes maritime heath
dune scrub complexes
GVG (m below surface level)
Agriculture Nature Sand dunes 42 378 135 422 300 101 12 7 276 24 139 144 450 34 0.01 0.1 1 10 100 cereals grasslands other crops potatoes beets bulb fields maize maritime heath coniferous woods deciduous woods dune scrub complexes natural herbaceous vegetation (pioneer) yellow dune complexes back-shore marshes
GVG (m below surface level)
Agriculture Nature Marine clay 170 9 62 198 15 86 530 116 11170 3037 49 3992 1618 165 5675 357 0.01 0.1 1 10 100 orchards cereals maize beets other crops glasshouse horticulture potatoes grasslands bulb fields deciduous woods flooded woods forested fen
natural herbaceous vegetation reed marsh
dune scrub complexes back-shore marshes
GVG (m below surface level)
Agriculture Nature Loamy soil 29 151 65 15 71 198 718 42 41 0.01 0.1 1 10 100 1000 potatoes orchards grasslands cereals beets other crops maize deciduous woods coniferous woods
GVG (m below surface level)
Agriculture Nature Peat 140 83 46 222 152 17 25 105 50 74 6098 129 105 54 244 98 0.01 0.1 1 10 100 other crops potatoes beets cereals maize grasslands agricultural peatlands coniferous woods deciduous woods heathland with grass heathland
natural herbaceous vegetation bog
flooded woods forested fen reed marsh
GVG (m below surface level)
Agriculture Nature River clay 217 88 7873 152 455 43 221 170 28 64 0.01 0.1 1 10 100 cereals beets grasslands other crops maize potatoes orchards deciduous woods coniferous woods natural herbaceous vegetation
GVG (m below surface level)
Agriculture
Nature All soil types
637 2616 7441 4648 57190 6172 71 5781 558 87 413 421 7733 3254 898 266 98 151 21 202 519 457 212 0.01 0.1 1 10 100 orchards beets cereals maize grasslands potatoes glasshouse horticulture other crops bulb fields agricultural peatlands heathland with grass heathland coniferous woods deciduous woods natural herbaceous vegetation bog
forested fen flooded woods maritime heath reed marsh dune scrub complexes (pioneer) yellow dune complexes back-shore marshes
GVG (m below surface level)
Agriculture
All soil types 21 421 519 7733 413 457 3254 212 898 266 98 151 202 4648 57190 6172 2616 637 5781 7441 558 71 87 0 50 100 150 200 agricultural peatlands glasshouse horticulture bulb fields cereals other crops orchards beets potatoes grasslands maize reed marsh flooded woods forested fen bog
natural herbaceous vegetation back-shore m arshes deciduous woods (pioneer) yellow dune complexes heathland with grass coniferous woods dune scrub com plexes heathland maritime heath Soil compressability (cm ) Agriculture Nature Loamy soil 29 151 71 15 41 718 65 42 198 0 50 100 150 200 cereals orchards maize grasslands potatoes other crops beets deciduous woods coniferous woods Soil compressability (cm) Agriculture Nature Peat 17 50 25 105 222 83 46 152 140 129 244 54 105 98 6098 74 0 50 100 150 200 agricultural peatlands grasslands other crops cereals beets potatoes m aize reed m arsh
natural herbaceous vegetation flooded woods forested fen bog deciduous woods heathland with grass coniferous woods heathland
Soil compressability (cm)
Agriculture
Nature
Sand with peat
18 42 163 42 19 13 1227 320 231 448 167 5685 13 0 50 100 150 200 agricultural peatlands grasslands other crops cereals maize beets potatoes glasshouse horticulture flooded woods natural herbaceous vegetation deciduous woods coniferous woods bog Soil compressability (cm ) Agriculture Nature Sandy soil 9 404 7483 388 1835 79 88 307 26 3596 17 25196 441 1441 1213 9 764 166 0 50 100 150 200 bulb fields cereals glasshouse horticulture other crops potatoes beets grasslands m aize orchards bog
natural herbaceous vegetation dune scrub complexes (pioneer) yellow dune com plexes deciduous woods heathland with grass coniferous woods heathland m aritim e heath Soil compressability (cm) Agriculture Nature Sand dunes 42 12 422 378 300 135 101 34 7 139 450 276 144 24 0 50 100 150 200 potatoes grasslands bulb fields other crops beets m aize cereals coniferous woods natural herbaceous vegetation deciduous woods (pioneer) yellow dune com plexes dune scrub complexes m aritim e heath back-shore marshes Soil compressability (cm) Agriculture Nature Marine clay 49 9 170 198 86 530 15 62 11170 357 165 5675 1618 3992 3037 116 0 50 100 150 200 glasshouse horticulture bulb fields potatoes other crops beets cereals maize orchards grasslands reed marsh forested fen deciduous woods flooded woods natural herbaceous vegetation back-shore marshes dune scrub com plexes (N=9)
Soil compressability (cm) Agriculture Nature River clay 28 170 64 455 43 88 221 152 217 7873 0 50 100 150 200 grasslands cereals other crops orchards beets potatoes maize
natural herbaceous vegetation deciduous woods coniferous woods
Soil compressability (cm)
Agriculture
All soil types 457 519 21 7733 421 3250 212 413 898 151 202 98 266 558 637 5780 7431 4643 71 2612 6172 57139 87 0.1 1 10 100 agricultural peatlands grasslands potatoes beets glasshouse horticulture m aize cereals other crops orchards bulb fields bog forested fen reed m arsh flooded woods natural herbaceous vegetation heathland with grass back-shore m arshes deciduous woods heathland coniferous woods m aritim e heath dune scrub complexes (pioneer) yellow dune com plexes
Soil organic m atter (g/100g) Agriculture Nature Loamy soil 29 151 15 65 198 41 71 717 42 0.1 1 10 100 orchards grasslands beets potatoes cereals maize other crops deciduous woods coniferous woods
Soil organic matter (g/100g) Agriculture Nature Peat 50 152 17 105 25 46 83 222 140 129 244 54 98 105 6098 74 0.1 1 10 100 agricultural peatlands grasslands cereals other crops beets potatoes maize reed marsh bog forested fen flooded woods heathland with grass deciduous woods heathland
natural herbaceous vegetation coniferous woods
Soil organic matter (g/100g) Agriculture
Nature
Sand with peat
42 18 19 163 42 13 320 1227 231 448 167 5685 13 0.1 1 10 100 agricultural peatlands grasslands other crops cereals maize potatoes beets glasshouse horticulture natural herbaceous vegetation deciduous woods flooded woods bog coniferous woods
Soil organic m atter (g/100g) Agriculture Nature Sandy soil 9 79 88 7483 388 404 307 1835 26 166 17 3596 25196 1213 9 441 764 1441 0.1 1 10 100 potatoes cereals beets glasshouse horticulture other crops grasslands m aize orchards bulb fields bog deciduous woods natural herbaceous vegetation heathland
heathland with grass coniferous woods dune scrub complexes (pioneer) yellow dune com plexes m aritim e heath
Soil organic m atter (g/100g) Agriculture Nature Sand dunes 422 378 42 101 300 12 135 7 450 34 276 24 144 139 0.1 1 10 100 potatoes other crops beets bulb fields cereals grasslands m aize
natural herbaceous vegetation m aritim e heath deciduous woods coniferous woods back-shore m arshes (pioneer) yellow dune com plexes dune scrub complexes
Soil organic m atter (g/100g) Agriculture Nature Marine clay 530 9 198 86 15 62 170 3037 357 116 1618 3992 5675 165 49 11170 0.1 1 10 100 grasslands glasshouse horticulture m aize cereals other crops beets bulb fields orchards potatoes back-shore marshes reed m arsh forested fen flooded woods natural herbaceous vegetation dune scrub complexes deciduous woods
Soil organic m atter (g/100g) Agriculture Nature River clay 28 166 64 43 84 151 221 450 207 7823 0.1 1 10 100 grasslands cereals m aize orchards other crops beets potatoes
natural herbaceous vegetation deciduous woods coniferous woods
Soil organic m atter (g/100g) Agriculture