Proposal for the risk assessment system USES B.J.W.G. Mensink
This investigation has been performed by order and for the account of the Directorate-General for Environmental Protection and the Directorate for Soil, Water, and Rural Areas, within the
framework of project M/601450/BD, Risk Assessment Methodology.
Copies can be ordered from:
National Institute for Public Health and the Environment (RIVM) Expert Centre for Substances (SEC)
P.O. Box 1, 3720 BA Bilthoven, The Netherlands Tel.: +31 30 274 3004
Fax: +31 30 274 4401 E-mail: sec@rivm.nl
Internet: http://www.rivm.nl/
Mentioning: RIVM report 601450014/2004
ABSTRACT
That there are very few measurements of aerial pesticide concentrations nearby greenhouses that are useful for human risk assessment was reason enough for RIVM to develop an improved computer module for USES (an integral risk-decision system used by the authorities), which would assess acute outdoor environmental exposure. The improved module allows exposure of nearby residents to pesticides to be calculated up to a distance of 20 m. Such calculations will be increasingly important in the Netherlands, as more inhabitants will be living nearby greenhouses in future. Expectations are that the module adaptations will improve the calculations of the aerial pesticide calculations, particularly within the first few hours after the application. A follow-up experiment, in which RIVM is a participant, will focus on chemical analyses under controlled greenhouse conditions. Only then, can further adjustment and refinement of this module, dealing with the complex causal chain of pesticide use, deposition and volatilisation in the greenhouse and the ventilation to the surrounding air, be made. The improved module will be incorporated into the risk assessment system USES 5.0.
PREFACE
This report focuses on the exposure assessment for residents nearby greenhouses as a part of the risk assessment for the use of pesticides in greenhouses. A calculation scheme is presented to be implemented in USES 5.0 (Uniform System for the Evaluation of Substances; in Dutch: UBS, Uniform Beoordelingssysteem Stoffen), the integrated risk assessment model for decision-making of governmental institutions. The fate and behaviour of pesticides in the atmosphere has generally not been documented very well. This also applies to the fate and behaviour of air-borne pesticides used for various horticultural crops in greenhouses. Reasons for this data gap are, inter alia, technical difficulties in analysing low concentrations and scientific difficulties in understanding and modelling the underlying physical processes. However, the (potential) toxicological risks for e.g. residents in areas adjacent to greenhouses should be assessable, when necessary. Therefore, a proper tool to estimate the exposure of these residents due to the use of pesticides in greenhouses is necessary. The proposal in this report is primarily based on a calculation scheme developed by Alterra in consultation with RIVM and Applied Plant Research Horticulture (Naaldwijk).
The author thanks ir. Jan Linders (RIVM), drs. Theo Vermeire (RIVM), ir. Ton van der Linden (RIVM), dr. Robert Luttik (RIVM), dr. ir. John Deneer (Alterra) and ir. Jan de Rijk (VROM) for critically reviewing this report.
CONTENTS
SUMMARY...9
SAMENVATTING ...11
1. INTRODUCTION ...13
1.1 GREENHOUSES, PESTICIDES AND RISK ASSESSMENT...13
1.2 HISTORICAL BACKGROUND...13
1.3 OBJECTIVES...13
1.4 GENERAL PRINCIPLES...14
1.5 MODEL DIMENSIONS...14
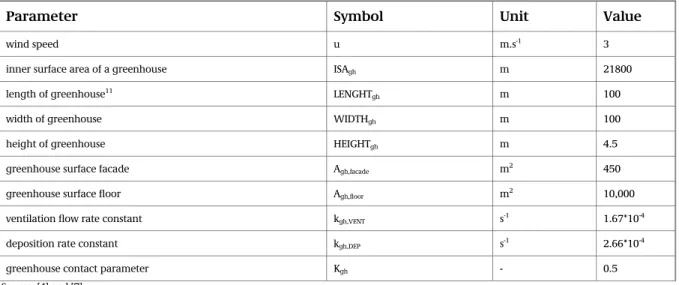
1.6 MODEL PARAMETERS...15
2. MODEL DESCRIPTION AND FORMULARIUM ...17
2.1 MODEL DESCRIPTION...17
2.1.1 STRUCTURAL ASPECTS...17
2.1.2 TECHNICAL AND PHYSICAL ASPECTS...18
2.2 MODEL CALCULATION...19
2.2.1 THE PROPOSED CALCULATION SCHEME VERSUS PREVIOUS VERSIONS OF USES ...19
2.2.2 THE CALCULATION SCHEME PROPOSAL FOR USES 5.0 ...21
3. MODEL EVALUATION ...23
3.1 GENERAL...23
3.2 VALIDATION...23
3.3 ANALYSING PARAMETER VARIATION...25
4. DISCUSSION AND CONCLUSIONS ...27
4.1 IMPORTANCE FOR USES...27
4.2 IMPORTANCE FOR RISK ASSESSMENT IN GENERAL...28
4.3 IMPORTANCE FOR DECISION-MAKING...29
4.4 VALIDATION STATUS...30
4.5 SYSTEM LIMITATIONS...30
4.6 RECOMMENDATIONS...31
REFERENCES ...33
APPENDIX IA ANALYSIS ON THE EFFECTS OF PARAMETER VARIATION ...35
APPENDIX IB COMPARING MEASUREMENTS AND ESTIMATIONS. ...41
APPENDIX II GLOSSARY OF ABBREVIATIONS...43
APPENDIX III LIST OF SYMBOLS...45
APPENDIX IV THE CALCULATION SCHEME OF LEISTRA et al. (2001) IN MSEXCEL ....47
SUMMARY
In this desk study, an exposure module that calculates aerial (gas-phase) pesticide concentrations nearby greenhouses has been improved. Expectations are that the adjusted module is more useful to calculate acute outdoor exposure due to pesticide use inside greenhouses. In this way, the module improves the human risk assessments for nearby residents. The exposure of nearby residents particularly within the first few hours after the pesticide application can thus be calculated up to a distance of 20 m. Such calculations will be increasingly important in the Netherlands, as more inhabitants will live nearby greenhouses. The module is a part of USES, a computerised and integral risk-decision system for authorities.
The module adjustment is based on a calculation scheme developed by Alterra in consultation with the National Institute for Public Health and the Environment and Applied Plant Research Horticulture (Naaldwijk). Main module adjustment is the process-oriented approach rather than the use of emission factors. Relevant processes are volatilisation and deposition inside the greenhouse and outdoor ventilation of remaining pesticide residues. The ventilation occurs primarily via convection of inside air to outside through chinks and cracks in the glass construction.
A follow-up experiment, in which RIVM participates, will focus on chemical analyses under controlled greenhouse conditions. Only then, further adjustments and refinements of this module, dealing with the complex causal chain of pesticide use, deposition and volatilisation in the greenhouse and the ventilation to the surrounding air, can be made. The improved module will be incorporated in the risk assessment system USES 5.0.
SAMENVATTING
In deze bureaustudie wordt een blootstellingsmodule gepresenteerd om, na bestrijdingsmiddelengebruik in kassen, bestrijdingsmiddelenconcentraties te berekenen in de kasomringende lucht. Op deze wijze kan naar verwachting de acute blootstelling van omwonenden als gevolg van bestrijdingsmiddelengebruik in kassen beter worden berekend, met name gedurende de eerste uren na toepassing. Zo kunnen naar verwachting de gezondheidsrisico's voor omwonenden tot op 20 meter van een kas beter worden ingeschat. Dergelijke schattingen worden in de nabije toekomst belangrijker, omdat meer mensen in de directe nabijheid van kassen kunnen komen te wonen.
De blootstellingsmodule maakt deel uit van USES, een computerprogramma voor integrale risicobeslissingen van overheden. Ze is gebaseerd op een rekenschema, ontwikkeld door Alterra, in overleg met het RIVM en Praktijkonderzoek Plant en Omgeving (PPO), sector Glastuinbouw, Naaldwijk. De belangrijkste aanpassing van de blootstellingsmodule betreft de proces-georiënteerde aanpak in plaats van het gebruiken van emissiefactoren (vaste percentages van de gebruikte hoeveelheden middelen, die verondersteld worden naar buiten te emitteren). Relevante processen waar nu rekening mee wordt gehouden zijn de vervluchtiging en de depositie van bestrijdingsmiddelen in de kas én de ventilatie door de kasconstructie naar buiten. De ventilatie vindt vooral plaats via convectie door spleten en kieren in de kasconstructie, met name in de eerste uren na toepassing van het middel. De dak- en andere kasramen zijn dan gesloten om van een goede werking van het bestrijdingsmiddel verzekerd te zijn.
In een vervolgonderzoek, waarin het RIVM participeert, zullen chemische analyses worden uitgevoerd om de blootstellingsmodule te staven. Alleen dan kan een verdere aanpassing en verfijning plaatsvinden van de module die de complexe causale keten in kaart brengt van het gebruik van bestrijdingsmiddelen, vervolgens de depositie en vervluchtiging en tenslotte de ventilatie naar buiten.
1. INTRODUCTION
1.1 Greenhouses, pesticides and risk assessment
“The potential exposure of bystanders and residents to pesticides via the air might constitute an exposure route, which needs further attention by research and possibly also regulatory measures”, the European Commission reported in a memorandum on sustainable use of pesticides [3]. This statement also applies to the use of pesticides in Dutch greenhouses and their (potential) emissions to the surrounding outdoor air. The absolute area in use for cultivation under glass is slowly declining in the Netherlands over the past years. There is however a clear trend that large horticultural enterprises are extending whereas the number of small ones is decreasing. Farms with more than 7 ha under glass are no exception, since a few years [2]. This is particularly the case for ornamental plant cultivation (roses, chrysanthemums, pot plants and plants for flowerbeds) as these horticultures are expanding in particular. Besides, greenhouse areas are expanding outside the more traditional locations of the Province of South-Holland. This implies that in a densely populated country as the Netherlands, the need for a proper tool to evaluate the (potential) risks of greenhouse pesticides to the population in surrounding areas is high. The Ministry of Housing, Spatial Planning and the Environment (further referred to as the Ministry of Environment) has to take into account that an increasing number of citizens will have to live nearby greenhouses.
1.2 Historical background
The Ministry of Environment launched a desk study in 2000 on pesticide emissions from greenhouses and their effects on nearby residents. The reason for this study was a jurisdictional judgement of the State Council (in Dutch: de Raad van State). This judgement implied that when the Ministry of Environment grants Nuisance Act Permits (in Dutch: hinderwetvergunningen), its decision should be based on a better founded (inhalatory) risk assessment for nearby residents. The results of the desk study — in response to this judgement — revealed that, in general, frequently used pesticides are not expected to affect residents nearby greenhouses [5]. This outcome was based on an exposure assessment freely adapted from Baas and Huygen [1]. The present report has adapted this exposure assessment in such a way that the calculation scheme can be implemented in USES 5.0, the integrated risk assessment system for decision-making of governmental institutions. The most recent and complete version of USES can be found in [7] (USES 4.0).
1.3 Objectives
This report primarily deals with pesticide emissions from within greenhouses to the leeward outdoor air nearby. This route has been taken into account by previous USES versions as well, aiming at assessing the environmental exposure (e.g. the deposition on nature conservation areas), as commissioned by the Ministries. The toxicological impact of such emissions, however, was not within the scope of USES. Nevertheless, as the implementation of the calculation scheme of [5] in USES 5.0 is intended to give more realistic calculations of outdoor concentrations, especially within a few hours after application, these outcomes may be compared with toxicological data as well. The calculation scheme in this report should be used to estimate the gas-phase concentrations in the air that surrounds greenhouses. If residents are living close to such pesticide emitting greenhouses, these calculations may contribute to a better understanding of the (potential) impact.
The objectives of this desk study are:
1. adaptation of the exposure assessment in USES respecting gas-phase pesticide concentrations around greenhouses. Major reason for adaptation of the present USES calculation scheme is the notion that the concentration decrease during the first hours after application was not taken into account (USES 4.0 indicates no decrease of the actual concentration inside the
greenhouse until the ventilation roofs are re-opened), thus possibly calculating an unrealistically high concentration in the lee side eddy (i.e. the air stream just outside the greenhouse on the leeward side) during the first hours after application. Therefore the calculation scheme for computing the gas-phase concentrations of pesticides within the greenhouse and in the greenhouse surrounding air (in particular the lee side eddy) is rephrased. Starting point for this rephrasing has been the publication of Alterra, RIVM and Applied Plant Research Horticulture in 2001 [5]. This report reflects the latest insights into pesticide emissions from greenhouses. The update of the exposure module should primarily satisfy the need for a harmonised, general scheme for rapid and easy-to-perform quantitative hazard and risk assessment based on first-tier studies (i.e. those laboratory studies generating the basic data set requested by the Competent Authorities for (re)registration)1.
2. analysing the particular significance of this adaptation.
3. phrasing recommendations for further improvements of the calculation scheme.
1.4 General principles
The risk assessment for residents in areas that surround greenhouses should reveal that certain concentration or exposure levels are not exceeded. This report focuses on the exposure assessment for these residents. It does not focus on the effects assessment. Difficulties in assessing pesticide concentrations nearby greenhouses and the potential risks of pesticide emissions from greenhouses for residents were discussed in [5] and [6]. Details on the technical and physical aspects on aerial pesticide emissions from greenhouses can be found in [1].
1.5 Model dimensions
Three factors determine the dimensions of USES: the spatial scale, the time scale and the “realism scale”, the latter being the degree of realism attained in the exposure assessment. It should be noted that the calculation scheme in the present report employs units or dimensions that are practical, rather than e.g. internationally agreed upon (SI units). However, the calculation scheme, when implemented in USES, will be programmed in SI units, whereas on the screens more practical units may be shown.
1.5.1 Spatial scale
For the risk assessment system, a distinction can be made between three spatial scales: a “personal”, local and regional scale. The “personal scale” refers to a) individual residents living nearby greenhouses, b) greenhouse workers (horticulturists, pesticide applicators and other horticultural employees) and c) individual consumers (exposure via pesticide treated agricultural products). This report focuses on the residents living nearby greenhouses. Theoretically, nearby residents may be directly exposed via pesticides ventilated from greenhouses through chinks and cracks in the greenhouse construction (prior to re-opening the windows which have been closed for optimal efficacy during circa 4 hours). They may also be exposed via ventilation after (re)opening the roof or side ventilation “windows” (ventilators). The local scale refers to the direct surroundings of greenhouses that may be theoretically contaminated (local air, water and soil). In this way, the concentrations of pesticides released from point sources as greenhouses are assessed for a generic local environment. This is not an actual site, but a hypothetical site with predefined, agreed characteristics. However, it can be expected that changing some of these characteristics may influence the model outcomes substantially. Therefore, a “quick and dirty” analysis has been included in the present report, to clarify some of the difficulties and implications related with simplifying a complex agro-(eco)system as a greenhouse and its surroundings to a generic and “easy” model. The regional scale is not a subject of the present report.
1 Risk assessment based on first-tier studies is generally assumed to represent worst-case scenarios. Second- or other higher-tier studies may be required if certain trigger values are exceeded. Those higher-tier studies should result in a risk assessment reflecting more realistic scenarios.
1.5.2 The time scale
The local emissions of pesticides used for horticultural crops under glass as presented in this report are considered to be continuous. These emissions occur via chinks and cracks while the windows are closed for optimal efficacy of the pesticide. Therefore this continuity progresses until the windows are re-opened (just prior to re-entry of personnel). It is assumed that pesticide emissions during these first 4 hours after application are more substantial than those theoretical “peak” emissions after re-opening the windows. A toxicological risk assessment can be based on concentrations over a particular time interval (time-weighted average) or on a concentration after a particular period has elapsed. It depends on the study objectives which approach is recommended. Theoretically, peaks may occur a) immediately after application (at t=0), and b) after a period of circa four hours, when the ventilation roofs are re-opened prior to personnel re-entry. However, such peaks are not taken into account in the present report, as the nearby residents are assumed to be subacutely exposed rather than acutely. It is assumed that time-weighted average concentrations are more realistic than a peak approach. It is also of importance to understand how long pesticides are generally applied in greenhouses as this may influence model outcomes substantially. Volatilisation, ventilation (with closed windows) and deposition are probably more rapid types of dissipation in and from greenhouses than e.g. dissipation via drains or emissions via drift when re-opening the greenhouse roof ventilators before re-entry of horticultural employees. Therefore it can be expected that the time scale for estimating emissions via ventilation, volatilisation, and deposition matters much more than the time scale for other dissipating processes.
1.5.3 The “realism scale”
The validity and usefulness of a model or algorithm depends, inter alia, on its similarity with reality. However, when an algorithm is a “poor substitute of the original”, this does not necessarily mean that the algorithm is of no use. Other functions than precisely simulating the processes under investigation — which is often unfeasible, and often only then when there is a proper dynamic simulation of all the relevant and complex processes —, may be emphasised. Less realistic — often more straightforward — algorithms may thus be valuable:
1. by depicting the state-of-the-art in exposure assessment for a particular non-target group (there is no feasible alternative yet);
2. to promote discussion on the pros and cons of this kind of risk assessment approach;
3. by generally estimating the exposure under worst-case conditions. This implies that if the assessment does not reveal significant exposure, no further data gaining may be necessary.
1.6 Model parameters
USES first of all provides a baseline risk assessment, i.e. a standard procedure based on substance-specific parameters and defaults only. However, besides the input options with defaults, data can be inserted manually as well. It is important that both options are feasible, as only then the validity and the consequences of certain assumptions can be tested and discussed. Only then a proper discussion on the validity and usefulness of the generated data is possible. Therefore, the possibilities to change some of the predefined, agreed characteristics of pesticide behaviour, greenhouse construction and the greenhouse surrounding local environment (air in particular) will be discussed in this report.
2. MODEL DESCRIPTION AND FORMULARIUM
2.1 Model description
2.1.1 Structural aspects
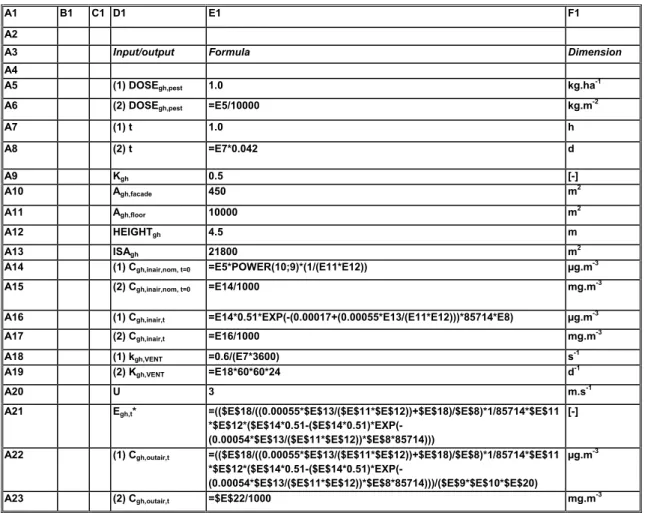
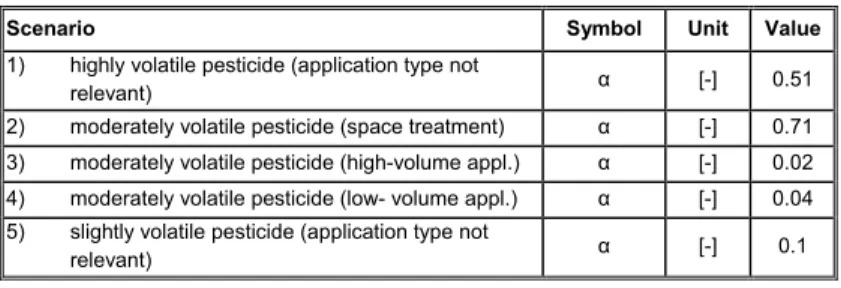
The structure of the calculation scheme with the most relevant processes and parameters is depicted in Fig. 2-1. The ultimate goal of this scheme is to calculate the gas-phase concentrations of pesticides just outside the greenhouse over periods that are considered relevant for potential exposure: Cgh,inair,t and Cgh,outair,t, respectively. The subscript “t” in these denominations refers to the time after which the gas-phase concentration is averaged. Therefore “t = 0h” refers to the initial concentration after the (last) application has been terminated (“h” stands for hours). “t = 1h” refers to the estimated averaged concentration over one hour after terminating the application. Some parameters will be explained below. An extensive overview of the calculation scheme and its structure is represented in Table 2-2. Fig. 2-1 and Tables 2-1 and 2-2 are based on [5].
Cgh,inair,nom,t=0 (see equation 1 in Table 2-2) is the nominal initial gas-phase concentration. It represents the nominally applied amount of gas-phase pesticide. This assumes the whole applied amount is instantaneously and homogeneously distributed over the whole greenhouse volume.
Figure 2-1 Technical and physical aspects of pesticide emissions from greenhouses. Cgh,inair,t and Cgh,outair,t are most re-levant for the exposure analysis of horticultural workers and greenhouse surrounding residents. Applica-tion scenarios in Table 2-1. Details in Table 2-2. Dotted arrows: not included in present version.
Cgh,inair,t
2
1
1 volatilisation
space treatment (e.g. fogging, LVM, fumigation) low-volume technique high-volume technique DOSEgh,pest GREENHOUSE OPEN AIR Cgh,outair,t Kgh Agh,facade u source strength DEPgh,outair,wet,t 1 DEPgh,outair,dry,t SURFACE SOIL, W ATER (scenario 1,2 & 5) (scenario 1,4 & 5) (scenario 1,3 & 5) 3 DEPgh,inair,t pesticide volatility
2 ventilation via chinks & cracks 3 deposition
greenhouse properties
3 (micro) climate properties
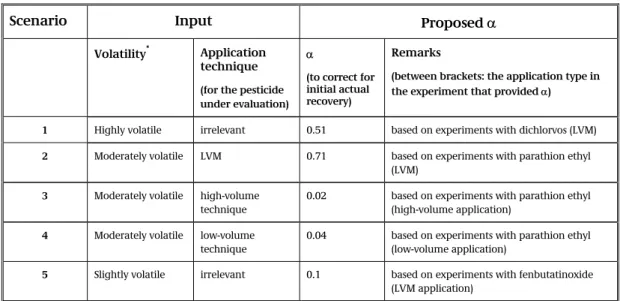
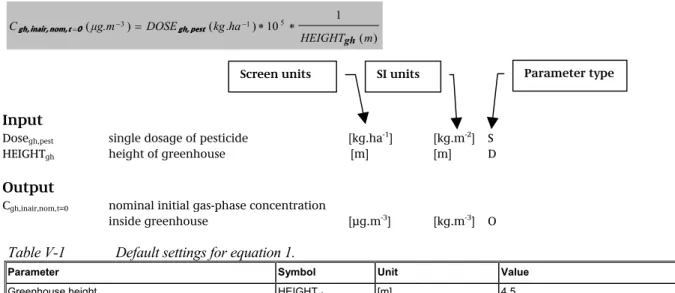
The assumption that the whole amount of sprayed, fogged, smoked or otherwise applied pesticide, contributes to the gas-phase concentration is worst-case, and less realistic in particular for treatments with relatively larger droplets (e.g. high- and low-volume applications). Therefore the correction factor α has been introduced varying from 0.02-0.71 (see Table 2-1 and equation 2A of Table 2-2). This factor is based on initially actually recovered amounts of pesticides in experiments [1]. In this way a pick-list exists for five different scenarios. Each scenario is thus based on the volatility of the pesticide, the application technique and the experimentally derived recovery fraction at t=0 hours. The experimental evidence, however, is limited as only a few experimentally based figures are available.
Therefore, it is obvious that prospective experiments may reveal more realistic and suitable input values.
* Three volatility classes are distinguished: highly volatile (>10 mPa), moderately volatile (0.01-10 mPa) and slightly volatile (< 0.01 mPa).
2.1.2 Technical and physical aspects
Deposition of gas-phase pesticides to surfaces may occur inside — after volatilisation — and outside — after ventilation via chinks and cracks — the greenhouse. Ventilation of gas-phase
pesticides through chinks and cracks in the greenhouse construction to air masses just outside the greenhouse may be followed by deposition on outdoor surfaces (e.g. water, soil). It should be noted that the ventilation itself is mainly based on convection through chinks and cracks of the greenhouse construction: ventilation through open windows after a recommended period of time that the windows should be closed for optimal efficacy of the pesticide is not taken into account2. The length and width of a greenhouse are as in Fig. 2-2.
2 Ventilation is the transportation of pesticide from inside the greenhouse to outside. It is mainly the result of air
mass transportation (convection).
Table 2-1 Empirical recovery (gas-phase) fraction of pesticides (α) inside greenhouse immediately after application (t=0).The pick-list in Appendix V (Table V-2) is based on this table. LVM is low-volume misting, a space treatment technique. Adapted from Baas and Huygen [1].
Scenario Input Proposed α
Volatility* Application technique (for the pesticide under evaluation)
α
(to correct for initial actual recovery)
Remarks
(between brackets: the application type in the experiment that provided α) 1 Highly volatile irrelevant 0.51 based on experiments with dichlorvos (LVM) 2 Moderately volatile LVM 0.71 based on experiments with parathion ethyl
(LVM) 3 Moderately volatile high-volume
technique
0.02 based on experiments with parathion ethyl (high-volume application)
4 Moderately volatile low-volume technique
0.04 based on experiments with parathion ethyl (low-volume application)
5 Slightly volatile irrelevant 0.1 based on experiments with fenbutatinoxide (LVM application)
Figure 2-2 Diagramatic representations of some greenhouse parameters. The wind direction perpendicular to the greenhouse facade is an assumption in the calculation scheme (worst-case assumption).
lee side eddy
GR EENH O USE W IN D D IRECTIO N facade le ng th w idth facade
2.2 Model calculation
2.2.1 The proposed calculation scheme versus previous versions of USES
The proposed calculation scheme for pesticide emissions from greenhouses (see Tables 2-2 and 2-3 for details) differs from the scheme in the preceding version of USES 4.0 [7]. The major differences are (see Table 2-4 for details):
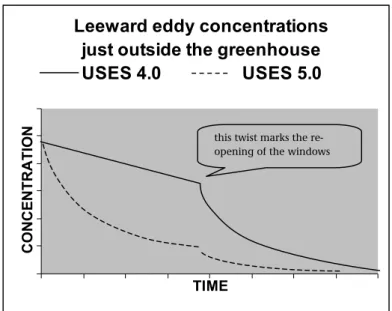
1. instead of assuming no decrease of the pesticide concentration inside the greenhouse during the first hours after application (until re-opening), a first-order decrease has been assumed based on the combined effect of volatilisation, ventilation and deposition. This approach should be considered more realistic (see Fig. 2-3 for a schematic overview).
2. a more process-oriented approach (volatilisation, deposition and ventilation), supposedly more realistic than the emission factor approach in the former USES versions (however, this is still an assumption that cannot be tested yet); the inclusion of various data derived from experiments (e.g. α, kgh,VENT, kgh,DEP, Kgh as reported in [1]) is also assumed to make the exposure
assessment more realistic; the limitation to three volatility classes instead of five may be seen at first glance as a step backwards, however, the introduction of more classes cannot be given a scientific basis (too few useful data);
3. different default values for greenhouse: e.g. for height HEIGHTgh, and the construction
coefficient Kgh. These values are considered more realistic. The proposed default height of
Dutch greenhouses (4.5 instead of 3.5 m in previous USES versions) refers to the increasing number of greenhouses built in the “Venlo” style (person. commun. of Applied Plant Research Horticulture, Naaldwijk to RIVM). The reasons for horticulturists to increase the greenhouse height are amongst others:
a) an increase of cultivation on raised gutters (in Dutch: goten);
b) an increase of cultivation in a “high-thread” system (in Dutch: hoge-draadsysteem); c) an increase of the illumination strength, with at least 1 m distance between the crops and
bulbs;
d) an increase of the use of screens, with at least 0.5-1 m distance between the bulbs and the screens.
Leeward eddy concentrations
just outside the greenhouse
USES 4.0 USES 5.0
TIME
CONCENTRATION
Fig. 2-3A schematic overview of the difference between USES 4.0 and the proposed calculation scheme for USES 5.0.
this twist marks the re-opening of thewindows
(adapted from [5]). Subscripts of parameters are bold.
C
refers to a concentration over a particular period. T is in seconds. Further explanation in Table 2-3. 1. gh pest gh, 0 t nom, inair, gh, HEIGHT DOSE C = = ∗105 ∗ 1 2A. C e dt T C T t k k∫
∗ ∗ ∗ ∗ = − + ∗ = 0 ) ) ( ( ] [ 1 gh,VENT gh,DEP 0 t nom, inair, gh, T inair, gh, αEquation 2B includes the solution of the integral in equation 2A:
2B.
)
(
]
1
[
]
[
( ( ) ) DEP gh, VENT gh, 0 t nom, inair, gh, T inair, gh, DEP gh, VENT gh,k
k
T
e
C
C
T k k+
∗
−
∗
∗
=
∗ + − =α
3. K A u VOLUME k k k CC
∗ ∗ ∗ ∗ + ∗ = facade gh, gh gh DEP gh, VENT gh, VENT gh, T inair, gh, T outair, gh, T ] [ ] [• Default 3-1 : VOLUMEgh =100∗100∗4.5 m (i.e. 45,000 m3);
• Defaults 3-2 and 3-3: kgh,DEP and kgh,VENT : see above (under equation 2A);
• Default 3-4 : Kgh=0.5 (experimentally determined: average realistic value, see [1]);
• Default 3-5 : Agh,facade =100∗4.5 m (i.e. 450 m2);
• Default 3-6 : u = 3 m.s-1 (this value corresponds with a wind speed between light air (in Dutch: zwakke wind) and light breeze (matige wind). This value is arbitrary and it does not represent a worst-case approach. Calm air (i.e. no wind at all) is more likely to increase the exposure in the immediate vicinity of greenhouses;
• T = period in seconds over which has been integrated;
• the numerator of equation 3 divided by T equals the source strength (in Dutch: bronsterkte) of the
greenhouse under investigation. Non-default
2A-6
• Default 1: HEIGHTgh = 4.5 m.
• Default 2A-1: α = 0.51 for highly volatile pesticides (> 10 mPa); all application techniques (scenario 1);
• Default 2A-2: α = 0.71 for moderately volatile pesticides (0.01 – 10 mPa); LVM application (scenario 2);
• Default 2A-3: α = 0.02 for moderately volatile pesticides (0.01 – 10 mPa); high-volume application (scenario 3);
• Default 2A-4: α = 0.04 for moderately volatile pesticides (0.01 – 10 mPa); low-volume application scenario 4);
• Default 2A-5: α = 0.10 for slightly volatile pesticides (< 0.01 mPa); (all application techniques scenario 5);
• Default 2A-6: kgh,DEP (s-1) = 2.66 ∗ 10-4 for a standard greenhouse of 100 ∗ 100 ∗ 4,5 m;
(m) WIDTH m HEIGHT LENGTH m ISA s m 10 5.5 ) (s k m 2 1 4 1 -gh gh gh DEP gh, ∗ ∗ ∗ ∗ − −
=
) ( ) ( ) . ( ) (• Default 2A-7: kgh,VENT(s-1)
=
1.67∗10−4 for a standard greenhouse of 100 ∗ 100 ∗ 4.5 m.ADDITIONAL EXPLANATION in Table 2-3
ADDITIONAL EXPLANATION
in Table 2-3
ADDITIONAL EXPLANATION
in Table 2-3
Table 2-3 Additional explanation of the equations in Table 2-2.
1.
2A/2B.
3.
2.2.2 The calculation scheme proposal for USES 5.0
Some calculational adjustments of the scheme in [5] were needed to fit the scheme into the USES format as presented in Table 2-2. E.g. the concentration in the lee side eddy has become an integrated concentration over a particular period (
C
air,1h becomesC
gh,outair,T) instead of aconcentration after a period. The decrease of this integrated concentration due to ventilation subsequently yields the concentration in the lee side eddy over T seconds after application via equation 3 of Table 2-2. Note that now both the concentration in and outside the greenhouse are represented as integrated over a particular period of t seconds.
Differences in parameters, their dimensions and notations between previous USES versions and the current proposal for USES 5.0 are listed in Table 2-4.
ADDITIONAL EXPLANATION equation 1 in Table 2-2
ADDITIONAL EXPLANATION equations 2A and 2B in Table 2-2
ADDITIONAL EXPLANATION equation 3 in Table 2-2
Cgh,inair, nom,t=0 is the nominal gas-phase concentration inside the greenhouse immediately after (the last) application. It is dependent on dosage and greenhouse volume. Generally, dosages are ≤ 1kg.ha-1. The figure 105 refers to conversions (kg→µg and ha→m2). The default height refers to the average height of a commonly constructed greenhouse: the “Venlo” type.
Cgh,inair,t is the estimated gas-phase concentration inside the greenhouse after t seconds. It is dependent on Cgh,inair, nom,t=0 , on α, and on the amounts assumed to be deposited and ventilated. The α values refer to experimental recoveries (gas-phase) of the initially applied dosages, immediately after the last application (i.e. at t=0) (see also Table 2-1). kgh,DEP and kgh,VENT refer to the estimated rate constants for deposition and ventilation, respectively. 3600 refers to the conversion of hours →seconds. A non-default approach requires the inner surface area (ISA) in m2, including the floor and the roof, and the height, the length and the width of the greenhouse (all in m). Also then, the rate constants for deposition inside and ventilation outwards are considered to be realistic averages (experimentally based). Non-default 2A-6 (deposition rate constant) is optional. kgh,VENT (ventilation flow rate constant; in Dutch: ventilatievoud) is derived from [1] assuming a flow rate constant directly proportional to the wind speed; kgh,DEP is experimentally derived as an average for several active ingredients in different greenhouses with different application techniques [1].
Cgh,inair,t and Cgh,inair,t=0 are calculated with equation 2. VOLUMEgh, and Agh,facade refer to the total greenhouse volume and facade area, respectively. For the kgh values (rate constants): see equation 2 as well. Kgh is a parameter dependent on the construction and the angle at which the wind approaches the construction. u refers to the wind velocity just above the greenhouse roof [1].
Symbol Explanation Unit scr
proposal Explanation scr Remarks
Parameters for local distribution
1. Cstdair concentration in air at source strength 1 kg.d-1 [mg.m-3] Replaced by new symbols 1 and 2(see below)
1.
C
gh,inair,nom,t=0initial, nominal gas-phase concentration inside greenhouse (immediately after (last) application)
[µg.m-3]
2.
C
gh,inair,Tgas-phase concentration inside greenhouse
over a period T [µg.m
-3]
Application input
2. DOSEpest,gh single dosage in case of pesticide in greenhouse [kg.m-2] 3. DOSEgh,pest single dosage in case of pesticide ingreenhouse [kg.ha-1] Only the notation of thesubscripts has been changed
Distribution air
3. Estdgh,air,1h standard 1 hour source strength of the greenhouse [mg.d-1]
4. Estdgh,air,24h standard 24 hour source strength of the greenhouse [mg.d-1]
5. Egh,air,1h 1 hour source strength of the greenhouse [mg.d-1]
6. Egh,air,24h 24 hour source strength of the greenhouse [mg.d-1]
7. Cstdgh,air,1h 1 hour avg. concentration from greenhouse with standardsource strength [mg.m-3]
All greenhouse parameters with emission or standard source strengths have been included into
C
gh,outair,T (see below, new symbol no. 4).8. Cgh,air,1h 1 hour averaged conc. in the lee side eddy of thegreenhouse [mg.m-3] 4.
C
gh,outair,T gas-phase concentration outside greenhousein the lee side eddy over period T [µg.m-3]9. K coefficient dependent on wind direction to front of greenh. [-] 5. Kgh coefficient dependent on greenh constructionand wind direction to facade of greenh. [-] No change, apart fromadditional notation (subscript) 10. A area of standard greenhouse perpendicular to winddirection [m2] 6. A
gh,facade area of standard greenhouse perpendicularto wind direction [m2] No change, apart fromadditional notation (subscript)
11. u wind speed at the roof top [m.s-1] 7. u wind speed at the roof top [m.s-1] No change 12. DEPstdgas-dry,gh,1h standard 1 hour avg. dry deposition flux for greenhouse [mg.m-2.d-1]
13. DEPgas-dry, gh,1h 1 hour averaged dry deposition flux for greenhouse [mg.m-2.d-1] 14. DEPgas-dry, gh,24h 24 hour averaged dry deposition flux for greenhouse [mg.m-2.d-1] 15. DEPgas-wet,gh,1h 1 hour averaged wet dep. flux downwind for greenhouse [mg.m-2.d-1] 16. DEPgas-wet,gh,24h 24 hours averaged wet dep. flux downwind forgreenhouse [mg.m-2.d-1] 17. DEPtotal,gh,1h 1 hour averaged total dep. flux downwind of greenhouse [mg.m-2.d-1] 18. DEPtotal,gh,24h 24 hours averaged total dep. flux downwind ofgreenhouse [mg.m-2.d-1]
All greenhouse parameters on deposition outside the greenhouse (on water or soil) have been replaced by DEPgh,wet,t , DEPgh,dry,t
and their sum: DEPgh,tot,t. (see
below)
8. DEPgh,wet,t 9. DEPgh,dry,t 10. DEPgh,tot,t.
Not discussed in this report
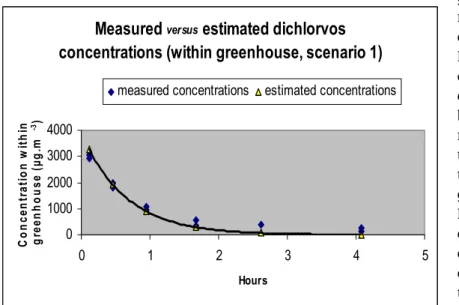
Figure 3-1 Measured versus estimated dichlorvos concentrations inside a greenhouse, after a particular period. Measured concentrations from [1]. The fitted line refers to the estimated concentrations (power regression) conform [5].
3. MODEL EVALUATION
3.1 General
The proposed calculation scheme of Table 2-2 describes the interrelated processes of volatilisation, deposition and ventilation. The lower the deposition rates within a “closed” greenhouse, the higher the residual gas-phase residues in the vicinity of a closed greenhouse can be. In this way, a “closed” greenhouse is not as closed as one may assume at first glance. The amount of gas-phase pesticides inside the greenhouse is the primary source, whereas deposition and ventilation transfer (parts of) these amounts to the sinks inside and outside the greenhouse. Calculations with a highly volatile pesticide indicate that if greenhouse windows and roofs are re-opened within a few hours after application, most of the pesticide will have been deposited or ventilated. The residual amounts inside a greenhouse then seems to be low, probably too low to have toxicological implications for re-entering personnel. On the other hand, this is based on only a few observations under particular conditions. Other conditions, e.g. temperatures, temperature differences between inside and outside the greenhouse, greenhouse size may yield different conclusions.
3.2 Validation
Validation of the calculation scheme is only possible to a very limited extent, due to a general lack of measurements under controlled conditions. However, in spite of this data lack, some cautious comparisons between estimated and measured concen-trations can be made, though for inside greenhouses only. Fig. 3-1 presents some estimated and empirically derived data. This figure refers to estimated and measured concen-trations after a particular period and shows a reasonable goodness of fit between both. For the other scenarios this goodness of fit was much less obvious (see Appendix IB)3.
Theoretically, the initially measured concentrations should equal the estimated concentrations, immediately after application (thus at t=0). This seems least valid for the scenarios 3 and 5, apparently due to the use of a non-volatile pesticide or the use of a
3 The reasonable fit between estimated and measured gas-phase concentrations inside greenhouses is not
unexpected as the calculation scheme in the present report is adapted from the same source that carried out the measurements. However, this goodness of fit referred to the use of the highly volatile dichlorvos (scenario 1) only. For the other scenarios this goodness of fit was much less clear, with the least goodness of fit for the slightly volatile fenbutatinoxide (scenario 5) (see Appendix 1B). For highly volatile pesticides, therefore, the calculation scheme seems to yield rather realistic concentrations inside the greenhouse, whereas for the other scenarios the outcomes seem to overestimate these actual concentrations.
Measured
versusestimated dichlorvos
concentrations (within greenhouse, scenario 1)
0 1000 2000 3000 4000 0 1 2 3 4 5 Hours C o n cen tr ati o n w ith in gr ee n ho us e ( µg. m -3)
inside the greenhouse may be obvious for the scenarios supposedly with the lowest gas-phase emissions. Only the estimated gas-gas-phase concentrations of highly volatile pesticides
inside greenhouses seem to reflect a more realistic scenario. In this way, the calculation
scheme seems worst-case — and possibly even unrealistically worst-case — except perhaps for highly volatile pesticides.
In Fig. 3-1 the estimated concentrations in a greenhouse with a height of 4.5 m are compared with the measured concentrations in a greenhouse with a height of 3.5 m. Correction of the inside concentration estimates for the height shows circa 26% lower inside concentrations for a 3,5 m high greenhouse. This does not explain, however, the large differences up till 1 h for the “least” emission scenarios between measurements and estimates (see the scenarios 3, 4 and 5 in Appendix IB).
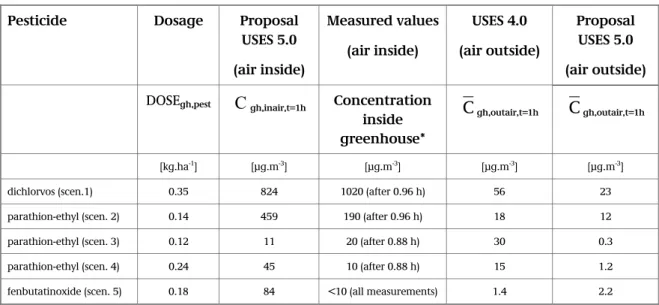
Comparing the concentrations inside the greenhouse with some measured values inside the greenhouse shows the estimated concentrations are within 55-450% of the measured concentrations (see Table 3-1). The proposed scheme compared with the model calculations of an earlier USES version yields an outdoor concentration of 1-67% of the USES 4.0 estimations.
It is interesting to note that the EPA estimated a concentration inside a greenhouse
one hour after using dichlorvos, with closed roof and sides — so comparable with the lack of ventilation via windows as in the USES proposal, — of 9803 µg.m-3 at a dosage of 3.2 kg dichlorvos per ha [4]4. This dosage would calculate a C
gh,inair,t=1h of 7536 µg.m-3 according to
the proposed calculation scheme: 24% lower, though the order of magnitude of the EPA model and the present calculation scheme is comparable.
4 Actually the EPA assumed that the maximum label application of 2 gram per 1000 feet3 was the starting-point at
t=0. This amount equals 3.2 kg.ha-1, a dosage six times higher than recommended in the Netherlands for growing
cucumbers, tomatoes, chrysanthemums, roses and kalanchoes. The EPA stated that they had no adequate data measuring dichlorvos resulting from application in greenhouses. Therefore they applied a first-order decay. Table 3-1 Comparing calculations and measurements with the present proposal (based on the
do-sages in the experiments with the actual measurements)(details on application in App. 1B).
Pesticide Dosage Proposal
USES 5.0 (air inside) Measured values (air inside) USES 4.0 (air outside) Proposal USES 5.0 (air outside)
DOSEgh,pest
C
gh,inair,t=1h Concentrationinside greenhouse*
C
gh,outair,t=1hC
gh,outair,t=1h [kg.ha-1] [µg.m-3] [µg.m-3] [µg.m-3] [µg.m-3]dichlorvos (scen.1) 0.35 824 1020 (after 0.96 h) 56 23
parathion-ethyl (scen. 2) 0.14 459 190 (after 0.96 h) 18 12
parathion-ethyl (scen. 3) 0.12 11 20 (after 0.88 h) 30 0.3
parathion-ethyl (scen. 4) 0.24 45 10 (after 0.88 h) 15 1.2
fenbutatinoxide (scen. 5) 0.18 84 <10 (all measurements) 1.4 2.2
Measurements of outdoor concentrations of methyl bromide nearby greenhouses in the 80s in the Netherlands are possibly the only available outdoor data for comparing these with the calculation scheme outcomes of the present report. Fumigation at 700 kg.ha-1 showed during the first hours after application at 20 m distance gas-phase concentrations of 5900 µg.m-3 [9]. The proposed calculation scheme yields 34489 µg.m-3 which is six times higher. The difference may be explained by the use of gas-tight film in the experiments, yielding a very small ventilation rate, probably smaller than the ventilation flow rate of a “closed” greenhouse.
3.3 Analysing parameter variation
Pesticides used in greenhouses may show large differences in dosages, intrinsic volatility and application technique (see [5]). Other parameters as the type of construction, wind speed and wind direction may be variable as well, thus causing great fluctuations in model outcomes. Some of these fluctuations have been studied in an analysis by varying some of the parameters within realistic ranges. These parameters were the wind speed (from 1 m.s-1, calm air to 16 m.s-1, strong breeze) and the ventilation flow rate (varying from 0.1-26 h-1) (for the results see Appendix IA). In this way it can be demonstrated that by varying dosage (within a realistic range, as reported in [5]), wind speed, and ventilation flow rate the estimated gas-phase concentrations inside the greenhouse after the first hour after application can theoretically differ up to almost five orders of magnitude (based on the lowest and the highest
C
gh,outair,1h in Appendix IA). This stipulates the large ranges inestimating exposure concentrations.
Two scenarios have been taken into account: one with supposedly the highest emission from inside the greenhouse to outside during the first hour after application (scenario 1), and the other with the lowest emission (scenario 4). The analysis has taken into account:
1. the actual range in pesticide dosage in horticulture (i.e. the lowest and highest dosages as reported in [5]),
2. an arbitrary “average” wind speed of 3 m.s-1 (engagement by the scientific committee that
supervises the USES projects),
4. DISCUSSION and CONCLUSIONS
4.1 Importance for USES
A calculation scheme is presented that can be used to estimate outdoor and downwind pesticide concentrations nearby greenhouses. Dependent on the input parameters and their variation, and based on realistic dosages, the outcomes may vary substantially (up to circa five orders of magnitude, when varying wind speed and ventilation flow rate), indicating a large range of exposure conditions. Although the outcomes had been expected to represent “realistic worst-case” conditions — which implies that the underlying assumptions show both a “worst-case” and a “realistic” component —, the “realism scale” is difficult to judge. Taking into account that the calculations have been based on processes (volatilisation, deposition, ventilation) and that various aspects of the calculation scheme have been based on experimental values (ventilation flow rate constants, deposition rate constants, α values), the scheme is supposedly realistic. However, the assumptions in the calculation scheme cannot be tested sufficiently yet as actual measurements of both concentrations inside the greenhouse and in lee side eddies are very scarce or lacking, respectively (see also section 4.4 on validation status). Only some comparisons with measured concentrations inside greenhouses can be made, and — cautiously concluded — these comparisons reveal that the scheme may be realistic for volatile pesticides, but probably not for less volatile pesticides. This is, however, based on only a few measurements on dichlorvos and methylbromide, and less volatile pesticides as parathion-ethyl and fenbutatinoxide.
Primary advantages of the calculation scheme proposal in this report are
1. a process-oriented approach: concentrations are based on ventilation, volatilisation and deposition, and not only on emission factors;
2. use of experimental values where possible; 3. more realistic defaults, where possible.
In this way, the calculation scheme can easily be adjusted pending new research (e.g. the α values). Another improvement is the probably more realistic outdoor concentrations (in lee side eddies) (see Table 3-1). Especially the differences in outdoor concentrations for low-and high-volume application techniques (the non-space treatments) are striking. There is no guarantee that the calculation outcomes are more reliable than the outcomes of previous USES versions, particularly in view of the poor validation status, as stated above. It is not clear why in [1] the α values for dichlorvos (0.42 and 0.60, therefore 0.51 as average) were lower than those for the less volatile parathion-ethyl (0.71), whereas the application technique was the same (LVM). This may have been due to a larger preference of dichlorvos to partition to condensation droplets (person. commun. Deneer, Alterra to RIVM). Processes may therefore be more complex than the calculation scheme suggests. On the other hand, discussion on α values shows that prospective experiments may provide more and better α values that can easily be plugged in. In conclusion, α values are still uncertain and may be replaced by more obvious (theoretical) values, until better experimental data are available.
One may wonder whether such complex and simultaneously occurring processes as volatilisation, deposition and ventilation can be modelled sufficiently by such a straightforward calculation scheme as presented in this report. Experiments of Wang and Deltour showed some of the complexities of modelling air movements in large multi-span greenhouses [8]. They found that in a 1728 m2 completely closed Venlo-type greenhouse, a
(8.33 m.s-1). These internal airflows were in the reverse direction as the external wind and probably induced by buoyancy forces and forced convection due to leakage. This may disprove that higher wind speeds cause lower lee side eddy concentrations, as assumed by the proposed calculation scheme (see e.g. Appendix 1A, page 36 and 38).
In view of the preceding, one may conclude that in spite of various uncertainties implementation of the proposed calculation scheme into USES 5.0 can be recommended, as there are improvements, in particular for the calculation of emissions or leakages of highly volatile pesticides from greenhouses. Also, process-oriented parameters can be plugged in. The proposed scheme also gives more opportunities to adjust or fine-tune the calculations, when necessary. On the other hand, the calculation scheme is far from ideal and the results of prospective experiments in this field should prove the “realism scale” of this module. Important in this respect will be the field trials by order of the Ministries of Environment and Agriculture. These are planned in 2004, and will be carried out — as a follow-up of [5] — by Alterra, IMAG, and Applied Plant Research Horticulture (Naaldwijk). RIVM will contribute to the toxicological interpretation of the data. These trials will provide better data on pesticide exposure (just) outside greenhouses.
In conclusion, the calculation schemes for the different scenarios probably reflect a worst-case approach, except for highly volatile pesticides. The likelihood of underestimating exposure of nearby residents to these pesticides seems small, whereas overestimating exposure to less volatile pesticides may still occur.
4.2 Importance for risk assessment in general
A proper and validated tool for scientifically evaluating pesticide risks for residents in greenhouse adjacent areas has not been available up till now. It is generally considered sufficient that if the horticultural workers or pesticide applicators in greenhouses are not assumed to be at (inhalatory) risk after the use of pesticides, the residents are assumed to be safe as well. The relative closed character of greenhouses will certainly have contributed to the general notion of safety for residents nearby greenhouses. So far, there is indeed little conclusive evidence in support of the opposite [5;6]. However, only very few empirical data are available on this issue. Due to expanding municipalities and greenhouse areas, it can be expected that more residents will live nearby greenhouses, urging for a scientific approach of assessing pesticide risks for nearby residents.
The calculation scheme in the present report is based on a continuous (potential) exposure of nearby residents until the greenhouse windows or roofs are re-opened just prior to re-entry of horticultural staff. The exposure just outside a greenhouse is simplified to an average concentration over a particular period of time (time-weighted average). Thus the duration of emission can be compared with the time over which particular adverse effects can be expected. Assuming that substantial emissions occur during the first hours after application with closed windows (conform [1]), only acute exposure (up to a few hours) is taken into account. Longer, e.g. subacute exposure (roughly up to circa four weeks after application) may not be relevant assuming that after a few hours the larger part of gas-phase pesticides in or around greenhouses has been dissipated. The likelihood of subacute (or longer: semi-chronic and chronic) exposure should take into account the pesticide emission patterns over weeks to years. Then other potential peak emissions — e.g. when re-opening ventilation windows prior to personnel re-entry — may be investigated as well. Such an investigation will have to focus on (very) low concentrations of gas-phase pesticides, which still is a tedious, laborious and costly affair. It will be difficult though important to distinguish between the contribution of nearby greenhouses to gas-phase concentrations to ambient air, and the contribution of other sources further away.
There are no unambiguous indications that residents are at risk due to pesticide use in greenhouses, though for some pesticides risks for residents in greenhouse adjacent areas cannot be completely excluded (see e.g. [5] and [6]). Therefore it seems reasonable to postulate as zero hypothesis H0 that greenhouse pesticides generally do not affect the health of nearby living residents. The next step from a scientific point of view is to test for the acceptance or rejection of a true zero hypothesis. Due to lack of various data, however, it is not possible yet to test the hypothesis in extenso. The calculation scheme as presented in this report may be helpful in phrasing further investigations on exposure assessment, apart from assessing preliminary risks with USES 5.0. Various other parts of the possible cause-effect relation also need further investigations. Primary targets could be systematically monitoring gas-phase pesticide concentrations just outside the greenhouses (preferably in the lee side eddy). Not only the exposure assessment but also the effects assessment should be better founded. Only then, monitoring over longer periods may reveal indications for sub-acute, semi-chronic or chronic effects. Apart from difficulties in phrasing effect levels or limit values (see [5]), there is also not much known about pesticide cocktails that may show cumulative effects when pesticides are simultaneously applied, or about the (potential) effects of small concentrations over a longer period of exposure (if realistic)5. Finally, testing the zero hypothesis (i.e. no
adverse effects to surrounding residents) may be specifically relevant when conditions occur that can increase the probability of residents being exposed (e.g. under windless and sunny conditions urging residents to recreate outdoor, large horticultural complexes with the same crop and therefore large simultaneous pesticide applications). It cannot be excluded, however, as the use of pesticides in horticulture can be expected to be further adjusted or reduced due to pesticide regulations, that investigations will be outdated in a relatively short period of time6. On the other hand, such investigations will always support and improve
generic notions rather than generating substance-specific knowledge.
USES includes only one of the three “personal” scales, as presented in § 1.5. Assessing risks —
e.g. for residents nearby greenhouses — is not a topic of USES. No international programmes
are known dealing with this issue. The risks for greenhouse workers due to the use of pesticides are a topic of EUROPOEM, a EU project on the safety of employees. The risks for consumers via contaminated agricultural products are a topic of USES by assessments in an indirect way. Direct exposure of consumers could be included by CONSEXPO, a model that estimates the direct exposure by consumer products.
4.3 Importance for decision-making
One may cautiously conclude that if for less volatile pesticides no toxicologically relevant exposure is indicated by the calculation scheme, the pesticide can be considered to be used safely, respecting nearby residents. If the calculations reveal a substantial and possibly toxicologically relevant exposure, submitted data should be reconsidered and a higher-tiered exposure assessment should be an option.
Besides being a systematic help in analysing preliminary exposure scenarios (via USES, via related scientific research), the calculation scheme may be helpful for other purposes as well. It may e.g. be helpful in the area of triggering higher-tier studies — in this case: to
5 One may distinguish between cumulative and aggregate exposure: the first refers to the exposure to different
pesticides, but with a comparable mode of action (e.g. exposure to a cocktail of organophosphates); the latter refers to exposure to the same pesticide buth via different routes (a theoretical example: exposure of a
horticultural worker to dichlorvos via greenhouses, but also via storage protection of the grains he ingests and via treatment of his pet).
6 The use of dichlorvos in the Netherlands for horticultural use in greenhouses has been banned since the middle
of 2001, whereas in the present calculation scheme dichlorvos is an important example of a highly volatile pesticide.
proposed calculation scheme the outcomes may reveal e.g. whether:
1. empirical higher-tier data should be required from the registrant when certain trigger values are exceeded (e.g. higher-tier data on pesticide emissions in relation to droplet distributions, fluxes, concentrations, inhalatory toxicity) 7;
2. risk mitigating measures should be required8,9.
Until better input data are available to adjust and improve the exposure assessment for horticultural workers and nearby residents, it should be realised that from a scientific point of view, lack of data — exposure data for residents nearby greenhouses in particular — should be reflected in relatively large uncertainty margins.
4.4 Validation status
Model analysis, including validation, has only been performed in a limited and theoretical way and therefore further work is required. The estimations of only a few measurements inside a greenhouse (in [1]) could be compared with the calculation scheme outcomes. There are almost no data available about cause-effect relations between pesticide use and emissions to open air nearby greenhouses under controlled conditions. Possibly some older research with methylbromide is useful for validation. Its horticultural use in Dutch greenhouses has been banned since 1992.
4.5 System limitations
1. Degradation in air has not been taken into account. The pesticides that have been used in this report for explanatory purposes and calculations, however, are probably resistent against
photochemical degradation during the first hours after application10. In this way, the
likelihood of overestimating gas-phase pesticide concentrations within the first hour seems limited.
2. The calculation scheme in the present report is not designed for use in site-specific assessments. It is only applicable for generic assessments.
3. When the assessment in USES is in accordance with the proposed calculation scheme in the present report, then particular technical and physical standard conditions are the starting points. However, these conditions can be adapted, to a certain extent.
4. It is recognised that certain process formulations are based on limited research and need to be improved. Further research may reveal further improvements of the calculation scheme. 5. The outcomes are based on a dosage frequency of one, whereas multiple dosages regularly
occur under horticultural conditions.
7 It can be expected that if first-tier calculations based on worst-case scenarios do not reveal a hazardous potential
impact on the health of surrounding residents, then additional (higher-tier) data based on more realistic scenarios are not necessary.
8Theoretically, such measures may include: emission-reducing technical specifications of greenhouses (e.g. extra
screens; adaptations respecting spraying equipment or a longer containment of sprayed pesticides inside the greenhouse until a proper level of degradation has been achieved; the use of gas-tight film). It should be noted that there are very few data on the risk-mitigating effects of such measures. More research on this issue is desirable [5]. One may e.g. focus on energy screens. These screens are increasingly secured in the top and against the edges of greenhouses. They prevent e.g. illumination by the sun that is too strong. They may also prevent the air from excessive cooling-down. In this way the screens buffer the micro-climate. They may also prevent pesticides leakage to the open air, though there are no empirical data available for confirmation.
9 Lower dosages cause lower substantial concentrations in lee side eddies (see Appendix IA: highest
concentrations due to low dosages do not exceed 22 µg.m-3, whereas 4048 µg.m-3 is the max. estimated
concentration for the highest dosage). In this way lowering the dosage may be considered, when doubting whether significant exposure may cause adverse effects. The efficacy at lower dosages has to be examined, of course.
10 It should be noted that data on the degradation in air of dichlorvos, parathion-ethyl and fenbutatinoxide were
not available (though an extensive literature search was not within the scope of this project). The WHO indicated in [9] that dichlorvos is rapidly degraded in air, its rate depending on air humidity.
6. Re-volatilisation after deposition (as subsequent delivery) has not been taken into account. Inclusion of that aspect would require temperature as input. Therefore, underestimation of gas-phase pesticide concentrations inside greenhouses may occur.
7. The decrease of the gas-phase pesticide concentration in greenhouses is assumed to be due to deposition and ventilation only. Partitioning into droplets e.g. has not been taken into account. Therefore overestimation of gas-phase pesticide concentrations inside greenhouses may occur.
4.6 Recommendations
While in anticipation of proper and useful experimental research, the present report deals with the state-of-the-art respecting the pesticide exposure assessment for residents nearby greenhouses. Such proper and useful research should focus on technical aspects as:
1. the validity of the proposed calculation scheme;
It is recommended to include both analytical measurements inside and outside greenhouses under controlled conditions. If the validity is not shown, the impact of various process-based parameters (e.g. rate constants) and other parameters (e.g. Kgh and α) has to be analysed. The role of temperature should be taken into account. Prospective investigations should also take into account that greenhouses can be expected to be largely scaled-up.
2. risk assessment for residents nearby greenhouses;
Exposure assessment should have sufficient resolution, to be compared with inhalatory no-effect levels for humans. Therefore it is important to develop exposure models on equal terms with the effects assessment. The availability of a very detailed and realistic exposure assessment should not be undone by very rough limit values (that “do not need” such a detailed exposure assessment).
3. the number of volatility classes;
Only three volatility classes have been taken into account conform [5], whereas previous versions of USES discern five volatility classes. In this way, the scheme could be refined.
4. the application scenarios;
The scenario causing the least pesticide emissions is one for a moderately volatile pesticide (no. 4). It is not the scenario for a slightly volatile pesticide (no. 5), as one could intuitively expect. It should be investigated whether this difference is real, as there seems no plausible explanation for this difference.
5. the α values;
The α values are based on experimental recoveries, immediately after application (gas-phase concentrations at t=0). The advantage of such correction factors is that they refer to actual conditions, and that they are easy to substitute by more extensive data in this field. However, as they refer to a few experiments with three different pesticides only, their foundations are weak (no testing whether α values are statistically significant). Besides, the effects of the temperature under the experimental conditions were not clearly reported. It is therefore recommended that further experiments should aim at a more solid determination of useful and reliable α values. Mass balances will be helpful to validate these α values. This recommendation had also been postulated in [1]. In conclusion, the quality of the available α values does not seem to legitimate yet their inclusion in the USES proposal.
6. photochemical degradation;
The assumption of photochemical stability of dichlorvos, parathion-ethyl and fenbutatinoxide during at least the first hours after application should be better investigated. The inclusion of such data in (re)registration dossiers should be considered.
some application conditions (i.e. space treatment) also moderately, volatile pesticides will show measurable gas-phase concentrations inside a greenhouse conform the proposed calculation scheme. The estimations may deviate increasingly (estimations increasingly exceeding measured concentrations) for scenarios with supposedly less gas-phase emissions. Due to the nearly complete lack of measurements in ambient air nearby greenhouses under controlled conditions, (almost) immediately after pesticide applications, statements on validity of the scheme are not possible yet.
REFERENCES
1. Baas J. and Huygen C. (1992) [Emissions of agricultural pesticides from greenhouses to open air]. TNO Report no. IMW-R 92/304 (in Dutch).
2. CBS (9/2002) www.cbs.nl.
3. Commission of the European Communities (2002) Communication from the Commision to the Council, the European Parliament and the Economic and Social Committee: towards a thematic strategy on the sustainable use of pesticides. COM(01-07-2002) 349 final.
4. Jaquith D. (1999) Memorandum of the Health Effects Division of EPA US: revision of exposure assessment for dichlorvos (DDVP) applied to greenhouses and mushroom houses (D251337, PC code 084001). 27-01-1999.
5. Leistra M., van der Staay M., Mensink B.J.W.G., Deneer J.W., Meijer R.J.M., Janssen P.J.C.M. and Matser A.M. (2001) [Pesticides in the air around greenhouses: how to estimate the exposure of nearby residents and the effects]. Alterra rapport nr. 296. [in Dutch] .
6. Mensink B.J.W.G. and Linders J.B.H.J. (1998) Airborne pesticides concentrations near greenhouses [acute exposure and potential effects to humans]. RIVM Report No. 679102040.
7. RIVM, VROM and VWS (2002) Uniform System for the Evaluation of Substances 4.0 (USES 4.0). National Institute for Public Health and the Environment (RIVM), Ministry of Housing, Physical Planning and the Environment (VROM), Ministry of Health, Welfare and Sports (VWS), the Netherlands. RIVM report no. 601450012.
8. Wang S. and Deltour J. (1999) Lee-side ventilation-induced air movement in a large-scale multispan greenhouse. J. Agric. Engng Res. 74 : 103-110.
![Fig. 2-1 and Tables 2-1 and 2-2 are based on [5].](https://thumb-eu.123doks.com/thumbv2/5doknet/3080886.9430/17.892.151.761.555.820/fig-tables-based.webp)