EFFECT OF MEAT-RELATED COMPOUNDS ON
THE METABOLISM OF COLON CANCER CELLS:
THE ROLE OF GLUCOSE AND GLUTAMINE
Loes Lombaert
Student number: 01405438
promoter: prof. dr. ir. John Van Camp Copromoter: prof. dr. apr. Olivier De Wever
Tutors: dr. ir. Charlotte Grootaert, ir. Elien Alderweireldt
Master’s Dissertation submitted to Ghent University in partial fulfilment of the requirements for the degree of Master of Science in Bioscience Engineering: Food Science and Nutrition
Deze pagina is niet beschikbaar omdat ze persoonsgegevens bevat.
Universiteitsbibliotheek Gent, 2021.
This page is not available because it contains personal information.
Ghent University, Library, 2021.
Acknowledgements
In the final year of my bio-engineering studies I mainly focused on this master’s thesis. I have learned to work independently, to process scientific information and to criticize. Without the help of some people I would not have been able to bring this work to a successful end. For this reason I would like to thank them.
First of all, I would like to thank professor dr. ir. John Van Camp and professor dr. apr. Olivier De Wever for the opportunities they gave me to participate in this research. Thank you for the feedback and for the monthly discussions that were very helpful for the progress of my thesis. I would also like to thank dr. ir. Charlotte Grootaert for teaching me techniques in the lab, but also for the further guidance of my thesis and for giving me insights when I was stuck in the middle.
Special thanks go to ir. Elien Alderweireldt. She taught me to work accurately in the lab, to critically analyze scientific literature and to draw conclusions based on my results. I would also like to thank her for reviewing my thesis so many times and for her motivational support. It may sound cliché, but I really could not imagine a better tutor.
I would also like to thank the whole lab team for making me feel at home from the beginning, for helping me find certain compounds and giving me advice when I needed it.
Furthermore, I want to thank my parents for all the chances I have had. In particular, I would like to thank my mom for all the soup, snacks and cakes, but especially for her endless support over the past years. I also want to thank my boyfriend for joining me in my enthusiasm for my research, but also for believing in me when I did not. Last but not least, I would like to thank my bio-engineer friends for being my study buddies, my partners in crime, my motivation in hard times, for making my student days the best time of my life.
Abstract
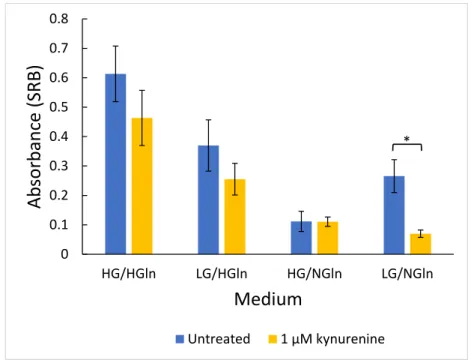
Colorectal cancer is one of the most common cancers worldwide and is strongly associated with dietary factors, including red and processed meat. Based on a wide range of epidemiological studies, processed meat has been classified as ’carcinogenic to humans’ and red meat as ’probably carcinogenic to humans’. However, it remains unclear which components in meat are responsible for the increased risk of colorectal cancer. In this master dissertation, an in vitro approach was used to study the influence of meat-related compounds on colorectal cancer. More specifically, kynurenine and kynurenic acid were selected as meat-related compounds for this research due to their higher abundance in red meat digests compared to white meat digests. In addition, the focus was mainly on the energy metabolism of colon cancer cells. Since glucose and glutamine play an important role, we looked more closely at how they influence energy metabolism. Given that the influence of dietary factors on cancer is rather a long-term process, primarily long-term experiments were carried out. Cells from the HCT8/E11 colon cancer cell line were exposed to different medium compositions and different concentrations (10 nM - 100 µM) of kynurenine and kynurenic acid. The effect on cell growth (SRB, IncuCyte c), energy metabolism (resazurin, MTT, LDH) and oxidative stress (ROS, GSH) was determined. The effect of kynurenine on cell growth remained limited, while kynurenic acid slightly stimulated growth. Nevertheless, it is likely that these components influence cancer cells as they appear to be involved in different pathways in tumor development and proliferation. Difference in medium composition did not influence oxidative stress (ROS). Treatment with kynurenine and kynurenic acid both increased oxidative stress (GSSG/GSH). Exposure to a high glucose concentration (25 mM) gave rise to an increased cell growth compared to a low glucose concentration (5.5 mM). A difference in cell growth was not observed between low and high glutamine concentration (0.65 mM vs. 2 mM). However, in absence of glutamine, the cells were inhibited in their growth. Serum concentration and presence of non essential amino acids also affected cell growth. We can conclude that the glucose concentration influences the energy metabolism of cancer cells, while the concentration of glutamine did not affect the growth, unless glutamine is absent. Moderate stimulating effects of kynurenic acid on cell growth were observed. Further research is needed to confirm the effects of kynurenine and kynurenic acid on colon cancer.
Keywords: Colorectal cancer, red meat, processed meat, energy metabolism, kynurenine,
glu-cose, glutamine.
Samenvatting
Colorectale kanker of dikkedarmkanker is een van de meest voorkomende kankers ter wereld en is sterk gelinkt met voedingsfactoren, zoals rood en verwerkt vlees. Op basis van heel wat epidemiologische studies werd verwerkt vlees geclassificeerd als ’carcinogeen voor mensen’ en rood vlees als ’waarschijnlijk carcinogeen voor mensen’. Het blijft echter onduidelijk welke com-ponenten in vlees verantwoordelijk zijn voor het verhoogd risico op dikkedarmkanker. In deze masterthesis werd gebruik gemaakt van een in vitro onderzoek om de invloed van vleesgere-lateerde componenten op colonkanker te bestuderen. Kynurenine en kynureninezuur werden gekozen als vleesgerelateerde componenten voor dit onderzoek omwille van hun hoger voorkomen in digesten van rood vlees t.o.v. wit vlees digesten. Daarnaast werd er voornamelijk gefocust op het energiemetabolisme van colonkankercellen. Aangezien glucose en glutamine hierin een belangrijke rol spelen, werd er aan deze componenten ook meer aandacht besteed. Doordat de invloed van voedingsfactoren op kanker eerder een langetermijnsproces is, werden er voor-namelijk langetermijn experimenten uitgevoerd. Cellen van de HCT8/E11 colonkanker cellijn werden blootgesteld aan verschillende mediumcomposities en verschillende concentraties (10 nM - 100 µM) kynurenine en kynureninezuur. De invloed op celgroei (SRB, IncuCyte c), en-ergiemetabolisme (resazurine, MTT, LDH) en oxidatieve stress (ROS, GSH) werden bepaald. De impact van kynurenine op celgroei bleef beperkt, terwijl kynureninezuur de groei lichtjes bevorderde. Desondanks is het zeer waarschijnlijk dat deze componenten kankercellen beïn-vloeden aangezien ze in verschillende pathways in tumorontwikkeling en -proliferatie betrokken blijken te zijn. Een verschil in mediumcompositie bleek geen invloed te hebben op de oxidatie stress (ROS). Behandeling met kynurenine en kynureninezuur bleek de oxidatieve stress te ver-hogen (GSSG/GSH). Blootstelling aan een hoge glucoseconcentratie (25 mM) veroorzaakte een verhoogd celgroei in vergelijking met een lage glucoseconcentratie (5,5 mM). Er werd geen ver-schil in celgroei opgemerkt tussen lage en hoge glutamineconcentratie (0,65 mM vs. 2 mM). De celgroei werd echter verhinderd bij afwezigheid van glutamine. Serumconcentratie en de aanwezigheid van niet-essentiële aminozuren hadden ook een invloed op celgroei. We kunnen besluiten dat de glucoseconcentratie het energiemetabolisme van kankercellen beïnvloedt, ter-wijl glutamineconcentratie geen invloed heeft op groei, tenzij glutamine afwezig is. Er werden beperkte stimulerende effecten van kynurenine en kynureninezuur waargenomen. Verder onder-zoek is nodig om de effecten van deze componenten op colonkanker te bevestigen.
Kernwoorden: Colorectale kanker, dikkedarmkanker, rood vlees, verwerkt vlees, energiemetabolisme,
kynurenine, glucose, glutamine.
Contents
Acknowledgements iii
Abstract v
Samenvatting vii
List of Abbreviations xiii
Introduction 1
I Literature 3
1 Red/processed meat and colon cancer 5
1.1 Colorectal cancer (CRC) . . . 5
1.2 Risk factors CRC . . . 6
1.3 Differences between types of meat . . . 6
1.4 Mechanisms: how red/processed meat is involved in CRC . . . 7
1.4.1 High temperature treatment . . . 7
1.4.2 Saturated fat . . . 7
1.4.3 Carnitine metabolism . . . 7
1.4.4 The heme iron hypothesis . . . 8
1.4.5 Kynurenine pathway . . . 10
2 Colon cancer cell metabolism 15 2.1 The Warburg effect . . . 17
2.2 Tumor microenvironment . . . 18
2.2.1 Subpopulations in the TME . . . 18
2.2.2 Conditions in the TME . . . 19
2.3 Macromolecular biosynthesis . . . 19
2.4 Glutamine as a key metabolite in colon cancer cells . . . 20
2.4.1 Amino acid metabolism . . . 20
2.4.2 Glutamine addiction in colon cancer cells . . . 20
3 Research approaches 23
3.1 Human studies . . . 23
3.2 Animal model studies . . . 24
3.3 In vitro models . . . 24
3.3.1 Types of cell lines . . . 24
3.3.2 2D and 3D cell cultures . . . 25
3.3.3 Medium . . . 27
Objectives 29 II Materials and methods 31 1 Experimental set-ups 33 1.1 Cell culture . . . 33
1.1.1 Cell maintenance . . . 33
1.1.2 Subculturing adherent cell lines . . . 33
1.1.3 Cell counting . . . 33
1.2 Two dimensional experiments . . . 34
1.2.1 Short-term experiments . . . 34
1.2.2 Long-term experiments . . . 34
1.3 Three dimensional experiments — Spheroids . . . 34
2 Bio-assays 35 2.1 Protein content assays . . . 35
2.1.1 Bradford . . . 35
2.1.2 Sulforhodamin B (SRB) . . . 35
2.2 Cell activity assays . . . 35
2.2.1 CellTiter-Glo c . . . 35
2.2.2 MTT . . . 36
2.2.3 Resazurin . . . 36
2.3 Oxidative stress assays . . . 36
2.3.1 Glutathione . . . 36
2.3.2 Reactive Oxygen Species (ROS) . . . 37
2.4 Lactate dehydrogenase (LDH) measurement . . . 37
3 Statistics 39 III Results 41 1 Growth 45 1.1 Medium composition . . . 45
2 Energy metabolism 55 2.1 Medium composition . . . 55 2.2 Treatment . . . 56 3 Oxidative stress 63 3.1 Medium composition . . . 63 3.2 Treatment . . . 65 IV Discussion 67 V Future perspectives 79 VI Conclusion 83 VII Appendix 87 Impact of COVID-19 89 Supplementary figures 91 References 91
List of Abbreviations
4-HNE 4-hydroxynonenal
αKG α-ketoglutarate
AhR Aryl hydrocarbon receptor APC Adenomatous polyposis coli
ATNC Apparent total N-nitroso compounds ATP Adenosine triphosphate
CAF Cancer-associated fibroblast CRC Colorectal cancer
CTLA-4 Cytotoxic T-lymphocyte–associated antigen 4 DMEM Dulbecco’s Modified Eagle Medium
FAP Familial adenomatous polyposis FBS Fetal Bovine Serum
G6P Glucose-6-phosphate
GCN2 General control nonderepressible 2 GCPR G protein-coupled receptor
GLUT1 Glucose transporter 1
GPT2 Glutamate pyruvate transaminase 2 GSH Glutathione
HCA Heterocyclic amines HG High glucose HGln High glutamine
HIF Hypoxia-inducible factor
HK Hexokinase
IDO-1 Indoleamine-2,3-dioxygenase IFN-γ Interferon gamma
IL-1 Interleukin-1
KAT Kynurenine aminotransferase
LG Low glucose
LGln Low glutamine
Lgr5 Leucine-rich repeat-containing G-protein-coupled receptor 5 MAPK Mitogen activated protein kinase
MDA Malondialdehyde
mTOR1 Mammalian target of rapamycin 1
NADPH Reduced nicotinamide adenine dinucleotide phosphate NEAA Non essential amino acids
NG No glucose NGln No glutamine
NOC N-nitroso compounds PBS Phosphate buffered saline
PDK1 Pyruvate dehydrogenase kinase 1 PEP Phosphoenolpyruvate
PKM2 Pyruvate kinase isoform M2 PPP Pentose phosphate pathway PTEN Phosphatase and tensin ROS Reactive oxygen species SRB Sulforhodamin B TCA Tricarboxylic acid TCA Trichloroacetate TCF T cell factor
TDO Tryptophan 2,3-dioxygenase Teff Effector T cell
TME Tumor microenvironment TNF-α Tumor necrosis factor alpha Treg Regulatory T cell
Introduction
Nowadays, people are increasingly concerned with health and food trends. They are more in-terested in the origin of the products they buy and what influence it has on their health. One of the hot topics is meat. Although meat is an important source of proteins, vitamins and minerals, such as iron, more and more people are choosing to consume less meat because of animal suffering, the impact on the environment or an increased risk of cardiovascular disease and cancer. And indeed, a high consumption (more than 500 grams per week) of red and pro-cessed meat appears to increase the risk of colon cancer by 20% (Huxley et al., 2009). It should be noted that the risk of colorectal cancer in Belgium is 4% (Belgian Cancer Registry, 2020) and an increase of 20% due to a high consumption of red and processed meat thus results in 4.8%. The aim of this thesis is to gain more insight on how red and processed meat affects colon cancer. The main focus will be on the energy metabolism of cancer cells and the role that meat-related components can play in this regard. Kynurenine and kynurenic acid will be discussed in detail because of their increased concentration in red meat digests compared to white meat. Additionally, attention will be paid to glucose and glutamine as these components are closely involved in the energy metabolism of cancer cells.
In the first part a literature review is given with regard to the subject. It discusses the develop-ment of colon cancer and how red meat can be involved, the energy metabolism of tumor cells and possible research methods in this field. After an overview of the used methodologies, the results will be described. Next, the outcomes will be discussed to provide insights into energy metabolism and how kynurenine and kynurenic acid are involved. Finally, future perspectives are proposed and a conclusion will be formulated.
Part I
Literature
Chapter 1
Red/processed meat and colon cancer
1.1
Colorectal cancer (CRC)
The colon consists of an epithelium with a single sheet of four types of differentiated epithe-lial cells: colonocytes or absorptive cells, enteroendocrine cells, mucus-secreting Goblet cells and Paneth cells. The epithelium forms finger-like invaginations into the underlying connective tissue of the lamina propria, the crypts (Figure 1A). The bottom of the crypt is occupied by stem cells, surrounded by mesenchymal cells. Many stem cells are present in the bottom of the crypt and can be characterized by expression of the marker gene Lgr5 (leucine-rich repeat-containing G-protein-coupled receptor 5). They feed the transit-amplifying zone, where most cell production occurs. In this part of the crypt, progenitor cells are present as well: these cells differentiate into colonocytes, enteroendocrine cells or Goblet cells (Humphries & Wright, 2008). The differentiated cells migrate to the surface of the epithelium and undergo apoptosis within 48-72 hours (Degirolamo et al., 2011). The stem cells divide into two cells (Figure 1B). Three patterns of cell-divisions can occur. In an asymmetric stem-cell division, the so-called q division, one cell remains in the niche as a stem cell while the other will undergo differentiation (Figure 1B, a) (Meineke et al., 2001). Symmetric divisions can happen as well: production of two stem cells, p division (Figure 1B, b), or two cells destined to differentiate, r division (Figure 1B, c) (Humphries & Wright, 2008).
The early onset of colorectal cancer occurs at the level of the stem cells. When a mutation occurs (for example in the APC gene) in one of the stem cells at the base of the crypt, mutated clones can be formed (blue cells in Figure 1C, b). The clones can migrate in straight lines towards the top of the crypt (Figure 1C, c). Next, the mutant clone begins to colonize the base of the crypt (Figure 1C, d) and replaces the non-mutant stem cells through genetic drift or acquiring a selective advantage (Figure 1C, e). This process is called niche succession (Figure 1D). The mutant clone will eventually occupy the entire crypt: a monocryptal adenoma is formed (Meineke et al., 2001). The adenoma expands by crypt fission and expansion of a dominant clone can lead to a largely monoclonal tumor. Once the adenoma is formed, other mutations can occur that allow cells to transform into malignant tissue (Humphries & Wright, 2008).
Figure 1: Colonic crypt organization, patterns of stem cell divisions, niche succession and clonal
conversion (Humphries & Wright, 2008)
1.2
Risk factors CRC
Over the last decades, consumers have become more aware of the effects of food on health. Most people are familiar with the following facts: salt increases blood pressure, saturated fat increases cholesterol, sugar-rich diets are related to unhealthy weight gain, which can lead to overweight and obesity... (WHO, 2019) But the risk for colon cancer from the consumption of processed/red meat remains unclear.
Colorectal cancer (CRC) is one of the most common cancers globally. Between 30 and 50% of cancer deaths could be prevented by a change in lifestyle (WHO, 2019). Based on a comprehen-sive series of meta-analyses, it was suggested that high alcohol consumption increases the risk of colorectal cancer with 60% compared to no or low consumption. Smoking, diabetes, obesity and high red and processed meat intake cause a 20% greater risk on colon caner. Physical activity, on the other hand, indicates a 20% reduction in the risk. The consumption of fish and poultry is not associated with CRC development (Huxley et al., 2009).
1.3
Differences between types of meat
Read meat includes beef, veal, mutton, pork and offal, while white meat includes poultry and fish. When meat or offals are cooked, dried, smoked or cured, it is referred to as processed meat (Corpet, 2011). Processed meat has been classified as ’carcinogenic to humans’ and red meat as ’probably carcinogenic to humans’ (Bouvard et al., 2015).
1.4. Mechanisms: how red/processed meat is involved in CRC 7
In the first place, meat is a rich source in proteins. It contains a variable amount of fat, vitamins and minerals as well. Only a small amount of carbohydrates is present. The fat of ruminants (e.g. cows) is generally more saturated than the fat of monogastric animals (e.g. pigs, chickens...). Meat is a good source of bioavailable heme iron, which is present as myoglobin in the muscles. Myoglobin is responsible for the storage, transport and release of oxygen in the muscles (De Smet & Vossen, 2018). In red meat heme iron is up to 10 times more present than in white meat, which is visible in the colour of the meat (Bastide et al., 2015). Besides heme iron, L-Carnitine is an important component in meat: it facilitates the transport of activated long chain fatty acids from the cytosol into the mitochondria, making them available for mitochondrial β-oxidation. Meat and dairy products are a rich source of carnitine. The amount of carnitine in beef is 1950 mg/kg DM, followed by pork (613 mg/kg DM). Only a small amount of carnitine is present in poultry (344 mg/kg DM) (Seline & Johein, 2007).
1.4
Mechanisms: how red/processed meat is involved in CRC
Several nutrients, processing conditions and metabolites have been identified as possible media-tors of tumor development and progression. Unfortunately, there is still no hypothesis that fully reveals the link between red/processed meat and colorectal cancer.
1.4.1 High temperature treatment
When meat is cooked at high temperature, mutagenic heterocyclic amines (HCA) are produced. However, these HCA are not considered to play an important role in the development of colon cancer. First, HCA are also present in cooked chicken, which is not associated with the risk on CRC (Sinha et al., 1994). Secondly, the doses that human ingest is 1000 to 100.000 lower than the doses of HCA that induce cancer in animals (Stavric, 1994).
1.4.2 Saturated fat
A second hypothesis is that a high concentration of saturated fatty acids in red and processed meat increases the risk of CRC. A study of Yilmaz (2018) showed that a high fat diet changed the biology of intestinal stem cells, causing increased tumor development. However, it is unlikely that a large amount of (saturated) fat will end up in the colon as these nutrients are mainly broken down in the small intestine (Van Camp, 2018).
1.4.3 Carnitine metabolism
Rombouts et al. (2017) found that 3-dehydroxycarnitine and glutarylcarnitine are formed during digestion of carnitine. Other acylcarnitines are found in red meat digest as well. Rombouts et al. (2017) hypothesized that these are already present in the red meat and are not formed during digestion of carnitine. These acylcarnitines are degraded by colonic bacteria.
During the fatty acid metabolism, long-chain acyl groups are transferred to carnitine by coen-zyme A in the cytosol, which results in the formation of acylcarnitines. Next, the complexes are transported into the mitochondrial matrix for further oxidation to acetyl-CoA, which plays a key role in the citric acid cycle (Rombouts et al., 2017; Dambrova & Liepinsh, 2015).
3-dehydroxycarnitine acts as an intermediate metabolite in the intestinal bacterial catabolism of L-carnitine to trimethylamine (Koeth et al., 2014). Trimethylamine can be converted to trimethylamine-N-oxide (TMAO), which is linked to atherosclerosis, through the modification of the cholesterol metabolism (Koeth et al., 2013). So far, there is no evidence that TMAO and/or 3-dehydroxycarnitine are directly related to the formation of colon cancer (Xu et al., 2015).
1.4.4 The heme iron hypothesis
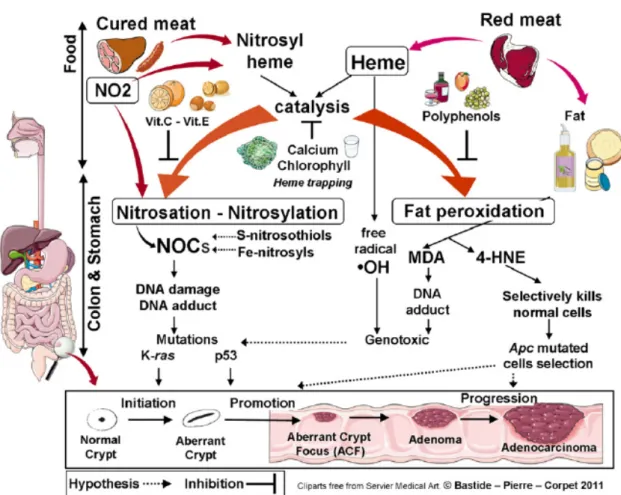
Heme consists of an iron atom in the center of a polyphyrin ring. Heme is present in hemoglobin, myglobin and cytochromes. Nitrate or nitrite, present in the curing salts in processed meat, leads to nitrosation of the heme. The hypothesis is based on the catalytic effect of heme on the for-mation of N-nitroso compounds (NOC) and lipid oxidation products (Bastide et al., 2011). Next to this indirect effects, it is likely that heme also exerts a direct effect on cells e.g. genotoxicity (Corpet, 2011).
Nitrosylation
NOC are formed by N-nitrosylation of amines and amides, which are first produced by bacterial carboxylation of amino acids in the presence of a nitrosating agent (Mirvish, 1995). Nitrosyl iron, S-nitrosothiols, nitrosamines and nitrosamides are together referred to as the apparent total N-nitroso compounds (ATNC). The fecal concentration of ATNC in rats with a diet rich in red meat (600g/d) was three times higher than a diet with little red meat (60g/d) or only white meat (Hughes, 2001). The ATNC consist mainly of Fe-nitrosyl heme when consuming red meat. However, when cured meat is consumed, the main part of ATNC is made of N-nitroso-compounds (Joosen et al., 2009). The carcinogenicity of nitrosated N-nitroso-compounds produced in the gut after intake of heme from red or processed meat is still unknown. The following hy-pothesis from Corpet (2011) is represented in Figure 2. The influence of cured red meat on carcinogenesis promotion is mainly linked to N-nitrosation. Most NOC can yield alkylating agents during metabolism, which can cause DNA damage. For example, N-methyl-N-nitrosurea induces G → A transitions in K-RAS in 30% of rat colon carcinoma (Jacoby et al., 1992). Be-sides that, nitrosated glycine derivates react with DNA forming promutagenic and toxic adducts, like O6-carboxymethylguanine (Lewin et al., 2006). Potassium diazoacetate, a stable form of nitrosated glycine, induces mutations in the TP53 gene in a functional yeast assay, where the patterns were similar with those of the human colon tumors (Gottschalg et al., 2007).
1.4. Mechanisms: how red/processed meat is involved in CRC 9
Figure 2: Catalytic effect of heme iron on fat peroxidation and N-nitrosation, and their inhibition
by dietary means (Corpet, 2011).
APC gene, K-RAS can promote tumor progression (Haigis et al., 2008). The p53 protein is a transcription factor that is generally an inhibitor of cell growth and stimulates cell death when triggered by cellular stress (Vogelstein & Kinzler, 2004; Menendez et al., 2009). A point mutation in the TP53 oncogene leads to the synthesis of an inactive p53 protein with an abnormally long half-life (Menendez et al., 2009).
Fat peroxidation
The influence of fresh red meat on carcinogenesis promotion is mainly linked to fat peroxidation according to Corpet (2011) (Figure 2). The polyunsaturated fatty acid residues of phospholipids have a high sensitivity to oxidation. Free-radicals of membrane lipids initiate lipid peroxidation and heme catalyzes the reaction (Tappel, 2007). Lipid hydroperoxides are produced by the oxi-dation reaction. Because they are short lived, they are either reduced by glutathione peroxidase to unreactive fatty acid or they react with metals to form reactive compounds like epoxides and aldehydes. Malondialdehyde (MDA) and 4-hydroxynonenal (4-HNE) are the major aldehydes produced by lipid peroxidation (Marnett, 2000). MDA is considered to be toxic and binds DNA, which leads to the formation of mutagenic adducts. 4-HNE kills normal cells by inducing apop-tosis and it stimulates the growth of precancerous cells that are mutated on the adenomatous
polyposis coli (APC) gene (Pierre et al., 2007).
The APC gene is a tumor suppressor gene and encodes a large multidomain destruction complex which is important in the Wnt-signalling pathway (Fearnhead, 2001). In absence of Wnt signals, free β-catenin is bound and phosphorylated to the complex, leading to proteolytic degradation. The phosphorylation and degradation can be blocked if Wnt signals are present or a mutation in the APC gene or β-catenin occurs. This allows a transfer of β-catenin into the nucleus where it binds to the T-cell factor (TCF). These complexes can bind to DNA, leading to the activation of Wnt target genes (Behrens, 2005). Wnt target genes play a role in CRC devel-opment. Regulators of cell cycle progression are activated by TCF-β-catenin complexes. Wnt signalling regulates cell proliferation and can prevent apoptosis as well (Lustig & Behrens, 2003).
1.4.5 Kynurenine pathway
(a) (b)
(c) (d)
Figure 3: Chemical structures of (a) tryptophan, (b) glutamine, (c) kynurenine and (d)
kynurenic acid.
N’-Formylkynurenine, kynurenine and kynurenic acid are formed during the catabolism of tryp-tophan (Moffett & Namboodiri, 2003). The chemical structures of tryptryp-tophan, kynurenine, kynurenic acid and glutamine are represented in Figure 3. Glutamine is included in the figure for its similar structure. The kynurenine pathway is shown in Figure 4. Tryptophan is an es-sential amino acid which is a precursor for serotonin and other functional molecules in the brain tissue and plays a role in the cell survival, protein synthesis and kynurenine pathway (Sainio et al., 1996; Le Floc’h et al., 2011; Birdsall, 1998). The tryptophan concentration is not higher in beef compared to chicken meat (Górska-Warsewicz et al., 2018). This means that other red meat compounds have to be involved in the formation of the tryptophan catabolites. The formation of N-formylkynurenine can be catalyzed by two different enzymes: tryptophan 2,3-dioxygenase (TDO) or indoleamine 2,3-deoxygenase (IDO-1 and IDO-2) (Moffett & Namboodiri,
1.4. Mechanisms: how red/processed meat is involved in CRC 11
2003). TDO is located in the liver, while IDO is expressed in all organs (Brady, 1975; Uhlén et al., 2015). Active IDO-enzymes are also found in bacteria and fungi such as Saccharomyces
cerevisiae and Candida albicans, which occur in the human gut (Yuasa et al., 2011; Yuasa &
Ball, 2011; Inglis et al., 2012). During inflammation, IDO-1 is commonly expressed, which makes it the most important enzyme to degrade tryptophan (Ott et al., 2015). Microorganisms (including pathogens, viruses) are inhibited in their growth by a tryptophan depletion because they prefer to use amino acids from their environment rather than produce them because the latter requires a higher energy consumption. Besides, tryptophan degradation and production of the toxic metabolite kynurenine mediate immunoregulatory effects (Müller et al., 2009). IDO-1 is upregulated by inflammatory molecules and cytokines, like interleukin-IDO-1 (IL-IDO-1), interferon gamma (IFN-γ) and tumor necrosis factor alpha (TNF-α) (Babcock & Carlin, 2000; Werner-Felmayer et al., 1989). The further conversion of kynurenine into the other metabolites in the pathway remains limited in the colon since the downstream enzymes are lacking. Only in hep-atocytes, all the enzymes of the kynurenine pathway are present. (Moffett & Namboodiri, 2003).
Figure 4: A schematic representation of the key enzymes and metabolites in the kynurenine
pathway (Routy et al., 2016).
According to the findings of Thaker et al. (2013), kynurenine has two complementary functions in epithelial tumors: stimulating tumor cell proliferation and promoting tumoral immune tol-erance. Kynurenine and quinolinic acid stimulate activation of β-catenin and transcription of
Wnt-β-signaling (cyclin D1), which promotes tumor growth and proliferation of the neoplastic epithelium in a cell-autonomous fashion (Thaker et al., 2013).
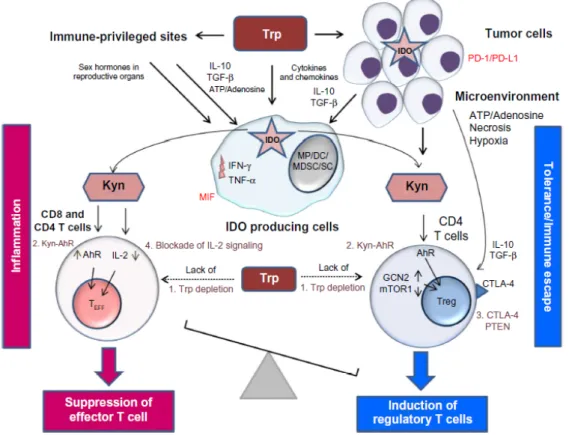
Kynurenine has toxic effects on T-cell proliferation (Terness et al., 2002; Frumento et al., 2002), which is beneficial for tumor cells because they are less sensitive for the toxic effects of kynurenine. In this way they create a protection from anti-tumor T-cell response (MacKenzie et al., 2007). Figure 5 shows how kynurenine is involved in four different ways in the immune tolerance.
Figure 5: The role of the kynurenine pathway in inducing tolerance in immune-privileged sites,
in tumors, and in the tumor microenvironment (Routy et al., 2016) .
The first mechanism refers to the depletion of tryptophan, followed by the induction of the stress response kinase, general control nondepressible 2 (GCN2) and the suppression of mammalian target of rapamycin 1 (mTOR1) (Munn et al., 2005; Fallarino et al., 2006). GCN2 activation in T-cells leads to proliferative arrest and anergy (Munn et al., 2005). In tumor cells, on the other hand, the GCN2 activation stimulates cell survival and proliferation (Ye et al., 2010). Next, kynurenine and kynurenic acid can directly bind to the aryl hydrocarbon receptor (AhR) (Plat-ten et al., 2015; Heng et al., 2016). Activation of this receptor leads to expansion of regulatory T-cells (Treg cells), creating an immunosuppressive zone around the IDO-1 expressing tumors (Heng et al., 2016). The third mechanism contributes to the differentiation of CD4 T-cells into Treg cells through expression of the cytotoxic T-lymphocyte–associated antigen 4 (CTLA-4) and phosphatase and tensin homolog (PTEN), which prevents reprogramming the Treg cells
1.4. Mechanisms: how red/processed meat is involved in CRC 13
into inflammatory effector T-cells (Teff cells) (Sharma et al., 2015). Finally, interleukin 2 (IL-2) is inhibited which affects memory CD4 T cell survival (Ravishankara et al., 2015; Quintana et al., 2010; Dagenais-Lussier et al., 2016).
A study of Brandacher et al. (2006) showed that IDO-1 was expressed in colorectal tumor cells of all 143 cases included in the study. There can be concluded that IDO-1 activation can convert local T-cell function from an immunogenic one to a tolerogenic one, which benefits the survival of tumor cells (Routy et al., 2016). Rombouts et al. (2017) hypothesized that heme stimulates the formation or increases the activity of IDO-1 because this enzyme can selectively and non-covalently bind to heme (Inglis et al., 2012).
Chapter 2
Colon cancer cell metabolism
Glucose is an important molecule in the energy metabolism (Figure 6). During glycolysis, one mole of glucose is converted into two moles of pyruvate, ATP and NADH. Pyruvate is included in the mitochondria where it enters the tricarboxylic acid (TCA) cycle to generate NADH, which is an electron donor of the oxidative phosphorylationpathway. In this pathway, 36 units of ATP are produced. Certain molecules, like pyruvate, glutamate and fatty acids, ensure the continued supply of carbon skeletons in the cycle. Some intermediates from the TCA cycle are used as building blocks in biosynthesis. In addition, mitochondria are responsible for the generation of reactive oxygen species (ROS) and play a role in apoptosis. (Romero-Garcia et al., 2011). The energy is needed for biochemical synthesis of the carbohydrates, nucleotides, proteins and lipids as building blocks for cells and tissues. The maintenance of the redox balance is important to combat oxidative stress. Reduced nicotinamide adenine dinucleotide phosphate (NADPH) is a cofactor that provides reducing capacity and drives anabolic biochemical reactions (Cairns et al., 2011).
It is known that cancer cell metabolism and normal cell metabolism are different in several ways, which will be discussed in this chapter.
TCA
TCA
GLUT
Pyruva teGLUT
G6 PEP P Glu co se Ace tyl -CoA Glu co se 2 ATP Glycolysis Pyruva te PEP G6 P Glu co se Ace tyl -CoA Glu co se 2 ATP Glycolysis La cta te M acromole cu les NADPH Fa tty acids αK G 36 A TP PPP PK M 2 Biosyn th esis Biosyn th esis Fa tty acid biosyn th esis Glu ta m ine GS H Glu ta m ate αK G M YC M YC Glu ta m ate M alat e La cta te NA DP +/NA DH NA DP H/NA D + 36 A TPN
OR MA L CE LL ST
UMOR CEL LS Am m on ia NEA A PI3 K-Akt Ras HK pH Figure 6: Metab olism of no rmal cells versus tumo r cells. α K G, α -k etogluta rate; G6P , glucose-6-phosphate; GSH, glutathione; NEAA, non essential amino acids; PEP , phospho enolp yruvate; PKM2, p yruvate kina se M2; PPP , p entose phosphate pathw a y; TCA, trica rb o xylic acid.2.1. The Warburg effect 17
2.1
The Warburg effect
Otto Warburg demonstrated in the 1920s a shift from oxidative phosphorylation to (aerobic) glycolysis in tumor cells, known as the Warburg effect (Warburg, 1956). Although the ATP pro-duction via glycolysis is faster than with oxidative phosphorylation, the latter is more efficient in terms of ATP production per unit of glucose (Warburg, 1956; Semenza et al., 2001). Con-sequently, a large amount of glucose intake is necessary for tumor cells to meet their increased energy, biosynthesis and redox needs (Cairns et al., 2011). The glucose intake is increased by up-regulating the glucose transporter 1 (GLUT1) (DeBerardinis, 2008; Hsu & Sabatini, 2008; Jones & Thompson, 2009). PI3K-Akt signaling is responsible for the expression of GLUT1 mRNA and the translocation of GLUT1 protein from the endomembranes to the cell surface (Barthel et al., 1999; Wieman et al., 2007). Ras has also been found to upregulate GLUT1 mRNA (Mu-rakami et al., 1992). The PI3K pathway also regulates cell growth, proliferation, differentiation, metabolism and cell motility (Fruman et al., 2017). Akt is activated by the PI3K pathway and regulates the expression of hexokinase (HK), which phosphorylates glucose molecules avoiding the efflux back into the extracellular space (Deprez et al., 1997; Gottlob et al., 2001). Akt also activates the mTOR complex 1, which increases the synthesis of transcription factors MYC and hypoxia inducible factor-1α (HIF-1α) (Laughner et al., 2001; Galmozzi et al., 2004; Silvera et al., 2010). The higher uptake of glucose in tumor cells has become a useful tool for determining cancer using positron emission tomography (PET) with a radiolabeled analog of glucose (Hana-han & Weinberg, 2011).
Why the shift to aerobic glycolysis occurs in tumor cells remained long time unclear. Warburg (1956) described the glycolytic shift as an irreversible injuring of respiration, leading to a less efficient way of producing ATP. Later investigations identified the presence of functional mito-chondria in tumor cells, in which it is possible to proceed with oxidative phosphorylation (Morais et al., 1994; Cavalli et al., 1997). Vander Heiden et al. (2009) hypothesized that increased gly-colysis allows the entrance of glycolytic intermediates into other biosynthetic pathways, which facilitates generating macromolecules and organelles needed for assembling new cells. The War-burg effect seems to be benificial for tumor cells in time of increased biosynthetic demand for cell growth (Pavlova & Thompson, 2016).
Proliferating cells require precursor molecules and reducing equivalents in the form of NADH rather than large amounts of ATP. By the conversion of pyruvate into lactate, NAD+is released. In addition, it prevents the accumulation of cytosolic NADH and reduces the ATP production, allowing continued cytosolic glucose metabolism without the feedback repression by excess mi-tochondrial ATP generation (Pavlova & Thompson, 2016).
2.2
Tumor microenvironment
The tumor microenvironment (TME) is a complex tissue structure consisting of normal cells and tumor stroma (Ansell & Vonderheide, 2013; Junttila & De Sauvage, 2013). Because of the high metabolic demands of proliferating cells in the TME, nutrient availability can be scarce leading to regions of hypoxia, nutrient shortages and cellular waste accumulation (Chang et al., 2015; Reina-Campos et al., 2017).
2.2.1 Subpopulations in the TME
Three major subpopulations occur in the TME: cancer-associated fibroblasts, cancer-associated immune cells, cancer-associated endothelial cells. Tumor cells support uncontrolled prolifera-tion, invasion and metastasis in the subpopulations by exchanging growth factors, cytokines and metabolites, leading to a change in their metabolism (Biswas, 2015).
The cancer-associated fibroblasts show an increased glycolytic metabolism and lactate secretion (D. Zhang et al., 2015). This is stimulated by stabilization of HIF-1α or activation of hypoxia related signaling (Kim et al., 2012). Due to multiple high consuming populations, glucose be-comes limited. However, the large amount of secreted lactate in the TME can be used as energy source by other cellular populations (Pavlides et al., 2009; Bonuccelli et al., 2010; Fiaschi et al., 2012; Kalluri, 2016; Faubert et al., 2017). In addition, the fibroblasts release multiple amino acids into the TME, which can be used as a carbon source in nutrient limited conditions (Sousa et al., 2016). In case of a glutamine deficiency, the fibroblasts will use the mitochondrial pyruvate flow created by glycolysis. As a result, aspartate is generated and released in the TME (Linares et al., 2017).
Cancer-associated immune cells include neutrophils, macrophages and various types of T-cells (Gajewski et al., 2013). They also need to adjust their metabolism to survive the nutrient limited conditions (Biswas, 2015). T-cells will adapt their metabolism to overcome environ-mental stressors. Glycolysis is upregulated and lactate is produced (Buck et al., 2015, 2016). Angelin et al. (2017) also showed a switch in T-cells to lactate uptake as an energy source in case of glucose deficiency. On the other hand, the reversal of the lactate dehydrogenase reac-tion to pyruvate drains the cellular NAD+ pools, which inhibits glycolytic flux. T-effector cells are dependent of this glycolytic flux for activation, differentiation and physiological function. However, T-regulatory cells have been found to develop resistance to lactate inhibition through downregulation of MYC, leading to a decrease in glycolytic dependence (Angelin et al., 2017). As a result, these T-regulatory cells will perform an immunosuppressive effect over the TME associated immune cells (Neugent et al., 2018).
Cancer-associated endothelial cells are responsible for new vessel formation in the tumor mi-croenvironment to maintain blood supply into tumor regions without blood access (Neugent et al., 2018). It has been shown that endothelial cells also depend on the glycolytic metabolism
2.3. Macromolecular biosynthesis 19
(Dobrina & Rossi, 1983; Culic et al., 1997; Cantelmo et al., 2016). This endothelial aerobic glycolysis may occur to maintain blood oxygen levels ensuring diffusion into vascularized tissues (Eelen et al., 2015; Vandekeere et al., 2015; Treps et al., 2016).
2.2.2 Conditions in the TME
Lactate secretion causes acidification of the microenvironment. Generation of CO2 by
mitochon-drial decarboxylation reactions is responsible for acidification as well. The proteolytic activity of matrix metalloproteinases and cathepsins is stimulated, causing degradation of the extracellular matrix components and enhancing tumor invasion (Martínez-Zaguilán et al., 1996; Rothberg et al., 2013).
Hypoxia influences transcription by stabilization of HIF, causing an increased glycolytic capac-ity and a decrease in mitochondrial respiration (Denko, 2008). In addition, hypoxia inhibits signalling through mTOR, which regulates multiple mechanisms involved in the metabolic phe-notype, such as the induction of autophagy (Wouters & Koritzinsky, 2008; Koritzinsky et al., 2006). The mTOR inhibtion is mostly assumed to be tumor suppressive, however there is ev-idence that it can increase the tolerance to hypoxia and promote tumor cell survival during metabolic stress (Li et al., 2010). Furthermore, extreme hypoxia (<0.02% O2) leads to
endo-plasmic reticulum stress and activates the unfolded protein response, causing the activation of an adaptive mechanism which allows survival of tumor cells under adverse metabolic conditions (Koritzinsky et al., 2006; Koumenis et al., 2002; Bi et al., 2005; Romero-Ramirez et al., 2004).
2.3
Macromolecular biosynthesis
Pyruvate kinase isoform M2 (PKM2) is present at high levels in cancer cells. The oncopro-tein MYC has been found to promote the expression of PKM2 (David et al., 2010). PKM2 catalyzes the rate-limiting step of glycolysis and thus controlling ATP generation. By inhibit-ing the conversion of phosphoenolpyruvate (PEP) into pyruvate durinhibit-ing glycolysis (Figure 6), PKM2 seems to be in contradiction with the Warburg effect (Mazurek et al., 2005; Cairns et al., 2011). However, this appears to be an advantage for cancer cells. By slowing the passage of metabolites through glycolysis, carbohydrate metabolites can participate in other pathways, such as the pentose phosphate pathway (PPP) (Cairns et al., 2011). In the latter, reducing agents (e.g. NADPH) and precursors for macromolecules are synthesized. NADPH is necessary for maintenance of the redox balance and for the synthesis of substances by delivering electrons. Macromolecular precursors such as acetyl-coA for fatty acids, glycolytic intermediates for NEAA and ribose for nucleotides play an important role in tumor progression (Vander Heiden et al., 2009; M. Fang et al., 2010; Marshall et al., 1991; Cairns et al., 2011).
2.4
Glutamine as a key metabolite in colon cancer cells
2.4.1 Amino acid metabolism
After absorption from the intestine, amino acids pass through the liver, where some important links between amino acid and carbohydrate metabolism take place (Figure 7). Free amino acids are transported by blood and are taken up into tissues by specific active transport mechanism. Skeletal muscles take up branched-chain amino acids. The muscles are able to transaminate and oxidize these amino acids to provide a source of energy. The amino group is transferred to a 2-oxoacid and usually pyruvate and α-ketoglutarate (or 2-oxoglutarate) are the acceptors to form respectively alanine and glutamate. Through the action of glutamate dehydrogenase, amino groups can form ammonia. Glutamine can be formed by combining glutamate and ammo-nia through the action of glutamine synthase. So mainly alanine and glutamine will be released from the muscles. Because glutamine carries two nitrogen atoms, it will transport more nitro-gen than alanine. Alanine is primarily absorbed by the liver, where it passes its amino group to α-ketoglutarate with formation of pyruvate, a substrate for gluconeogenesis. Glutamine is absorbed by the kidney and the intestinal mucosal cells (Frayn, 2010).
Figure 7: Major pathways for amino acid flow between tissues (Frayn, 2010).
2.4.2 Glutamine addiction in colon cancer cells
The pathway of glutamine inside tumor and normal cells is shown in Figure 6. The metabolism of tumor cells differs from normal cells because rapid growth results in an increased need for C-and N-sources for the synthesis of molecules, as well as a higher energy requirement.
Glutamine plays a role (i) as a N-source, (ii) as a C-source and (iii) in oxidative stress. Because glutamine is important in multiple processes, tumor cells are highly dependent on glutamine and therefore exhibit a glutamine addiction (Wise et al., 2008). Glutamine is used as a nitrogen
2.4. Glutamine as a key metabolite in colon cancer cells 21
source in five enzymatic steps in the synthesis of purines and pyrimidines. Three of the five steps are regulated by the MYC protein (Liu et al., 2008; Eilers & Eisenman, 2008). Glutamine is converted into glutamate with exemption of the ammonia group, which can be used for the synthesis of non essential amino acids (NEAA) (Voet & Voet, 1995; Young & Ajami, 2001). Glutamate can be converted into α-ketoglutarate (αKG), which allows pyruvate to be converted into alanine. This latter leaves in the portal vein and will reach the liver. αKG enters the TCA cycle where it functions as a carbon source to permit production of amino acids and fatty acids. Further, malate can exit the TCA cycle and can be converted into lactate. Malate can be a substrate for malic enzyme 1 as well, which produces NADPH (DeBerardinis et al., 2007). Glutamate can also be converted into glutathione (GSH), this process is called glutaminolysis. GSH is an important antioxidant by controlling the redox state of all subcellular compartments (Vaughn & Deshmukh, 2008). The MYC oncoprotein has a major role in the regulation of glutaminolysis as well. It increases the glutamine uptake by inducing the expression of glutamine transporters which results in a higher GSH production (Gao et al., 2009).
2.4.3 Acid resistance
In recent years, new insights have emerged regarding the function of glutamine. The secretion of lactic acid through glycolysis will create an acidic environment (Tannock & Rotin, 1989). A number of biological reactions are highly dependent on pH, which makes increased acidity detrimental to cancer cell growth. However, the intracellular pH in tumor cells appears to be unchanged (Gerweck et al., 2006). It follows that an acid resistance system may be present in cancer cells (W. Huang et al., 2013). Glutamine is converted to glutamate by acid-stimulated glutaminases with exemption of ammonia. The latter will neutralize a proton, leading to an in-crease of the intracellular pH. W. Huang et al. (2013) found that the consumption of glutamine in MCF-7 (cervical cancer) and HeLa (breast cancer) cells is higher when the cells are cultured in a medium with lower pH. The same findings were observed by Yusof & Jainul (2019) for HCT8 and HT29 cells, both colon cancer cells. These results show evidence that glutamine is probably responsible for fighting acid stress in tumor cells.
Chapter 3
Research approaches
Different types of studies can be used to investigate the links between red and processed meat intake and CRC. In this chapter, human observation studies, animal experiments and cell culture studies will be described. Alternatively, in silico studies can be used. These studies predict tumor growth and regression based on established knowledge about chemical composition of the environment and metabolic processes in the colon (Shin et al., 2013; Tian et al., 2013). This will not be explained into detail.
3.1
Human studies
Human observation studies aim to investigate whether there is a link between possible risk factors, such as consumption of red and processed meat, and health effects, such as tumor development (Oostindjer et al., 2014). In several meta-analyses of cohort studies, significant but weak associations were found between the prevalence of CRC and the intake of red and processed meat (Alexander et al., 2011; Aune et al., 2013; Chan et al., 2011; Larsson & Wolk, 2006; Norat et al., 2002; World Cancer Research Fund International, 2020). Meta-analyses com-bine studies from different regions in the world, from both genders, from colon cancer and rectal cancer abundance, from all levels of red and processed meat intake... It should be noted that there is heterogeneity across studies, associations may also depend on environmental and genetic backgrounds and other dietary and lifestyle factors can play a role (Hassler et al., 2008; Brown et al., 1998; Key et al., 2009; Ollberding et al., 2011). To avoid these confounding factors, randomized controlled prevention trials should be implemented. In practice, however, it is not feasible to carry out long-term interventions as the participants may not continue to comply with the dietary protocol for an extended period of time. Since human tumor development can take 10 to 20 years and human studies are expensive, animal testing is often applied (Oostindjer et al., 2014; Kelloff et al., 2004).
3.2
Animal model studies
To understand mechanisms in colon carcinogenesis, experimental animal models have been used to test effects of diets and diet-related compounds on colon cancer development. Rodents are mostly used for tumor biology research. The APCmin1 mouse is often used because of the increase susceptibility for tumor development due to genetic mutations (Corpet & Pierre, 2005). In more than 85% of the sporadic colorectal cancers, mutations of the APC gene are found (Fearnhead, 2001). This can cause familial adenomatous polyposis (FAP), which is character-ized by the development of multiple colorectal adenomas (Fodde, 2002; Half et al., 2009). The model is vulnerable to environmental factors that may disrupt the APC gene (dietary carcino-gens) or factors that may compensate for the loss of APC function (protective factors), making the APCmin mouse an excellent model for studying gene-environment interactions (Femia et al., 2008; Paulsen et al., 2000, 2001; Steffensen et al., 1997). The pathophysiology of the APCmin mouse is similar to that of human colon cancer and tumorigenesis is observed after only a few weeks (Preston et al., 2008). However, the use of this model is labor-intensive and expensive. Alternatively, mice can be injected with a colon specific carcinogen, such as dimethylhydrazine, to induce cancer. The promoting effects of food components can be tested with these mod-els. However, when the tumor incidence needs to be tested as an endpoint, a group of 30 animals for 2-300 days is required before tumors are formed (Oostindjer et al., 2014). It is also possible to test early stages of tumorigenesis, but it must be taken into account that a large number of aberrant crypts are often developed in the colon of which only a small group will eventually evolve into adenomas and carcinomas (Femia et al., 2008; Corpet & Pierre, 2005).
3.3
In vitro models
Cell cultures are useful in vitro models for studying psychological and biochemical processes in cells, the effect of drugs and toxic compounds on the cells and mutagenesis and carcinogenesis. The consistency and reproducibility of results make the use of cell cultures very convenient (In-vitrogen, 2016). In a shorter period of time results can be obtained, making it more suitable for screening a large number of components. Unfortunately, interactions between different tissues can not be studied and there is no cancer-related endpoint such as tumor formation or mortality.
In vitro models thus serve to support in vivo models in determining dietary effects on health
outcomes (Oostindjer et al., 2014).
3.3.1 Types of cell lines
Many cell lines from different tissues are commercially available. The HCT8/E11 cell line and HT29 cell line are used in the experiments described in Part II.
1
Min (multiple intestinal neoplasia) is a mutant allele of the APC gene, which encodes a nonsense mutation at codon 850 (Moser et al., 1995).
3.3. In vitro models 25
The HCT8/E11 cell line is an in house modified cell line from the HCT8 cell line. The lat-ter comes from an ileocecal colorectal adenocarcinoma from the colon of a 67 years old man (ATCC, 2019). The cell line forms a cellular monolayer which consist of polarized cells joined by tight junctions and with well-developed apical microvilli (Terciolo et al., 2017). Ten muta-tions have been identified in the HCT8 cell line in six different genes (CTNNB1, APC, K-RAS, PIK3CA, SMAD2 and SMAD3). CTNNB1 and APC are involved in the Wnt pathway, K-RAS in the MAPK pathway, SMAD2 and SMAD3 in the TGF-β pathway and PIK3CA in the PI3K-PTEN-AKT-pathway (Mouradov et al., 2014). The K-RAS mutation facilitates activation of the mitogen activated protein kinase (MAPK), leading to expression of the transcription factor MYC (Sears et al., 1999). This oncogene plays a role in cell growth, proliferation, apoptosis, differentiation and regulates several glycolytic enzymes such as GLUT1 and hexokinase 2 (HK2) (Shim et al., 1997; Semenza, 2010). Mutations on the PIK3CA gene lead to upregulation of glutamate pyruvate transaminase 2 (GPT2), the enzyme that converts glutamate into αKG (Hao et al., 2016).
The HT29 cell line was isolated from a colorectal adenocarcinoma from a 44 years old woman. The HT29 cells appear to consume a high amount of glucose. They grow as a multilayer of un-polarised undifferentiated cells (Martinez-Maqueda et al., 2015). These cells are able to secrete metabolites, cytokines, growth factors and mucin at a relatively high level (Huet et al., 1987; Maoret et al., 1989). The cell line is positive for expression of following oncogenes: C-MYC, K-RAS, H-RAS, N-RAS, MYB, SIS and FOS. The p53 antigen is overproduced (ATCC, 2019). Seven mutations have been found in the five following genes: BRAF, PIK3CA, SMAD4, TP53 and APC. BRAF is involved in the MAPK pathway and a mutation in the gene is associated with DNA methylation (Arndt et al., 2016). PIK3CA plays a role in the PI3K-PTEN-AKT-pathway and SMAD4 in the TGF-β pathway. TP53 is involved in the p53 pathway and APC in the Wnt pathway (Mouradov et al., 2014).
3.3.2 2D and 3D cell cultures
2D culture
The 2D model is the most frequently used type of cell culture. In adherent 2D cultures, cells are attached to the plastic surface of a culture flask or flat petri dish, where they form a monolayer (Breslin & O’Driscoll, 2013). The main advantages of this model is the simple and relatively cheap maintenance of the cell culture and the performance of functional tests. Unfortunately, there are several drawbacks as well. First of all, the natural structures of tissues or tumors can not be imitated by the 2D cultured cells. Cell-cell and cell-environment interactions are different from these in a tumor. The interactions play a role in cell differentiation, proliferation, expression of genes and proteins, vitality, responsiveness to stimuli and other functions (Pampaloni et al., 2007; Weber et al., 2011; Hickman et al., 2014; Bissell et al., 2003). Next, the cells lose the diversity in phenotype due to the transfer from the tissue to the 2D conditions (Petersen et
al., 1992; Von Der Mark et al., 1977). In a monoculture there is only one cell type present, in contrast to the diversity in cell types in a tumor (Fischbach et al., 2007). Another disadvantage is the unlimited access to the ingredients of the medium. The availability of nutrients, oxygen... is not constant for tumor cells in vivo because of the natural architecture of the tumor mass (Pampaloni et al., 2007).
Co-culture
Co-cultures are systems where different cell types are grown together in the same environment, which is also the case with a tumor mass. Three types of intercellular interactions occur: cell-cell, cell-environment and paracrine signalling by dissolved factors (Paschos et al., 2015). These inter-actions are similar to those in vivo (Hendriks et al., 2007). There are two types of co-cultures: direct and indirect. In direct co-cultures, the different cell types are mixed and cultured to-gether. When the cells are separated by a physical barrier, this model is referred to an indirect co-culture (Paschos et al., 2015). Both models can be applied to 2D and 3D cultures (Guan et al., 2011; Traphagen et al., 2013). The disadvantage of co-cultures is the inclusion of many variables such as the equality and separation of the population, the components in the medium, volume and duration of the culture... Because all these factors have to be taken into account, it is often difficult to interpret the data obtained after performing co-cultures. (Goers et al., 2014).
3D culture
Three-dimensional culture systems were developed because they better fit to the physiology, anatomy and structure of the tumor.
Spheroids are spherical and heterogeneous self-organizing cell aggregates with a size of
400-500 µm. They are produced by suspension or monolayer production of one (or more) type of cells to form 3D tissue structure and function (Figure 8 and Figure 9a) (Fitzgerald et al., 2015; B. W. Huang & Gao, 2018; Panek et al., 2018). Because of well-defined geometry and protocol, co-culture ability, generally long-term sustainability, optimal physiological interactions, repro-ducibility, similarity in protein-gene expression profiles and well mimicing the in vivo models, spheroid are excellent systems for tumor investigation. Unfortunately, certain cell types are not able to form 3D spheroid structures and some cells reach unpredictable shapes (Fitzgerald et al., 2015; Y. Fang & Eglen, 2017; B. W. Huang & Gao, 2018).
Saglam-Metiner et al. (2019) describes organoids as "person-specific 3D cell culture techniques that remain genomically stable self-organized stem cell or tissue, which mimic true in vivo microanatomy and provide similar complexity and structure in vivo". Organoids are irregular structures made up of crypts derived from the colon of a human, a mouse or an other labora-tory animal (Figure 9b). Lgr5 crypt stem cells are mostly used because of their strong dividing power (Sato et al., 2011). In Matrigel, whole crypts or single Lgr5 stem cells are suspended and
3.3. In vitro models 27
cultured in serum-free medium in which three recombinant proteins are added: R-spondin-1 (a Wnt signal amplifier and ligand of Lgr5), EGF and BMP inhibitor Noggin. A bud-like structure will eventually be formed that closes off a central lumen (Figure 8). The basal side of the cells is oriented towards the Matrigel making it difficult to expose the cells in the central lumen to compounds. The different cell types are present in the same ratios as in the human colon (Grün et al., 2015; Sato et al., 2009).
Figure 8: Cell culture models: two dimensional, three dimensional - spheroid, three dimensional
- organoid (Yin et al., 2016).
(a) (b)
Figure 9: (a) Microscopic picture of a spheroid from a Caco-2 cell line (Samy et al., 2019). (b) Microscopic picture of organoids from a human colon (Sigma-Aldrich, 2020).
3.3.3 Medium
Cell cultures are maintained in medium to provide the cells with sufficient nutrients for their growth. DMEM (Dulbecco’s Modified Eagle Medium) is a medium widely used in cell cultures. However, this medium is not designed to reproduce the physiological cellular environment, but to allow continuous proliferation. Certain nutrients, such as glucose and glutamine, are present in high concentrations to prevent nutrient depletion when cell cultures are left unattended for prolonged periods of time.
Vande Voorde et al. (2019) designed a complex culture medium – PlasmaxTM – which consists
blood. The concentrations of glucose and glutamine for the DMEM are respectively 25 mM and 4 mM, while for PlasmaxTM these are respectively 5.5 mM and 0.65 mM.
Vande Voorde et al. (2019) compared in their study the effects of PlasmaxTM and DMEM-F121
media on cell metabolism. Glucose was the most consumed nutrient and lactate was the most released metabolite for both media. Despite the considerable difference in glucose concentration between the two media, it turned out that the rate of glucose fermentation was independent of its extracellular availability. On the contrary, glutamine was found to be less consumed by the cell lines in PlasmaxTM compared to DMEM-F12 and the intracellular concentration in the cells
in PlasmaxTM was lower as well. Alanine was released in DMEM-F12, while it was consumed in
Plasmax, where it is 10 times more concentrated (0.05 mM versus 0.51 mM). In general it was found that media whose amino acid concentrations deviate from those found in serum cause changes in uptake/release and metabolism. However, no difference in proliferation between the two media is observed, indicating that higher amino acid consumption is not essential for growth. These results were based on triple-negative breast cancer cell lines. The influence of the different medium composition on colon cancer cells needs to be tested.
1
DMEM-F12 is a commercially available medium that is suitable for growth of a wide range of cell types under low-serum concentrations. Glucose concentration = 17.5 mM, glutamine concentration = 2.5 mM.
Objectives
Epidemiological research has demonstrated that a high intake of red and processed meat increases the risk of colon cancer (Huxley et al., 2009). However, which components are responsible or which mechanisms may play a role in the tumor development remains unclear. Rombouts et al. (2017) used an untargeted mass spectrometry (MS)-based metabolomics approach to deter-mine the metabolites that are associated with red meat consumption. Kynurenine and kynurenic acid were two of the 22 metabolites present in a higher concentration in red meat digests in comparison to white meat digests. These compounds are intermediates in the catabolism of tryptophan, an essential amino acid (Moffett & Namboodiri, 2003). Therefore, it can be as-sumed that kynurenine and kynurenic acid may be involved in protein synthesis. This synthesis requires energy. It is known that tumor cells are highly dependent on glucose and glutamine and that they show a shift in their energy metabolism (Warburg effect) (Warburg, 1956; Wise et al., 2008). These nutrients therefore occur in high concentration in cell culture medium to promote growth. However, the microenvironment of colon cancer cells seems to be very different from conventional cell cultures (Vande Voorde et al., 2019). It is therefore recommended to inves-tigate whether cells in physiological conditions behave differently from commercially available medium conditions and what the effect is on energy metabolism.
In this research it is hypothesized that kynurenine and kynurenic acid promote cell growth of colon cancer cells by interacting with their energy metabolism or by even replacing glutamine or other amino acids. The objectives were to investigate the influence of medium composition and treatment with metabolites from red/processed meat on cell growth and energy metabolism. Since the influence of dietary factors on cancer development or growth is rather a long-term process, this research mainly focused on long-term experiments. An in vitro approach was car-ried out in which cells were grown on a plate, attached to the surface (two dimensional) or as spheroids (three dimensional). Spheroids are a useful technique in this context as they better imitate the tumor structure. The cells were exposed to different concentrations of glucose, glu-tamine and serum, as well as to different concentrations of kynurenine and kynurenic acid over a period of time. In this way, we hope to gain insights on how single metabolites from meat digestion can have an impact on colorectal cancer.
Part II
Materials and methods
Chapter 1
Experimental set-ups
1.1
Cell culture
1.1.1 Cell maintenance
Cells were grown in Corning c CellBIND c 25 cm2 cell culture flasks (Greiner Bio-one, Vilvoorde, Belgium). The surface of the flask gave cells the ability to attach. Growth medium — DMEM (Fisher Scientific Belgium, Merelbeke, Belgium) with 1% penicillin and streptomycin (Fisher Scientific Belgium), 1% NEAA (Fisher Scientific Belgium) and 10% fetal bovine serum (FBS) (Greiner Bio-one) — was used to feed the cells. The medium needed to be replaced every two or three days.
1.1.2 Subculturing adherent cell lines
Adherent cultures should be transferred when they are in the log phase, when the cells achieve 50 to 90% of confluence (Invitrogen, 2016). Continued culture of fully confluent cells may lead to reduced mitotic activity, selection of variant cells and even cell death (Verhoeckx et al., 2015). The medium was gently removed from the culture by a glass Pasteur pipet using the Vacusafe aspirator. The cell layer was rinsed with phosphate buffered saline without calcium and magnesium (PBSD-) (Sigma-Aldrich, Overijse, Belgium)1 to remove all FBS proteins and calcium that may interfere with the trypsinization process (Invitrogen, 2016). Trypsin/EDTA (Fisher Scientific Belgium) solution was added. Trypsin is an enzyme that cleaves proteins involved in cell-cell and cell-plastic adhesion while EDTA helps to detach the cells. (Invitrogen, 2016). The cells were inspected in a microscope to be sure a single cell suspension was formed. A certain amount of the cell suspension (dependent on the desired dilution) was added to a new flask with growth medium.
1.1.3 Cell counting
From the cell suspension, described in Section 1.1.2, 50 µL was transferred to an eppendorf tube and 50 µL of Trypan blue was added. The liquid with the cells was brought into a Bürker
1
Calcium and magnesium avoid detachment of the cells from the wall.
counting chamber. The number of living cells was counted in 50 squares. The counted number of cells, multiplied by 10,000, is the number of cells in 1 mL.
1.2
Two dimensional experiments
1.2.1 Short-term experiments
For a short-term experiment, 100,000 cells/mL were seeded on a Greiner CELLSTAR c 24 or 96 well plate (Greiner Bio-one). The plate was placed in the incubator (Memmert, Schwabach, Germany) (37◦C, 10% CO2) for at least 24 hours to allow the cells to adhere to the bottom of
the plate. After one day, the cells were treated with the components of interest. The treatment had a different composition of the medium (glucose, glutamine and serum concentration) or a specific component with a certain concentration (kynurenine, kynurenic acid). The cells were exposed to the treatment during three days. One or some of the bio-assays, described in Chapter 2, were performed at the end of the experiment.
1.2.2 Long-term experiments
For a long-term experiment, 10,000 cells/mL were seeded on a Greiner CELLSTAR c 24 or 96 well plate. After 24 hours in the incubator, the liquid was removed and the desired treatment was added. The cells were exposed to the treatment for minimum one week. In some experiments, the cell activity (resazurin assay) was measured at one or more intermediate time points. At the end of the assay, fresh medium was added to the cells. At the end of the experiment, one or some of the bio-assays, described in Chapter 2, were performed.
1.3
Three dimensional experiments — Spheroids
For the spheroid formation, a U-shaped 384 well ultra-low attachment (ULA) plate (S-bio, Hud-son NH, USA) was used. The plate was washed three times with PBSD- to prevent image disruption by air bubbles. To each well, 40 µL of a cell suspension (3000 cells per well) and 40
µL of the appropriate treatment were added (16 replicates per treatment). The plate was
cov-ered with a Breathe-Easy c sealing membrane (Sigma-Aldrich) to prevent evaporation. During 10 days, the plate was placed in the IncuCyte cZOOM (Essen Bioscience, Ann Arbor MI, USA), which carried out phase-contrast, green fluorescence and red fluorescence imaging by taking a picture every 6 hours. Masking was performed in the Basic Analyser Software (version 2018A) of the IncuCyte cZOOM with image collections of 16 photos (Top-Hat on, 90.00 µm radius, 0.90 GCU treshold, -70 edge sensitivity, 1E+06 µm2 hole fill, -3 pixels adjust size, 100 µm2 min. area, 5.00 min. mean intensity). At the end of the experiment, one or some of the bio-assays, described in Chapter 2, were performed.
Chapter 2
Bio-assays
2.1
Protein content assays
2.1.1 Bradford
The Bradford assay is based on the binding of Coomassie Brilliant Blue G-250 dye (Sigma-Aldrich) to proteins. Under acidic conditions, the dye is present in the doubly protonated red cationic form. After binding a protein, the dye is converted to a stable unprotonated blue form. 5 µL of each well was transferred to a new 96 well plate. 250 µL Bradford reagent was added. The plate was incubated at room temperature for half an hour. The absorbance at 595 nm was determined using a multireader (Spectramax, Molecular Devices, Berkshire, UK). Bovine Serum Albumin (BSA) (Sigma-Aldrich) was used to create a standard curve.
2.1.2 Sulforhodamin B (SRB)
SRB binds stoichiometrically to proteins under mild acidic conditions. The cells were fixed with 50% trichloroacetate (TCA) (Sigma-Aldrich) in milliQ-water. After a one-hour incubation at 4◦C, the plate was rinsed with tap water. The cells were stained with SRB (Sigma-Aldrich) solution (0.4% in 1% glacial acetic acid) for 30 minutes. The plate was rinsed with 1% glacial acetic acid (Sigma-Aldrich) and 200 µL of a 10 mM trisaminomethane (Tris) (Sigma-Aldrich) buffer solution was added. The absorbance at 490 nm was determined using a multireader.
2.2
Cell activity assays
2.2.1 CellTiter-Glo c
The CellTiter-Glo c reagent (luciferase, luciferin, buffer) (Promega, Wisconsin, USA) reacts with ATP to form oxyluciferin which generates a light signal. The spheroids were transferred to a 96 well plate. After 30 minutes, 70 µL CellTiter-Glo reagent was added. The plate was shaken for 5 minutes and incubated for 25 minutes at room temperature (protected from light). The