A publication of the
Netherlands Environmental Assessment Agency P.O. Box 303, 3720 AH Bilthoven, The Netherlands www.pbl.nl/en
2.5
This study explores the use of satellite observations of Aerosol Optical Depth (AOD) in monitoring temporal and spatial variations in particulate matter (PM2.5) in the Nether-lands. AOD data can only be obtained under clear sky conditions, and are biased towards conditions of stagnant flow (southerly and easterly wind). Under such conditions, the AOD correlates reasonably well with PM2.5 (R2=0.6), suggesting that temporal variations
in AOD can be used as a proxy for temporal variations in PM2.5.
The average PM2.5 concentration at Cabauw, a central site for atmospheric research in the Netherlands, was 18 μg/m3. This confirms the relatively high background PM
2.5 in the
Netherlands compared to rural areas in Europe. Satellite derived AOD maps from AATSR and MODIS show similar mean values, but observed features in the spatial distributions are distinctly different. This illustrates that interpretation of these AOD maps in terms of PM is hampered because of spatially dependent systematic errors in AOD which are of the same order of magnitude as spatial variations in AOD across the Netherlands. Because of the uncertainties in current satellite data of AOD, it is not expected that bet-ter PM2.5 maps for the Netherlands can be constructed based on these satellite data only. Satellite measurements of AOD have added-value, however, particularly with regard to temporal variation in PM, when combined with atmospheric transport models and surface measurements of PM2.5.
Report 555034003
Relationship between aerosol optical depth
and PM
2.5
in the Netherlands
SATLINK final report
een aer
osol optical depth and PM
2.5
in the Netherlands
Repor
and PM
2.5in the Netherlands
Relationship between aerosol optical depth
and PM
2.5
in the Netherlands
SATLINK final report
This investigation was co-funded by the Netherlands Agency for Aerospace Programmes (NIVR), within the framework of the project SATLINK, NIVR project code 53.614RI. PBL, P.O. Box 303, 3720 AH Bilthoven, telephone: 31 - 30 274 2745; www.pbl.nl
© Netherlands Environmental Assessment Agency (MNP), Bilthoven, september 2008 PBL-publicationnumber 555034003 M. Schaap* A. Apituley# R.B.A. Koelemeijer@ R.M.A. Timmermans* R. Schoemaker+ J. Matthijsen@ G. de Leeuw*
* TNO Bouw en Ondergrond
# Rijksinstituut voor Volksgezondheid en Milieu @ Planbureau voor de Leefomgeving
+ TNO Defensie en Veiligheid
Contact
Robert Koelemeijer
Robert.Koelemeijer@mnp.nl 030-2743289
You can download the publication from the website www.pbl.nl/en or request your copy via email (reports@mnp.nl). Be sure to include the PBL-publication number.
Parts of this publication may be reproduced, on condition of acknowledgement: ‘Netherlands Environmental Assessment Agency, the title of the publication and year of publication.’ Netherlands Environmental Assessment Agency
PO Box 303 3720 AH Bilthoven Phone: +31 (0) 30 274 274 5 Fax: +31 (0) 30 274 44 79 E-mail: info@pbl.nl Website: www.pbl.nl
Rapport in het kort
Dit rapport beschrijft een verkennende studie naar het gebruik van satellietgegevens voor het bestuderen van de fijnere fractie van fijn stof (PM2.5). Satellietinstrumenten meten niet direct
PM2.5, maar meten de z.g. Aerosol Optische Dikte (AOD), wat een optische maat is voor de
hoeveelheid stof in de gehele atmosferische kolom boven een deel van het aardoppervlak. De
relatie tussen AOD en PM2.5 is onderzocht op de meetlocatie Cabauw in de periode 2006 - 2007.
In maanden met weinig bewolking correleren de AOD en PM2.5 metingen behoorlijk goed, met
een lineaire correlatie van typisch R2=0.6. Satellietmetingen van de AOD zouden dus gebruikt
kunnen worden als proxy voor variaties in de tijd van de PM2.5 concentratie.
De gemeten PM2.5 concentratie in Cabauw gemiddeld over de periode augustus 2006 tot mei
2007 is 18 μg/m3, wat illustreert dat Nederland een hoge achtergrondconcentratie heeft in
vergelijking tot veel andere gebieden in Europa. De tijdscorrelatie tussen AOD en PM2.5 is vooral
goed in situaties met overheersend oostelijke en zuidelijke windrichtingen. De gevonden lineaire
relatie tussen AOD en PM2.5 is toegepast op satellietmetingen van MODIS om een kaart te maken
van PM2.5 in Nederland en omgeving. De interpretatie van deze kaart behoeft nadere aandacht
omdat de ruimtelijke variaties van de AOD over Nederland van vergelijkbare omvang zijn als de foutenmarge in de AOD metingen. Dit laatste leidt tot duidelijke artefacten in de verdeling. Daarnaast is de kaart afgeleid voor dagen met (zuid-) oostelijke stroming over Nederland en beschrijft deze de situatie rond het middaguur. Aanvullende modelberekeningen en een evalu-atie met metingen zijn nodig om te onderzoeken hoe de verdeling zich verhoudt ten opzichte van andere meteorologische situaties. Door intrinsieke beperkingen van satelliet gegevens van
fijn stof is het niet te verwachten dat in de nabije toekomst betere PM2.5 kaarten kunnen worden
gemaakt op basis van de gegevens alleen. De toegevoegde waarde van satelliet gegevens van fijn stof zal vooral tot uitdrukking komen wanneer ze gecombineerd worden met modelberekenin-gen en metinmodelberekenin-gen van fijn stof op leefniveau.
Contents
Executive summary 9 1 Introduction 112 Experimental set-up 15
2.1 Ground-based data sources 15 2.2 Satellite data sources 19 2.3 Data processing 23 2.4 Analysis procedure 24 3 Overview of ground-based data 25
3.1 Statistics 25
3.2 Initial comparison between AOD and PM2.5 25
3.3 Examples of vertical aerosol profiles 28 4 Analysis of AERONET AOD data 31
4.1 Cloud detection methods 31 4.2 Evaluation of cloud indicators 34 4.3 Impact of AERONET v1.5 data 35
5 Analysis of the relationship between AOD and PM2.5 39
5.1 Correlation between filtered AOD and PM2.5 39
5.3 Sensitivity to the time of the day 41 5.4 Influence of air mass origin 42
5.5 Relationship between AOD and PM2.5 at Cabauw - synthesis 44
5.6 Discussion 44
6 PM2.5 estimation from satellite AOD 49
6.1 Satellite derived AOD fields 49 6.2 Satellite data evaluation 49
6.3 Satellite AOD versus ground level PM2.5 52
6.4 Satellite derived PM2.5 maps 52
6.5 Discussion 55
6.6 Cost benefit analysis 56 7 Summary and conclusions 57 Acknowledgements 59
References 61
Appendix A: Outreach 63
Appendix B: Effect of cloud screening for Spring 2007 65 Appendix C: National User Support Programme 2001-2005 67
Executive summary
Health effects of air pollution in Europe are dominated by particulate matter. New air quality
standards for PM2.5 have been set in the new EU air quality directive. However, uncertainties in
PM2.5 distributions are still large, and efforts to monitor and model PM2.5 need to be intensified
to improve this. Many studies in the last few years have shown the potential of satellite
measure-ments to aid monitoring PM2.5 concentrations at surface level.
An explorative study was carried out to investigate the use of satellite observations to monitor temporal and spatial variations in particulate matter (PM2.5) in the Netherlands. To this end, a
data set on AOD and PM2.5 at the atmospheric monitoring site, Cabauw, in a rural area in the
centre of the Netherlands. Since August 2006, PM2.5 has been monitored at Cabauw as well as
other atmospheric parameters including (AOD) using a Cimel sun photometer, and LIDAR back-scatter profiles. An analysis of measurements at Cabauw is presented directed to quantification
of the relationship between AOD and PM2.5 in the first year of observations. This relationship was
studied using ground-based (AERONET) as well as satellite based (MODIS and AATSR) measure-ments of AOD.
The AERONET L1.5 data on AOD used in this study has revealed a relatively large number of high
AOD values paired to low PM2.5 values, suggesting cloud contamination. Various methods were
used to detect cloud contamination in the AERONET data in order to substantiate this hypoth-esis. A cloud screening method based on LIDAR observations was chosen to detect clouds in the AERONET L1.5 data. Application of this method led to rejection of about 50% of the AERONET L1.5 data because of suspected cloud contamination. Comparison with AERONET L2.0 data that were available towards the end of the project shows that almost half of the AERONET L1.5 data was not maintained in the L2.0 data set, and that the L2.0 data set was almost identical to the screened L1.5 data set as used in this study. This gives confidence in both our cloud-screening method and in the cloud-cloud-screening method used by AERONET to process L1.5 to L2.0.
Subsequently, the dependence of the relationship between AOD and PM2.5 was studied as a
func-tion of the time of day, boundary layer height and air mass origin. The temporal correlafunc-tion
between AOD and PM2.5 was found to increase when only data were used that had been obtained
around noon. This time coincides with the time of overpass of the MODIS and AATSR satellites. Several factors may explain the increase in the explained variability when the data are confined to around mid-day. During conditions with valid AOD retrievals the mixing layer height during midday is generally well mixed, without residual layers present. Another important factor may be related to the solar zenith angle because a sun photometer is pointed directly at the sun. AOD measurements under large solar-zenith angles (low sun) are associated with much higher rela-tive air-mass factors compared to mid-day. This means that the relarela-tive contribution of aerosols in atmospheric layers above the mixing layer may become more important at large solar zenith angles. Furthermore, an averaging effect occurs in the observed aerosol properties and correla-tion with local observacorrela-tions decreases. Therefore, variability in observed AOD is expected to be higher under small solar-zenith angles. Finally, cloud screening using the LIDAR is prob-ably more accurate during midday as the LIDAR profiles the atmosphere directly above the site. Under large solar zenith angles, the observed part of the sky will be rather different between sun photometer and LIDAR. Better similarity is obtained under small solar zenith angles. Contra
intu-itively, the AOD-PM2.5 correlation did not improve after accounting for variation in the mixing
relationship on mixing layer height and relative humidity (e.g., Gupta, 2006; Koelemeijer et al., 2006a, b). This may be due to the fact that the mixing layer did not show a strong seasonal cycle over the Cabauw site during the year, unlike many other stations in Europe that were studied in earlier work. AOD data can only be obtained during clear sky conditions, and is biased towards conditions of southerly and easterly wind directions. Under such conditions, the temporal
varia-tions of AOD was shown to correlate reasonably well with temporal variavaria-tions in PM2.5 (R2=0.6).
This suggests that temporal variations of satellite AOD can be used as a proxy for temporal
variations in PM2.5. For these conditions, and limiting the data set to observations around noon,
the following AOD-PM2.5 relationship was found for Cabauw: PM2.5 =F 124.5*AOD – 0.34. The
difference between the yearly average PM2.5 data (obtained for all conditions) and the PM2.5 data
for conditions with predominantly southerly and easterly flow is typically 45%.
The average PM2.5 concentration at Cabauw of 18 μg/m3 is high in comparison with rural areas
in Europe and confirms that the Netherlands are characterised by a high PM burden. Satellite-derived AOD maps from AATSR and MODIS show similar mean values, but observed features in the spatial distributions are distinctly different. This illustrates that the interpretation of the AOD maps in terms of PM is hampered because the systematic errors in AOD of the same order of magnitude as the spatial variations themselves.
There was no opportunity to validate the spatial distribution of PM2.5 derived from MODIS AOD
measurements because of lack of well-calibrated PM2.5 ground-based measurements in the
period concerned. Thus, the estimated PM2.5 distribution is preliminary and the validity and
utility of the proposed mapping methodology should be further investigated. For this purpose, a number of sites with identical PM monitoring equipment further away from the coast should
be used. Validation of the PM2.5 fields is also hampered because different atmospheric transport
models show different spatial structures over the Netherlands, stemming from uncertainties about emissions as well as different treatment of atmospheric chemistry. Moreover, comparisons with modelled yearly average fields are difficult to make as the PM2.5 field presented holds for
conditions with southerly and easterly flows over the Netherlands and is representative for the daytime. Nevertheless, some features of the spatial distribution within the Netherlands do not appear to be realistic. Such artefacts might be caused by systematic errors present in the MODIS AOD data, particularly over coastal areas and areas with inland surface water such rivers and lakes.
An earlier project (PARMA) has shown that at larger scales (Europe), the spatial distribution of AOD has more realistic structures. The reason may be that over the whole of Europe, spatial gradients in AOD are larger than within the Netherlands, while many parts of continental Europe are much less affected by the presence of mixed land/water pixels than is the case within the Netherlands. Because of the uncertainties in current satellite data of AOD, it is not expected that
improved PM2.5 maps can be constructed based on satellite data only in the near future. Satellite
measurements of AOD will have added-value particularly regarding the temporal variation of PM,
1 Introduction
While air quality in Europe has improved substantially over the last few decades, air pollution still poses a significant threat to human health (EEA, 2007). Health effects of air pollution are
dominated by particulate matter, both PM2.5 (particles of 2.5 μm diameter or less), and PM10
(particles of 10 μm diameter or less). Short-term exposure to particulate matter has frequently been associated with increased human morbidity and mortality (e.g., Dockery et al., 1993; Brunekreef and Holgate, 2002).
While less is known about the effects of long-term exposure than of short-term exposure to particulate matter the health impacts are thought to be much greater (Pope III et al., 1995). An analysis by the World Health Organization (WHO, 2006) indicates that air polluted with parti-culate matter, and especially fine fraction (PM2.5), affects the health of most of Europe’s
popu-lation. This leads to a wide range of acute and chronic health problems, and reduces life expec-tancy by almost one year on average in the EU Member States (WHO, 2006).
To prevent these negative health effects, the EU has set two limit values for PM10:
and a limit value of 40 µg/m
• 3 for the a limit value for 24-hour average concentrations, of 50
µg/m3 that may not be exceeded more than 35 times per year;
annual average concentration. •
Recently, political agreement was reached to establish new limit values for PM2.5:
a limit value of 25 μg/m
• 3 for the annual average concentration, to be attained by 2015 that is
applicable everywhere;
a so-called exposure concentration obligation of 20 μg/m
• 3 to be attained in 2015, which holds
for the average urban background concentration;
In addition, other goals were set that are not yet juridically binding. The urban background
concentration of PM2.5 should be decreased by 0 to 20% between 2010 and 2020, based on the
concentration level in 2010. The target of 20% is for the most polluted urban areas, while there
is no obligation to reduce the concentration in urban areas with yearly average PM2.5
concentra-tions below 7 μg/m3. Also, an indicative limit value of 20 μg/m3 is established for annual average
PM2.5 concentrations, to be attained in 2020.
Air quality measurements
To monitor compliance with the limit values, air quality is measured in all EU Member States. The data are stored in a central database, Airbase, which is maintained by the European Envi-ronment Agency.
Although these ground-based measurements are relatively accurate, they are representative of a limited area because aerosol sources vary over small spatial scales and the aerosol lifetime is less than an hour to a few days, depending on particle size and chemical composition.
Furthermore, the difficulty of measuring the absolute level of PM is widely recognised. The measurement error is estimated to be 20% for yearly average concentrations (1-sigma). One of the problems with PM measurement is the volatilisation of the semi-volatile components during the measurement process. This leads to systematic measurement errors depending on the measu-rement technique used and aerosol composition which varies in time. These systematic errors are corrected with a fixed correction factor in some EU Member States but no correction is
made in some other countries. The limited spatial representativeness and systematic errors make it virtually impossible to achieve an accurate overview across Europe based on ground-based measurements only.
Satellite measurements
Satellite measurements are less precise but provide a large spatial coverage and have the advan-tage of being country-independent. Thus, satellite measurements could be used to complement the surface network to achieve greater comparability of PM levels between countries.
Since 2000, the usefulness of satellite measurements of Aerosol Optical Depth (AOD) to
improve PM2.5 monitoring has been investigated in a rapidly increasing number of studies.
Several studies in the USA have reported good temporal correlations between satellite derived
AOD and PM2.5 surface concentration measurements. (Wang and Christopher, 2003;
Hutchi-son, 2003). In general, promising correlations have been found between one-month time-series
of AOD and PM2.5 for many stations in the Eastern and Midwest of the USA. Other stations,
however, particularly in the west of the country show hardly any correlation (Engel-Cox et al., 2004; 2006). The strength of such correlations is likely to be affected by factors such as variati-ons in local meteorological conditivariati-ons, occurrence of multiple aerosol layers, and variativariati-ons in aerosol chemical composition.
Van Donkelaar et al. (2006) studied the usefulness of satellite AOD measurements of the Mode-rate Resolution Imaging Spectroradiometer (MODIS) and the Multi-angle Imaging
Spectrora-diometer (MISR) for assessment of spatial variations of PM2.5 in North America. They
conclu-ded that there is significant agreement with those from the surface networks in Canada (NAPS) and the USA (AQS).
Recent studies in other regions including Europe have indicated the use of satellite measure-ments in monitoring particulate matter air quality (Chu et al., 2003; Koelemeijer et al., 2006a; Kacenelenbogen, et al., 2006; Gupta et al., 2006; Gupta et al., 2007). Several studies have also showed that the relationship between PM and AOD is influenced by the mixing layer height and relative humidity (e.g., Gupta, 2006; Koelemeijer et al., 2006a, b). The studies above have concluded that AOD observations may be useful in improving mapping of PM concentrations. A PM10 distribution for Europe has been derived using geo-statistical techniques combining in-situ observations, modelled distributions and MODIS (MODerate-resolution Imaging Spec-troradiometer) satellite data (van de Kassteele et al., 2006; NIVR PARMA project). Use of both model and remote sensing data have been shown to improve the quality of the estimated annual average PM10 distribution. A more direct estimate of global PM2.5 was made using modelled AOD-PM2.5 relationships to satellite-derived AOD (van Donckelaar et al., 2006). Furthermore, the advent of satellite observations has led to a development of data assimilation schemes that assimilate AOD directly into models (e.g., Builtjes et al., 2001; Collins et al., 2001; Koelemeijer et al., 2006a). In the latter approaches, used in NIVR PARMA and HIRAM projects, the model-led relation between AOD and PM2.5 is a very uncertain and limiting factor in determining the absolute PM2.5 concentrations from satellite data (Koelemeijer et al., 2006a).
Study objectives
In acquiring daily estimates of PM2.5 distributions, the critical factors are the quality of the
remote sensing data and an established relationship between AOD and ground-level PM2.5. In
purpose, a field study was conducted at Cabauw, the central site for atmospheric research in the Netherlands. Furthermore, we aim to demonstrate the feasibility of using the relationship to map PM2.5 over the Netherlands using satellite data.
This study is co-funded by the Netherlands Agency for Aerospace Programmes (NIVR) under the National User Support Programme (see Appendix C). It builds on experience obtained in a series of previous NIVR projects: ARIA2, PARMA and HIRAM.
2 Experimental set-up
2.1
Ground-based data sources
In this study, based measurements of aerosol optical depth (AOD) were related to ground-based measurements of particulate matter. For this study, the co-location of ground-ground-based data sources is critical, since atmospheric variability and spatial inhomogeneity rapidly obscure the relationships between AOD and PM. Furthermore, access to other data describing the atmosp-heric state is essential in adequately selecting different cases and in building a robust
relation-ship between AOD and PM2.5. Such facilities are available at the Cabauw Site for Atmospheric
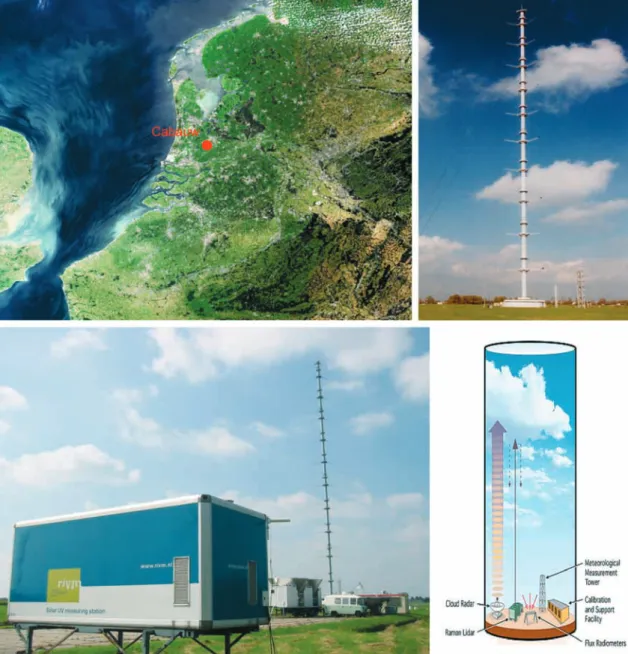
Research (CESAR) which as selected for the study (Figure 2.1).
2.1.1 Cabauw research station
The Cabauw Experimental Site for Atmospheric Research (CESAR) is the focal point of expe-rimental atmospheric research in the Netherlands (http://www.cersar-observatory.nl). The goal of the CESAR initiative is to set-up and to operate an observational facility at the Cabauw site with a comprehensive set of remote sensing and in-situ equipment to characterize the atmosp-heric column above Cabauw. CESAR is an atmospatmosp-heric reference site in the European and global research networks and is a collaborative effort of eight institutes in the Netherlands (KNMI, RIVM, TU-Delft, TNO, ECN, WUR, Utrecht University and ESA/ESTEC).
The Cabauw site (51.97 N, 4.93 E) is located in a rural area in the centre of Netherlands. A 213 m metrological tower is used for in-situ monitoring of the atmosphere. A range of instruments measuring parameters related to clouds, radiation, atmospheric state and land-atmosphere inter-action are located around this mast. In particular, various remote sensing instruments including radars and lidars are used for atmospheric profiling,
Some of the instruments at Cabauw are also part of instrument networks, such as the lidar which is part of the European Aerosol Research Lidar Network (EARLINET), the radiation measure-ments in the Baseline Surface Radiation Network (BSRN) and the Aerosol Robotic Network (AERONET). Moreover, Cabauw is being developed as a focal point for air quality studies. Impor-tant for our study is the long term time series of AOD and a range of optical and physical aerosol parameters such as size distribution, volatility and aerosol extinction coefficient are obtained. Furthermore, the vertical aerosol distribution is monitored using a lidar. These systems are used within this study and are described in more detail below.
2.1.2 Measurement strategy
A good understanding of the relationship between AOD and PM is crucial, when AOD is used to construct PM maps. To use satellite observations in the particulate matter dossier, artefact-free empirical data are needed to characterise the regionally dependent relationships between satel-lite AOD and particulate matter, especially for the Netherlands.
In this project, a new set of collocated measurements was obtained of PM2.5, AOD (sun
photo-meter), vertical distribution of aerosols from lidar measurements and aerosol measurements at a 200 m observation tower, and various meteorological parameters. In the build-up of this study,
Element Oscillating Microbalance with Filter Dynamics Measurement System – TEOM-FDMS) is known to be free of artefacts that result from losses of semi-volatile aerosols during the measu-rement. Moreover, the CESAR site allows synergy between other instruments installed there. This allows for the determination of the aerosol vertical profile using a lidar and physical and optical characterisation of aerosols, and benefit from other national and international projects such as the EU FP6 infrastructure projects EUSAAR and EARLINET-ASOS. These projects aim at standardi-sation and harmonistandardi-sation of the measurements at selected sites, such as CESAR.
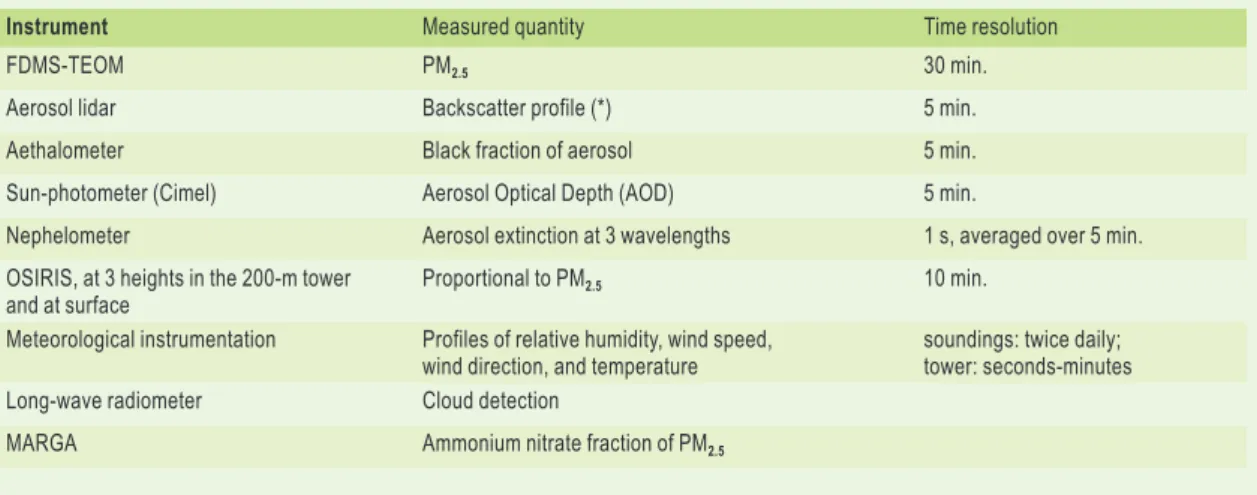
The ground-based measurements performed at the CESAR site are summarised in Table 2.1. The
main instruments for determining the relationship between AOD and PM2.5 are the FDMS-TEOM,
the sun-photometer, lidar, and meteorological observations.
Figure 2.1 Overview of the Cabauw Experimental Site for Atmospheric Research in the centre of the Netherlands. Remote sensing instruments are located close to the 213 m meteorological tower.
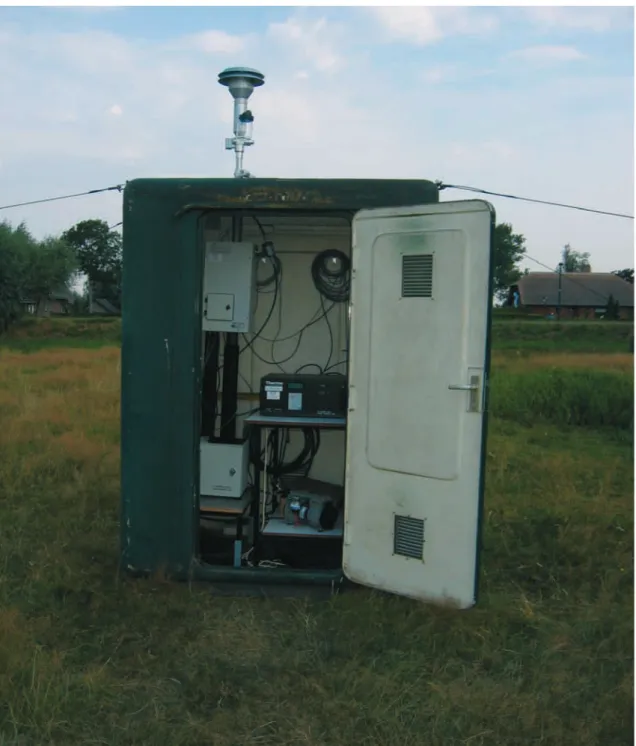
PM2.5 measurements
A TEOM-FDMS (Rupprecht and Patashnick, Model 8500) was installed to monitor ambient PM2.5
concentrations (Figure 2.2). It is well known that a standard TEOM underestimates ambient PM concentrations due to evaporation of semi-volatile components from the filter that is conditioned at higher than ambient temperatures. Especially, ammonium nitrate is sensitive to evapora-tion under these operaevapora-tion condievapora-tions. As ammonium nitrate levels are high in the Nether-lands (Schaap et al., 2002), the TEOM-FDMS was selected for this study. In a TEOM-FDMS, mass concentrations are obtained from the TEOM that also has a FDMS (Filter Dynamics Measurement System) to examine the behaviour of the mass on the filter under clean conditions. The measure-ment cycle of the TEOM FDMS is divided into two parts, which are alternated every few minutes. One part of the cycle is similar to the classical TEOM approach, and provides the mass increase due to aerosols. In the second cycle, air passes through a filter that blocks aerosols and then the clean air is led to the TEOM filter. Generally, a mass decrease of the TEOM filter is measured during this cycle, which results from continued evaporation of semi-volatile particulate matter.
This is subsequently accounted for in the final result for the total mass of PM2.5. Comparisons
with reference methods show good general agreement (e.g., Bureau Veritas, 2006). Thus by
using the TEOM-FDMS, estimates of PM2.5 inline with the reference methods were obtained on a
temporal resolution of 30 minutes.
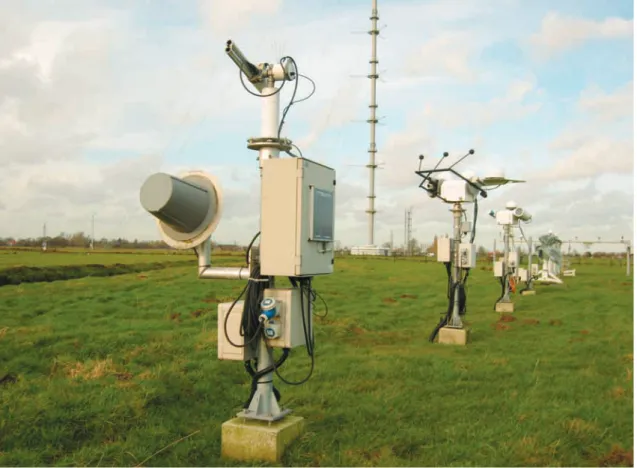
AOD measurements
The aerosol optical depth is routinely monitored using a CIMEL sun photometer (Figure 2.3) and the data are reported to the AERONET (http://aeronet.gsfc.nasa.gov; see Holben et al., 2001). The technical description of the instrument is presented in the Cimel Sun Photometer Manual (http:// aeronet.gsfc.nasa.gov). The instrument measures the aerosol optical depth at four wavelengths (440 nm, 670 nm, 870nm and 1020 nm), and the sky radiance in aerosol channels in the azimuth plane (almucantar technique) and in the principal plane. These data are used in the AERONET standard procedures to retrieve information on columnar aerosol characteristics such as the aerosol optical depth, Ångstrøm coefficient and size information. Data processing, cloud-scree-ning algorithm, and inversion techniques are described by Holben et al. (1998; 2001), Eck et al. (1999), Smirnov et al. (2000), Dubovik and King (2000), and Dubovik et al. (2000).
We have used the Level 1.5 data (Automatically cloud cleared but may not have final calibration applied. These data are not quality assured) AOD data in this study are available on a near-real-time basis. The Level 2 data (Pre- and post-field calibration applied, automatically cloud cleared
Table 2.1 Ground-based measurements performed at the CESAR site
Instrument Measured quantity Time resolution
FDMS-TEOM PM2.5 30 min.
Aerosol lidar Backscatter profile (*) 5 min.
Aethalometer Black fraction of aerosol 5 min.
Sun-photometer (Cimel) Aerosol Optical Depth (AOD) 5 min.
Nephelometer Aerosol extinction at 3 wavelengths 1 s, averaged over 5 min. OSIRIS, at 3 heights in the 200-m tower
and at surface Proportional to PM2.5 10 min.
Meteorological instrumentation Profiles of relative humidity, wind speed,
wind direction, and temperature soundings: twice daily;tower: seconds-minutes Long-wave radiometer Cloud detection
and manually inspected) is updated on an annual basis and became available for part of our observation period towards the end of our study.
Vertical structure of the atmosphere
In the Netherlands, most aerosols are present in the lowest 1 to 2 km of the atmosphere, parti-cularly in the mixing layer. However, it is not uncommon that substantial aerosol-loaded air masses are present above the mixing layer. These aerosols are decoupled from the ground and usually originate from sources far away. They are, therefore, likely to have different (optical) properties than aerosols at ground level. Thus, in-situ measurements of aerosol properties at ground level are not always representative of aerosol particles aloft and the total aerosol column above the measurement site. To be able to recognise such cases, the vertical structure of the
atmosphere needs to be known, and particularly about the presence of aerosol layers and clouds. Lidar (Light Detection and Ranging) instruments are well suited to detect aerosol layers, even above the mixing layer.
In this study, extensive use has been made of the RIVM aerosol backscatter lidar. This instrument provides information on the vertical structure of the aerosol profile, atmospheric layering and the presence of clouds up to an altitude of 15 km. A measurement is made at five-minute inter-vals around the clock. The backscatter lidar operates at a single wavelength (1064 nm) and is therefore limited it its ability to estimate aerosol optical properties in addition to the qualitative vertical aerosol and cloud profile.
2.2 Satellite data sources
2.2.1 MODIS
The MODerate-resolution Imaging Spectroradiometer (MODIS) instrument was launched onboard the EOS-Terra satellite in December 1999. In May 2002, a second MODIS instrument was launched on board EOS-Aqua. The MODIS instruments measure sunlight reflected by the Earth’s atmosphere and surface as well as emitted thermal radiation at 36 wavelengths. At least two observations of any place in Europe are obtained per day during daylight hours because the
Figure 2.3 A Cimel sun photometer set-up as an AERONET station, including a solar panel for electrical power and a transmitter for relay of data to AERONET headquarters at NASA-GSFC. (Photo: Ed Worrell/KNMI).
Terra and Aqua satellites cross Europe close to 10:30 and 13:30 local solar time, respectively. The AOD algorithms for application over land and sea surfaces are mutually independent because the radiative properties of water and land are very different. The retrieval is more accurate over ocean than over land because the reflection by water is relatively low outside the region of direct sun glint, algae blooms and suspended matter, and can be computed accurately from the sea surface wind field.
The MODIS retrieval (v5) of the AOD over land employs primarily three spectral channels centred at 0.47, 0.66, and 2.1 μm. AOD is derived at 0.47 and 0.66 μm, and interpolated to 0.55 μm. The AOD is only retrieved for cloud-free pixels in a 20x20 pixel area at 500m resolution and
repor-ted at 10x10km2 resolution. Only when more than 12 pixels are classified as cloud-free, an AOD
retrieval is attempted. The AOD is retrieved over surfaces that are not highly reflective (thus snow or ice covered surfaces and deserts are excluded).
The basics of the algorithms are described in Kaufman and Tanré (1998) and Remer et al. (2005). The AOD data obtained from these algorithms have been used in numerous studies on the direct aerosol forcing (see, Yu et al., 2006 for a review), aerosol-cloud interactions (e.g., Koren et al., 2005; Wen et al., 2007), source characterisation (Dubovnik et al., 2004; Koelemeijer et al, 2006a), and air quality (e.g., Al Saadi et al., 2005; van Donckelaar et al., 2006; Koelemeijer et al., 2006). Recently, a new collection (collection 5) of AOD data was released. The new algo-rithms are described in Levy et al. (2007a, b).
In the PARMA project, AOD retrieved by MODIS from the previous collection (collection 4) have been compared with sun photometer data from the AERONET network in Europe. A good tempo-ral correlation was found between MODIS and AERONET. However, a large positive bias of about 50% in the MODIS AOD data was found, which is in accordance with earlier findings. There was a strong seasonal signature in the overestimation of AOD by MODIS with a maximum during summer. After correction for the bias, the accuracy of MODIS AOD retrievals agreed with the pre-specified accuracy of 0.05 ±0.20*AOD over land and 0.03 ± 0.05*AOD over ocean (1-σ level, for individual retrievals) and the residuals show a normal distribution. Furthermore, we hypothe-sized that, on average, up to one-third of the MODIS retrievals may be cloud contaminated. For some stations in central Europe, this percentage was found to be higher than 50%.
A likely explanation for the strong bias in the MODIS collection 4 data may be found in the treat-ment of the surface reflectivity. The AOD is only retrieved for cloud-free pixels and over surfaces that are not too reflective. The reflectivity measured at 2.1 μm at the top-of-atmosphere is used to determine the surface reflectivity at that wavelength. Fine-mode particles, which dominate the AOD in most of Europe, have a negligible optical depth at 2.1 μm, allowing almost direct obser-vation of the surface (Chu et al., 2003). In the v4.2 retrievals, the surface reflectivity at visible wavelengths is then obtained by assuming a constant ratio between surface reflectivity at 2.1 μm and that at 0.47 and 0.66 μm. In reality, this ratio depends on surface type and its time-depen-dent characteristics that determine the reflectivity (e.g., vegetation and soil moisture).
Levy et al. (2007) showed that by using higher surface reflectivity at 0.47 and 0.66 μm, the lowered AOD over land significantly reduced the discontinuity between land and sea over the coastline in the north-east of the USA. In addition, the agreement between MODIS and AERONET improved in that area. A major improvement in the second generation MODIS algorithm (v5.2; Levy et al., 2007) is the inclusion of a pixel-specific wavelength dependence of the surface reflectivity. Compared to v4.2, the surface reflection used in the algorithm has increased over
more vegetated areas in the mid-latitudes (especially in summer). First inspection of the new annual average distribution (see Chapter 6) shows significantly lower AOD over Europe and only slight discontinuities between land and sea areas.
Although the surface reflection is one of the major changes, the differences between the two collections cannot be explained so simply, and more likely results from a combination of factors. The MODIS algorithm (v5.2; Levy et al., 2007) has been updated rigorously. The major changes incorporate the new surface reflectivity assumptions, a new set of aerosol model optical properties derived empirically from AERONET, a new aerosol lookup table and a more elaborate inversion scheme. The cloud screening procedure was not changed. As a consequence of all the improvements, the new product generally yields significantly lower AOD. A preliminary evalua-tion shows better agreement with AERONET (Levy et al., 2007a). However, the data from the new collection need to be evaluated in detail for Europe. A full evaluation is beyond the scope of the present project. However, we will evaluate the data for the Dutch situation (at Cabauw).
2.2.2 AATSR
Advanced Along-Track Scanning Radiometer (AATSR) instrument onboard the European ENVISAT satellite flies at an altitude of approximately 800 km in a sun-synchronous polar orbit. Like its predecessors, ATSR and ATSR-2, the AATSR has seven wavelength bands in the visible and infrared parts of the spectrum (measurement wavelengths are at 0.55, 0.67, 0.87, 1.6, 3.7, 11 and 12 µm). The instrument has a conical scanning mechanism providing two views of the same
location with a resolution of 1×1 km2 at nadir view. The radiometer views the surface along the
direction of the orbit track at a forward incidence angle of 49° and some 150 seconds later it records a second observation of the scene at an angle close to the nadir view. The swath width of 512 km results in an overpass over a given location – thus a global coverage – every three days at mid-latitudes.
The semi-operational AATSR retrieval algorithm used for SATLINK is based on the scientific ATSR-2 algorithms developed by Veefkind et al. (1998; 2000) and Robles González et al., (2000). It performs a dual view technique over land (see Flowerdew and Haigh, 1995) and a single view technique over water. The aerosol properties retrieved with these algorithms are the aerosol optical depth (AOD) at the available wavelengths (0.55, 0.67, 0.87 and 1.6 μm) and the Ångstrøm coefficient a. The wavelength dependence expressed in σ provides information on the aerosol size distribution. The AATSR dual view algorithm uses both the forward and the nadir view to eliminate land surface reflections from the total reflected solar light measured at the top of the atmosphere. Over land, the surface reflections often overwhelm the aerosol signature, and there-fore the dual-view method provides more accurate AOD results than retrieval based on a single viewing angle only. Retrievals are available on the scale of the pixel size of 1×1 km2 (Level 2)
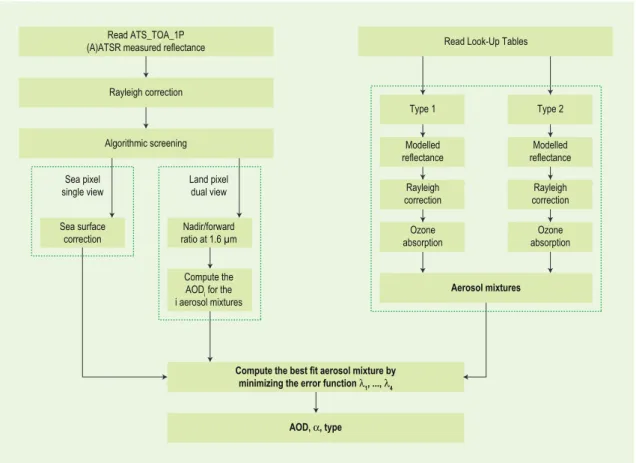
and averaged over larger scales (Level 3) for European maps. AATSR satellite measurements of the radiation at the top of the atmosphere are input for the semi-operational AATSR aerosol retrieval algorithm. The AATSR swath of 512 km allows for an overpass over each geo-location every three days, between 10.00 and 11.00. The retrieval procedure is depicted schematically in Figure 2.4.
The aerosol model used in this work is an external mixture of anthropogenic aerosol (sulphate/ nitrate water soluble) and sea salt. The effective radius of the anthropogenic mode is 0.05 µm. The optical properties used in the retrieval procedure are those applying to anthropogenic water soluble aerosol (Volz, 1972). The sea salt mode has an effective radius of 1 µm and the
optical properties were taken from Shettle et al. (1979). A Mie scattering code and the Radiative Transfer Model DAK (De Haan et al., 1987; Stammes, 1994) are used for the generation of lookup tables.
Aerosol properties can only be retrieved for cloud-free conditions and therefore an automated cloud screening procedure is applied based on cloud detection routines initially developed for off-line applications by Koelemeijer et al. (2001), and adapted for automatic applications by Robles González (2003). However, experience in former projects, such as HIRAM, has shown that some enhancements had to be made for improved automated cloud screening and selecting good-quality AOD pixels. By using both channels of AATSR instead of the nadir and the forward channel only, the screening of clouded pixels was stricter and improved.
Furthermore, corrections for ozone, surface contributions and atmospheric (Rayleigh) contri-butions are computed and finally, the corrected TOA (top-of-the-atmosphere) reflectance at the satellite sensor is compared with the modelled reflectances in iterative steps in order to select the right aerosol mixture. This procedure is based on a lookup table approach. Measured and modelled reflectances are matched using an error minimisation procedure to determine the most likely aerosol mixture and the AOD for the available AATSR wavelengths (Robles González et al., 2000;Robles González, 2003).
Read ATS_TOA_1P (A)ATSR measured reflectance
Rayleigh correction Algorithmic screening Sea surface correction Sea pixel single view Nadir/forward ratio at 1.6 µm Land pixel dual view Compute the AODi for the
i aerosol mixtures
Read Look-Up Tables
Aerosol mixtures
Compute the best fit aerosol mixture by minimizing the error function L1, ..., L4
AOD, A, type
Type 1 Type 2
Modelled
reflectance reflectanceModelled Rayleigh
correction correctionRayleigh Ozone
absorption absorptionOzone
2.3 Data processing
Sun photometerThe sun photometer AOD data were obtained from the AERONET site to comply with AERONET standards. The available data are level 1.5 which means that they are fully screened for clouds but that the final calibration of the instrument (needed for level 2.0) and the final (partly manual) checks on the data quality have not as yet been performed. For part of the time series, Level 2.0 data were available just before the end of the project. A preliminary assessment of the influence of the extra checks is given in the discussion, see Chapter 6.
TEOM-FDMS
The TEOM-FDMS provides the PM2.5 mass in combination with instrument diagnostics. The
instrument has a range of status codes indicating instrument reliability and data validity. We used only data without a reported malfunction or warning code. For these situations, the status code is 0. Furthermore, the concentration had to be positive and all data with a positive correc-tion for the volatile fraccorrec-tion were disregarded. This screening may be too strict, but it refined the selected data to the best available.
LIDAR
From the lidar data, quick look figures were drawn for each day for visual inspection. The backscatter profiles are difficult to use in a statistical procedure. Therefore, a number of varia-bles were computed from the profile data. These include cloud presence (flag), cloud base and integrated backscatter over the lower 1 and 3 km.
Meteorological variables
Standard meteorological variables (T, RH, Wind direction and speed) for the Cabauw site were taken from the CESAR data portal. A classification of the synoptic situation was obtained from the German Weather Service. The classification is available on a daily basis and is discussed in more detail in Chapter 5. All instruments have their own temporal resolution, ranging from minutes to an hour. Thus hourly mean values were computed for all instruments and the mete-orological variables (T, RH, Wind direction and speed). Daily data, such as the type of synoptic situation, were assigned to all hours in the day. All data were combined in a single database for use in the analysis.
MODIS
MODIS data were downloaded in HDF format from the MODIS Distributed Active Archiving Center (DAAC).. All MODIS Terra and MODIS Aqua data were obtained that were available for the Nether-lands and surroundings in the period for the July 2006-July 2007. The AOD was taken from the HDF data field ‘Optical_Depth_Land_And_Ocean’ within the MOD04 (Terra) and MYD04 (Aqua) data product, collection 5. The MODIS Aerosol product contains data that have a spatial
resolution (pixel size) of 10x10 km2 (at nadir). Each MOD04_L2 product file covers a
five-minute time interval, which means the MOD04_L2 output grid is 135 10-km (at nadir) pixels in width and 203 10-km (nadir) pixels in length for nine consecutive granules. Every tenth granule has an output grid size of 135 by 204 pixels. All MODIS Atmosphere data products are available to the public (at no charge).
AATSR
The AATSR satellite data used during the SATLINK project are orbits of Level-1b top-of-the-atmosphere Gridded Brightness Temperature/Reflectance (GBTR) products. Level-1b is the raw
satellite data calibrated and geo-referenced at a processing and archiving facility (PAF); the GBTB is a gridded brightness temperature product for the infrared channels and a gridded reflectance product for the visible and NIR channel. These data products have been downloaded from the ESA rolling archive servers and stored locally on external HDs for further processing with the aerosol retrieval algorithm.
The AATSR retrieval algorithm automatically selects those orbit segments that coincide with the SATLINK domain. The retrieval output has been stored in ASCII format for high resolution maps
(generic 1×1 km2 pixel size) with an AOD value for each pixel. A second output product is low
resolution maps (10×10 km2 pixel size) for AOD, the number of high resolution AOD values in
one low resolution pixel, and the standard deviation of the AOD in the low resolution cell. The retrieval algorithm cuts the dataset for the lower and upper 10%, thus discarding outliers that do not contribute to a proper and qualitative high AOD result. Furthermore, post-processing of the data adds an extra restriction on each low resolution pixel dataset by admitting only low resolu-tion AOD values for which the standard deviaresolu-tion is lower than 0.05.
For both MODIS and AATSR, the AOD retrievals were mapped on a grid over Europe with a spatial
resolution of 0.125x0.0625 degrees lon-lat, which refers to about 10x10 km2.
2.4 Analysis procedure
Data in the database were used to establish the relationship between AOD and PM2.5 at Cabauw
station. The steps in analysing the data and combine these data with satellite data are described below.
Analyse the time-series of
1. AOD from sun-photometer with those of PM2.5for a visual
inspec-tion of the data, a statistical descripinspec-tion of the data and to establish the overall correlainspec-tion
between AOD and PM2.5.
Select periods with a high and low correlation between
2. AOD and PM2.5.
Investigate reasons for the low/high correlations found in step 2, using measurement data 3.
from other instruments, specifically the lidar observations.
Based on step 3, select valid data points representative for periods with a good correlation 4.
between AOD and PM2.5. Assess how the relationship is influenced by variations in
meteoro-logical parameters (such as mixing layer height, relative humidity profile, wind speed, wind direction) and other factors.
Based on steps 3 and 4, specify the situations in which
5. AOD can be used to map PM2.5, and
establish their relationship. This forms the recipe to map PM2.5 for the Netherlands.
Use the results of the field study to make a link with satellite data.
6. AOD from the
sun-photo-meter at the CESAR site (Cabauw) was compared with that derived from AATSR, and MODIS. This serves as validation of the satellite based AOD and enables the influence of satellite
algorithm related effects and other effects on the correlation between AOD and PM2.5 to be
extracted.
Demonstrate the feasibility by constructing a map of PM2.5 for the Netherlands for an
3 Overview of ground-based data
3.1
Statistics
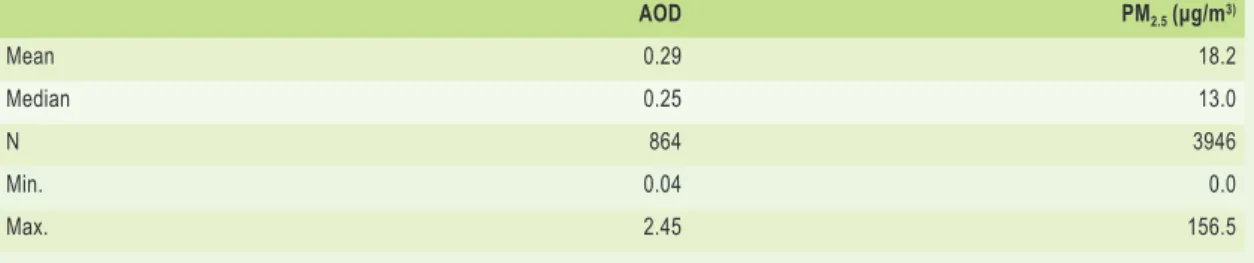
All instruments were operated from 1 August 2006 to 31 May 2007. A statistical overview of the data obtained is presented in Table 3.1. The average measured AOD was 0.29. The observed range in the level 1.5 data is from virtually zero (0.04) to 2.5, with a median value of 0.25. For Cabauw, a longer AOD record exists as part of the AERONET network since 2005. The AOD observed in this study is slightly higher than the mean value of 0.26 for the period April 2003 to April 2007. The slightly higher mean value is probably due to the use of level 1.5 data as discus-sed in Section 4.3.
The measured average PM2.5 concentration was 18.2 μg/m3, which is higher than in other areas
in Europe (Putaud et al., 2004) and confirms that the Netherlands is characterised by a high PM
burden. The mean concentration for a full year (August 2006 to August 2007) was 17.5 μg/m3.
Thus, the mean PM2.5 concentration over the period under study is representative of a full year.
For comparison, a limit value is to be set in the new EU air quality directive 25 μg/m3 for annual
average concentrations to be met by 2015. Also, an indicative limit value is to be set for 2020 of
20 μg/m3 for annual average PM
2.5concentrations Maximum concentrations were observed in the
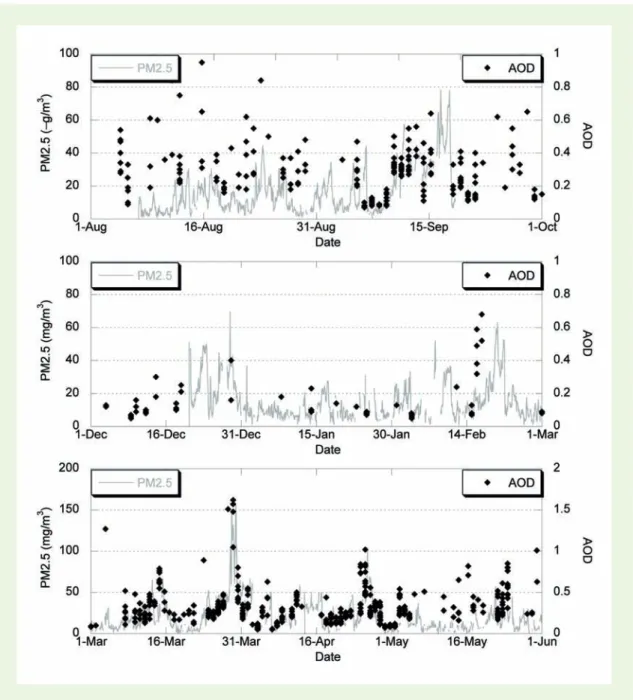
last days of March and the beginning of April, with a peak value of 156 μg/m3 (see Figure 3.4).
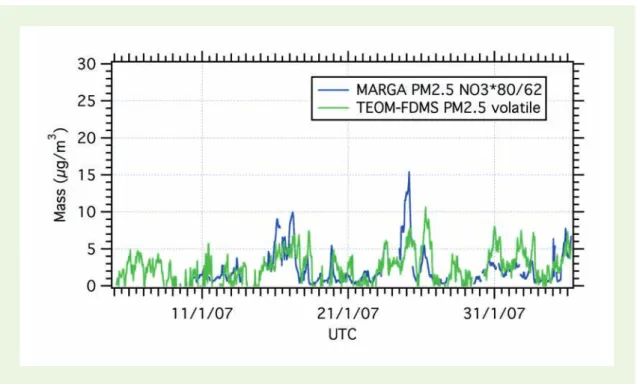
The FDMS data indicate that the semi-volatile fraction is very important, especially during PM
episodes. In Figure 3.1, the measured PM2.5 concentration and its semi-volatile component for
January to March 2007 are presented. On average, the semi-volatile fraction was about 25% of the total particulate mass. Inspection of the time series indicates that the volatile fraction was relatively constant as function of particulate mass. For example, during the episode at the end of
March about 50 μg/m3 of the mass (~150 μg/m3) was found to be volatile. The main
semi-volatile component in PM2.5 was ammonium nitrate, an important component of PM in
north-western Europe (Schaap et al., 2002). The hypothesis that ammonium nitrate constitutes most of the lost mass is substantiated by a comparison between the volatile fraction and chemical characterisation of PM by the MARGA system during January 2007 (see Figure 3.2).
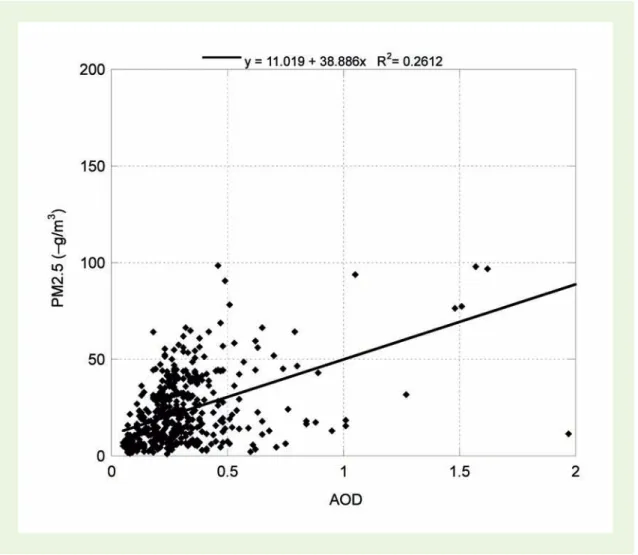
3.2 Initial comparison between AOD and PM
2.5During the project, co-located measurements of AOD and PM2.5 were obtained for the period
from 1 August 2006 to 31 May 2007. As an initial assessment, all AOD data were plotted against the co-located PM2.5 data in a scatter diagram (Figure 3.3). Initial inspection shows large
vari-Table 3.1 Statistical overview of the AOD and PM2.5 values obtained in this study
AOD PM2.5 (μg/m3) Mean 0.29 18.2 Median 0.25 13.0 N 864 3946 Min. 0.04 0.0 Max. 2.45 156.5
ability and no indication of a relationship between the variables. Closer examination shows
no combination of low AOD and high PM2.5. However, there were many occasions when AOD
was high, but PM2.5 was very low. In short, a first inspection of all data shows a low correlation
(R2=0.26) between AOD and PM
2.5.
The complete time series of AOD and PM2.5 is presented in Figure 3.4. PM2.5 is given as a grey
line and the AOD data are superposed as black squares. The AOD values are given on the
secon-Figure 3.2 Comparison between total volatile mass (FDMS; green) and ammonium nitrate levels (MARGA; blue) for January 2007. Data from the MARGA system were obtained from ECN. The MARGA measurements of nitrate were multiplied by the ratio of molecular masses of ammonium nitrate and nitrate to obtain a measure of the ammonium nitrate contribution to PM2.5.
Figure 3.1 Measured concentrations of total PM2.5 and the volatile fraction obtained by the
dary Y-axis. Visual inspection of the time series provides good insight into the actual data. Moreover, compared to the scatter diagram the information content is much higher. Inspec-tion of the upper panel (August-September 2006) yields a more differentiated picture. During
August, PM2.5 concentrations were relatively low, whereas the sun photometer yielded high AOD
data. The two measures are uncorrelated during this month. In contrast, the AOD and PM2.5 data
for September track each other well (R2 =F 0.65).
Inspection for the remainder of the study period confirms that periods with and without corre-lation follow one another. As well as September, a very promising correcorre-lation between AOD
and PM2.5 was found for a prolonged period between 15 March and 15 May (R2=0.56). For
almost two months (March and April) AOD and PM2.5 track on another very well, including the
event around 30 March when the highest PM2.5 concentrations in the measurement period were
observed.
Visual inspection of these time series raises several questions. The most important being why is there a good correlation in some periods and not in the others This was investigated using the lidar vertical backscatter profiles.
Figure 3.3 Ground-level PM2.5 concentration as function of sun photometer AOD (level 1.5) for all
3.3 Examples of vertical aerosol profiles
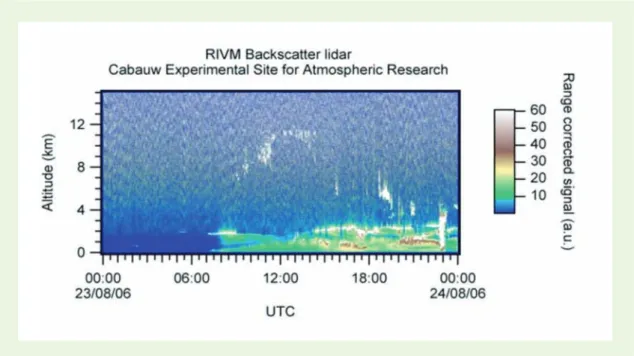
From the visual comparison of time series of AOD and PM2.5 in Section 3.2, correlation in
August was much lower than, for instance, in September 2006 or March-May 2007. The vertical structure of the atmosphere is shown for two cases; August (Figure 3.5) and September (Figure 3.6). In the time-height lidar plots, the colour scale (in arbitrary units) is representative of the light scattering that occurs at a given height at a given point in time. Dark and light blue hues indicate low scattering, green and brown are indicative for aerosols and white is associated with very strongly scattering particles and clouds. Since the noise level in the lidar data increases with altitude, detection of low scattering levels becomes more difficult at higher altitudes. From these examples, it is clear that presence of clouds probably contaminates the sun photometer
AOD measurements and AOD may be overestimated. In such cases, PM2.5 values appear lower
Figure 3.4 Time series for PM2.5 and AOD for the period August-September (upper panel),
than AOD values. While this may be clear in some cases where high AOD values occur, cloud contamination in the AOD measurements of the sun photometer is less evident with high cirrus clouds that have only low optical depth. In Chapter 4, different measurement methods for cloud detection are described and are applied to screen the sun photometer AOD measurements for cloud contamination.
Figure 3.5 Colour coded time-height plot of lidar data for 23 August 2006. Variable clouds at different heights are detected as strongly scattering atmospheric constituents and are depicted in white.
Figure 3.6 Colour coded time-height plot of lidar data for 20 September 2006. This is a typical day with fair weather. Low altitude clouds are not present, but optically thin cirrus clouds are present between approximately 6 and 12 UTC. Also, a lofted aerosol layer can be observed between 3 and 4 km that is decoupled from the mixing layer.
4 Analysis of AERONET AOD data
In addition to the AOD and PM2.5 data, auxiliary data on the state of the atmosphere were
collec-ted simultaneously at the Cabauw site. This allowed investigation of disturbing effects of clouds on the AOD measurements by the sun-photometer using these auxiliary data (see Section 4.2),
and also investigation of the dependence of the relationship between AOD and PM2.5 on
atmosp-heric parameters such as mixing layer height (Section 5). These auxiliary atmospatmosp-heric parame-ters are described in Section 4.1 and the effect of cloud contamination and criteria to remove affected data from the data set are discussed in Section 4.2.
4.1
Cloud detection methods
Detection of clouds using lidar data
Lidar systems can be used to detect clouds as they show up as strong scatters in lidar data. Moreover, measurements in cloudy conditions show relatively long time-delay (or ‘range’ modulations) of the signal caused by multiple light scattering inside the cloud.
A combination of three algorithms was used to detect clouds based on these characteristics. The first approach is a threshold method where the attenuated lidar backscatter signals above a threshold are designated as clouds. This works well for high signal to noise ratios (for low altitude clouds). Favourable results are also obtained in noisy cases when smoothing of the lidar signal is applied. The latter has the disadvantage of reducing (spatial) resolution, but was not a problem in this study because the primary interest is detection of the presence of clouds. Cloud properties are of secondary interest. The second approach aims to detect strong modulations in the lidar signal due to clouds. Thus, the detection algorithm is based on the first order range-derivative as described by Pal et al. (1992). The range-derivative filter may be set at variable resolution with altitude in order to enhance detection of high cirrus.
These first two approaches only use qualitative lidar signal features. The third approach is more quantitative, and is based on retrieval of the backscatter profile from the lidar data (Klett, 1985) and setting a threshold at the scattering level of clouds. All three techniques were implemented to analyse the data from the RIVM backscatter lidar. A combined approach was finally used to obtain the best possible reliability for cloud detection, including those at high altitudes. Cloud detection was performed for all lidar profiles with five -minute time intervals, thus a maximum of 12 cloud detections was done within an hour.
The lidar detection limit of the backscattered signal is determined largely by the power-aperture product of the lidar (average laser power multiplied by the area of the receiving telescope). Thin cirrus is, therefore, best observed with relatively high-power lidars. Most lidar-ceilometers are not well-suited to observe thin cirrus because of signal to noise limitations. To some extent, this also applies to the RIVM lidar at Cabauw. This may result in either not detecting a cirrus cloud that is present, or in detecting clouds even though the sky is clear(see Figure 4.1). For this reason, our criterion was to flag AERONET data points for rejection in cases of more than three consecutive cloud detections. With three or less consecutive cloud detections, the AERONET data were considered not to be affected by cloud contamination.
Detection of partial cloud amount using infrared radiometer data (APCADA)
A sun photometer obtains AOD data from measurements by looking directly at the sun. Auxiliary data on the atmospheric state should, therefore, preferably be made under the same measure-ment geometry. Using a lidar only poses two problems:
A stationary vertically pointing lidar provides vertical aerosol profiles and cloud detection •
for a small footprint in the zenith sky only. Under some circumstances, the sun photometer observes a clear sky under a slant path, while at the same time the lidar observes a cloud directly overhead, or vice versa. Therefore, additional cloud indicators may be needed to avoid confusion under variable cloud conditions.
Cloud contamination by optically thin clouds (both high and low-level) may be very hard to •
detect in sun photometer data. High-level clouds are, however, also difficult to detect using lidar measurements.
For these reasons, the applicability was investigated of a recently developed all-sky cloud cover detection system: APCADA (Dürr and Philipona, 2004). APCADA stands for “Automatic partial cloud amount detection algorithm” that was developed to automate human observations of cloud fraction. The APCADA algorithm was applied to data from the Infrared Radiometer at the Cabauw site. APCADA is based only on measurements of long wave downward radiation, temperature, and relative humidity near to the surface. Using the APCADA method, cloud cover estimates are obtained every 10 minute during the day and night, and it is applicable to radiation stations without knowledge of synoptic cloud observations. APCADA makes no distinction in cloud type (altitude).
APCADA can detect only clouds that have a measurable effect on long-wave down-welling radia-tion. Thus, APCADA testing of estimated and observed sky cloud cover was restricted to the total amount of clouds without high clouds. Dürr and Philipona (2004) state that further
investigati-Figure 4.1 Example of cloud detections (red markers) using the RIVM lidar data. In this example, the high altitude clouds are successfully detected but misclassifications also occurred (resulting from noise or aerosols), particularly before the cirrus clouds appear.
ons are needed to combine APCADA with other cloud detection systems during the day and night to include the occurrence of high clouds for climatological studies. APCADA data were provided for this study by KNMI for the full SATLINK observation period.
Detection of clouds using the Ångstrøm parameter
The Ångstrøm parameter indicates the wavelength dependence of light scattering properties of atmospheric particles. For typical aerosols, the Ångstrøm parameter is between 1 and 2, with a medium of about 1.5 in our region (Stammes and Henzing, 2000). For large particles, such as cloud particles, the Ångstrøm parameter approaches zero. The Ångstrøm parameter is obtained from multiple wavelength bands in the Cimel sun photometer. An important advantage of using the Ångstrøm parameter is that it is also a standard product of satellite retrievals of AOD. As shown in Figure 4.2, the average Ångstrøm parameter decreases with an increasing number of cloud detections in an hour. A maximum of 12 cloud detections are possible in an hour, as cloud detections are made at a five minute intervals. An Ångstrøm parameter is expected to decrease with increasing number of cloud detections because cloud particles have a small Ångstrøm parameter compared to aerosols. At a low number of cloud detections, the Ångstrøm parame-ter is well above unity. This suggests that an AOD data point selection criparame-terion based on the Ångstrøm parameter could be useful to correct for residual cloud contamination. In this study, an Ångstrøm parameter of 1 was used to distinguish between cloud-free and cloud-contaminated AERONET data.
Figure 4.2 Mean AOD and Ångstrøm coefficient as function of the number of lidar cloud detections
4.2 Evaluation of cloud indicators
In this section, the atmospheric indicators described in Section 4.1 are used to investigate the
dependence of the correlation between AOD and PM2.5 on the presence of clouds. This leads
to an additional quality screening to remove effects of residual clouds from the AERONET v1.5 dataset of Cabauw. This screened data set was used in further analysis (see Chapter 5).
The impact of the additional cloud screening is shown in Figure 4.3, according to the three screening methods (lidar, ACPADA, and Ångstrøm parameter), and applied to the period August
and September 2006. In each panel, thePM2.5 time series and AOD measurements are shown. The
AOD that passed the additional test are shown as red diamonds, and the data points that failed the tests are shown in black. At first inspection, a significant proportion of the data do not pass the additional tests. For example, almost all data points in August, which was identified as a period
without correlation between AOD and PM2.5 do not pass the tests and cloud contamination is
suspected. The data for September, the first period to show a good correlation between the
vari-ables, mostly pass the tests. Most combinations of low PM2.5 and high AOD are filtered out with
the additional analyses. The cloud detection results from the different methods (lidar, APCADA, and Ångstrøm parameter) do not differ greatly indicating the robustness of the different approa-ches. Similar results are shown for the period March-May 2007 (see Appendix B).
The statistics of the observed AOD, with and without screening for residual clouds using the three cloud detection methods, are given in Table 4.1. Clearly, the maximum observed AOD decreased after screening for clouds. About half of the sun-photometer observations were exclu-ded after screening for clouds. The impact of cloud screening in the AERONET data was larger than expected. A large number of data points were rejected from the AERONET L1.5 data due to broken cloud conditions, as could be concluded from analysing lidar data. Contamination in the AERONET data resulting from broken clouds was not expected but data contamination resulting from optically thin high cirrus clouds could be expected.
The correlations between AOD and PM2.5 after applying the three cloud detection methods are
presented in Figure 4.4. The correlation coefficients are R2=0.44 (lidar), R2=0.34 (ACPADA), and
R2=0.45 (Ångstrøm). The Ångstrøm and lidar cloud detection methods thus gave rise to almost
the same degree of correlation, while the correlation was less using the ACPADA method for the time series.. The lidar method is straightforward, while the Ångstrøm method does not have as pure a physical basis, particularly regarding the criterion of using a threshold of 1 for the Ångstrøm parameter to distinguish between cloud-free and cloud-contaminated AERONET data. Instead, this criterion is tuned to get the best results. This does not mean it cannot be used, but lidar filtering was preferred because it is more straightforward. It may be expected that impro-vements to lidar signal to noise ratiowould yield better results. Another advantage of using
Table 4.1 Statistics of the observed AOD with and without screening for residual clouds using the three cloud detection methods
Mean AOD Median AOD N Min. AOD Max. AOD
All data 0.29 0.25 864 0.04 2.45
Lidar (limit 3) 0.27 0.24 376 0.05 1.62
APCADA 0.25 0.23 493 0.04 1.58
the lidar is that information is obtained about the height of the clouds. In the remainder of this study, the lidar screened AOD data were used for further analysis.
4.3 Impact of AERONET v1.5 data
In this study, AERONET v1.5 data for Cabauw were used. The reason is that the version 2.0 data are only processed once a year as it requires the calibration of the instrument and a visual inspection of the data by an expert. In the final month of the project, version 2.0 data were released for Cabauw for the period up until 12 April 2007. The consequences of using the version 1.5 instead of version 2.0 data are presented in Table 4.2.
Figure 4.3 Time series of PM2.5 and AOD data that are regarded to be cloud free (red) or suspected
of cloud contamination (black) for the methodology based on the lidar (upper panel), APCADA (middle panel) and the Ångstrøm parameter (lower panel) for August and September 2006.
Figure 4.4 Correlation between AERONET AOD and PM2.5 measured at Cabauw after screening for
residual cloud contamination in the AERONET AOD measurements. Results based on the lidar (upper panel), APCADA (middle panel) and the Ångstrøm parameter (lower panel), for August and September 2006.
Comparing AOD data from the two versions indicates that the number of valid data points is significantly reduced by about 20%. Furthermore, the data retained in v2.0 are 98% the same as in v1.5. The other 2% of the data contain a lower AOD in v2.0 than in v1.5. The consequence of the additional screening is that the average AOD is reduced from 0.29 to 0.25, which is conside-red to be significant.Figure 4.5:
Figure 4.5 shows the correlation between PM2.5 and AOD for v1.5 and v2.0. The grey diamonds
represent all data, while the black diamonds only show the data that have passed the Lidar cloud screening. Comparison of the versions shows that in v2.0, AOD values above 0.5 that are
associa-ted with low PM2.5 data, have been eliminated.
As a consequence, the fit between AOD and PM2.5 using all data explain a higher percentage of
the variability than in v1.5. The black diamonds represent the data after performing the cloud screening using the lidar profiles. Although there are more data points in the AERONET v2.0 than the data set used in this study (lv.15, lidar screened), there was close agreement between the two data sets after our lidar cloud screening. This means that many data points that we indepen-dently classified as unreliable were also identified as such in the processing of v2.0 data. This was confirmed by identifying the number of observations as a function of the number of cloud counts per hour (see Table 4.3). The data reduction in v2.0 is about 10% for the hours with a low
Table 4.2 Statistics of the sun photometer AOD data for version 1.5 and 2.0
AOD V1.5 AOD V2.0 Mean 0.29 0.25 Median 0.25 0.22 min 0.04 0.04 max 2.45 1.62 N 613 482
Figure 4.5 AOD as function of ground level PM2.5 concentration for v1.5 (left) and v2.0 (right) for all data (grey) and the data that passed the Lidar cloud screening (black). Data represent the period between the 1st of August, 2006, and the 12th of April, 2007.
number of cloud counts, but increases with cloud count, and sharply increases above nine cloud detections per hour. Since 98% of the values retained in the v2 data set are exactly the same as in v1.5, almost the same dataset was used in our analysis as data set could have been used if v2.0 data had been available. The consistency between the data provides confidence in the use of the lidar as an independent method to address the quality of the sun photometer data.
The shortcomings of v1.5 compared to v2.0 are effectively removed by additional screening for cloud contamination using the LIDAR profiles. Thus, although the analysis is influenced to some
extend by the use of v1.5 data, the impact on the relationship between AOD and PM2.5 is
relati-vely small.
Table 4.3 Comparison of the number of observations in the two AERONET datasets (v 15. and v2.0) as function of the number of detected clouds per hour.
LIDAR cloud count Number of observations V1.5 Number of observations V2.0 Data Reduction (%)
0 103 92 11 1 50 48 4 2 47 40 15 3 36 34 6 4 37 34 8 5 33 28 15 6 40 33 18 7 47 41 13 8 40 32 20 9 35 29 17 10 47 29 38 11 34 17 50 12 59 20 66