Mineral Dust as a component
of particulate matter
The contribution of mineral dust to ambient particulate matter
Mineral dust is a constituent of atmospheric particulate matter (PM
10). It
originates from diverse sources, such as wind erosion, agricultural land
management and resuspension by road transport. These sources are not
included in emission inventories of primary PM
10. Until recently, mineral dust
was assumed to be one of the major missing sources that would explain
the gap between modelled and observed concentrations of PM
10in the
Netherlands. This report assessed the importance of mineral dust in PM
10for the Netherlands and Europe, using chemical analyses of Dutch PM
10samples, a compilation of observational data from across Europe, and a
regional atmospheric chemistry and transport model. Ambient particulate
matter in Europe typically constituted of 5 to 20% mineral dust. The average
concentration of mineral dust in PM
10at six locations in the Netherlands
was approximately 1 to 1.5 µg/m
3. This is substantially less than reported by
previous studies. The increased level of mineral dust in PM
10samples in the
urban environment is still not properly understood, and nor are the differences
between the Netherlands and its surrounding countries. An important
conclusion of this report is that the contribution of mineral dust to PM
10in the
Netherlands is less important than previously thought.
This study is a BOP publication produced under the auspices of ECN.
The Netherlands Research Program on Particulate Matter (BOP) is a national
program on PM
10and PM
2.5. It is a framework of cooperation involving
the Energy research Centre of the Netherlands (ECN), the Netherlands
Environmental Assessment Agency (PBL), the Environment and Safety Division
of the National Institute for Public Health and the Environment (RIVM) and
TNO Built Environment and Geosciences.
BOP – WP2 – report
Mineral Dust as a component
of Particulate Matter
Hugo Denier van der Gon, Magdalena Jozwicka, Elise Hendriks,
Mhtenkeni Gondwe and Martijn Schaap
Mineral Dust as a component of Particulate Matters
This is a publication of the Netherlands Research Program on Particulate Matter Report 500099003
H. Denier van der Gon, M, Jozwicka, E, Hendriks, M, Gondwe, M. Schaap Contact: karin.vandoremalen@pbl.nl
ISSN: 1875-2322 (print) ISSN: 1875-2314 (on line) This is a publication in the series: BOP reports Project assistant: Karin van Doremalen English editing: Annemieke Righart
Figure editing: PBL editing and production team Layout and design: RIVM editing and production team Cover design: Ed Buijsman (photographer: Sandsun) ECN Energy research Centre of the Netherlands PBL Netherlands Environmental Assessment Agency TNO Built Environment and Geosciences
RIVM National Institute for Public Health and the Environment
This study has been conducted under the auspices of the Netherlands Research Program on Particulate Matter (BOP), a national program on PM10 and PM2.5 funded by the Dutch Ministry of Housing, Spatial Planning and the Environment (VROM).
Parts of this publication may be reproduced provided that reference is made to the source. A comprehensive reference to the report reads as ‘Denier van der Gon, H., Jozwicka, M., Hendriks, E, Gondwe, M, Schaap M. (2010) Mineral Dust as a component of Particulate Matter.’
The complete publication can be downloaded from the website www.pbl.nl. PBL Netherlands Environmental Assessment Agency
PO BOX 303, 3720 AH Bilthoven, The Netherlands; Tel: +31-30-274 274 5;
Fax: +31-30-274 4479; www.pbl.nl/en
Rapport in het kort 5 Atmosferisch fijn stof (PM10) bevat in Europa gemiddeld
5-20% bodemstof. Deze bodemstofdeeltjes kleiner dan 10 micron komen uit verschillende bronnen zoals wind erosie, landbewerking en resuspensie door wegverkeer. Hoewel de bijdrage van bodemstof aan totaal PM10 substantieel is, is de kennis van herkomst en het relatieve belang van de verschillende emissieoorzaken zeer beperkt. In dit rapport wordt met behulp van chemische analyses van fijn stof monsters uit Nederland, waarnemingen uit ons omringende landen en de rest van Europa, alsmede eenvoudige emissiemodules en een regionaal atmosferisch transport model de rol van bodemstof als fijn stof component onderzocht en gekwantificeerd. Het onderzoek levert inzicht in de bijdrage van verschillende processen en locatie afhankelijke bijdrages van bodemstof. De verhoging van het bodemstofgehalte in fijn stof in de stedelijke omgeving is nog niet goed begrepen, evenals de verschillen tussen Nederland en omringende landen. Een belangrijke conclusie van het BOP onderzoek is dat de rol van bodemstof in Nederland beduidend geringer lijkt dan tot nu toe aangenomen.
Rapport in het kort
Rapport in het kort 7
Contents
Rapport in het kort 5
Summary 9
1 Introduction: Particulate matter and mineral dust 11 1.1 Mineral dust 11
1.2 Sources of mineral dust contributing to PM10 11 1.3 Mineral dust as a fraction of total Particulate Matter 13
2 Mineral dust in PM10 in the Netherlands 15 2.1 Estimation of mineral dust 15
2.2 Mineral dust in PM10 in the Netherlands in 2007-2008 16 2.3 Mineral dust in ambient PM10 in the Netherlands in 1998-1999 18
2.4 Comparison between mineral dust contribution to PM10 in 1998-1999 and 2007-2008 20
3 Mineral dust in PM10 in surrounding countries 23 3.1 Belgium 23
3.2 Germany 24
3.3 Comparison with the Dutch data and Conclusions 24
4 Modelling mineral dust over Europe 27 4.1 Emission module for wind-blown dust 27 4.2 Agricultural activities 27
4.3 Resuspension due to road traffic 29 4.4 Road wear 31
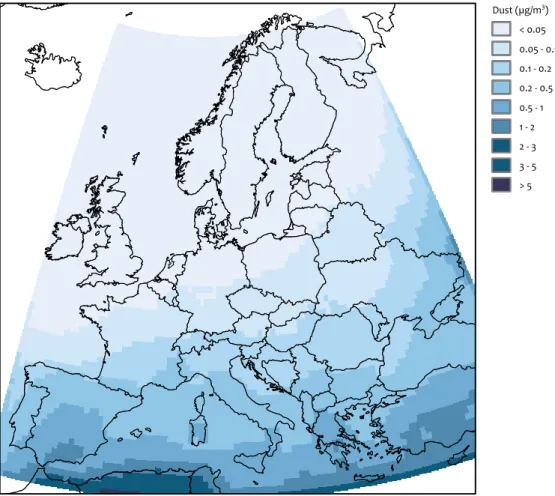
4.5 First results 31
5 Mineral dust in PM10 and PM2.5 in Europe 35
5.1 Compilation of data on Mineral Dust in PM across Europe 35 5.2 Collection of measurement data 36
5.3 Regional contribution of mineral dust to PM10 and PM2.5 36 5.4 Results from literature review 37
5.5 Mineral dust in PM2.5 in European cities 43 5.6 Data for model validation 45
6 Comparison between modelled MD and observational data, for Europe 49 6.1 Seasonal variation 49
6.2 Verification 51
6.3 Comparison with observational data across Europe 53 6.4 Discussion 55
7 Discussion, conclusions and recommendations 57
Annex A Sources of mineral dust contributing to PM10 62 A.1 Wind-blown dust 62
A.2 Agricultural Activities 62 A.3 Construction and Demolition 64 A.4 Handling of Mineral Goods 65 A.5 Road wear 65
A.6 Road gritting and the use of studded tyres 66 A.7 Driving over unpaved roads 66
A.8 Resuspension due to road traffic 67
Annex B On the use of calcium to estimate mineral dust in PM10 68
Annex C Collected observational data for mineral dust across Europe (annex to Chapter 5) 71
Summary 9 Mineral dust (MD), or soil particles, typically make up 5 to 20%
of the mass of ambient PM10. In certain regions and/or under specific meteorological conditions, contribution may even be higher. Mineral dust may originate from distinctly different sources, such as wind erosion of bare soils, agricultural land management, driving on unpaved roads, resuspension of road dust, road wear, handling of materials, and building and construction activities. Despite the importance of mineral dust in total PM10 mass, the sources are still poorly understood and not well represented in emission inventories. This is due to the fact that some sources can be defined as natural sources (e.g., wind erosion) while others, such as resuspension, are not recognised as primary emission sources, but are reemissions of already present particles. Separating the source contributions is difficult, because the unique tracers for mineral dust in PM10 samples (Al, Si, Ti) do not allow a distinction between the various sources of this material. Because of these complications, mineral dust is a big ‘unknown’ in the understanding of ambient PM10. Often, the gap between observed PM concentrations and model-predicted PM concentrations is attributed to ‘mineral dust and other semi-natural sources’ that are not represented in the emission inventories.
To quantify and understand the role of mineral dust as a PM source, a combination is needed of flux measurements, emission estimates, chemical analyses of sampled ambient PM10 and atmospheric transport modelling. This report works towards a methodology to elucidate the role of mineral dust; 1. During 2007 and 2008, samples of ambient PM10 and PM2.5,
collected at various types of locations in the Netherlands, were analysed for chemical composition. Based on the aluminium and silica content in these samples, an approximation was made of the amount of mineral dust in ambient PM10.
2. The thus estimated mineral dust contribution was compared with observations from neighbouring countries (Belgium, Germany) and with results from a similar campaign in the Netherlands, which was held 10 years earlier.
3. A European-wide literature survey and data collection activity was initiated to construct a database on mineral dust in PM10 across Europe.
4. Simple and therefore transparent emission functions were combined with activity data or land-use maps to make emission grids. The gridded emissions were then used as input for the LOTOS-EUROS model to calculate the resulting concentrations.
5. The predicted concentrations were compared with observations in various parts of Europe, derived from the literature survey.
6. A first correction of the emission functions was made to improve the match between modelled and observed concentrations.
The various steps outlined above, together, form a coherent approach, but are described individually in this report. Our understanding and representation of mineral dust in the air quality model is not yet complete. Further iteration, by comparing observed and modelled values, would be needed. However, from the work done so far, some important conclusions could be drawn.
Based on the chemical speciation data that were collected at six locations in the Netherlands, as part of the BOP programme, the contribution of mineral dust to PM10 in the Netherlands, in the 2007-2008 period, is estimated at no more than ~ 1.5 µg/m3. This is significantly lower than previously observed for 1998 and 1999 by Visser et al. (2001), and, more recently, for 2006, in Flanders, Belgium (VMM, 2009). In the neighbouring German province of North Rhine-Westphalia, data were collected by Quass et al. (2009) in a partly overlapping period with the BOP campaign. Again, the mineral dust estimates were higher than observed in the BOP campaign, but the gap between them was smaller. This discrepancy between estimates for neighbouring locations, as well as different years, showed that substantial variations in mineral dust contributions may exist. Unfortunately, chemical speciation of PM, including mineral dust tracers, is only obtained in specific campaigns and no good record for temporal variation is available. It is concluded that this variation in mineral dust is not yet fully understood and calls for a more in-depth comparison and collaboration between the research groups or agencies in the different countries. The amount of mineral dust observed in PM10 during the BOP campaign in the 2007-2008 period showed an increase in MD in the urban environment and at traffic locations. This is consistent with the increase in MD across the European urban environment, as deduced from the compilation of European data. However, in the BOP data, the increment in MD from rural background to traffic locations was ~40 to 50%, whereas in a large number of European studies, MD in PM10 in urban or traffic locations was found to be roughly doubled. After verification it was concluded that the BOP data had correctly captured the increment at urban/traffic locations,
Summary
with the surprising observation that this increase was not proportionally reflected in the mineral dust concentrations. This observation is quite remarkable, as it is contrary to the average observational data available on Europe, and contrary to what was expected for the Netherlands, based on the previous source apportionment study by Visser et al. (2001). European data were compiled to estimate MD in PM10 for 19 European countries, often from more than one location per country. The compilation showed that MD in PM10 in urban centres ranged between 3 and 13 µg/m3 (with a few outliers), confirming the importance of MD in PM10. Mineral dust in PM10 in the Netherlands appeared to be relatively low, compared to southern and northern Europe. These regions experience higher MD concentration levels due to a dryer climate (southern Europe) or the use of studded tires and road gritting in wintertime (northern Europe). In the context of this study, the Netherlands would rank with countries such as Belgium, Germany, and the United Kingdom.
To be able to model mineral dust in PM10, specific modules have been developed for estimating MD emissions from wind-blown dust, agricultural land management and resuspension. These modules, or emission grids, have been implemented into the LOTOS-EUROS model. Explicit modelling of MD as a PM component is a novelty in Europe. The compiled European observational data on MD allowed a comparison with model-predicted MD and observed concentrations. This comparison was rather crude, since the observational data did not necessarily come from the same year or period that was covered by the model runs. However, the comparison did support some first modifications, which resulted in a better match between modelled and observed MD in PM10. Average annual concentrations for a limited number of European rural locations were predicted with remarkable accuracy. However,
a comparison between modelled concentrations and a larger set of observations indicated that current model approaches still underestimate total mineral dust contributions. The most remarkable feature of MD in PM10 remains its increase within the urban environment. Therefore, the importance of urban, inner-city processes for MD emission other than resuspension due to road traffic should be quantified in future studies. The data from the BOP campaign showed that MD in the Netherlands is less important than previously thought. Since some contradiction with comparable, neighbouring countries appears present, the need for further monitoring of mineral dust in PM10 remains – at least until we understand why MD in the Netherlands is less important than elsewhere. Within the BOP project, we have been able to create a database of observational data and to make modules for modelling MD in PM10 with the LOTOS-EUROS model. A tool has been created to investigate the different source contributions, and is expected to enable further understanding by introducing the specific time of occurrence and spatial distribution for each source category. Based on the research done, recommendations for future research are presented.
Netherlands Research Program on Particulate Matter (BOP)
This study is conducted partly under the auspices of the Netherlands Research Program on Particulate Matter (BOP), a national programme on PM10 and PM2.5, funded by the Netherlands Ministry of Housing, Spatial planning and the Environment (VROM). The programme is a framework of cooperation, involving four Dutch institutes: the Energy Research Centre of the Netherlands (ECN), the Netherlands Environmental Assessment Agency (PBL), the Environment and Safety Division of the National Institute for Public Health and the Environment (RIVM) and TNO Built Environment and Geosciences.
The goal of BOP is to reduce uncertainties about particulate matter (PM) and the number of policy dilemmas, which complicate development and implementation of adequate policy measures. Uncertainties concerning health aspects of PM are not explicitly addressed.
The approach for dealing with these objectives is through the integration of mass and composition measurements of PM10 and PM2.5, emission studies and model development. In addition, dedicated measurement campaigns have been conducted to research specific PM topics.
The results of the BOP research programme are published in a special series of reports. The subjects in this series, in general terms, are: sea salt, mineral dust (this report), secondary inorganic aerosol, elemental and organic carbon (EC/OC), and mass closure and source apportionment. Some BOP reports concern specific PM topics: shipping emis-sions, PM trend, urban background, EC/OC emissions from traffic, and attainability of PM2.5 standards. Technical details of the research programme are condensed in two background documents; one on measurements and one on model developments. In addition, all results are combined in a special summary for policy makers.
Introduction: Particulate matter and mineral dust 11 Particulate matter (PM) or aerosol is the generic term used
for a type of air pollution that consists of complex and varying mixtures of particles suspended in the atmosphere. PM has been found to present a serious danger to human health. PM loadings in the Netherlands are relatively high, compared to other regions of Europe. Hence, there is a clear need to investigate the origin and source contributions for ambient PM in the Netherlands. An atmospheric transport model can be used to couple emissions of PM to observed PM concentrations. In the case of particulate matter, the modelled PM10 concentration (all particles < 10 µm) is the sum of the concentration of individual chemical species for which a source is defined in the model. Since most models do not include all PM sources and species, simulated concentrations are underestimated (by ~40-50%) compared to observed values (Schaap et al., 2008). The non-modelled fraction of PM is often comprised of sea salt, mineral dust, secondary organic material and water. Within the BOP project, we aim to have a better understanding of the sources of aerosols in the Netherlands and greater Europe; the chemical composition of the aerosols, their concentrations, spatial distribution, temporal trends and ranking of importance. The current report focuses on suspended mineral dust (also called crustal material or soil dust) as it may contribute significantly to the total aerosol loading. Furthermore, mineral dust is thought to contribute significantly to the ‘non-modelled’ fraction of PM in the Netherlands (MNP, 2005). The majority of this so-called non-modelled fraction is grouped under ‘soil dust and other’, which is thought to be responsible for ~ 40% of the total ambient PM10 concentration in the Netherlands (MNP, 2005). This is more than two times the contribution from Dutch anthropogenic sources which contribute ~ 15% to ambient PM in the Netherlands (MNP, 2005). From these crude figures it becomes evident that uncertainty in the non-modelled fraction obscures the impact that policy measures can have on ambient PM concentrations, especially since it is unknown to what extent the category ‘soil dust and other’ varies between years or is influenced by measures. Therefore, one of the main ambitions of the BOP programme is to reduce the importance of the non-modelled fraction by explicitly adding (semi-)natural sources of PM, such as sea salt and soil dust to the predictive model. This can be done through source functions in the model that are driven, for instance, by meteorology or by providing gridded emissions as model input.
To achieve this ambition, a predefined strategy was followed (Figure 1-1). Because of encountered difficulties, the way towards a validated representation of mineral dust in the modelling of PM was adjusted several times, however, the outline given in Figure 1-1 remains valid.
1.1 Mineral dust
Particulate pollution comes from such diverse sources as power plants, engine exhausts, wood burning, mining, and agriculture. Because of the variation in sources, airborne PM includes many different chemical constituents. PM10 samples collected on a filter can be analysed for chemical composition. Sources contributing to PM10 concentrations may emit particles with a unique chemical composition that are enriched in certain elements.,. For example, vanadium and nickel have typically been used as tracers for emissions from heavy fuel-oil combustion. Similar tracers exist for mineral dust. Mineral Dust (MD), also called crustal material or soil dust, refers to atmospheric aerosols originating from minerals in soil or the earth’s crust. It is mainly composed of oxides (such as SiO2, Al2O3, FeO, Fe2O3, CaO1) and carbonates (such as CaCO3, MgCO3) (Figure 1-2). Of all the different other elements oxygen is present as oxide and is never directly measured in PM samples. Therefore, the dominant elements that can be used to quantify mineral dust contributions are silicon and aluminium (Figure 1-2). However, also calcium (Ca) and iron (Fe) are frequently used to estimate the mineral dust contribution to PM. The use of tracers for estimating mineral dust contributions is further discussed in Chapter 2.
1.2 Sources of mineral dust contributing to PM
10Mineral dust may originate from distinctly varying sources. Dust aerosol particles produced by wind erosion in arid and semi-arid regions significantly affect climate and air quality, but the magnitude of these effects is largely unquantified. Major dust source regions include the Sahara, and the Arabian and Asian deserts. Global annual dust emissions are currently 1 SiO2=silicon dioxide or quartz or sand; Al2O3=aluminium oxide,
FeO=ferrous oxide; Fe2O3=ferric oxide, CaO=calcium oxide or lime;
CaCO3=calcium carbonate; MgCO3=magnesium carbonate.
Introduction: Particulate
estimated to range between 1000 and 3000 Mt/yr (Tegen and Schepanski, 2009). Next to wind erosion, which is partly anthropogenic because of human-induced desertification, various other human activities may cause mineral dust to enter the atmosphere. Despite the importance of mineral dust in total PM10 mass, the sources are still poorly understood..
On the global scale, mineral dust emissions are dominated by desert dust. However, in Europe, other sources dominate mineral dust contributions. The sources are (see also Figure 1) :
Wind-blown dust Agricultural activities Construction and demolition Handling of mineral goods
Road wear
Road gritting and use of studded tyres Driving over unpaved roads
Resuspension due to road traffic
Several of these sources, such as road gritting and the use of studded tyres, have a distinct regional pattern. The sources are discussed in detail in Appendix 1 and partly in Chapter 4, where source functions are introduced that are incorporated in the LOTOS-EUROS model to facilitate the modelling of mineral dust < 10 µm.
Strategy to understand and define the contribution and distribution of mineral dust (MD) in PM10 and PM2.5 across Europe and the Netherlands.
Figure 1.1 Strategy to understand and define the contribution and distribution of mineral dust
Emissions
National / sectoral totals Spatially distributed
Model Input
gridded map and/or module coupled to meteo data)
Model output
Concentration maps / Relative share crustal material
to total PM10
Measurements / observations
Concentration of crustal PM10 in ambient air annual average as well as specific episodes
Source functions / emission factors / modules for crustal material sources
- Resuspension - Road wear
- wind erosion agricultural fields - Wind erosion natural areas - Management agricultural fields - Storage and handling of goods - Construction and demolition activities
Iteration to test source strengths, test meteorological dependencies Adjust according to insights, constrain emission strengths
The average composition of the earth’s crust in weight percentages of the eight most abundant elements (Source: Strahler and Strahler, 1992).
Figure 1.2 O xyg en Si lic on A lu mi nu m Ir on Ca lc iu m So di um Po ta ss iu m M ag ne si um 0 10 20 30 40
50 percentage by weight Elements
The average composition of the Earth's crust
47 28 8.1 5.0 3.6 2.8 2.6 2.1
}
}
}
75% Metals BasesIntroduction: Particulate matter and mineral dust 13
1.3 Mineral dust as a fraction of total Particulate Matter
Based on the concentrations of tracers, such as Si, Al and Ca, the total amount of mineral dust in ambient PM10 can be estimated. In Europe, mineral dust or soil particles typically contribute 5 to 20% to ambient PM10 mass (Table 1-1 ). In certain regions and under specific meteorological conditions contributions may be higher. Examples of such region-specific conditions are the use of studded tires in Nordic countries and the intrusion of Sahara dust into the atmosphere of southern Europe, causing elevated crustal contributions to PM10 (Table 1-1 ). Despite the importance of mineral dust in total PM10 mass, the sources are still poorly understood and not (well) represented in emission inventories or air quality models. However, a better understanding of MD contribution to PM is essential for understanding contributions from various sources to the total PM burden, and because different components of PM may have different health impacts. An estimate of the contribution of mineral dust to PM10 in the Netherlands based on the BOP measurement campaign is described in the next chapter. These results were compared with previous Dutch data (Chapter 2) and with data from neighbouring countries Belgium and Germany (Chapter 3). The modelling of mineral dust in PM10 for Europe starts by making first-order estimates of the various source strengths of mineral dust sources (Figure 1-1). Simple and therefore transparent emission functions are proposed for the processes that are assumed to contribute the most in north-western Europe. These functions are implemented in the LOTOS-EUROS model (Chapter 4). A review of observational European PM10 and derived mineral dust contributions is presented in Chapter 5. The thus obtained European data set is needed to validate the LOTOS-EUROS model . Through the collected data we estimated the share of mineral dust in the total aerosol burden for the Netherlands and Europe. The results from modelling PM concentrations with these new source functions are described in Chapter 6. The final conclusive chapter puts the results in perspective and provides suggestions for further improvements (Chapter 7).
Average annual levels (µgm-3) of PM10, PM
2.5, mineral elements, and the equivalent contributions to bulk
mass concentrations (% wt), recorded at regional background (RB), urban background (UB) and traffic locations (TS) in central Europe (examples from Austria, Germany, Switzerland, the Netherlands, the United Kingdom), northern Europe (13 locations in Sweden) and southern Europe (10 locations in Spain).
Central Europe Northern Europe Southern Europe
RB UB TS RB UB TS RB UB TS PM10 (µgm-3) 14–24 24–38 30–53 8–16 17–23 26–51 14–21 31–42 45–55 Mineral matter (µgm-3) 1–2 3–5 4–8 2–4 7–9 17–36 4–8 8–12 10–18 % Mineral matter PM10 5–10 10–15 12–15 20–30 35–45 65–70 12–40 25–30 25–37 PM2.5 (µgm-3) 12–20 16–30 22–39 7–13 8–15 13–19 12–16 19–25 28–35 Mineral matter (µgm-3) 0.5–2 0.4–2 1–2 1–3 2–4 4–6 1–3 2–5 4–6 % Mineral matter PM2.5 2–8 2–8 5 15–25 25–30 30–40 8–20 10–20 10–15
Source: Querol et al.(2004)
Mineral dust in PM10 in the Netherlands 15 The Netherlands Research Program on Particulate Matter
(BOP) is aimed to reduce gaps in our knowledge on composition, distribution and origin of particulate matter in the Netherlands. In the framework of the BOP programme an intensive, one-year measurement campaign from August 2007 to August 2008 was carried out. During this year, PM10 and PM2.5 was sampled, simultaneously, every other day at five locations. For about half of the sampling days the filters were analysed for PM composition. The results from this campaign for mass closure and source apportionment have been reported by Schaap et al. (2010). Here, we have used the results from this measurement campaign to estimate the contribution of mineral dust to PM10. Furthermore, a comparison was made between previous estimates on the contribution of mineral dust to PM10 in the Netherlands, taken from a measurement campaign in 1998-1999 by Visser et al. (2001).
2.1 Estimation of mineral dust
A number of elements are known to be present in mineral dust, the most important being Si, Al, Ca, K, Fe and Ti (Figure 1-2). Strong correlations between these elements in PM samples suggest they originate from the same source. Clay minerals in soil and rock have complex alumino-silicate structures (feldspars) and although measuring the aluminium and silicon content is relatively straightforward, the associated oxygen has to be estimated indirectly by assuming a certain oxidation state. So, elemental weight alone is not enough, but requires a correction for the oxidised form (e.g., Si is mostly present as SiO2) to estimate total contribution of mineral dust to PM10. Apart from Si and Al minerals, all kinds of other minerals may be present but contribute much less to total mineral dust, with the exception of areas dominated by calcareous soils where carbonates, such as CaCO3, may be important. Since chemical analysis often provides all relevant elements, it is potentially possible to account for all elements present in mineral dust. After correction for the oxidation status this would then result in total MD mass. However, there are two major points of caution. First, a particular element may also (partly) originate from other sources, for example, Fe from wear of metal machinery, brakes and the iron and steel industry. For K, wood combustion and fertiliser manufacturing and
application may contribute significantly. Assigning all mass to mineral dust could thus result in overestimation. Therefore, such elements are less suited to be used as tracers and their respective mass contribution needs to be estimated from the ratio to, for example, Si and Al in soil material. Second, some elements are really trace elements in soil material hence the low concentrations are may be close to detection limits introducing considerable uncertainty in the final estimate. Both points can be practically solved by focusing on the two most abundant elements (Si and Al) which are hardly present in PM from other sources. Nevertheless, a check on correlation between Si and Al is still crucial to confirm that both elements are most likely to originate from the same source. A further confirmation can be obtained for relatively high MD samples to also check for correlation with the trace element Ti, because in high MD samples the trace element is also accurately determined. A formula [3.1] was derived by Denier van der Gon et al., 2007; 2008), based on the chemical composition of the fine fraction of Dutch top soils to calculate the contribution of mineral dust (MD) by using concentrations of Al and Si. The formula includes the average mass from other non-Al and non-Si minerals, and is used to estimate MD in PM10 from the chemical analysis of PM10 samples in the BOP programme.
Mass MD = 0.49*[Si] + (2.36*[Si]+2.70*[Al]) [2.1] 2.1.1 Calcium as a tracer for mineral dust in PM10
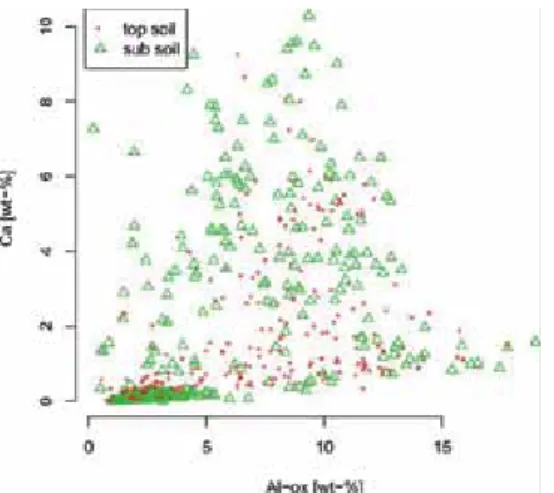
As an alternative for silicon and aluminium, calcium (Ca) is often used as a tracer for mineral dust. The main reason being that Ca is more often analysed in samples, is abundant in soils, and in PM samples often correlates well with Si and Al. Indeed, calcium is commonly present in soil, but in varying concentrations. For the Netherlands, the average Ca content in soil is 2 to 3% (Spijker et al., 2008). For top soil, which is the most likely source of mineral dust entrainment into the atmosphere, there is no relation between aluminium (or silicon) content and calcium (Figure 2-1). The suitability of Ca as a tracer for mineral dust is further discussed in Annex 2, which mainly concludes that Ca often correlates with mineral dust content, but does not have a fixed correlation with Al and Si in soils. Hence, estimating soil dust in PM10 can be done by using empirically derived relationships between total soil dust and Ca concentration in PM10, but not by using the average Ca content of soils. The last would imply
Mineral dust in PM
10
multiplication of the Ca concentration in PM10 by a factor of 20 to 50 (based on a 2-3% Ca content in soils), resulting in unrealistic or even impossible shares of soil dust to total PM. The empirical factors are more in the order of a factor 7, implying that Ca is significantly enriched by other sources than by soil material, for example, calcareous materials and concrete. Therefore, tracers of choice for mineral dust in the present study were Si and Al, together with further consistency checks using, for example, Ti and Ca.
2.2 Mineral dust in PM
10in the
Netherlands in 2007-2008
In the BOP programme, a chemical analysis of PM10 samples collected over one year (2007-2008) was carried out to determine their chemical composition. For a detailed description of the methodology we refer to van Arkel et
al. (2009) and Schaap et al. (2010). Based on the collected chemical data, we gathered information on the MD contribution to ambient PM10. First, the correlation between the known tracer elements for MD was investigated (Figure 2-2). Even for the rural background locations the correlation for Fe and Ca with Si shows considerable scatter, suggesting that the elements did not necessarily originate from the same source. The correlation between Al, Ti and Si was very good (r2 = 0.96). This supports the approach discussed earlier in this chapter, which considers that Al and Si are most reliable for estimating MD. Furthermore, the correlation between Al and Si for three different types of locations showed a consistent pattern (Figure 2-3). For comparison, the trend line from Figure 2-2 has also been presented in Figure 2-3. Only three outliers could be identified for the urban background location, the other ~500 data points showed a high correlation between Al and Si, consistent with the elements present in rather fixed ratios in soil material.
The relationship between calcium and aluminium in Dutch top soils and subsoils (Van der Veer; 2006; Spijker et al., 2008).
Figure 2.1 The relationship between Calcium and Aluminium in Dutch top soils and subsoils
Al, Ca, Fe and Ti as a function of Si in PM10 for three rural locations in the Netherlands in 2007-2008.
Figure 2.2 0 1 2 3 Si in PM10 (µg/m3) uncorrected 0.0 0.2 0.4 0.6 0.8 1.0 1.2 1.4 1.6 1.8 Al,Ca, Fe (µg/m 3 ) uncorrected Al Fe Ti Ca Linear Al
Al, Ca, Fe and Ti as a function of Si in PM10 for three rural stations in the Netherlands
y = 0.56x R2 = 0.96 Ti (µg/m3 ) uncorrected 0.000 0.005 0.010 0.015 0.020 0.025 0.030 0.035 0.040 0.045 0.050
Mineral dust in PM10 in the Netherlands 17 Unfortunately, a complication in quantification of the MD
component in the PM10 samples was the recovery of elements with the chosen destruction and analysis techniques. Van Arkel et al. (2009) have reported recoveries for silicon and aluminium of 50 and 70%, respectively. As shown in Figure 2-2 and Figure 2-3, the ratio between both elements is well-defined and remains intact from high to low concentrations and across different locations. Therefore, it is our conclusion that a simple across-the-board correction for the recovery is allowed. This correction was also applied to the same samples by Schaap et al. (2010) to achieve mass closure. The MD contribution to PM10, estimated by inserting the observed Al and Si concentrations (with and without recovery correction) in Equation 2.1 is presented in Table 2‑1
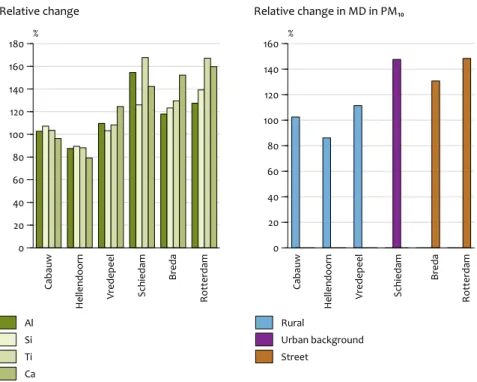
The data show an increase in MD in PM10 in the urban background and traffic locations, compared to those in the rural background. The change in the most important tracer elements for MD, compared to the Dutch rural background locations (an average of results from Cabouw, Hellendoorn and Vredepeel) is presented in Figure 2-4. Although variation existed for the different elements, also between the rural locations, all elements showed an increase in traffic and urban background locations. Overall can be seen that, compared to the average rural background in the Netherlands, MD is ~ 45% elevated in urban background and traffic locations (Figure 2-4, right). This suggests that urban sources made an
important contribution to the observed MD in PM10, in line with observations elsewhere (see Table 1-1 and e.g., Querol
et al., 2004; Putaud et al., 2004) . The most likely explanations for this increase are resuspension caused by road traffic and construction and demolition activities within the city. In line with observations elsewhere, the concentration of mineral dust in PM10 varied over time (Figure 2-5). Although average observed concentrations were between 1 and 2.5 µg/ m3, during certain episodes the concentrations could go up to 5 to 10 µg/m3
Al in PM10 as a function of Si content for rural background, urban background and traffic locations included in the BOP programme in 2007 to 2008. Figure 2.3 Urban background 0.0 0.5 1.0 1.5 2.0 2.5 3.0 3.5 4.0 4.5 0.0 0.5 1.0 1.5 2.0 2.5 3.0 Traffic Rural background Si in PM10 (µg/m 3 ) uncorrected Al (µg/m3) uncorrected y = 0.56x R² = 0.96
Al as a function of Si in PM10 for rural background, urban background and street locations
Estimated mineral dust in PM10 in 2007-2008 for 5 Dutch locations
Location type MD_uncorrected MD_correcteda)
µg/m3 µg/m3
Cabauw rural 0.80 1.45
Hellendoorn rural 0.65 1.18
Vredepeel rural 0.87 1.57
Schiedam urban background 1.26 2.25
Breda traffic 1.06 1.92
Rotterdam traffic 1.11 2.01
a) Correction implies that the Si and Al concentrations have been adjusted for a 50 and 70% recovery in the chemical analysis (see
Van Arkel et al., 2009; Schaap et al., 2010).
2.3 Mineral dust in ambient PM
10in the
Netherlands in 1998-1999
The current BOP programme is not the first to investigate the chemical composition of airborne PM in the Netherlands. Samples of the fine fraction (PM2.5) and the coarse fraction (PM2.5-10) were collected from six locations in the Netherlands by Visser et al. (2001) during one year in 1998-1999. The samples were analysed for chemical composition; for a description of the measurement procedures and analytical specifications, we refer to Visser et al. (2001). In keeping with the data from the current BOP programme (Figure 2-2 and
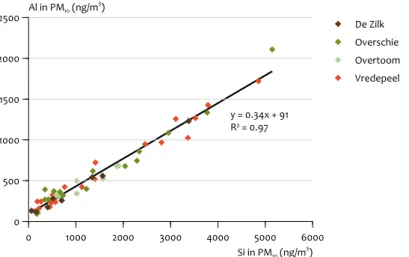
Figure 2-3), the data from Visser et al. (2001) show a strong correlation between Al and Si (Figure 2-6), indicating that Al and Si indeed are most likely to have the same origin. The number of days analysed in the study of Visser et al. (2001) with a complete elemental analysis of PM is rather limited. To bypass the problem of limited data availability, the strong correlation between Al and Si in the available data (Figure 2-6) was used to calculate soil material on the basis of Si alone, when no Al data were available (Denier van der Gon et
al., 2007) . The average concentration of MD in PM10 for the Netherlands in 1998-1999 was estimated at between ~2.5 µg/ m3 at the coast to ~ 5.5 µg/m3 at inland locations (Table 2-2). Relative presence of the tracer elements Al, Si, Ti and Ca (left) and estimated mineral dust in PM10, (average of rural
background taken from locations at Cabouw, Hellendoorn, Vredepeel = 100%).
Figure 2.4 Ca ba uw H el le nd oo rn Vr ed ep ee l Sc hi ed am Br ed a R ot te rd am Ca ba uw H el le nd oo rn Vr ed ep ee l Sc hi ed am Br ed a R ot te rd am 0 20 40 60 80 100 120 140 160 180 % Al Si Ti Ca Relative change
Relative change of tracer elements and the estimated mineral dust in PM10
0 20 40 60 80 100 120 140 160 Relative change in MD in PM₁₀ Rural Urban background Street %
Concentration of mineral dust in PM10 at a traffic and a rural background location in 2007-2008, over time.
Figure 2.5
12-sep-2007 9-dec-2007 8-mrt-2008 4-jun-2008 30-aug-2008 0 1 2 3 4 5 6 7 8 9 µg/m 3 Rotterdam traffic Vredepeel rural background Moving average Vredepeel
Mineral dust in PM10 in the Netherlands 19 Denier van der Gon et al. (2007) investigated the variation
of the MD concentration with wind direction for the data from Visser et al. (2001. The samples were split into those measured while the wind direction brought air masses from the sea or from the continent (Table 2-3). Air masses with a more continental/land origin show an elevated mineral dust component, compared to air masses coming from the sea (2.9 vs 1.8 µg/m3 for De Zilk and 8.6 vs 3.0 µg/m3 for Vredepeel). This may help us to identify source regions, using trajectories in the models for particular days with elevated concentrations, and to investigate the possible dependency on meteorological conditions.
2.3.1 Size fractionation of mineral dust in PM10
An important model feature, needed to predict the contribution of particulate emissions to ambient concentrations, is the size fractionation. The smaller size fractions are transported over longer distances and have a longer lifetime because of a slower deposition rate. The starting point, based on averaging observational data with chemical speciation in PM2.5 and PM10. was that 20% of MD is
contained in the fine fraction (PM2.5) of PM10. This assumption can be checked and refined by taking a closer look at individual observational data for a particular location (instead of looking at the overall average).
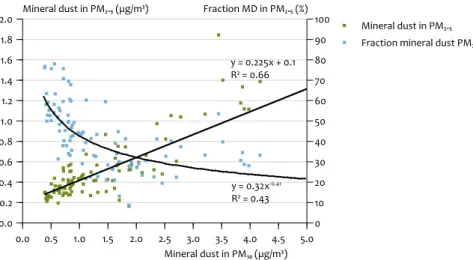
As expected, the absolute amount of crustal PM2.5 increases when the amount of crustal PM10 increases (Figure 2-7). However, the fraction of PM2.5 in PM10 is not constant. When total MD in PM10 increases, the fraction of PM2.5 decreases (Figure 2-7). A similar pattern was observed previously by Denier van der Gon etal. (2007) in the data available for 1998-1999 (Figure 2-8). When MD in PM10 is less than 0.5 µg/m3, the fraction PM2.5 may be as high as 40 to 80%, but when amounts of MD in PM10 become substantial, for example, >2 µg/m3, the fraction of MD in PM2.5 drops to ~20% (Figure 2-7). When higher contributions of MD to PM10 are observed (e.g., > 7 µg/ m3) it drops further to ~ 10% (Figure 2-8). This pattern can be understood from the notion that if nearby sources dominate MD in PM10, it is mostly in the coarse fraction, in contrast to MD being added from long-range transport – which is dominated by smaller particles. So, the more substantial the
Aluminium (Al) concentration as a function of silicon (Si) in PM10 at four locations in the Netherlands (based on data from Visser et al., 2001).
Figure 2.6 Vredepeel De Zilk Overtoom 0 1000 2000 3000 4000 5000 6000 Si in PM10 (ng/m 3 ) 0 500 1000 1500 2000 2500 Al in PM10 (ng/m 3) Overschie
Al as a function of Si in PM10 at four locations in the Netherlands
y = 0.34x + 91 R² = 0.97
Average annual contribution of MD to ambient PM10 concentrations at four locations
Location De Zilk Vredepeel Overschie Overtoom
method MD_alt MD_alt MD_alt MD_alt
No. of observations 31 45 42 49
Average (ug/m3) 2.4 5.4 5.0 3.3
Stdev 2.5 4.7 3.9 2.2
MD_alt = similar to MD eq[1], except for the fact that for the latter missing Al data are estimated based on the Al to Si correlation (Figure 2-6)
Table 2.2
Mineral dust contribution to PM10 at De Zilk and Vredepeel at different wind directions
De Zilk Vredepeel
All Continental Sea All Continental Sea
Wind direction 0-360 (0-180) (180-360) 0-360 (0-180, 315-360) (180-315)
Observations 31 18 13 45 19 26
Average (ug/m3) 2.4 2.9 1.8 5.4 8.6 3.0
Stdev 2.5 3.1 1.4 4.7 4.8 2.9
MD contribution to PM10, the less relevant the PM2.5 fraction. The linear relationship between MD in PM2.5 and PM10 shown in Figure 2-7 suggests that, overall, 22.5% of MD is in the fine fraction. From this we concluded that, in general, a generic fraction of 20% of MD in PM2.5 would be a good estimate. Occurrences of strongly elevated MD contributions to PM10 will have been caused by relatively nearby sources. In such cases, the fine fraction does not increase proportionally and will be relatively unsubstantial. This observation may be relevant to a proper assessment of the health impact of such occurrences.
2.4 Comparison between mineral dust contribution
to PM
10in 1998-1999 and 2007-2008
In addition to the BOP data set for 2007-2008, an ambient PM data set with chemical speciation is available for 1998-1999 (Visser etal., 2001). The patterns in both data sets are similar; they show a good correlation between elements that can
be used as a tracer for mineral dust (Al, Si, Ti), a decreasing fraction of MD_2.5 when the absolute contribution of MD to PM10 increases, and an elevated MD concentration in PM in urban and traffic locations compared to those in the rural background. However, there are also some remarkable differences. Most notable is the difference in absolute concentration levels of MD in PM10. The amount of mineral dust observed in PM10 during the BOP campaign in 2007-2008 was significantly lower (by about a factor of 2 to 3) than estimated when using data from Visser etal. (2001) for the 1998-1999 period. Although the locations in both studies were not exactly the same, this difference was also observed for overlapping locations, such as Vredepeel, which was included in both data sets. If conditions at specific locations are not the explanation for this discrepancy, then it could be due to 1) the meteorology in both 1998 and 1999 causing higher emissions of MD, 2) differences in analytical techniques and sampling, 3) changes in MD source strengths, or 4) a combination of these three possibilities.
Mineral dust in PM10 and PM2.5, and the fraction of PM2.5 in mineral dust PM10, at a Dutch background location, in 2007-2008. Figure 2.7 0.0 0.5 1.0 1.5 2.0 2.5 3.0 3.5 4.0 4.5 5.0 Mineral dust in PM₁₀ (µg/m³) 0 10 20 30 40 50 60 70 80 90 100 Fraction MD in PM₂.₅ (%) Mineral dust in PM₂.₅ (µg/m³) Mineral dust in PM₂.₅ Fraction mineral dust PM₂.₅
Mineral dust in PM₁₀, in PM₂.₅ and the fraction of PM₂.₅ in mineral dust PM₁₀ for a Dutch background station
0.0 0.2 0.4 0.6 0.8 1.0 1.2 1.4 1.6 1.8 2.0 y = 0.225x + 0.1 R² = 0.66 y = 0.32x-0.41 R² = 0.43
The fraction of PM2.5 in crustal PM10, at two Dutch background locations, in 1998-1999.
Figure 2.8 The fraction of PM₂.₅ in mineral dust PM₁₀ for two Dutch background stations
y = 5.9x-0.46 R2 = 0.63 0% 10% 20% 30% 40% 50% 60% 70% 80% 90% 100% 0 5 10 15 20 25 Vredepeel De Zilk Overschie Power (Overschie) Mineral Dust PM¹⁰ (µg/m³) Fraction in PM ₂.₅
Mineral dust in PM10 in the Netherlands 21 It is unlikely that we will learn the exact cause of this
difference, for example, because an intercomparison of samples is no longer possible. Before trying to further understand the cause of these different MD levels in PM10, we first made a comparison with available data for neighbouring countries. Especially in Belgium and in German provinces bordering on the Netherlands we would expect similar contributions of mineral dust to PM10, as this would not originate from a local source, but from one with a more regional character and influenced by regional climate, meteorology and soil types.
Mineral dust in PM10 in surrounding countries 23 Data on ambient PM10 and/or PM2.5 with full chemical
speciation are scarce. Therefore, it is almost impossible to obtain a data set for a large geographical domain (such as north-western Europe) which covers the same period in time. Having such a data set is desirable because it would reduce the uncertainty introduced by different meteorological conditions and wind directions. Chemically speciated PM data are available for border provinces in Belgium (Flanders) and Germany (North Rhine-Westphalia). The Belgian data have no time overlap with the Dutch BOP data, but for the data from North Rhine-Westphalia a period of overlap exists. The data from both countries are briefly described in this chapter.
3.1 Belgium
From September 2006 to September 2007 chemical characterisation of PM10 was carried out by the Chemkar
PM10project at six measuring locations in Flanders (Belgium). Flanders is the part of Belgium that borders on the Netherlands and is in many ways comparable to the Netherlands. Therefore, the results are relevant for
comparison with and interpretation of the Dutch data obtained in the BOP programme. For a detailed description of the methodology and results from the Chemkar project we refer to (VMM, 2009). The VMM chose their monitoring locations in such a way as to obtain a reasonable spread in location and variety in type of location. The six locations were Houtem (rural background), Zelzate (industrial), Mechelen (suburban), Borgerhout (urban background), Aarschot (rural background) and Hasselt (suburban). The results from the Chemkar project indicated that the share of mineral dust in Flanders varies from 2.2 to 6.2 µg/m3 (Figure 3-1). The average contribution for all locations was 14%, but for some this went up to ~18% (Zelzate, Borgerhout). In the case of Zelzate, a specific industrial activity may have caused the elevated levels of mineral dust in PM10 (VMM, 2009).
The elevated share of mineral dust at Borgerhout was clearly associated with road traffic. This can be deduced from Figure 3-1 by looking at the increase in elemental carbon (EC) in PM10 at Borgerhout; EC is a known indicator of (diesel) traffic.. Moreover, the detailed chemical analysis presented in VMM (2009) showed that, at this location, Cu was also elevated. Cu
Mineral dust in PM
10
in
surrounding countries
3
Average share of major components in PM10 at six locations in Flanders (VMM, 2009).
Figure 3.1 H ou te m Ze lz at e M ec he le n Bo rg er ho ut A ar sc ho t H as se lt A ll lo ca tio ns 0 5 10 15 20 25 30 35 40 Unknown Mineral dust Non sea salt SO4
NH4
NO3
Sea salt OM EC
Average share of major component in PM10 for six stations in Flanders
is a good indicator of brake wear and hence of traffic (Denier van der Gon etal., 2007). Furthermore, the contribution of MD at location Borgerhout is a factor of ~2 higher than at the rural background locations Houtem and Aaeschot. Therefore, we concluded that the enhanced mineral dust which was found in PM10 at traffic locations in Flanders, suggests that resuspension of PM caused by road traffic largely explains the observed elevation. At the industrial location of Zelzate, the increase in mineral dust may have been due to a specific industrial process, but also (partly) was associated with resuspension, since heavy-duty trucks have a much higher resuspension emission factor than passenger vehicles (Denier van der Gon etal., 2008).
3.2 Germany
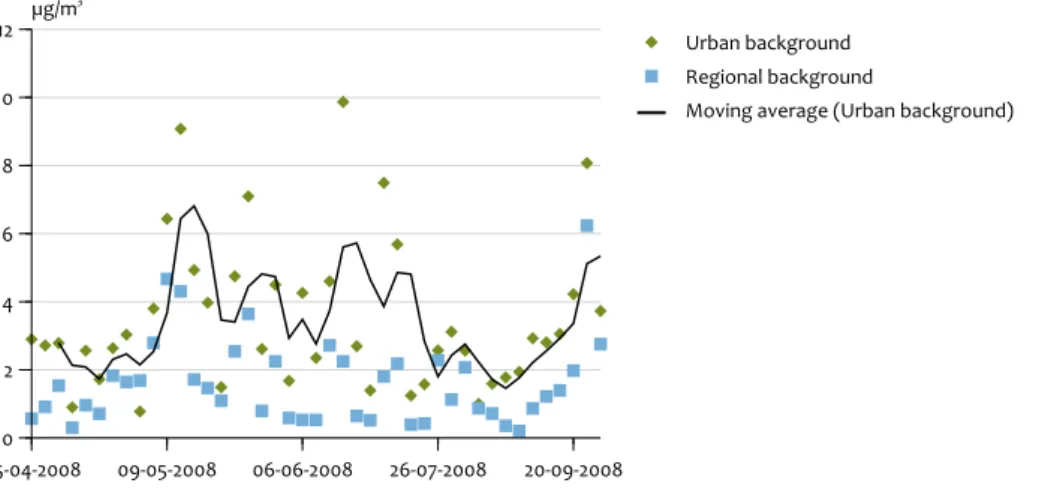
North Rhine-Westphalia is situated in the western part of Germany and shares borders with Belgium in the south-west and the Netherlands in the west and northwest. Recently, the unit ‘Air Quality & Sustainable Nanotechnology’ of the German Institute of Energy and Environmental Technology (IUTA) executed a one-year measurement programme, from April 2008 to March 2009, to investigate the chemical composition of PM in North Rhine-Westphalia (Quass etal., 2009). The IUTA kindly provided the data that they collected during the overlapping period (April to Sept. 08) with the BOP programme. The Si and Al data from Quass etal. (2009) showed a good correlation, both for the rural and urban background locations (Figure 3-2), confirming that these elements mostly originate from the same type of material and/or the same source. Since we had access to the original data, we could analyse these data in the same way as the BOP data in Chapter 2. The average contribution of MD to PM10 over the period from April 2008 to March 2009 was 3.5 µg/ m3 for the urban background locations and 1.6 µg/m3 for the rural background locations. The pattern of the mineral dust concentration in PM10 over time (Figure 3-3) showed a similar pattern as that of the Dutch BOP data in Figure 2-5, with episodes of clearly elevated MD levels.
3.3 Comparison with the Dutch data and Conclusions
In the Flemish data, the contribution of mineral dust was higher than in the BOP data for 2001 to 2008. However, the sampling periods did not overlap. The sampling period of the North Rhine-Westphalia data partly overlapped and, although contributions were higher, they were closer to the BOP data. It is, therefore, not unlikelly that the sampling period played a role, although this could not fully explain the discrepancy in the data. The amount of mineral dust observed in PM10 during the BOP campaign in 2007-2008 confirmed the increase in MD in the urban environment and at traffic locations. However, the relative increase as derived from the tracer elements was significantly lower than observed in Flanders (VMM, 2009), North Rhine-Westphalia (Quass etal., 2009) and earlier in the Netherlands (Visser etal., 2001). To further investigate this apparent contradiction, we plotted the coarse fraction of PM10 (PM2.5-10 or PMc) that was measured during the BOP campaign, as a function of the type of location and the MD in the PMc fraction (Figure 3-4, left). Note that this was not feasible for the traffic location of Breda, as no PM 2.5 was monitored at this location. The PMc fraction at the urban background and traffic locations was more than double that of the rural background location. This is consistent with urban activities, such as road traffic, which is an important source of coarse PM, and the more general findings in neighbouring countries. However, Figure 3-4 also clearly illustrates that during the BOP campaign MD was only a minor fraction of the PMc. This is remarkable and contrary to the average observational data available for Europe (see also Chapter 5). Moreover, not only was this a small fraction, but also the relative increase at locations from rural to urban background and traffic, was considerably higher for total PMc than for MD in this fraction (Figure 3-4, right). For a discussion on the complete composition of PMc and mass closure we refer to Schaap et al. (2010).Is it possible that the BOP campaign did not properly capture the increase in road traffic, for example, because of a sampling artefact? No, this is not likely. Although the
Si and Al concentrations in PM10 for an urban and a rural background location in North Rhine-Westphalia (Data from Quass et al., 2009). Figure 3.2 0.0 0.5 1.0 1.5 2.0 2.5 3.0 Al (µg/m3 ) 0 1 2 3 4 5 6 7 8 Urban background Regional background Si (µg/m y = 2.56x + 0.39 R² = 0.74 3) Si and Al concentration in PM₁₀
Mineral dust in PM10 in surrounding countries 25 MD contribution was smaller than expected, the Al and Si
analysis was very consistent (Figure 2-2, Figure 2-3). To further check the capturing of increments at traffic locations, we investigated the copper concentration in the PM fractions for the different locations (Figure 3-5). Copper is a reliable tracer for brake wear (Denier van der Gon etal., 2007). The increase observed at traffic locations clearly illustrates that the traffic
was accurately characterised in the BOP chemical analysis data and, therefore, in the sampling. The increase in copper in the coarse fraction of PM10 was exactly in line with data for the Netherlands and Switzerland, reported earlier by Denier van der Gon etal. (2007). Hence, as there was no reason to attribute the relatively low MD share to a sampling artefact, we concluded that PMc played an important role at traffic
Estimated mineral dust in PM10 in North Rhine-Westphalia in 2008-2009, based on data from Quass et al. (2009).
Figure 3.3 05-04-2008 09-05-2008 06-06-2008 26-07-2008 20-09-2008 0 2 4 6 8 10 12 µg/m 3 Urban background Regional background
Moving average (Urban background)
Estimated mineral dust in PM10 in North Rhine-Westphalia
Concentrations of PM2.5-10 (PMc) and MD in PMc as a function of location type (left) and the relative change of PMc and MD in PMc as a function of location type (right).
Figure 3.4 0 2 4 6 8 10 12 µg/m 3 PMc (PM 2.5-10)
Mineral dust corrected in PMc
As a function of station type Relative change
Concentration of PM2.5-10 (PMc) and mineral dust in PMc
Ca ba uw H el le nd oo rn Vr ed ep ee l Sc hi ed am R ot te rd am Ca ba uw H el le nd oo rn Vr ed ep ee l Sc hi ed am R ot te rd am 0 50 100 150 200 250 % Rural background Urban background Traffic Rural background Urban background Traffic
locations, although we do not yet sufficiently understand the processes and sources to effectively mitigate or reduce these concentrations. This lack of understanding is reflected in the lower MD share, compared to previous Dutch measurements, as well as recent chemical speciation data from neighbouring countries.
Although the MD contribution appeared to be relatively low in the data from the BOP campaign, the important conclusion can be drawn that, even if the contribution would double in other years, and match levels observed in Flanders or North Rhine-Westphalia, MD would only cover a small part of the large ‘non-modelled’ PM source, previously attributed to ‘soil material and other natural sources’ as stated in the Dutch benchmarking publication ‘Fijn stof nader bekeken’ (MNP, 2005)
Concentration of Cu in various PM fractions per location type.
Figure 3.5 Ca ba uw H el le nd oo rn Vr ed ep ee l Sc hi ed am Br ed a R ot te rd am 0.00 0.01 0.02 0.03 0.04 0.05 0.06 µg/m 3 PM10 PM2.5 PM2.5-10
Concentration of Cu in various PM fractions by location type
Rural
Modelling mineral dust over Europe 27 In the previous chapters we have shown that mineral dust is
an important constituent of PM10. Mineral dust may originate from distinctly different sources, such as wind erosion of bare soils, agricultural land management, resuspension of road dust, road wear, driving on unpaved roads, handling of materials, and building and construction activities (see Chapter 0). This chapter describes the development of a methodology for checking first-order estimates of the various source strengths in Europe, in general, and the Netherlands, in particular.
For this purpose, we implemented simple and therefore transparent emission functions in the LOTOS-EUROS model for the processes wind erosion of bare soils, agricultural land
management, resuspension of road dust and road wear, as these are thought to make up the highest source contributions in north-western Europe. To simplify the problem, a few assumptions were made beforehand.
We established that primary (or direct) road wear, which also results in the emission of mineral dust (see Chapter 0), is a much less important source than resuspension (see below), and would not need to be treated separately. This simplified the traffic component, as road wear could not be distinguished based on its chemical composition from re-emitted MD due to resuspension.
We included boundary conditions for desert dust from the global TM5 model. As the uncertainties concerning the dust emissions were very high, special attention was given to the identification of the controlling factors for the source estimates. We refer to Schaap etal. (2009) for an exact definition of the representation of desert dust in the current LOTOS-EUROS model.
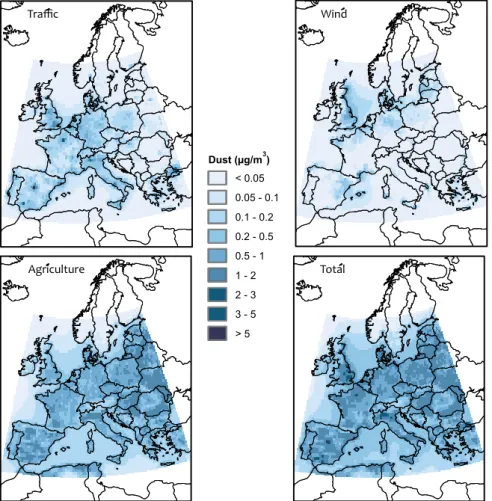
Within this chapter the focus is on mineral dust share of PM10 as , which is mainly found in the coarse PM fraction. The emission modules implemented in the LOTOS-EUROS model for 1) wind erosion of bare soils, 2) agricultural land management, and 3) resuspension of road dust (including road wear), were developed in the BOP programme and have been extensively described in Schaap et al. (2009). Below, only a brief summary is provided of the most important characteristics, and we refer to Schaap et al. (2009) for a detailed description and underlying motivations of the choices that were made.
4.1 Emission module for wind-blown dust
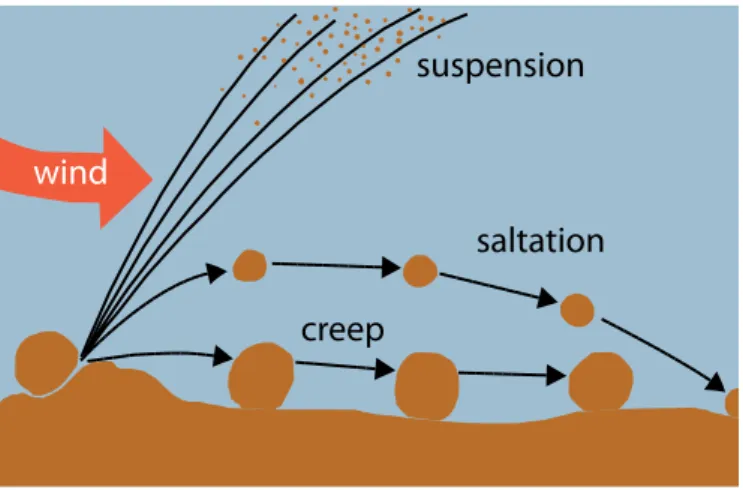
When the wind blows over a surface, it exerts pressure on it, which may mobilise soil material. Such transportation of soil material can be divided in three regimes: creep, saltation and suspension (See Figure 4-1). The (type of) mobilisation of a particle is controlled by gravitational force, inter-particle cohesion and wind shear stress on the particle, all depending on the size of the particle. Each of these processes were discussed by Schaap et al. (2009). The parameterisation for the horizontal and vertical dust flux utilised in the BOP research programme has been based on the work by Marticorena and Bergametti (1995, 1997), Gomes et al. (2003) and Alfaro et al. (2004).The relation between the horizontal flux of saltating soil aggregates and its induced vertical flux of aerosol particles, depends on the size of the soil aggregate, that of the released aerosol and the kinetic and binding energies involved. Alfaro et al. (1997, 1998) developed a sandblasting model which takes these dependencies into account. This sandblasting model was adapted for the calculation of wind-blown dust fluxes by the LOTOS-EUROS model (Schaap et al., 2009).
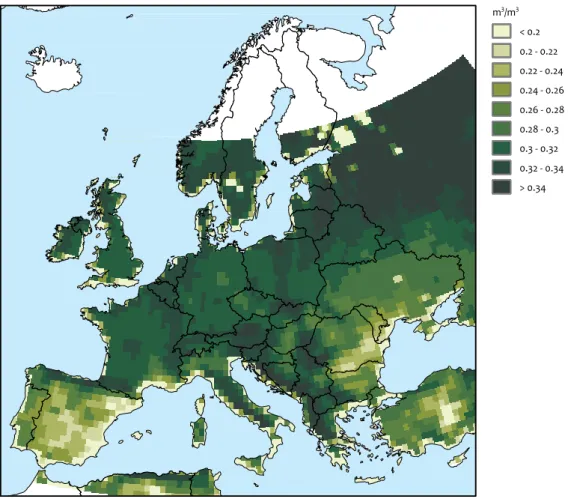
This wind-blown dust module in the LOTOS-EUROS model takes into account the spatial distribution of the main soil types in Europe, as soil particle size is an important parameter, next to soil moisture, which may vary considerably across Europe. Moist soil inhibits the release of soil particles, because it requires larger threshold friction velocities for the uplift of particles.
In our configuration of the LOTOS-EUROS model, the effect of precipitation (rain, snow) on dust emissions was represented by assuming the dust flux to be zero during precipitation events and up to 48 hours onwards. In case of a snow cover (aas derived from three-hourly ECMWF meteorological data, the dust flux was set to zero.
4.2 Agricultural activities
Soil erosion as a result of land management activities leads to soil degradation and loss of soil fertility. In addition, recently, it has also been acknowledged that (soil) dust generated during land management is not only causing soil degradation
Modelling mineral
but may also be a significant source of PM10. Currently, questions are being raised about its possible contribution to fugitive PM10. However, dedicated research on emission factors of PM10 and PM2.5 due to land management has been very limited. This is not surprising as it is quite complicated to determine what would be a ‘representative’ situation; dust emissions from land management depend on many variables, such as soil type, meteorological conditions, crops, and type of machinery, to name but a few. There are only a handful of studies available in which emission potentials have been estimated for several land management activities. These studies were reviewed by Schaap et al. (2009). The ranges of reported emission factors were wide, and varied from 0.3 to 14 kg.ha-1 and from 3.8 to 45.7 kg.ha-1 for land preparation and harvesting, respectively. Clearly, the uncertainty associated with these numbers is large. Moreover, it is not known how many of the emitted particles were mineral dust. Some of these soil particles will have been organic, such as the particles released from crops during harvesting. Despite the limited knowledge on and availability of observations, a first selection was made from the emission factors to calculate the emissions related to agricultural land management, using the LOTOS-EUROS model (Table 4-1). The emission factors were discussed in more detail by Schaap et
al. (2009), and since their publication, the emission factor
for ploughing or tillage were adjusted as they resulted in an overestimation of the mineral dust concentrations over Europe. Hence Table 4-1 is an updated version compared to Schaap et al. (2009).
Soil dust resulting from land management operations is characterised by high emission intensities, occurring in relatively short periods of time. In addition, the timing of all operations varies widely and is dependent on the local growing season, local weather and type of crop. This has been taken into account in the module developed for the LOTOS-EUROS model, with the use of a simple calendar of agricultural practices (Table 4-2) Winter activities on the fields are negligible and were not included. Land preparation, characteristically, is carried out in spring and late autumn, whereas harvesting takes place from August to October. During the growing season, when agricultural land management activities are minimal, we assumed emissions to be negligible. For more details on the agricultural calendar and its respective limitation on emissions, we refer to Schaap
et al. (2009).
The module that we used in the LOTOS-EUROS model is a first approach to get a better grip on this source of MD in the PM10 size range. A first empirical correction was made by adjusting the emission factor for ploughing. Through
PM2.5 and PM10 emission factors applied in the LOTOS-EUROS model
Reference Location Year Method Activity Operation type Emission Factor
PM 2.5 PM10
(mg.m-2) (mg.m-2)
Öttl et
al.(2007) Germany 2004 PM obs., disp. mod. land prep. Harrowing 29 82
Disc harrowing 12 137 Cultivating 6 186 Ploughing / tillage (wet) 0.5 120
Gaffney et
al. (2003) California, US 1995-2003 Upwind-downwind harvest corn 21* 191
* derived from the average ratio in emission factors between PM2.5 and PM 10
Table 4.1 Schematic of soil movement processes.
Figure 4.1 Schematic of soil movement processes