Agricultural
practice and
water quality
on farms regis
Agricultural practice and water quality on farms
registered for derogation
Results for 2011 in the derogation monitoring network
Agricultural practice and water quality
on farms registered for derogation
Results for 2011 in the derogation monitoring network
National Institute for Public Health and the Environment, RIVM report 680717035/2013
Colophon
© RIVM 2013
Parts of this publication may be reproduced, provided acknowledgement is given to the National Institute for Public Health and the Environment (RIVM), stating the title and year of publication.
A.E.J. Hooijboer, RIVM
A. van den Ham, LEI
L.J.M. Boumans, RIVM
C.H.G. Daatselaar, LEI
G.J. Doornewaard, LEI
E. Buis, RIVM
Contact person:
Arno Hooijboer
Centre for Environmental Monitoring
arno.hooijboer@rivm.nl
This study was commissioned by the Ministry of Economic Affairs as part of Project No. 680717, Minerals Policy Monitoring Programme (LMM).
Abstract
Agricultural practice and water quality on farms registered for derogation
Results for 2011 in the derogation monitoring network
The EU Nitrates Directive obligates member states to limit the use of livestock manure to a maximum of 170 kg of nitrogen per hectare per year. Dutch farms cultivating at least 70 percent of their total area as grassland are allowed to deviate from this requirement under certain conditions, and apply up to 250 kg of nitrogen per hectare (this partial exemption is referred to as ‘derogation’). The Netherlands is obligated to monitor agricultural practices and water quality at 300 farms to which derogation has been granted, and to submit an annual report on the results to the EU. The outcome of this study is that the average groundwater nitrate concentration on these farms has decreased during the 2007-2012 period. This report was prepared by the National Institute for Public Health and the Environment together with the Agricultural Economics Research Institute of Wageningen University & Research Centre, and commissioned by the Dutch Ministry of Economic Affairs.
Agricultural practices
The report also shows that, on average, derogation farms in 2011 used a few kilogrammes less nitrogen in livestock manure than the prescribed maximum of 250 kg per hectare. The quantity of nitrogen that can potentially leach into the groundwater in the form of nitrate is partly determined by the nitrogen soil surplus. This surplus is defined as the difference between nitrogen input (e.g. in the form of fertilisers) and nitrogen output (e.g. via milk). On average, the nitrogen soil surplus decreased significantly throughout the Netherlands between 2006 and 2011.
Groundwater quality
In 2011, the average groundwater nitrate concentration on derogation farms in the Sand Region amounted to 41 milligrammes per litre (mg/l) and was
therefore below the nitrate standard of 50 mg/l. On average, farms in the Clay and Peat Regions have even lower nitrate concentrations (14 and 7 mg/l, respectively). With an average groundwater nitrate concentration of 55 mg/l, only derogation farms in the Loess Region exceed the standard. The difference between the regions is mainly caused by a higher percentage of soils prone to nitrogen leaching in the Sand and Loess Regions. On these soils less
denitrification occurs, and more nitrate can therefore leach into the groundwater.
Keywords:
derogation decision, agricultural practices, manure, Nitrates Directive, water quality
Rapport in het kort
Landbouwpraktijk en waterkwaliteit op landbouwbedrijven aangemeld voor derogatie
Resultaten meetjaar 2011 in het derogatiemeetnet
De Europese Nitraatrichtlijn verplicht lidstaten om het gebruik van dierlijke mest te beperken tot 170 kg stikstof per hectare. Landbouwbedrijven in Nederland met ten minste 70% grasland mogen onder bepaalde voorwaarden van deze norm afwijken en 250 kg per hectare gebruiken (derogatie). Nederland is verplicht om op 300 bedrijven die derogatie gebruiken, de bedrijfsvoering en waterkwaliteit te meten en deze resultaten jaarlijks aan de EU te rapporteren. Uit de rapportage over 2011 die het RIVM met het LEI in opdracht van het ministerie van Economische Zaken heeft opgesteld, volgt dat de
nitraatconcentratie in het grondwater op deze bedrijven tussen 2007 en 2012 gemiddeld is gedaald.
Bedrijfsvoering
Uit de rapportage blijkt ook dat het stikstofgebruik uit dierlijke mest op de derogatiebedrijven in 2011 gemiddeld enkele kilogrammen lager was dan 250 kg stikstof per hectare. De hoeveelheid stikstof die mogelijk als nitraat kan
uitspoelen naar het grondwater, wordt mede bepaald door het
stikstofbodemoverschot. Dit is het verschil tussen de aanvoer van stikstof (zoals meststoffen) en de afvoer ervan (waaronder via melk). Het
stikstofbodemoverschot is gemiddeld over heel Nederland significant gedaald tussen 2006 en 2011.
Grondwaterkwaliteit
In 2011 ligt de nitraatconcentratie in het grondwater in de Zandregio met gemiddeld 41 milligram per liter (mg/l) onder de nitraatnorm van 50 mg/l. Bedrijven in de Kleiregio en de Veenregio hebben gemiddeld een lagere
nitraatconcentratie (14 en 7 mg/l). Alleen de derogatiebedrijven in de Lössregio zitten gemiddeld met 55 mg/l boven de norm. Het verschil tussen de regio’s wordt vooral veroorzaakt door een hoger percentage uitspoelingsgevoelige gronden in de Zand- en Lössregio; dit zijn gronden waar nitraat minder in de bodem wordt afgebroken en daardoor kan uitspoelen naar het grondwater. Trefwoorden:
Preface
This report was commissioned by the Dutch Ministry of Economic Affairs, and prepared by the National Institute for Public Health and the Environment (RIVM) in collaboration with the Agricultural Economics Research Institute (LEI) of Wageningen University & Research Centre. LEI is responsible for the information about agricultural practices, while RIVM is responsible for the water quality data. RIVM also served as the official secretary for this project.
This report provides an overview of agricultural practices in 2011 on all farms registered for derogation in the derogation monitoring network. The agricultural practice data includes data on fertiliser use and actual nutrient surpluses. Information is also provided about the results of water quality monitoring conducted in 2011 and 2012 at farms in the derogation monitoring network. The monitoring network covers 300 farms. The farms in the derogation monitoring network were either already participating in the Minerals Policy Monitoring Programme (LMM), or were recruited and sampled during sampling campaigns. This is the first year in which new regional boundaries were defined, resulting in changes to the number of farms in each region.
The authors would like thank Mr E. Mulleneers of the Ministry of Economic Affairs, Mr K. Locher of the Ministry of Infrastructure and the Environment, the members of the LMM Feedback Group, and Mr G.L. Velthof and Mr J.J. Schröder of the Committee of Experts on the Fertilisers Act (CDM) for their comments. Finally, we would like to thank our colleagues at LEI (particularly P.W. Blokland, M.W. Hoogeveen, T.C. van Leeuwen, J.W. Reijs and H.B. van der Veen) and at RIVM who, each in their own way, have contributed to the realisation of this report.
Arno Hooijboer, Aart van den Ham, Leo Boumans, Co Daatselaar, Gerben Doornewaard and Eke Buis
Contents
Summary—11
1
Introduction—23
1.1
Background—23
1.2
Previous reports—24
1.3
Contents of this report—25
2
Design of the derogation monitoring network—27
2.1
Introduction—27
2.2
Sampling method—28
2.2.1
Number of farms in 2011—28
2.2.2
Representativeness of the sample—30
2.3
Description of farms in the sample—32
2.4
Monitoring of water quality—34
2.4.1
Sampling at farms—34
2.4.2
Chemical analyses and calculations—38
3
Results for 2011—41
3.1
Agricultural characteristics—41
3.1.1
Nitrogen use in livestock manure—41
3.1.2
Fertiliser use compared to application standards (nitrogen and phosphate)—42
3.1.3
Crop yields—44
3.1.4
Nutrient surpluses—45
3.2
Water quality—47
3.2.1
Water leaching from the root zone, measured in 2011 (NO3, N and P)—47
3.2.2
Ditch water quality measurements in 2010-2011 (nitrogen and phosphorus)—49
3.2.3
Provisional figures for measurement year 2012 (nitrogen and phosphorus)—51
4
Results after six years of operation of derogation scheme—55
4.1
Introduction—55
4.1.1
Selection of farms for comparison of results—55
4.1.2
Differences with previously reported results—55
4.1.3
Statistical method used to determine deviations and trends—56
4.2
Developments in agricultural practices—57
4.2.1
Explanation of numbers of farms—57
4.2.2
Classification of farms—57
4.2.3
Use of livestock manure—59
4.2.4
Use of fertilisers compared to application standards—59
4.2.5
Crop yields—61
4.2.6
Nutrient surpluses on the soil surface balance—62
4.2.7
Summary—64
4.3
Development of water quality—65
4.3.1
Development of average concentrations during 2007-2012 period—65
4.3.2
Influence of environmental factors and sample composition on nitrate
concentrations—69
Appendix 1
Text of relevant articles of derogation decision—77
Appendix 2
Selection and recruitment of participants in the derogation
monitoring network—81
Appendix 3
Monitoring of agricultural characteristics—85
Appendix 4
Sampling of water on farms in 2011—99
Appendix 5
Tables—109
Appendix 6
Method for calculating the corrected nitrate concentration—119
Appendix 7
Fertiliser data reported by National Service for the
Implementation of Regulations—123
Appendix 8
Consequences of new regional borders for water quality and
agricultural practice data—133
Appendix 9
Adjustments to LMM calculation models in the Farm Accountancy
Summary
BackgroundThe EU Nitrates Directive obligates member states to limit the use of nitrogen in livestock manure to a maximum of 170 kg of nitrogen per hectare per year. A member state can request the European Commission for exemption from this obligation, provided certain conditions are met (this exemption is referred to as ‘derogation’ throughout this report). In December 2005, the European
Commission issued the Netherlands with a definitive derogation decision for the 2006-2009 period; in February 2010 this decision was extended until
December 2013. Under this decision, farms cultivating at least 70 percent of their total area as grassland may, under specific conditions, apply up to 250 kg of nitrogen per hectare in the form of manure from grazing livestock. The conditions attached to this exemption arrangement include an obligation for the Dutch government to set up a monitoring network for exempted farms in accordance with the requirements stipulated in the derogation decision, and to submit annual reports to the European Commission.
The derogation monitoring network
In 2006 a network was set up to monitor the development of agricultural
practices and water quality following introduction of the derogation scheme. This so-called ‘derogation monitoring network’ comprises 300 farms that have
registered for derogation. Of these 300 farms, 290 participated in the derogation scheme in 2011 (see Table S1). The derogation monitoring network was set up by expanding the Minerals Policy Monitoring Programme (Landelijk Meetnet
effecten Mestbeleid, LMM) of RIVM and LEI. A stratified random sampling
method was used to select 300 farms, distributed as evenly as possible according to soil type (sand, loess, clay and peat), farm type (dairy farms and other grassland farms) and economic size. Designing the monitoring network in this way fulfils the requirement, as stipulated in the derogation decision, that the network must be representative of all soil types (clay, peat, sand and loess soils), crop rotations and fertilisation practices, and must have a particular focus on the Sand Region.
New regional boundaries
Compared to the previous report (Buis et al., 2012), there have been some changes to the regions that are reported on. The old classification was based on the municipal boundaries, whereas the new classification is based on postcode districts. The new system is more in line with the actual soil types found in the different regions and the boundaries are more consistent because they are no longer subject to changes in municipal boundaries. The new regional boundaries have resulted in changes to the average water quality and soil surpluses in each region (refer to Appendix 8). These changes are minor, however. The regional boundaries have been adjusted with retroactive effect for all years surveyed, resulting in a recalculation of historical data sets.
Characteristics of farmland and farms in the derogation monitoring network
The stratification for data year 2011 is based on the old regional boundaries (refer to Table S1). As a result, the number of farms in each region in 2011 differs from the original set-up.
In 2011, the total area of agricultural land in the derogation monitoring network amounted to 2 percent of the surface area used by all exempted farms that fulfilled the criteria for inclusion in the monitoring network (the sample population).
Table S1 Characteristics of farms included in the derogation monitoring network in 2011, per region
Characteristics Region Sand Loess Clay Peat All
Number of farms included in monitoring network
160 20 60 60 300 Number of exempted farms fully
processed in FADN
149 19 68 54 290
- Of which specialised dairy farms 129 17 61 49 256
- Of which other grassland farms 20 2 7 5 34
Descriptive characteristics
Average acreage of cultivated land
(hectares) 49 46 58 59 53
Average percentage of grassland 81 72 85 92 83
Average milk production (in kg of
FPCM1 per hectare of fodder crop) 16,500 15,500 15,900 14,700 15,900 1 FPCM = Fat and Protein Corrected Milk, a standard used to compare milk with different fat and protein contents (1 kg of milk with 4.00 percent fat content and 3.32 percent protein content = 1 kg of FPCM). The reported milk production averages only concern dairy farms (N = 256).
With an average size of 53 hectares (refer to Table S1), the average acreage of farms in the derogation monitoring network exceeds that of the average farm in the sample population (44 hectares). Dairy farms in the network also produced more milk per hectare, especially in the Clay and Peat Regions. At 83 percent (see Table S1), the percentage of farmland used as grassland is equal to the average for the sample population.
Use of fertilisers
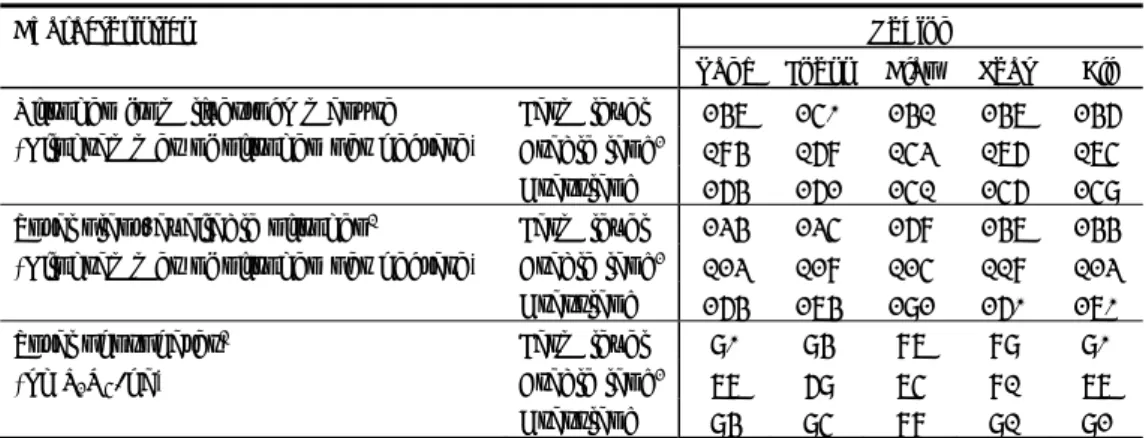
In 2011, the farms in the derogation monitoring network used on average 246 kg of nitrogen from livestock manure per hectare of cultivated land (Table S2). This is a few kilogrammes less than the nitrogen application standard for livestock manure (250 kg per hectare). An average of 175 kg of nitrogen per hectare was used on arable land, whereas on grassland an average of 259 kg of nitrogen from livestock manure was applied. The total use of nitrogen (in the form of inorganic fertilisers and plant-available nitrogen from livestock manure) remained below the total nitrogen application standard (260 kg per hectare on average). The average phosphate use was equal to the phosphate application standard for farms in the derogation monitoring network (90 kg per hectare), taking account of the phosphate status of the soil.
Table S2 Average use of fertilisers on farms in the derogation monitoring network in 2011, per region
Characteristics Region Sand Loess Clay Peat All
Nitrogen from livestock manure (Kilogrammes of nitrogen per hectare)
Farm level 247 250 241 247 246
Arable land2 184 168 153 176 175
Grassland 264 262 251 256 259
Total plant-available nitrogen1 Farm level 234 235 268 247 244
(Kilogrammes of nitrogen per hectare) Arable land2 123 128 125 118 123
Grassland 264 274 292 260 270
Total phosphates1 Farm level 90 94 87 89 90
(kg P2O5/ha) Arable land2 77 69 75 81 77
Grassland 94 95 88 91 92
1 From livestock manure and other organic and inorganic fertilisers. The quantity of plant-available nitrogen from livestock manure and other organic fertilisers was calculated based on the statutory availability coefficients for 2011.
2 Most arable land on grassland farms (90 percent on average) is used for the cultivation of silage maize.
Crop yields and nutrient surpluses at farm level
On average, yields of 190 kg of nitrogen per hectare and 70 kg of phosphate per hectare were estimated for silage maize, and yields of 274 kg of nitrogen per hectare and 87 kg of phosphate per hectare were calculated for grassland (Table S3). The average nitrogen surplus on the soil surface balance in 2011 was calculated at 175 kg per hectare. The nitrogen surplus decreases in the following order: Peat > Clay > Sand > Loess (Table S3). The high surplus in the Peat Region was caused by an average of 75 kg of net nitrogen mineralisation per hectare being included in the calculation, whereas in the other regions the net nitrogen mineralisation was probably negligible. The nitrogen surplus on the soil surface balance in the Clay Region is higher than in the Loess Region, due to greater use of inorganic fertilisers (Table S2). The phosphate surplus on the soil
surface balance amounted to 12 kg of P2O5 per hectare on average. The
phosphate surplus in the Sand and Loess Regions is slightly higher than in the Clay and Peat Regions.
Table S3 Average estimated silage maize yields and calculated grassland yields on all farms that fulfilled the selection criteria for application of the calculation method1, and nutrient surpluses on the soil surface balance on farms in the
derogation monitoring network in 2011, per region
Characteristics Region Sand Loess Clay Peat All
Estimated silage maize yields2
Kilogrammes of dry matter per hectare 16,500 16,700 15,800 15,000 16,200
Kilogrammes of nitrogen per hectare 194 196 187 177 190
Kilogrammes of P2O5 per hectare 70 71 70 66 70
Calculated grassland yield2
Kilogrammes of dry matter per hectare 9,900 9,700 9,900 10,000 9,800
Kilogrammes of nitrogen per hectare 273 287 272 289 274
Kilogrammes of P2O5 per hectare 89 90 89 85 87
Nutrient surpluses per hectare of cultivated land
Nitrogen surplus on the soil surface
balance (kg of nitrogen per hectare) 163 148 166 229 175
Phosphate surplus in the soil surplus
balance (kg of P2O5 per hectare) 14 15 7 12 12
1 Aarts et al., 2008
2 The silage maize and grassland yields are based on 165 and 219 farms, respectively. The other farms did not meet the selection criteria.
Analysis of agricultural practices during the 2006-2011 period
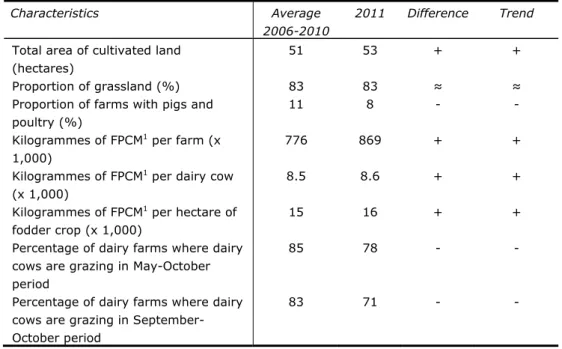
The increase in milk production per farm, per hectare and per cow, combined with virtually no growth in the total surface area of cultivated land indicates a gradual increase in scale and intensification, resulting in higher milk production per hectare and per cow. The proportion of grassland has remained virtually stable, while the proportion of farms with grazing dairy cows is slowly declining. This decrease is greater for farms where cows are grazing in September and October than for farms where cows are grazing throughout the entire May-October grazing period. The proportion of farms with grazing animals and pigs and poultry is decreasing (Table S4).
Table S4 Development of average size, farm type and milk production levels on farms participating in the derogation monitoring network
Characteristics Average 2006-2010
2011 Difference Trend
Total area of cultivated land (hectares)
51 53 + +
Proportion of grassland (%) 83 83 ≈ ≈
Proportion of farms with pigs and poultry (%)
11 8 - - Kilogrammes of FPCM1 per farm (x
1,000)
776 869 + +
Kilogrammes of FPCM1 per dairy cow (x 1,000)
8.5 8.6 + + Kilogrammes of FPCM1 per hectare of
fodder crop (x 1,000)
15 16 + + Percentage of dairy farms where dairy
cows are grazing in May-October period
85 78 - -
Percentage of dairy farms where dairy cows are grazing in September-October period
83 71 - -
1 FPCM = Fat and Protein Corrected Milk, a standard used to compare milk with different fat and protein contents (1 kg of milk with 4.00 percent fat content and 3.32 percent protein content = 1 kg of FPCM).
Difference: direction and significance of difference between 2011 and average for previous years. ≈ : insignificant difference (p > 0.05), +/- : significant difference (p < 0.05). Trend: direction and significance of trend in 2006-2011 period. ≈ : insignificant trend (p > 0.05), +/- : significant trend (p < 0.05).
The application of nitrogen from livestock manure does not exceed the standard of 250 kg per hectare. There is a significant increase in the use of
plant-available nitrogen in livestock manure (Table S5). This increase is caused mainly by the increased availability coefficient of nitrogen in livestock manure in 2008 (see Appendix 5, Table A5.3). The difference between the total nitrogen application standard and the actual use of plant-available nitrogen decreased from an average of over 40 kg per hectare (2006-2010 period) to an average of approx. 16 kg per hectare (2011) (Table S5). This can be partly attributed to an increase in the statutory availability coefficient and a reduction of the nitrogen application standard.
The difference between actual phosphate use per hectare and the phosphate application standard per hectare decreased from an average of approx. 7 kg per hectare (2006-2010 period) to 0 kg per hectare (2011), mainly as a result of the stricter regulations for use which were introduced in 2010. These regulations also take into account the phosphate status of the soil. The use of phosphates as well as the phosphate application standard decreased significantly between 2006 and 2010 (Table S5). This went hand in hand with a decline in the use of
Table S5 Development of average use of nitrogen in livestock manure, total use of plant-available nitrogen and phosphate, and nitrogen and phosphate
surpluses on the soil surface balance on farms participating in the derogation monitoring network
Characteristics Average 2006-2010
2011 Difference Trend
Use of nitrogen in livestock manure per hectare, excluding availability
coefficient
241 246 ≈ ≈
Total use of plant-available nitrogen per hectare, including availability coefficient
232 244 + +
Total nitrogen application standard per hectare for farms
273 260 - - Average nitrogen surplus on soil
surface balance, per hectare
184 175 - -
Phosphate use per hectare 93 90 - -
Phosphate application standard for farms, per hectare
100 90 - - Average phosphate surplus on soil
surface balance, per hectare
17 12 - - Difference: direction and significance of difference between 2011 and average for previous years. ≈ : insignificant difference (p > 0.05), +/- : significant difference (p < 0.05). Trend: direction and significance of trend in 2006-2011 period. ≈ : insignificant trend (p > 0.05), +/- : significant trend (p < 0.05).
On average, the nitrogen surpluses on the soil surface balance decreased significantly on all farms during the 2006-2011 period. The decrease is
significant in the Sand Region, but not in the other regions. The phosphate soil surplus also showed a significant decrease between 2006 and 2011 (Table S5). In 2011, farms in the 25 percent quartile realised a phosphate surplus of less than 0 kg per hectare (0 kg/ha = balance).
The estimated silage maize yield and the calculated grassland yield showed a significant upward trend in terms of the quantity of dry matter during the 2006-2011 period. The yield measured in kilogrammes of nitrogen is showing a rising trend for silage maize. There is no significant increase or decrease in the yield measured in kilogrammes of phosphate.
Water quality in measurement year 2011
The water quality measured in 2011 partly reflects agricultural practices in 2010 and in previous years. At 41 mg/l, the average nitrate concentration in the Sand Region is below the nitrate standard of 50 mg/l (Table S6). At 55 mg/l, the average nitrate concentration on farms in the Loess Region exceeds the standard. Nitrate concentrations in the Clay Region (14 mg/l) and the Peat Region (7 mg/l) are lower, due to a higher proportion of soils that are prone to leaching in these regions. In the Sand Region, nitrate concentrations were below the standard at 66 percent of farms (Table S6). In the Loess Region, nitrate concentrations were below the standard at 58 percent of farms. The percentage of farms with below-standard nitrate concentrations was 95 percent in the Clay Region and 98 percent in the Peat Region.
Table S6 Quality of water leaching from the root zone in 2011; average nitrate, nitrogen and phosphorus concentrations in mg/l, and percentage of farms with an average nitrate concentration higher than 50 mg/l
Characteristic Region Sand Loess Clay Peat
Number of farms 140 19 58 50
Nitrate (NO3) (mg/l) 41 55 14 7
Percentage of farms with nitrate concentration higher than 50 mg/l
34 42 5 2
Nitrogen (N) (mg/l) 12.4 13.4 5.2 9.5
Phosphorus (P) (mg/l) 0.10 N/A1 0.28 0.38
1 The phosphorus measurements conducted in the Loess Region were rejected (refer to section 3.2.1).
The nitrate and nitrogen concentrations measured in ditch water were lower than the concentrations measured in water leaching from the root zone
(Table S7). In the Sand and Clay Region, the phosphorus concentrations in ditch water were comparable to the concentrations in water leaching from the root zone. In the Peat Region, the phosphorus concentrations in ditch water were lower than those in water leaching from the root zone.
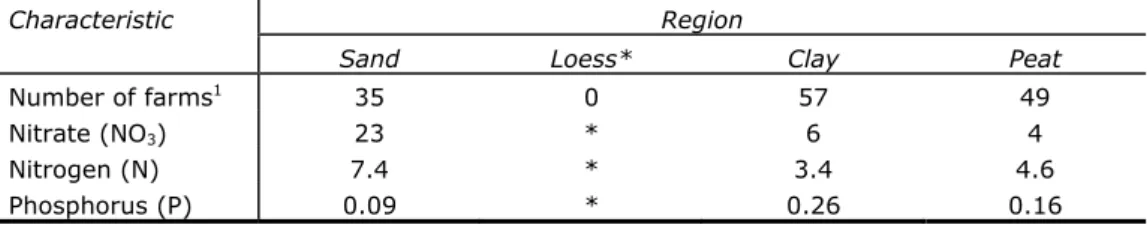
Table S7 Quality of ditch water in the winter of 2010-2011; average nitrate, nitrogen and phosphorus concentrations in mg/l, and percentage of farms with an average nitrate concentration higher than 50 mg/l
Characteristic Region Sand Clay Peat
Number of farms 35 57 49
Nitrate (NO3) (mg/l) 23 6 4
Percentage of farms with nitrate concentration higher than 50 mg/l
11 0 0
Nitrogen (N) (mg/l) 7.4 3.4 4.6
Phosphorus (P) (mg/l) 0.09 0.26 0.16
Water quality in measurement year 2012 (preliminary results)
The preliminary water quality results in 2012 partly reflect agricultural practices in 2011 (the sixth year of operation of the derogation scheme) and previous years (Tables S8 and S9). Consequently, these figures can be directly linked to the agricultural practice data that are stated in this report as well. The final water quality results for 2012 will be included in the report for 2014 (these are not expected to deviate significantly from the preliminary results). In all regions, the nitrate concentrations in water leaching from the root zone were lower than the concentrations measured in 2011.
Table S8 Quality of water leaching from the root zone in 2012; average nitrate, nitrogen and phosphorus concentrations in mg/l and percentage of farms with an average nitrate concentration higher than 50 mg/l
Characteristic Region Sand Loess Clay Peat
Number of farms 152 * 62 51
Nitrate (NO3) (mg/l) 36 * 11 4
Percentage of farms with nitrate concentration higher than 50 mg/l
26 * 0 0
Nitrogen (N) (mg/l) 12 * 4.7 8.0
Phosphorus (P) (mg/l) 0.11 * 0.32 0.42
* Results from the Loess Region were not yet available at the time of preparation of the present report; sampling was conducted in the period between September 2012 and February 2013.
Table S9 Quality of ditch water in the winter of 2011/2012; average nitrate, nitrogen and phosphorus concentrations in mg/l and percentage of farms with an average nitrate concentration higher than 50 mg/l
Characteristic Region Sand Clay Peat
Number of farms 36 61 50
Nitrate (NO3) (mg/l) 20 5 3
Percentage of farms with nitrate concentration higher than 50 mg/l
8 0 0
Nitrogen (N) (mg/l) 6.7 3.2 4.0
Phosphorus (P) (mg/l) 0.10 0.25 0.16
Analysis of water quality results in 2007-2012 period
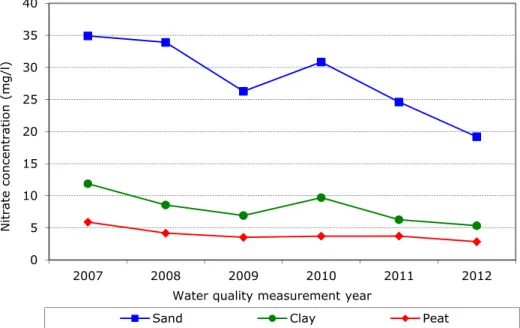
In 2012, the concentrations measured in water leaching from the root zone in the Sand, Clay and Peat Regions were significantly lower than the average levels measured in previous years (Figure S1). Concentrations in these regions
decreased significantly between 2007 and 2012. Nitrate concentrations in 2010 were higher than in previous and subsequent years (refer to Appendix 5, Table A5.9). Following a period of declining levels up to 2010, nitrate concentrations in the Loess Region increased again in 2011.
Figure S1 Development of nitrate concentrations in water leaching from the root zone, per region during successive measurement years
The downward trend in nitrate concentrations in water leaching from the root zone and the peak in 2010 can also be observed in ditch water measurements (Figure S2). In all regions, the ditch water nitrate concentrations in 2012 deviated significantly from the average of the preceding years. A significant decrease in nitrate concentrations was observed in the Sand, Clay and Peat Regions.
Figure S2 Development of ditch water nitrate concentrations per region in successive measurement years
In the Clay, Sand and Peat Regions, the phosphorus concentrations in water leaching from the root zone fluctuated over the years, and showed a decrease in the following order: Peat > Clay > Sand (Table A5.9). The phosphorus
concentrations in water leaching from the root zone in 2012 did not deviate
0 10 20 30 40 50 60 70 80 2007 2008 2009 2010 2011 2012 Nitr ate co ncentr atio n (mg/l)
Water quality measurement year
Sand Clay Peat Loess
0 5 10 15 20 25 30 35 40 2007 2008 2009 2010 2011 2012 Nitr ate co ncentr atio n (mg/l)
Water quality measurement year
significantly from the average of the preceding years. A significant downward trend may be observed in the Clay Region, while a significant upward trend may be observed in the Sand Region.
Phosphorus concentrations in ditch water show a decrease in the following order: Clay > Peat > Sand. The phosphorus concentrations in ditch water did not deviate significantly from the concentrations in preceding years.
Concentrations in ditch water in the Peat and Clay Regions showed a significant downward trend.
The final concentration data will be provided in the progress report for 2014. In that report it will also become apparent if these trends have continued.
Effects of agricultural practices on water quality Nitrogen
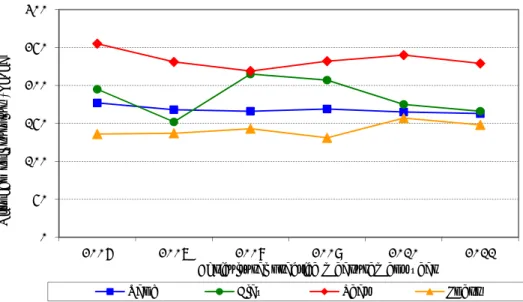
Nitrate concentrations in water leaching from the root zone showed a decrease in all regions except the Loess Region in the period 2007-2012 (Figure S1). Calculated nitrogen surpluses in the Sand Region showed a significant decrease between 2006 and 2011. Although nitrate concentrations declined significantly in the Clay and Peat Regions, soil surpluses did not decrease significantly in these regions during the same period (Figure S3).
In addition to the nitrogen surplus, there are other factors which play a role and which may have a diluting or concentrating effect on nitrate concentrations. These may include weather conditions, sample adjustments, after-effects of nitrogen surpluses in previous years, and reduced grazing. Dairy farms appear to be growing in scale and intensifying their operations. More and more
entrepreneurs are opting to keep their dairy cows in stables full-time, resulting in reduced grazing (Table S4). This development may partly explain the significant decrease in nitrate concentrations in the Sand Region.
Figure S3 Development of nitrogen surpluses per region in successive measurement years (agricultural practice year x influences subsequent measurement year x+1) 0 50 100 150 200 250 300 2006 2007 2008 2009 2010 2011 Nitr o gen so il sur p lus (k g/ha)
Agricultural practice measurement year
Phosphate
The phosphate surplus on the soil surface balance decreased during the measurement period from 26 kg per hectare in 2006 to 12 kg per hectare in 2011, with a peak in 2008. This decrease was caused mainly by reduced use of inorganic fertilisers. The effect of this decrease was not reflected in water quality levels, probably because phosphate bonds strongly to the soil. Phosphorus concentrations in water leaching from the root zone and in ditch water are therefore mainly affected by hydrological conditions and the degree of surface runoff.
1
Introduction
1.1 Background
The EU Nitrates Directive obligates member states to limit the use of nitrogen in livestock manure to a maximum of 170 kg of nitrogen per hectare per year (EU, 1991). A member state can request the European Commission for exemption from this obligation under certain conditions (this exemption is referred to as ‘derogation’ throughout this report). In December 2005, the European
Commission issued the Netherlands with a definitive derogation decision for the 2006-2009 period (EU, 2005). Under this decision, grassland farms cultivating at least 70 percent of their total area as grassland are allowed to apply on their total area up to 250 kg of nitrogen per hectare in the form of livestock manure originating from grazing livestock. In February 2010, the derogation decision was extended until the end of December 2013 (EU, 2010). The Dutch government is obligated to collect various data about the effects of the
derogation scheme, and to report these annually to the European Commission. One of the obligations under the derogation decision (refer to Appendix 1) concerns the establishment of ‘a monitoring network for the sampling of shallow groundwater, soil moisture, drainage water and ditches’ on farms granted an individual exemption (Article 8 of the decision, paragraph 2). The network must ‘provide data on the nitrate and phosphorus concentrations in the water leaving the root zone and ending up in the groundwater and surface water system’ (Article 8, paragraph 4). The monitoring network must cover at least 300 farms and must be ‘representative of all types of soil (clay, peat, sand and sandy loess), fertilisation practices and crop rotations’ (Article 8, paragraph 2). Within the monitoring network, the monitoring of water quality on farms on sandy soils should be reinforced (Article 8, paragraph 5). The composition of the monitoring network shall not be modified during the period of applicability of the derogation decision (2006-2013) (Article 8, paragraph 2). During negotiations with the European Commission, it was agreed that the design of this monitoring network would tie in with the existing national network for monitoring the effectiveness of minerals policy, the Minerals Policy Monitoring Programme (LMM). Water quality and agricultural practices at farms selected for this purpose have been monitored under this programme since 1992 (Fraters and Boumans, 2005). Additionally it was agreed that all LMM participants who satisfy the relevant conditions would be regarded as participants in the monitoring network for derogation purposes. Accordingly, the derogation monitoring network has been incorporated into the LMM programme. For LMM monitoring purposes, the top metre of phreatic groundwater, the soil moisture and/or the drainage water are sampled, as this procedure is regarded as sampling the water leaving the root zone (Appendix 4). The ditch water is sampled as well, in order to gain an impression of the quality of the surface water on farms.
Besides the obligation to monitor, participants must also report on the development of water quality levels over time. The reports must be based on ‘the monitoring of water leaching from the root zone, surface water quality and groundwater quality, as well as on model-based calculations’ (Article 10, paragraph 1). Furthermore, an annual report must be submitted ‘for the different soil types and crops regarding the fertilisation and the yield on grassland farms on which derogation is permitted’, to provide the European
Commission with insight into management practices at these farms and the level of optimisation achieved (Article 10, paragraph 4). This report is intended to meet the aforementioned reporting requirements.
1.2 Previous reports
The first report (Fraters et al., 2007b) was limited to a description of the derogation monitoring network, the progress made in 2006 in terms of setting up this network, and the design and content of the reports for the years 2008 to 2010 inclusive. A general description of the measurement and calculation methods to be used and the models to be applied was also included.
In 2008, the second report was published, containing the first data collected by means of the derogation monitoring network (Fraters et al., 2008). The first year of derogation was 2006. The figures on agricultural practices concern practices covered by the derogation scheme. The water quality data for 2006 relate to agricultural practices in 2005, and therefore do not yet relate to practices covered by the derogation scheme.
The third progress report was published in 2009; it contains the data for 2007 (Zwart et al., 2009). In addition, the results for 2006 and 2007 were subjected to a brief comparison, on the understanding that water quality data for 2006 relate to agricultural practice in 2005. Insufficient measurement data were available to be able to draw conclusions about trends for the third progress report.
The fourth progress report was published in 2010; it contains agricultural practice data and water quality data for 2008, as well as preliminary water quality data for 2009 (Zwart et al., 2010). In addition, the results for 2007, 2008 and 2009 were subjected to a brief comparison, on the understanding that the relevant data set was insufficient to draw solid conclusions about trends. For the first time, a limited analysis was conducted of the relationship between farm results and the associated water quality levels.
The fifth progress report was published in 2011; it contains agricultural practice data and water quality data for 2009 as well as preliminary water quality data for 2010 (Zwart et al., 2011). Additionally, the results for previous years were incorporated, including a comparison of the average agricultural practice data for the 2006-2008 period and the data for measurement year 2009. The water quality data for the 2007-2009 period and the measurement year 2010 were compared. Furthermore, a limited analysis was performed of the relationship between farm results and the associated water quality levels.
The sixth progress report was published in 2012. This report contained
agricultural practice data and water quality data for 2010, as well as preliminary water quality data for 2011 (Buis et al., 2012). It also included the agriculture practice data for the period starting in 2006, and water quality data for the period starting in 2007. The sixth progress report also contained a qualitative analysis of the relationship between agriculture practices and water quality. The boundaries of the soil type regions were adjusted in September 2011, resulting in changes to the boundaries of the Sand, Clay and Peat Region. The boundaries of the Loess Region remained virtually unchanged. The advantages
of the new boundaries and their impact on water quality and surpluses on the soil surface balance are explained in Appendix 8.
The new regional boundaries have resulted in slight changes to the average water quality in each region. The regional boundaries have been adjusted with retroactive effect for all years surveyed, resulting in a recalculation of historical data sets. Consequently, the water quality data for previous years as included in this report will deviate slightly from the data included in previous reports. Recent modifications to the Farm Accountancy Data Network (FADN) calculation model of the Agricultural Economics Research Institute (LEI) have led to
changes in the results, particularly with respect to nitrogen surpluses on the soil surface balance. The net effect of all these adjustments is a decrease in the nitrogen soil surplus of 7 kg per hectare, and an increase in the phosphate surplus of 4 kg per hectare (38 percent). Refer to Appendix 9 for further information about this matter.
1.3 Contents of this report
This is the seventh annual report setting out the results of the derogation monitoring network. It contains data on fertilisation, crop yields, nutrient surpluses and water quality. The nutrient surpluses are a major determinant for the quantities of nutrients that could potentially leach out.
The results contained in this report are based on the data registered in the LEI Farm Accountancy Data Network (FADN). The actual situation on the farms is registered in FADN based on the report submitted by the farmer. These data need not necessarily correspond to the data used during enforcement checks. For instance, the area used may differ from the area recorded in the land registration system of the National Service for the Implementation of
Regulations (Dienst Regelingen, DR) of the Ministry of Economic Affairs, since land which is counted as part of the farm for administrative purposes but which is not actually used for fertilisation, is not registered in FADN. In addition, there may be differences in the numbers of animals and the figures for the input and output of products and other stocks. The DR results are reported in Appendix 7, including a comparison with fertiliser use data compiled using the derogation monitoring network.
By linking fertilisation rates (established on the basis of FADN data) to acreage actually in use, the best possible insight is provided into the relationship
between agricultural practices and water quality. However, these data cannot be used to assess compliance with legislation, since data recorded by the DR are required for this purpose.
The data analysis includes both annual average nitrate concentrations measured per region and the results of limited model calculations (refer to Appendix 6). These calculations quantify the effect of confounding factors on the measured nitrate concentrations. Nitrate concentrations in water leaching from the root zone are affected not only by fertilisation, but also by variations in the precipitation surplus (Boumans et al., 1997). A statistical model has been developed to analyse the effect of variations in the precipitation surplus on nitrate concentrations in the top groundwater layer (Boumans et al., 1997; Boumans et al., 2001). This model corrects the sample to account for changes in the composition of the group of participating farms (Fraters et al., 2004).
Participants sometimes have to be replaced in the course of the programme, or changes occur in the acreage of the participating farms. As a result, the ratio of soil types and/or drainage classes on farms participating in the derogation monitoring network can change in the course of the programme. The soil type (sand, loess, clay, peat) and the drainage class (poor, moderate, well-drained) affect the relationship between the nitrogen surplus and the measured nitrate concentration. A change in the measured nitrate concentration could therefore be caused by a change in the composition of the group of participating farms, or by changes in acreage within this group.
Chapter 2 contains a brief description of the design and implementation of the derogation monitoring network. It also details the agricultural characteristics of the participating farms and provides a description of how the water quality is sampled. In addition, an explanation of the models and analyses is given. Chapter 3 presents and discusses the measurement results of the agricultural practice and water quality monitoring conducted in 2011 (Figure 1.1). The water quality data for 2011 are related to the agricultural practice data for 2010 and the preceding years. This chapter also contains the provisional water quality monitoring results for 2012, which are related to the agricultural practice data for 2011 and the preceding years. The data resulting from the loess sampling exercise carried out between the autumn of 2012 and the spring of 2013 have not been included in this report. Chapter 4 describes developments related to agricltural practices and water quality, including a discussion of trend-based changes since the start of derogation, and a statistical analysis of the extent to which agricultural practice year 2011 differed from preceding years.
Furthermore, a cautious assessment is provided concerning the effects of agricultural practice on water quality.
Figure 1.1 Overview of data collection periods for the presented monitoring results concerning agricultural practices and water quality
The relevant articles of the derogation decision granted to the Netherlands by the European Commission are listed in Appendix 1 (EU, 2005). Appendix 2 provides further details about the design of the derogation monitoring network. Appendix 3 provides a detailed justification of the registration of agricultural practice data, the calculation of fertilisation data and nitrogen and phosphate surpluses, and the application of confidence intervals. The water quality
measurement method is explained in Appendix 4. Appendix 5 includes a number of tables containing agricultural practice and water quality data. The
methodology applied for precipitation corrections and calculations of corrected nitrate concentrations is explained in Appendix 6. Appendix 7 compares fertiliser use according to DR data and according to the data collected using the
derogation monitoring network. Appendix 8 explains the effects of the new regional borders on the current situation and trends relating to water quality and surpluses on the soil surface balance. Appendix 9 explains how the new FADN calculation model affects the agricultural practice results.
M ont h 9 10 11 12 1 2 3 4 5 6 7 8 9 10 11 12 1 2 3 4 5 6 7 8 9 10 11 12 1 2 3 A gricult ural pract ice year 2011
Dit ch wat er qualit y 2011 Leaching wat er qualit y 2011 Dit ch wat er qualit y 2012 Leaching wat er qualit y 2012
Wat er qualit y dat a relat ed t o agricult ural pract ice year 2010 Wat er qualit y dat a relat ed t o agricult ural pract ice year 2011 Dat a not included in 2013 report
2011 2012 2013
2
Design of the derogation monitoring network
2.1 Introduction
The design of the derogation monitoring network must satisfy the requirements of the European Commission, as stipulated in the derogation decision of
December 2005 and the extension of the derogation in 2010 (refer to
Appendix 1). Previous reports provided extensive details about the composition of the sample and the choices this entailed (Fraters and Boumans, 2005; Fraters
et al., 2007b).
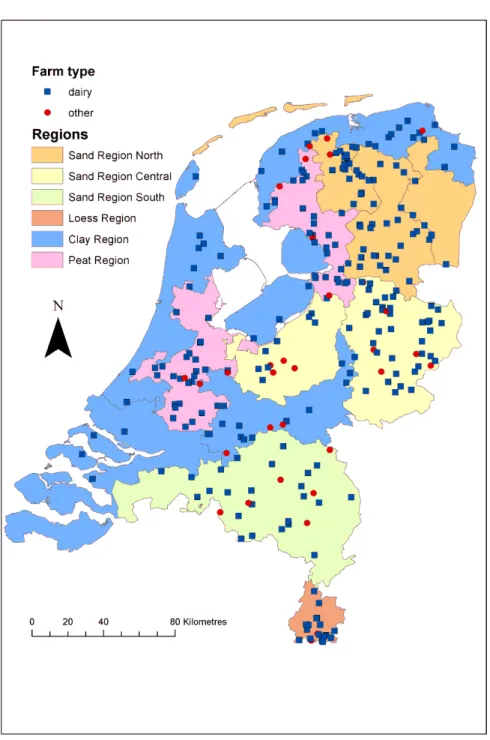
The set-up of the derogation monitoring network and the reporting of results are based on the division of the Netherlands into regions as used in the action programmes for the Nitrate Directive (EU, 1991). Four regions are distinguished: the Sand Region, the Loess Region, the Clay Region and the Peat Region. The acreage of agricultural land in the Sand Region accounts for about 47 percent of the approx. 1.85 million hectares of agricultural land in the Netherlands
(Statistics Netherlands Agricultural Census, data processed by LEI, 2011). The acreage of agricultural land in the Loess Region accounts for approx.
1.5 percent, in the Clay Region for approx. 41 percent, and in the Peat Region for approx. 10.5 percent of all agricultural land.
Water quality samples for measurement year 2011 were taken during the winter of 2010/2011 in the Low Netherlands, and during the summer and winter of 2011/2012 in the High Netherlands (see also section 2.4.1). The ‘Low
Netherlands’ comprises the Clay and Peat Regions, as well as those parts of the Sand Region that are drained by means of ditches, possibly in combination with drainage pipes or surface drainage. The ‘High Netherlands’ comprises the other parts of the Sand Region, and the Loess Region. In measurement year 2012, samples for determining water quality were taken during the winter of
2011/2012 and the summer of 2012. Samples at farms in the Loess Region were taken during the winter of 2012/2013. The resulting loess soil data have not been incorporated into this report. The plan calls for annual water sampling at 300 farms in the derogation monitoring network. When farms are excluded, new farms are often not registered in time for sampling to take place. Farms that submitted an application but did not participate in the derogation scheme have not been included in this report, so as to avoid confounding the data on the effects of participation in the scheme. Recent changes to regional boundaries also affected the number of farms. If farms are reassigned to another region, no suitable samples may be available and the sampling period may no longer correspond to the region (e.g. if farms are reassigned from the Clay Region to the Sand Region, or from sampling in winter to sampling in summer). Such farms are excluded from the process (also see Appendix 8). Consequently, the number of farms included in the report deviates from the initial number of 300. The water quality levels measured in 2011 partly reflect agricultural practices in 2010 and the preceding years. The extent to which agricultural practices in a preceding year affect the water quality measurements depends on various factors, including (fluctuations in the) precipitation surplus during that year, as well as local hydrological conditions. In the High Netherlands, it is assumed that agricultural practices affect water quality at least one year later. In the Low Netherlands, the impact of agricultural practices on water quality is quicker to
materialise. This difference in hydrological conditions also explains the different sampling methods and periods employed in the Low and the High Netherlands. As previously stated, all agricultural practice data relevant to the derogation scheme were registered for the 300 farms selected for derogation, according to the FADN system (Poppe, 2004). Appendix 3 provides a description of the monitoring of the agricultural characteristics and the calculation methods for fertiliser use and nutrient surpluses. Water sampling on the farms was carried out in accordance with the standard LMM procedures (Fraters et al., 2004). This sampling method is explained in Appendix 4.
2.2 Sampling method
2.2.1 Number of farms in 2011
In 2011 the LMM adopted a new division into regions with retroactive effect, i.e. including for previous years (see Appendix 8). As a result, a number of farms were assigned to other regions. There were no changes in the Loess Region. However, the stratification for information year 2011 was still based on the old regional boundaries (refer to Table 2.1). As a result, the number of farms in each region under the new system deviates from the original set-up.
Although the derogation monitoring network is a permanent network, some farms will inevitably ‘drop out’ over the course of time because they are no longer participating in the LMM programme for various reasons. Even if a farm is fully registered in FADN, it is sometimes impossible to fully describe the nutrient flows. This may be attributable to the presence on the farm of animals owned by other parties, so that data on the input and output of feedstuffs, animals and manure is by definition incomplete. In addition, other administrative errors may have been made when registering inputs and/or outputs.
Agricultural practices were successfully established at 298 of the 300 planned farms. Of these 298 farms, 290 actually participated in the derogation scheme. Ten farms that participated in the derogation monitoring network in 2010 have since dropped out. These farms have therefore been replaced.
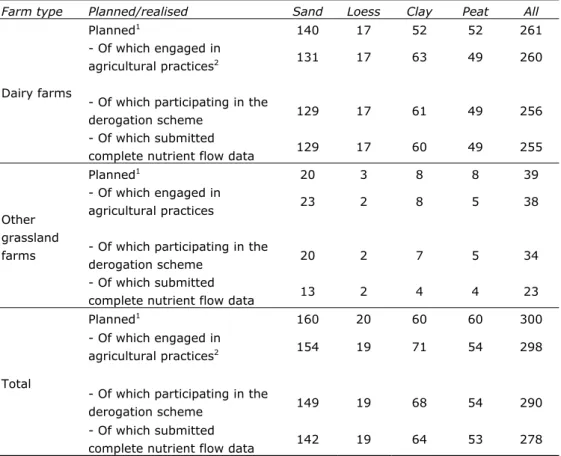
Table 2.1 Planned and realised number of dairy and other grassland farms per region in 2011 (agricultural practices)
Farm type Planned/realised Sand Loess Clay Peat All
Dairy farms
Planned1 140 17 52 52 261
- Of which engaged in
agricultural practices2 131 17 63 49 260
- Of which participating in the
derogation scheme 129 17 61 49 256
- Of which submitted
complete nutrient flow data 129 17 60 49 255
Other grassland farms Planned1 20 3 8 8 39 - Of which engaged in agricultural practices 23 2 8 5 38
- Of which participating in the
derogation scheme 20 2 7 5 34
- Of which submitted
complete nutrient flow data 13 2 4 4 23
Total
Planned1 160 20 60 60 300
- Of which engaged in
agricultural practices2 154 19 71 54 298
- Of which participating in the
derogation scheme 149 19 68 54 290
- Of which submitted
complete nutrient flow data 142 19 64 53 278
1 As determined based on old regional boundaries. 2 As determined based on new regional boundaries.
The various sections of this report detail agricultural practices at the following numbers of farms:
The description of general farm characteristics (section 2.3) concerns all farms that could be fully processed in FADN in 2011, and that participated in the derogation scheme (290 farms).
The description of agricultural practices in 2010 (section 3.1) concerns all farms for which a full picture of nutrient flows could be obtained from FADN data (278 farms).
The comparison of agricultural practices in the 2006-2010 period (section 4.2) concerns all farms that participated in the derogation
monitoring network in the respective years. This number varies from year to year. In 2006 this concerned 285 farms, in 2007 281 farms, in 2008
283 farms, in 2009 276 farms and in 2010 280 farms.
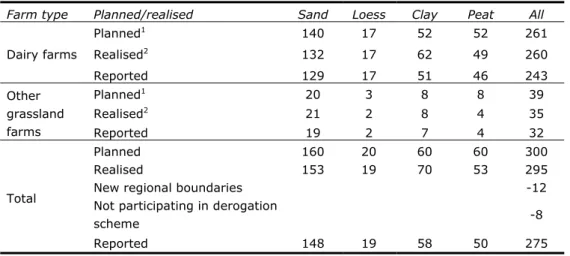
Of the 298 farms where agricultural practices were established, 275 farms were subjected to water quality testing (Table 2.2). It was not possible to use the water sampling results of twelve farms that had been reassigned to another region. Samples at these farms were previously taken in summer, and the farms were then reassigned to a region where samples are taken only in winter (i.e. the Clay and Peat Regions). Furthermore, eight farms did not participate in the derogation scheme. The sampling period has since been adjusted to reflect the new regional boundaries. These farms will be included in the report for 2014.
Table 2.2 Planned and realised number of dairy and other grassland farms per region in 2011 (water quality)
Farm type Planned/realised Sand Loess Clay Peat All
Dairy farms Planned1 140 17 52 52 261 Realised2 132 17 62 49 260 Reported 129 17 51 46 243 Other grassland farms Planned1 20 3 8 8 39 Realised2 21 2 8 4 35 Reported 19 2 7 4 32 Total Planned 160 20 60 60 300 Realised 153 19 70 53 295
New regional boundaries -12
Not participating in derogation
scheme -8
Reported 148 19 58 50 275
1 As determined based on old regional boundaries. 2 As determined based on new regional boundaries.
The report details the water quality on the following numbers of farms: The description of the water quality results for measurement year 2011
(section 3.2) concerns all farms where water quality sampling was
performed in 2011, that qualified for participation in the derogation scheme in 2011, and that were suitable for reporting after introduction of the new regional boundaries (275 farms).
The description of the water quality results for measurement year 2012 (section 3.2) concerns all farms participating in the derogation monitoring network in 2011 (excluding farms in the Loess Region), where water quality sampling was performed in measurement year 2012, and that were suitable for reporting after introduction of the new regional boundaries (266 farms). The description of water quality levels during the 2007-2012 period
(section 4.3) concerns all farms that participated in the derogation monitoring network in the agricultural practice year preceding the
measurement year, that qualified for participation in the derogation scheme in that previous year, and that were suitable for reporting after introduction of the new regional boundaries This number varies from year to year. For 2007, data are available of 279 farms, for 2008 of 280 farms, for 2009 of 281 farms, for 2010 of 280 farms, for 2011 of 281 farms, and for 2012 of 258 farms (excluding the Loess Region).
2.2.2 Representativeness of the sample
In 2011, 290 farms in the planned sample registered for derogation. These farms had a combined total acreage of 15,342 hectares, accounting for
2.0 percent of the total agricultural area on grassland farms in the Netherlands (Table 2.3). The sample represents 83.1 percent of the farms and 92.8 percent of the acreage of all farms that registered for derogation in 2011 and satisfied the LMM selection criteria (refer to Appendix 2). Farms outside the sample population that did register for derogation are mainly other grassland farms with a size of less than 25,000 Standard Output (SO) units.
The report for 2012 (Buis et al., 2012) uses so-called Dutch Size Units
uses Standard Output (SO) units to replace Dutch Size Units. This change in units means that more small farms fall outside the scope of the LMM sample. As a result, the percentage of total acreage is lower compared to the report for 2012.
The Loess Region is relatively small and therefore does not have many farms in the sample populations that also participate in the derogation scheme.
Consequently, a relatively large proportion of farms (17.9 percent) is included in the monitoring network. Furthermore, it is noteworthy that in all regions the proportion of sampled total acreage is greater at dairy farms than at other grassland farms. During the selection and recruitment process, the required number of farms to be sampled for each farm type is derived from the share in the total acreage of cultivated land, whereas the other grassland farms included were on average smaller than the dairy farms in terms of their acreage of cultivated land.
Table 2.3 Area of cultivated land (in hectares) in the derogation monitoring network compared to the total area of cultivated land at farms participating in the derogation scheme in 2011 in the sample population, according to the 2011 Agricultural Census
Sample
population1 Derogation monitoring network
Region Farm type
Area (hectares)
Area (hectares)
Percentage of total sample population acreage
Sand Dairy farms 327,000 6,744 2.1%
Other grassland
farms 49,717 590 1.2%
Total 376,717 7,334 1.9%
Loess Dairy farms 4267 821 19.2%
Other grassland
farms 617 55 9.0%
Total 4885 876 17.9%
Clay Dairy farms 227,820 3,833 1.7%
Other grassland
farms 26,634 137 0.5%
Total 254,455 3,970 1.6%
Peat Dairy farms 132,294 2,970 2.3%
Other grassland
farms 13,329 192 1.4%
Total 145,623 3,162 2.2%
All
regions Dairy farms 691,382 14,368 2.1%
Other grassland
farms 90,298 974 1.1%
Total 781,680 15,342 2.0%
1 Estimate based on the 2011 Agricultural Census performed by Statistics Netherlands, data processed by LEI. Refer to Appendix 2 for further information on how the sample population was defined.
2.3 Description of farms in the sample
The 290 farms which registered for derogation in 2011 have an average of 53 hectares of cultivated land, of which 83 percent is comprised of grassland. The average livestock density is 2.29 Phosphate Livestock Units (LSUs) per hectare (Table 2.4). Farm data derived from the 2011 Agricultural Census have been included for purposes of comparison, in so far as these farms are included in the sample population (Appendix 2).
An analysis of the agricultural characteristics of the sample population and a comparison with farm data from the Agricultural Census (Table 2.4) reveals the following differences:
The average acreage of cultivated land at the sampled farms is
20 percent greater than that of the farms in the sample population. This applies to all regions.
The proportion of grassland on the sampled farms (83 percent)
corresponds to the average for the sample population.
At the sampled farms 92 percent of the arable land is used for the
cultivation of silage maize, compared to 91 percent in the sample population.
The livestock density of grazing livestock on the sampled farms is
6 percent higher than the average for the sample population.
The proportion of sampled farms with grazing animals as well as stable
animals is virtually identical to the corresponding proportion in the sample population.
The acreage of natural habitat (averaging 1.1 hectares per farm) is not
included in the calculation of the environmental impact per hectare of cultivated land (i.e. calculation of fertiliser use, surpluses, etc.).
Dairy cattle and young livestock constitute almost 95 percent of grazing
livestock at the sampled farms. The ‘Other grazing livestock’ category comprises beef cattle, sheep, goats, horses and ponies.
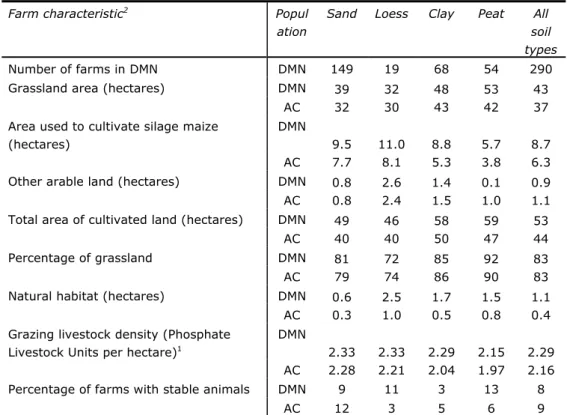
Table 2.4 Overview of a number of general characteristics in 2011 of farms participating in the derogation monitoring network (DMN), compared to average values for the Agricultural Census (AC) sample population
Farm characteristic2 Popul
ation
Sand Loess Clay Peat All soil types
Number of farms in DMN DMN 149 19 68 54 290
Grassland area (hectares) DMN 39 32 48 53 43
AC 32 30 43 42 37 Area used to cultivate silage maize
(hectares)
DMN
9.5 11.0 8.8 5.7 8.7 AC 7.7 8.1 5.3 3.8 6.3
Other arable land (hectares) DMN 0.8 2.6 1.4 0.1 0.9
AC 0.8 2.4 1.5 1.0 1.1
Total area of cultivated land (hectares) DMN 49 46 58 59 53
AC 40 40 50 47 44
Percentage of grassland DMN 81 72 85 92 83
AC 79 74 86 90 83
Natural habitat (hectares) DMN 0.6 2.5 1.7 1.5 1.1
AC 0.3 1.0 0.5 0.8 0.4 Grazing livestock density (Phosphate
Livestock Units per hectare)1
DMN
2.33 2.33 2.29 2.15 2.29 AC 2.28 2.21 2.04 1.97 2.16
Percentage of farms with stable animals DMN 9 11 3 13 8
AC 12 3 5 6 9
Specification of livestock density on farms in derogation monitoring network (Phosphate Livestock Units per hectare)1
Dairy cattle (including young livestock) DMN 2.22 2.11 2.12 2.03 2.15
Other grazing livestock DMN 0.11 0.22 0.16 0.12 0.13
Stable animals (total) DMN 0.80 0.07 0.06 0.24 0.48
All animals (total) DMN 3.14 2.39 2.35 2.39 2.76
Source: FADN and Statistics Netherlands Agricultural Census 2011, data processed by LEI. 1 Phosphate Livestock Unit (LSU) is a standard used to compare numbers of animals based on their standard phosphate production (the standard phosphate production of one dairy cow is equivalent to one Phosphate Livestock Unit).
2 Surface areas are expressed in hectares of cultivated land; natural habitats have not been included.
From the above comparison between the population of sampled farms and the Agricultural Census data, we can conclude that the population of sampled farms is representative of the Agricultural Census sample population, despite some minor differences.
The dairy farms participating in the derogation monitoring network produce an average of 869,000 kg of Fat and Protein Corrected Milk (FPCM) per farm, and an average of 15,900 kg of FPCM per hectare. The average annual milk
production per cow is 8,580 kg of FPCM (Table 2.5). As the Agricultural Census does not provide appropriate data for comparison, Table 2.5 uses the weighted average of the national FADN sample. In all regions, the dairy farms
participating in the derogation monitoring network have a larger acreage and produce more milk per farm than the weighted national average. Such a
comparison cannot be made for the Loess Region, due to an insufficient number of FADN-registered farms.
Table 2.5 Average milk production and grazing on dairy farms participating in the derogation monitoring network (DMN) in 2011, compared to the weighted average for dairy farms in the national sample (FADN)
Farm characteristic Population Sand Loess Clay Peat All
Number of farms in DMN DMN 129 17 61 48 255 FPCM production per farm (kg) DMN 828,800 715,200 984,800 881,700 868,500 FADN 683,800 807,900 680,000 713,800 FPCM production per hectare of fodder crop (kg) DMN 16,500 15,500 15,900 14,700 15,900 FADN 16,100 14,700 13,300 15,300 FPCM production per dairy cow (kg) DMN 8,690 8,430 8,580 8,340 8,580 FADN 8,780 8,490 8,250 8,620 Percentage of farms with grazing from May to October
DMN 80 82 72 79 78
FADN
78 80 85 79 Percentage of farms
with grazing from May to June
DMN 76 82 72 77 76
FADN
74 78 83 76 Percentage of farms
with grazing from July to August
DMN 80 82 70 79 78
FADN
78 78 85 79 Percentage of farms
with grazing from September to October
DMN 74 82 66 69 71
FADN
71 70 80 72 1 FPCM = Fat and Protein Corrected Milk, a standard used to compare milk with different
fat and protein contents (1 kg of milk with 4.00 percent fat content and 3.32 percent protein content = 1 kg of FPCM).
An analysis of the differences between farms participating in the derogation monitoring network and FADN farms reveals the following:
The average milk production of a dairy farm participating in the derogation monitoring network is 22 percent higher than the national FADN average. The difference is greatest in the Peat Region (approx. 30 percent).
The average milk production per hectare and per dairy cow at dairy farms
participating in the derogation monitoring network is virtually the same as the national FADN average. Here, too, the difference is greatest in the Peat Region at approx. 10 percent (Table 2.5).
2.4 Monitoring of water quality
2.4.1 Sampling at farms
In measurement year 2011, water quality samples were taken at 287 of the 290 farms participating in the derogation monitoring network that had applied for derogation and actually participated in the scheme in agricultural practice year 2011. The difference of three farms is caused by the fact that these farms were new in 2011, and were sampled for the first time in measurement year 2012. Following the changes to the regional boundaries, the data of 275 farms