Experimental and numerical study of flow
characteristics in a confluence with a discordant
bed elevation
Joeri Van Ackere
Student number: 01808762Supervisor: Prof. dr. ir. Tom De Mulder
Counsellor: ir. Pedro Xavier Ramos
Master’s dissertation submitted in order to obtain the academic degree of Master in Civil Engineering
Foreword
Two years ago I graduated in construction engineering technology. As I still was eager to learn more about the construction of waterways and hydraulic structures, I decided to follow the bridging program to obtain the academic degree of Master of Science in Civil Engineering with a major in Dredging and Offshore Engineering. This master’s dissertation is consequently the culmination of this study. It gives a student the opportunity to study a subject of interest.
It was a really interesting journey to study this subject. I first got acquainted with the subject during the laboratory of the course Hydraulics. The experimental setup already fascinated me during this laboratory and I was really interested in the studies that were performed on this setup. This master’s dissertation has been realized by acquiring help and knowledge of various people. Without them, I wouldn’t have gotten this far. Therefore, I would like to thank some people.
First of all, I would like to express my gratitude to my supervisor Prof. Dr. Ir. Tom De Mulder for making me acquainted with the world of Hydraulics during his interesting lessons which were given with great enthusiasm. Furthermore, I want to thank him for giving me the opportunity to study this interesting subject and his endless help.
I would like to thank my counsellor, Ir. Pedro X. Ramos, for his answers to my endless list of questions and the many discussions we had, even until late at night. I am also very grateful to Stefaan Bliki and everyone at the Hydraulics Laboratory of UGent who helped me with the setup of the experimental study.
Furthermore, I would like to thank my family for the opportunity they have given me to follow the bridging program of Civil Engineering and for their support. I would like to express my gratitude to my friends, who were always available when I needed a break, and Eline, for her endless support, for giving me a laugh when I needed to and for letting me rambling on about my thesis whenever I wanted.
Joeri Van Ackere June 2020
Copyright
“De auteur geeft de toelating deze scriptie voor consultatie beschikbaar te stellen en delen van de scriptie te kopi¨eren voor persoonlijk gebruik.
Elk ander gebruik valt onder de beperkingen van het auteursrecht, in het bijzonder met be-trekking tot de verplichting de bron uitdrukkelijk te vermelden bij het aanhalen van resultaten uit deze scriptie.”
”The author gives permission to make this master’s dissertation available for consultation and to copy parts of this master’s dissertation for personal use. In the case of any other use, the copyright terms have to be respected, in particular with regard to the obligation to state expressly the source when quoting results from this master’s dissertation.”
Experimental and numerical study of
flow characteristics in a confluence
with a discordant bed elevation
By Joeri Van Ackere
Supervisor: Prof. Dr. Ir. Tom De Mulder Counsellor: Ir. Pedro Xavier Ramos
Master’s dissertation submitted in order to obtain the academic degree of Master of Science in Civil Engineering
Department of Civil Engineering Chair: Prof. Dr. Ir. Peter Troch
Faculty of Engineering and Architecture Academic year 2019-2020
Abstract
Open-channel confluences are of great importance in hydraulic engineering. Applying a bed discordance in the tributary channel of a T-shaped confluence leads to changes in the flow features of a confluence zone. In this thesis, the effect of the application of a bed discordance in the tributary channel will be studied for a discordance ratio of 0.25.
First, an introductory chapter explains the importance of confluences and the findings made in the literature. Furthermore, experiments consisting of velocity measurements by applying the Surface Particle Tracking Velocimetry (SPTV) technique are carried out for the discordant bed case. The experiments are focused primarily on the separation zone. In addition, results extracted from numerical models consisting of Large Eddy Simulations (LES) for the discordant bed case and for the corresponding concordant bed case are used.. The numerical models will be validated using experimental data from this thesis and experimental data found in the literature. Based on these models, the effect of the bed discordance on the flow features in the confluence zone and, in particularly, the separation zone will be assessed. Furthermore, the time-dependency of the separation zone will be studied.
At last, the head losses are estimated for the concordant bed case and discordant bed case and a Borda-Carnot analysis is performed.
Keywords
Experimental and numerical study of
flow characteristics in a confluence
with a discordant bed elevation
Joeri Van Ackere
Supervisor(s): Prof. Dr. Ir. Tom De Mulder, Counsellor: Ir. Pedro Xavier Ramos
Abstract— This research investigates the influence of a bed discordance σof 0.25 in the tributary channel on the flow hydrodynamics in a 90◦
open-channel confluence for a discharge ratio q of 0.58. The main and tributary channel have an equal width. Lab experiments are conducted using the sur-face particle velocimetry (SPTV) to validate the results of Large Eddy Sim-ulations (LES). The LES are furthermore used to investigate the influence of the bed discordance and estimate the head losses. By observing the ve-locity field and the Reynolds stress tensor it is shown that the flow behaves highly three-dimensionally due to the application of a bed discordance of 0.25 in the tributary. The most significant part of the three-dimensional flow is located in the separation zone. The focus of this research is therefore mainly directed to the separation zone.
Keywords—Open-Channel confluences, discordant bed, separation zone, flow features, head losses
I. INTRODUCTION
Open channel confluences are an important part of flow net-works. In the past a lot of research has been done on the flow features in a confluence zone. An overview of the flow features in a confluence zone is given in Figure 1. In this thesis a right-angled open channel confluence is used.
Fig. 1: Schematized overiview confluence zone features after Best (1985)
Three different main flow features can be distinguished in open channel confluences. From the downstream junction cor-ner onward, the flow coming from the tributary is detached from the inner bank of the downstream main channel (DMS). This creates a separation zone. Next to the separation zone, the flow coming from the tributary channel (TC) and upstream main channel (UMS) is contracted and a zone of higher velocities oc-curs, the flow contraction zone. Furthermore, at the upstream
junction corner, a zone of decelerated flow and, therefore, higher surface elevations occurs, called the stagnation zone.
The behaviour of the flow hydrodynamics occurring in the confluence zone has been and is still being investigated exten-sively. In the past a lot of research has been done on the influ-ence of flow hydrodynamics on degradable beds in this conflu-ence zone. In this zone a differconflu-ence in bed elevation between the main channel and the tributary channel can occur, causing a dis-cordant bed elevation between the tributary and main channel. Although a lot of research has been done on the flow features in a confluence zone for a concordant bed case (i.e. same bed ele-vation between main channel and tributary channel), research on the impact on flow features in a confluence zone for a discordant bed case is rather scarce. Biron et al. (1996) (experimental) and Dordevi´c (2013) (numerical RANS) schematized the occurrence of a discordant bed case by applying a step in the tributary. In both researches a major three-dimensional flow was noticed in the confluence zone. For a concordant case there is a recircula-tion zone present in the separarecircula-tion zone over the entire depth of the flume (Dordevi´c, 2013; Ramos, Schindfessel, et al., 2018). Nevertheless, Dordevi´c (2013) mentioned that the recirculation is obliterated at the surface for a discordant bed case if the step height s is greater than or equal to 0.25 times the downstream water depth. Furthermore, the recirculation zone seems to dis-appear at the bed for a discordant bed case.
Since the origin and exact shape of the three-dimensional flow is still rather unknown, it was decided to further investigate a confluence zone for which a discordant bed elevation occurs be-tween the tributary channel and the main channel. Experiments were carried out on the flume of the Hydraulics Lab of UGent with a discordant bed elevation in order to validate (future) nu-merical models and gain more information about the exact flow conditions. Furthermore Large Eddy Simulations were used for a concordant and discordant bed case to elaborate further on the flow conditions in the confluence zone. The hydraulic condi-tions for the numerical models were the same as those for the experimental study.
In this thesis a bed discordance is schematized by applying a sharp-edged step in the tributary channel with a discordance ratio σ of 0.25. In reality the discordance ratio can have a value of up to 0.5 (Kennedy, 1984). The discordance ratio σ is defined by Equation 1 and is the ratio between the step height s ,as can
be seen in Figure 1, and the water depth at a downstream moni-toring section hd:
σ = s hd
(1)
The discharge ratio q is defined by Equation 2 and is the ratio between the discharge in the upstream main channel (UMS) Qm
and the total discharge in the downstream main channel (DMC) Qtotwhich is equal to the sum of the discharge in the upstream
main channel Qmand the discharge in the tributary channel Qt.
In this thesis a well-balanced discharge coefficient q of 0.58 is chosen for the experimental study and the Large Eddy Simula-tions.
q = Qm Qm+ Qt
= Qm
Qtot (2)
II. EXPERIMENTAL STUDY
A. Set-up laboratory flume
The experiments were conducted on the laboratory flume available in the Hydraulics Lab of the department of Civil Engi-neering of Ghent University. It consists of a main channel and a tributary channel, both having a rectangular cross-section and a width of 40 cm. The tributary arm is connected to the main channel under a 90◦ angle. The hydraulic conditions used for
the experimental study are based on the experimental work of Weber et al. (2001). In Weber et al. (2001) a Froude number F rof 0.37 is used. The hydraulic conditions at a downstream monitoring section located at a distance of 24 times the width of the flume used by Weber et al. (2001) from the upstream junc-tion corner are known. Therefore, these hydraulic condijunc-tions are Froude-scaled to the downstream monitoring section of the flume used in the Hydraulics Lab of UGent, which is located at a distance of 16 times the width of the UGent flume from the upstream junction corner (16W). An overview of the hydraulic conditions used in this experimental study is given in Table I. TABLE I: Overview hydrodynamic conditions experimental study Hydraulic conditions UGent (16W) hd 0.148 m q 0.583 σ 0.25 s 0.037 m Ud 0.435 m/s Qtot 0.0258 m3/s Qmain 0.015 m3/s Qt 0.0107 m3/s Re 73721
The water depth at the downstream monitoring section hd is
controlled by the correct positioning of a weir at the outlet of the flume. The measurements are performed for the discordant bed case with a discordance ratio σ of 0.25. This discordance ratio is also studied in Dordevi´c (2013) and Ramos, Schindfessel, et al. (2018).
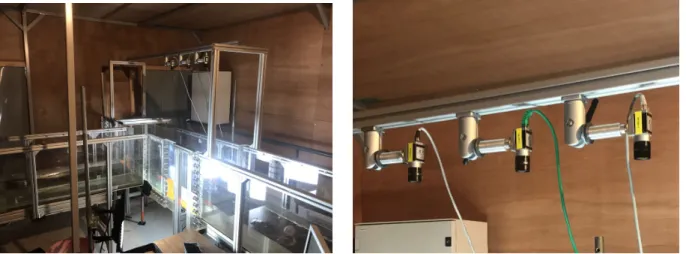
B. Measurement technique
For the meaurements of the surface velocities in the con-fluence zone, the surface particle tracking velocimetry (SPTV) technique is applied. Small buoyant particles are applied to the flume which are than captured by three cameras mounted on a frame above the flume. These pictures are than post-processed using the GML Undistorter software in order to undistort the images. Following this, particle tracking software FIJI is used which reproduces the paths of the seeded particles.Once the paths of the particles is known, the tracked paths are exported to a xml-file which will be used in MATLAB to make contour-plots of the horizontal surface velocities.
C. Data analysis and results of the experiments
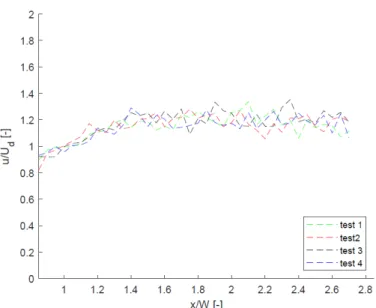
Four different tests are executed with each a length of 100 seconds and at a frame rate of 40 frames per second, resulting in over 12 000 images per test. A quality check was performed be-tween the results for each camera and bebe-tween the results for the different tests. The time-averaged results for the longitudinal ve-locities u for a total test length of 400 seconds and averaged over a 3x3 cm2grid is shown in Figure 2. The longitudinal surface
velocity is made dimensionless with respect to the velocity in the downstream monitoring section Ud, as given in Table I. The
longitudinal and transverse coordinates are made dimensionless with respect to the width of the flume W .
Fig. 2: Results experimental study for the dimensionless longi-tudinal surface velocity
From these results a clear demarcation of the separation zone can be seen. It should be noted that during the execution of the experiments it was noticed that when the particles reached the separation zone, many of them submerged beneath the surface of the water. Therefore the values inside the separation zone, may not be representative for the values of surface velocities. This is a clear indication of the occurrence of three-dimensional flow in this zone. Nevertheless, the data inside the separation zone still contains valuable information. As such it can be
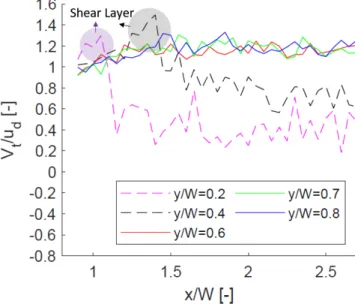
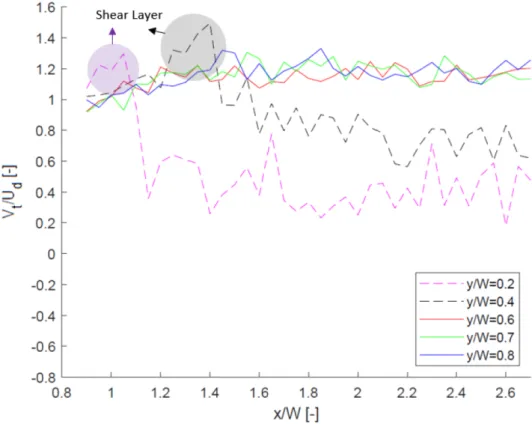
dis-bank of the main channel, which could be a possible indication of the presence of a recirculation zone beneath the water surface. Furthermore, a zone of higher velocities occurs right next to the separation zone. The higher velocities are caused due to the contraction of the flow coming from the TC and UMS. There-fore, this zone is called the flow contraction zone. In Figure 3 some longitudinal cross-sections can be found of the total hor-izontal surface velocity. The cross-sections which intersect the flow contraction zone (i.e. y/W = 0.6, y/W = 0.7 and y/W = 0.8), give higher values for the total horizontal velocities than the cross-sections which intersect the separation zone (i.e. y/W = 0.2 and y/W = 0.4). The cross-sections which intersect the separation are indicated with a dotted line as they do not reflect values for surface velocities due to the submerging of particles in this zone. Nevertheless, the order of magnitude of the surface velocities should be close to the values displayed in this graph. In addition, the cross-sections intersecting the flow contraction zone indicate less fluctuating velocities than the cross-sections intersecting the separation zone. This can be attributed to the submerging of the particles in the separation zone but can also be an indication of the three-dimensional flow occurring here. Furthermore, a peak is noticeable between x/W = 0.9 and x/W= 1.1 for cross-section y/W = 0.2. This peak can be attributed to the intersection of the cross-section with the shear layer. The same peak can be found for cross-section y/W = 0.4 between x/W = 1.2 and x/W = 1.4.
Fig. 3: Results cross-sections experimental study for the dimen-sionless total horizontal surface velocity
III. NUMERICAL STUDY
A. Description of the LES
The numerical results are obtained and post-processed from Large Eddy Simulations (LES) performed by Ir. Pedro X. Ramos. The LES simulations resolve turbulent eddies at the scale of the computational grid (Bradbrook et al., 2000). A nu-merical model was made by Pedro X. Ramos for a concordant
bed case and a discordant bed case with discordance ratio σ of 0.25. The dimensions of the flume that are modelled are based on the dimensions of the flume in the Hydraulics Lab of UGent that is used in the experimental study of this thesis. Thus a chan-nel width of 0.4m is applied and the hydraulic conditions men-tioned in Table I are used. The post-processing is performed us-ing Paraview from which the required results are extracted and converted into graphs using scripts written in MATLAB. B. Validation and verification of the LES results
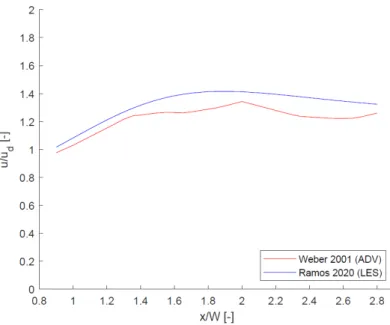
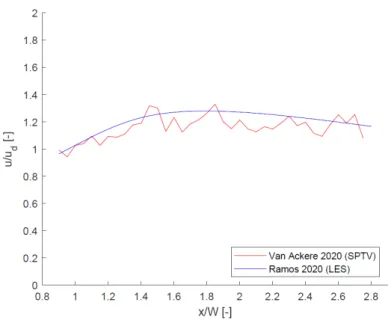
The time-averaged velocity field of the numerical models is validated using the experimental data in this study for the discor-dant bed case and data from preliminary experiments conducted by Weber et al. (2001) for the concordant bed case.
The turbulence field for the concordant bed case is validated using the experimental data of Weber et al. (2001). As no ex-perimental data is available for the validation of the numerical work for the discordant bed case, a comparison is made with the numerical results of the discordant bed case of Dordevi´c (2013), who investigated the same discordance ratio.
The comparison reveals that both numerical models show many similarities with their respective experimental data.
IV. DATA-ANALYSIS AND RESULTS OF THELES
A. Description of the flow phenomena
In order to study the flow features in the confluence zone, some longitudinal cross-sections displaying the longitudinal ve-locity component u are made. The longitudinal veve-locity compo-nent u of the cross-sections at y = 0.05 W for the concordant and discordant bed case are shown in Figure 4. These cross-sections are located near the inner bank of the main channel and intersect the separation zone.
(a) Concordant bed case
(b) Discordant bed case
It is clear that for both the concordant bed case as the discor-dant bed case negative longitudinal velocities occur inside the separation zone. However, for the discordant bed case, the size of this negative velocity zone seems to be much smaller in com-parison with the concordant bed case. Nevertheless, the values of the negative velocities seem to be even more pronounced for the discordant bed case.
Furthermore, The flow inside the separation zone (i.e. from the downstream junction corner onward), is much more three-dimensional for the discordant bed case. The reason for this three-dimensional flow can be attributed to the higher longitu-dinal velocities that occur at the lee of the step. A certain part of the flow coming from the UMS passes underneath the flow coming from the TC and elevates once the downstream corner is reached as described in the literature by Biron et al. (1996). The higher longitudinal velocities are caused by a vortical tube at the lee of the step. The presence of this vortical tube can also be distinguished from Figure 5a. The latter is also discussed in Ramos, Pedro, et al. (2018), for which the vortical tube is shown (by means of the so-called Q-criterion) in Figure 5b. During the execution of the lab experiments, the presence of this vortical tube was witnessed on the existing flume in the Hydraulics Lab-oratory of UGent by means of the application of dye at the bed at the upstream corner. Videos were made of these dye experi-ments.
(a) Cross-section at x = 0.7 W
(b) Vortical tube as discussed in Ramos, Pedro, et al. (2018)
Fig. 5: Presence of a vortical tube at the lee of the step for the discordant bed case
B. Flow phenomena in the separation zone
The flow inside the separation zone for the discordant bed case is highly three-dimensional as can be seen in Figure 6.
Fig. 6: Overview three-dimensional flow in the separation zone
Inside the separation zone a zone of downwelling seems to occur close to the downstream corner at around x = 1.05 W. Further downstream a zone of upwelling occurs at around x = 1.5 W. Both these phenomena can also be distinguished from transverse cross-section plots of the velocity in the z-direction, as seen in Figure 7. The occurrence of the upwelling and down-welling of the flow in the separation zone was witnessed as well during the execution of the experiments performed in the exper-imental study.
(a) Cross-section at x = 1.05 W (b) Cross-section at x = 1.5 W
Fig. 7: Cross-sections of the velocity component in the z-direction
It was found that the flow for the concordant bed case, how-ever, seems to behave much more two-dimensional with only small variations of the velocity in the z-direction. Following this, the dimensions of the separation zone don’t change much throughout the depth of the confluence zone. For the discor-dant bed case, the three-dimensional flow in the confluence zone changes the separation zone dimensions throughout the depth of the confluence zone. This can be seen in Figure 8. Here the width of the separation zone is determined based on the position of the shear layer. A good way of displaying the shear layer was found to be the Reynolds Normal Stress RNSu02. It is noticed
that a second shearing zone occurs inclined from the inner wall for the discordant bed case. This second shearing zone is cre-ated due to interaction with the flow coming from the vortical tube at the lee of the step. This vortical tube seems to diminish the separation zone for water level elevations lower than z = 0.1 hdhere. Therefore, it can be concluded that the separation zone
width is much more variable throughout the depth of the flume as displayed in Figure 8.
(a) Concordant bed case (b) Discordant bed case
Once the upwelling zone is reached, this second shearing zone seems to be diminished as can be seen in Figure 9. Here a cross-section of RNSu02/Ud2near the inner wall is displayed in
order to identify the length of this second shearing zone which delineates the separation zone for the discordant bed case. As this second shearing zone seems to be diminished once the up-welling zone is reached, it is assumed that the separation zone occurs again throughout the full depth of the confluence zone downstream of the upwelling zone.
Fig. 9: Cross-section at y = 0.05 W of the Reynolds normal stress RNSu02/Ud2
C. Time-dependency of the separation zone
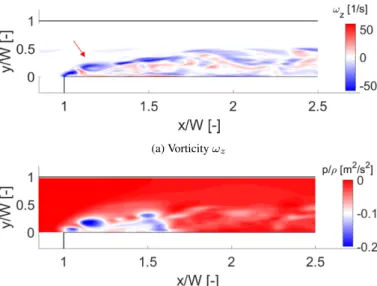
The results that are discussed untill now, are all based on time-averaged data. However, the behavior of the flow in the separa-tion zone can vary throughout time. It is found by performing a spectral analysis that there exist low-frequency dominations which could indicate fluctuations of the shear layer or the pres-ence of vortex shredding in the shear layer. The latter was also found by performing a quadrant analysis. In order to be able to distinguish periodic motions in the separation zone, 4 seconds of simulated data is studied for the discordant bed case. The vorticity around the z-axis ωzat a time frame of 4002.75
sec-onds is shown in Figure 10a. The latter indicates the presence of a clockwise turning vortex at around x=1.2 W. This was con-firmed as well by observing the instantaneous pressure p/ρ dis-played in Figure 10b. A depression can be seen at the location of the clockwise turning vortex. Therefore, it can be assumed that vortex shredding is present in the shear layer which delin-eates the separation zone. This vortex shredding was witnessed as well during the execution of the experiments discussed in the experimental study.
D. Water surface elevations and head losses
The water surface elevations in the confluence zone seem to be generally somewhat lower for the concordant bed case than for the discordant bed case. In the flow contraction zone the wa-ter surface elevations seem to be lower for the concordant bed case. When observing a longitudinal cross-section near the inner wall of the main channel, as can be seen in Figure 11, the wa-ter surface levels near the downstream corner seem to decrease more initially for the discordant bed case than for the concordant bed case. This can be attributed to the downwelling that happens here for the discordant bed case. The water surface elevations increase rapidly once the upwelling zone of the discordant bed
(a) Vorticity ωz
(b) Instantaneous (static) pressure p/ρ, relative to the atmospheric pressure
Fig. 10: Vortex shredding in the shear layer for the discordant bed case simulation at a simulation time frame of 4002.75s case is reached (near x = 1.5 W). This increase of water surface elevations occurs more slowly for the concordant bed case.
Fig. 11: Water surface elevations near the inner wall of the main channel (i.e. y = 0.05 W)
Furthermore, head loss coefficients were calculated for the main and tributary channel in order to estimate the impact of the discordant bed on the head losses according to Equations 3 and 4. ξm= Hx=−2WU2− Hx=6W x=6W 2g (3) ξt= Hy=−2W− Hx=6W U2 x=6W 2g (4) The head between two cross-sections was calculated follow-ing Equation 5 H1− H2= 1 2(h1− h2) + 1 ρgA1 Z A1 (p +ρU 2 2 )dA −ρgA1 2 Z A2 (p +ρu 2 2 )dA (5)
The head loss H1−H2will be denoted as hLand is composed
of two parts:
hL= hhL+ hnhL (6)
where the part due to the hydrostatic pressure (denoted with a superscript ”h”) is defined as follows:
hhL=
1
2(h1− h2) (7) while the part due to the static and dynamic pressures (de-noted with a superscript ”nh”) is given by:
hnhL = 1 ρgA1 Z A1 (p +ρu 2 2 )dA− 1 ρgA2 Z A2 (p +ρu 2 2 )dA (8) Note that the foregoing formulas assume that the pressure P in the OpenFOAM output is the static pressure (actually static pressure divided by the fluid density), and does not include a contribution of the hydrostatic pressures. It is strongly recom-mended to further check this assmumption (since otherwise the hh
Lcontribution would already be included in hnhL ).
To account for this uncertainty, two head loss coefficients will be calculated. A head loss coefficient due to the non-hydrostatic term hnh
L , ξnh, and a head loss coefficient due to the hydrostatic
term hh
Land the non-hydrostatic term hnhL , denoted as ξh+nh.
The results are shown in Table II.
TABLE II: Results head loss analysis Discordant bed case Concordant bed case ξnh m 0.542 0.567 ξh+nh m 1.160 1.194 ξnh t 0.464 0.411 ξth+nh 1.057 1.029
The results for the head loss coefficient based on the non-hydrostatic term of Equation 5 ξnhlead to the same conclusions
as the results for the head loss coefficient based on the sum-mation of the hydrostatic term and the non-hydrostatic term of Equation 5 ξh+nh. It seems that the head loss coefficients
be-tween the sections located in the main channel ξmare lower for
the discordant bed case than for the concordant bed case. Al-though with the presence of the vortical tube at the lee of the step, an additional source of loss is present, other sources which could induce head loss appear to decrease for the discordant bed case (e.g. less contraction due to a smaller separation zone). The head loss coefficients of the tributary ξt, however, appear
to increase for the discordant bed case. This could be related to the associated increase of the (inlet) velocity in the tributary (Ramos, Schindfessel, et al., 2018).
Furthermore, a Borda-Carnot analysis was performed
be-flow is fully recovered. The formula for the Borda-Carnot anal-ysis is given in Equation 9.
hl,BC = ( Qtot AF CZ − Qtot Ax=6W) 2 2g (9) with Qtotthe total discharge in the flume, being 0.0258 m3/s,
AF CZ the cross-sectional area of the flow contraction zone,
hl,BC the Borda-Carnot expansion head losses and Ax=6W the
cross-sectional area of the cross-section where the flow is fully recovered. In this thesis the cross-section for which the flow is fully recovered is assumed to be at x = 6W. Here, the total ve-locity magnitude seems to be (almost) uniform again over the entire section.
The cross-sectional area of the flow contraction zone in the most contracted section AF CZ is estimated based on the
posi-tion of the shear layer. The delineaposi-tion of the cross-secposi-tional area of the separation zone ASZ and flow contraction zone
AF CZ in the most contracted section are shown in Figure 12
for the concordant bed case and discordant bed case.
(a) Concordant bed case ( at x = 1.83 W) (b) Discordant bed case (at x = 1.77 W)
Fig. 12: Determination of the cross-sectional area the flow con-traction zone for the most contracted section
The expansion head losses hl,BC seem to be largest for the
discordant bed case (hL,BC = 1.32mmfor the discordant bed
case and hL,BC = 1.08mmfor the concordant bed case). Note
that the value of the expansion head loss is greatly influenced by the estimation of the position of the shear layer (and there-fore estimation of the cross-sectional area of the flow contrac-tion zone AF CZ). Previously, it was discussed that for
cross-sections located closer to the downstream corner the separation zone would detach from the inner wall (i.e. a second shear-ing zone occurs near the inner wall) and bed due to the influ-ence of the vortical tube at the lee of the step. Once a cross-section is studied which is located more downstream of the up-welling zone in the separation zone (located at around x= 1.5 W), the separation zone seems to appear over the full depth of the flow, causing a lower cross-sectional area of the flow con-traction zone.
The latter explains why the results for the Borda-Carnot anal-ysis differ from the results for the head loss coefficient of the main channel ξ . Before the upwelling zone is reached (x <
separation zone is much smaller than in the most contracted sec-tion. Therefore, the Borda-Carnot analysis for the section at the most contracted section could give a wrong perception of the head losses for a discordant bed case.
V. CONCLUSIONS
The flow inside the confluence zone is proven to be much more three-dimensional when a bed discordance of σ = 0.25 is introduced. The results of the experiments conducted by applying the SPTV technique were close to the results of the Large Eddy Simulations. However, it is advised to perform ad-ditional experiments which focus on the in-depth velocities as the flow is much more three-dimensional for the discordant bed case. Furthermore, it could be interesting to investigate (pos-sible) changes in the three-dimensional flow for different dis-charge and discordance ratios.
By observing the results of the LES of the discordant bed case, a vortical tube could be distinguished at the lee of the step, as well as a zone of downwelling and upwelling inside the sep-aration zone near the inner wall. These phenomena were also observed during the execution of the experiments.
Furthermore, the time-dependency of the separation zone was explored and the presence of vortices in the shear layer could be recognized. The latter was observed as well during the execu-tion of the experiments.
The impact of the discordant bed elevation on the head losses was estimated. It was found that, despite the bed discordance introduces with the presence of the vortical tube a possible new source of head loss, the head loss in the main channel would decrease for the discordant bed case, when compared to a con-cordant bed case. This could be attributed to a possible decrease of other head loss sources (e.g. the dimensions of the separation zone). The head loss coefficient for the tributary channel, how-ever, increased for the discordant bed case due to the increase of (inlet) velocity for the same (inlet discharge) attributed to the decrease of water depth that comes with applying a step here. It should be noted that further research is necessary to determine whether or not the hydrostatic term is already implemented in the OpenFoam output of the pressure.
VI. ACKNOWLEDGEMENTS
I would like to express my gratitude to my supervisor Prof. Dr. Ir. Tom De Mulder for giving me the opportunity to study this interesting subject. Furthermore, I would like to thank him for all the help and insights that he has given me throughout the academic year. Moreover, I would like to thank my counsellor Ir. Pedro X. Ramos for the close cooperation and endless help I received throughout the year. I am also very grateful to Stefaan Bliki and everyone at the Hydraulics Laboratory of UGent who helped me with the setup of the experimental study.
REFERENCES
Best, J. L. (1985). Flow dynamics and sediment transport at river channel confluences (Doctoral dissertation). Uni-versity of London, Birbeck College.
Biron, P., Best, J. L., & Roy, A. G. (1996). Effects of bed discor-dance on flow dynamics at open channel confluences. Journal of Hydraulic Engineering, 122(12), 676–682. Bradbrook, K., Lane, S., Richards, K., Biron, P., & Roy, A.
(2000). Large Eddy Simulation of periodic flow char-acteristics at river channel confluences. Journal of Hy-draulic Research, 38(July 2012), 207–215.
Dordevi´c, D. (2013). Numerical study of 3D flow at right-angled confluences with and without upstream plan-form curvature. Journal of Hydroinplan-formatics, 15(4), 1073–1088.
Kennedy, B. A. (1984). On playfair’s law of Accordant Junc-tions. Earth Surface Processes and Landforms, 9(May 1982), 153–173.
Ramos, P. X., Schindfessel, L., De Mulder, T., & Pego, J. (2018). Influence of bed discordance on head losses in an open channel confluence. Proceedings of the 5th IAHR Eu-rope Congress — New Challenges in Hydraulic Re-search and Engineering, 673–674.
Ramos, P. X., Pedro, J., & De Mulder, T. (2018). Confluence of Open-Channel Flows. 12as Jornadas de Hidr´aulica, Recursos H´ıdricos e Ambiente, (1), 69–75.
Weber, L. J., Schumate, E. D., & Mawer, N. (2001). Experi-ments on Flow at a 90 Open-Channel Junction. Hy-draulic Engineering, 127(May), 340–350.
Contents
List of Figures iii
List of Tables vi
1 Introduction 1
1.1 Open-Channel confluences . . . 1
1.2 Schematized confluence geometries . . . 3
1.2.1 Cross-sectional area and discharge coefficient . . . 3
1.2.2 Bed discordance . . . 4
1.2.3 Confluence angle of the confluence zone . . . 6
1.3 Flow features of the confluence zone . . . 8
1.3.1 Separation zone and shear layer . . . 10
1.3.2 Flow contraction zone and mixing layer . . . 12
1.3.3 Stagnation zone . . . 12
1.4 Objectives . . . 13
1.5 Outline . . . 14
2 Experimental study 15 2.1 Introduction . . . 15
2.2 Overview of the laboratory flume . . . 15
2.3 SPTV measurement technique . . . 17
2.3.1 Description of the tracked particles . . . 18
2.3.2 Camera settings . . . 18
2.3.3 Positioning of the cameras . . . 20
2.3.4 Execution of the experiment . . . 21
2.3.5 Processing of the images . . . 21
2.4 Hydraulic conditions . . . 24
2.4.1 Choice of the discharge ratio . . . 24
2.4.2 Choice of the bed discordance ratio . . . 25
2.4.3 Choice of the remaining hydrodynamic conditions . . . 25
2.5 Measurement quality . . . 29
2.6 Discussion of the SPTV measurements . . . 32
2.6.2 Streamlines and flow angles . . . 35
3 Numerical study 37 3.1 Introduction . . . 37
3.2 Validation of the 3D simulations . . . 38
3.2.1 Velocity field . . . 38
3.2.2 Turbulence field . . . 43
3.3 Comparison of the numerical results . . . 45
4 Separation zone 51 4.1 Flow features . . . 51
4.1.1 Concordant bed case . . . 52
4.1.2 Discordant bed case (σ = 0.25) . . . 54
4.2 Width of the separation zone . . . 57
4.2.1 Concordant bed case . . . 58
4.2.2 Discordant bed case (σ = 0.25) . . . 60
4.3 Time-dependency of the separation zone . . . 63
4.3.1 Introduction . . . 63
4.3.2 Data selection . . . 64
4.3.3 Energy density spectrum analysis . . . 66
4.3.4 Quadrant Analysis . . . 69
4.3.5 Vortex shredding . . . 72
5 Water surface elevations and head losses 77 5.1 Water surface levels . . . 77
5.2 Head loss coefficients . . . 81
5.3 Borda-Carnot analysis . . . 85
6 Conclusions and recommendations 89
Appendices 97
A Additional pictures experimental setup 99
B Matlab code transformation of coordinate system 101
C Matlab code velocity field 105
D Visualization Reynolds stress tensor components at the position of the shear
layer 113
List of Figures
1.1 Location shifting of a confluence zone (a,b,c) with increasing level of confluent
discharges (Kennedy, 1984) . . . 2
1.2 Schematized figure conceptual model of the bed morphology in a confluence zone proposed by Best (1985) . . . 5
1.3 Schematized view of the confluence angle between the main and tributary channel 6 1.4 Results map analysis performed by Best (1985) . . . 7
1.5 Schematized representation confluence zone features after Best (1985) . . . 9
1.6 Schematized respresentation of the recirculation zone after Best (1985) . . . 10
1.7 Overview of the chapters in this thesis (after Creelle (2017)) . . . 14
2.1 Overview flume in Hydraulics Lab of UGent . . . 16
2.2 Tributary step . . . 16
2.3 Principle of the (S)PTV tracking of particles (Creelle, 2017) . . . 17
2.4 Flume seeded with particles . . . 18
2.5 Installed frame on the flume . . . 19
2.6 Detail of the mounted cameras . . . 19
2.7 Positioning of the cameras . . . 20
2.8 Summary of the SPTV processing after Creelle (2017) . . . 22
2.9 Example of the tracked particles . . . 23
2.10 Example of the tracked particle paths . . . 24
2.11 Schematic overview of the Froude scaling . . . 27
2.12 Measurement results velocities: (a) Test 2, (b) Test 4 . . . 30
2.13 Longitudinal velocity in the main channel at y= 0.75 W for four different tests . 31 2.14 Longitudinal velocity in the main channel of Test 1 at y= 0.75 W . . . 31
2.15 Dimensionless longitudinal surface velocity . . . 32
2.16 Dimensionless transverse surface velocity . . . 33
2.17 Dimensionless horizontal surface velocity . . . 34
2.18 Dimensionless total horizontal surface velocity at different cross-sections . . . 35
2.19 Streamlines . . . 36
2.20 Flow Angles . . . 36
3.1 Comparison velocities concordant case for z/W = 0.278 . . . 39 3.2 Longitudinal cross-section at y = 0.8 W of the longitudinal surface velocity
com-3.3 Cross-sections of the longitudinal velocity component which intersect the separa-tion zone for a concordant case . . . 40 3.4 Horizontal surface velocities . . . 41 3.5 Longitudinal cross-section at y = 0.8 W of the longitudinal surface velocity
com-ponent for a discordant case . . . 42 3.6 Cross-sections of the longitudinal surface velocity component which intersect the
separation zone for a discordant case . . . 43 3.7 Cross-sections of the T KE/Ud2 at x = 1.667 W for the concordant case . . . 44
3.8 Cross-sections of the TKE at x= 1.33 W for the discordant case . . . 45
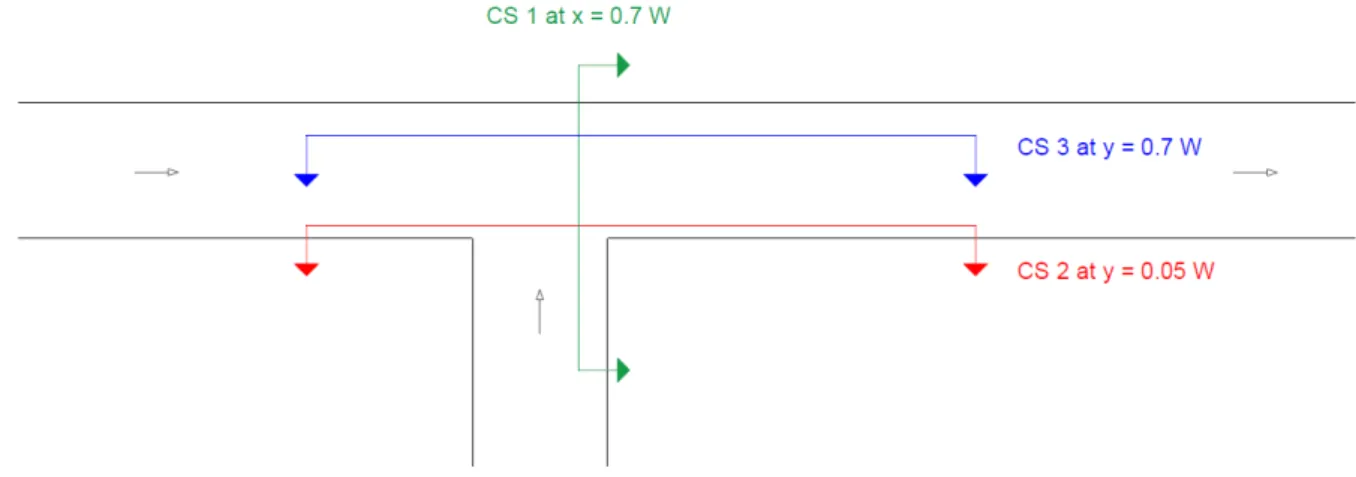
3.9 Overview cross-sections (CS) made for the flow feature analysis . . . 46 3.10 Cross-sections flow feature analysis for the concordant case . . . 47 3.11 Cross-sections flow feature analysis for the discordant case with σ = 0.25 . . . 48 3.12 Detail cross-section CS1: transverse cross-section at x= 0.7 W . . . 49 3.13 Presence of a vortex at the lee of the step for a discordance ratio of σ = 0.25 . . 50 4.1 Location of detailed plot in planview and of cross-sections (CS) made for analysis
of flow features . . . 52 4.2 Detailed plot of the separation zone at the surface for a concordant case . . . 52 4.3 CS1: longitudinal cross-section at y = 0.05 W for a concordant case . . . 53 4.4 Transverse cross-sections (CS2 and CS3) for a concordant case . . . 54 4.5 Detail plot of the separation zone at the surface for the discordant case (σ = 0.25) 54
4.6 CS1: longitudinal cross-section at y = 0.05 W for the discordant case (σ = 0.25) 55
4.7 Downwelling near the downstream corner for the discordant bed case (σ = 0.25) 56
4.8 Upwelling near x = 1.5 W for the discordant bed case (σ = 0.25) . . . 56 4.9 Position of the shear layer for a concordant bed case at x =1.2 W . . . 58 4.10 Position of the shear layer for a concordant bed case at x =1.5 W . . . 59 4.11 Position of the shear layer for a concordant bed case at x =1.83 W . . . 59 4.12 Position of the shear layer for the discordant bed case at x =1.2 W . . . 60 4.13 Position of the shear layer for the discordant bed case at x =1.5 W . . . 61 4.14 Position of the shear layer for the discordant bed case at x =1.77 W . . . 61 4.15 Reynolds normal stress RNSu02/Ud2 . . . 62 4.16 Reynolds normal stress RN Su02/Ud2 for the discordant bed case at y=0.05W . . . 62 4.17 Overview position probes for spectral analysis . . . 63 4.18 Simulated velocity in the probe PDC4 for the discordant bed case . . . 65 4.19 Sensitivity of energy density spectrum to length of temporal domain . . . 65 4.20 Comparison EDS velocity fluctuations shear layer and flow contraction zone for
a duration of 10T . . . 67 4.21 Comparison EDS velocity fluctuations concordant case and discordant case for a
duration of 10T . . . 68 4.22 Overview quadrant analysis probes for the discordant case: Cross-section contour
plot for RN Su02/U2
4.24 Overview quadrant analysis probes for the concordant case: Cross-section contour plot for RN Su02/U2
d and horizontal velocity vectors for z = 0.861 hd . . . 71
4.25 Quadrant analysis for the longitudinal and transverse velocity fluctuation nor-malized with u0RM S for the concordant case for a duration of 10T . . . 71 4.26 Fast Fourier transform (fft) plots of the longitudinal velocity u and transverse
velocity v of the probes located in the shear layer of the discordant bed case for a duration of 10T . . . 73 4.27 Occurence of a vortex at a simulation time frame of 4002.75s for the discordant
bed case . . . 74 4.28 Schematized overview of the vortex shredding in the shear layer witnessed during
the execution of the experimental study (discordant bed case) . . . 75 5.1 (Virtual) water level surface plot (i.e. the shape of the curved rigid lid) . . . 78 5.2 Water level surface at y=0.5W . . . 79 5.3 (Virtual) water level surface at y=0.05W . . . 79 5.4 (Virtual) water level surface . . . 80 5.5 Water level surface at y = 0 W . . . 80 5.6 Water surface for curved rigid LES between two cross-sections . . . 81 5.7 (Virtual) water level surface . . . 82
5.8 Most contracted section (x = 1.83 W) of the concordant bed case . . . 86
5.9 Most contracted section (x = 1.77 W) of the discordant bed case . . . 86
A.1 Honeycomb structure as adopted at inlets of the tributary and main channel . . 99
A.2 Polystyrene boards at inlets to prevent formation of small surface waves . . . 100 A.3 Additional lighting and tape at the walls to reduce diffraction . . . 100 A.4 Outlet of the flume . . . 100 D.1 Reynolds normal stress components for the discordant bed case at x = 1.2 W . . 114 D.2 Reynolds shear stress components for the discordant bed case at x = 1.2 W . . . 115 E.1 Detail plot separation zone at z = 0.5hd for a concordant case . . . 117
E.2 Detail plot separation zone at z = 0.7hd for a concordant case . . . 117
E.3 Detail plot separation zone at z = 0.8hd for a concordant case . . . 118
E.4 Detail plot separation zone at z = 0.8hd for the discordant case . . . 118
E.5 Detail plot separation zone at z = 0.7hd for the discordant case . . . 119
E.6 Detail plot separation zone at z = 0.5hd for the discordant case . . . 119
List of Tables
2.1 Flume characteristics UGent . . . 17 2.2 Camera settings . . . 19 2.3 Flume characteristics Weber et al. (2001) . . . 26
2.4 Hydrodynamic conditions experiments Weber et al. (2001) and UGent (2020) . . 29
4.1 Overview position probes for spectral analysis discordant case . . . 64 4.2 Overview position probes for spectral analysis discordant case . . . 64 5.1 Results head loss analysis . . . 84 5.2 Results of the Borda-Carnot analysis . . . 85
List of Abbreviations
Abbreviation Explanation
DMC Downstream Main Channel
TC Tributary Channel
UMC Upstream Main Channel
W Width
3D Three-Dimensional
2D Two-Dimensional
LES Large Eddy Simulation
PIV Particle Image Velocimetry
SPTV Surface Particle Tracking Velocimetry
SZ Separation zone
RZ Recirculation zone
RANS Reynolds Averaged Navier Stokes
fps frames per second
px pixel
ADV Acoustic Doppler Velocimeter
CS Cross-Section
PCC Probe for the Concordant bed Case
PDC Probe for the Discordant bed Case
EDS Energy Density Spectrum
List of Symbols
Symbol Name Unit
q Discharge ratio
-Qm Discharge in the upstream main channel m3/s
Qt Discharge in the tributary channel m3/s
Qtot Total discharge in the downstream main channel m3/s
σ Bed discordance ratio
-s Step height m
h Water depth m
hd Water depth at the downstream monitoring point m
α Confluence angle ◦
ht Water depth in the tributary channel m
WSZ Width of the separation zone m
ρ Density of the water kg/m3
µsw Dynamic viscosity of the water kg/(ms)
υ Kinematic viscosity m2/(s) Re Reynolds number -F r Froude number -g Gravity acceleration m/s2 u Velocity in x-direction m/s v Velocity in y-direction m/s w Velocity in w-direction m/s
Ud Cross-sectional averaged velocity in x-direction m/s
at the downstream monitoring point
Vt Total velocity m/s
p Pressure P a
T KE Turbulent Kinetic Energy m2/s2
RN S Reynolds Normal Stress m2/s2
RSS Reynolds Shear Stress m2/s2
u0 Velocity fluctuation in x-direction m/s
v0 Velocity fluctuation in y-direction m/s
w0 Velocity fluctuation in z-direction m/s
uRM S Root-mean-square value of the velocity in the x-direction m/s
ξ Head loss coefficient
-H Water head m
A Cross-sectional area m2
Chapter 1
Introduction
1.1
Open-Channel confluences
Open-channel networks consist of branches and junctions (Rice, 2008). An open-channel net-work has a free surface and can occur under different forms, such as natural rivers, man-made canals, hydraulic structures, and urban networks. Since the beginning of civilization, open-channel networks have been a crucial part of life on earth. Since ancient times, large cities were often built in such a way that they would be located close to a large river to fulfill the demand for water. The Romans built aqueducts to provide the much needed water to cities situated less close to sources of drinkable water and drainage networks were, and are still, an important part of the wastewater disposal system. Irrigation systems were built consisting of small channels to supply water to the crops of local farmers.
Nowadays, these techniques are still used. For example, the man-made Albert Canal was mainly built for navigation purposes, but also supplies drinking water (taken from the river Meuse) to no less than 3 million Belgians (Schepens, 2019). Man-made canals and navigable rivers are of vital importance for the shipping industry as well. In Flanders alone, no less than 1395 kilo-metres of navigable waterways ensure the rapid distribution of goods coming from one of the largest ports in the world, the port of Antwerp (Statistiek Vlaanderen, 2020). In order to meet the need for waterways, the existing waterways must be sufficiently maintained. Settlement of sediment can cause a lack of draft that a ship needs to sail comfortably. Periodic removal of sediment therefore requires a lot of work. These are just a few examples of the importance of open-channel networks. It is therefore crucial to understand the functioning of a fluvial network in order to gain more information on flood control, irrigation, erosion, sediment deposition and the transport of pollutants and nutrients (Best, 1985).
In open channel networks two types of junctions can be discerned: bifurcations and confluences. Confluences, which are the subject of the present thesis, consist of two streams which merge into one downstream channel. In nature confluences happen when two streams meet. But also in urban networks, confluences can occur, for example in drainage systems. Furthermore, con-fluences occur regularly in hydraulic structures, e.g.in bypass canals of natural type fish passes. Two types of junctions should be used here, one bifurcation to divert a part the stream and one confluence to reconnect the fish passage with the main stream.
The focus of this thesis is mainly on confluence of rivers and man-made canals. These confluences ensure the transport of water, the transport of pollutants coming from for example factories, the mixing of nutrients and transport of sediment. Confluences are very important for the drainage of water and sediment. Large amounts of water and sediment are added from one flow to another. In rivers and canals that discharge into the sea, confluences can play an important role in the routing of a flood through the fluvial network in order to prevent too much damage (Best, 1985). Furthermore, these confluences induce backwater effects, which cause flood risks. The size and location of a confluence zone can change over time, depending on the flow regimes of both flows (Kennedy, 1984), as can be seen in Figure 1.1.
Figure 1.1: Location shifting of a confluence zone (a,b,c) with increasing level of confluent discharges (Kennedy, 1984)
Changes in confluences can cause local changes, as well as changes in the upstream and down-stream properties of the down-stream and its bedding. In the past, many studies have been performed by sedimentologists on the changes of the bed in a confluence zone by scour and the deposit of sediments. The focus of hydraulic engineers, on the other hand, is primarily on the flow characteristics of the confluence zone. Confluences also arouse a lot of interest in other research areas, such as ecology (Best, 1985). This research particularly focuses on the flow characteristics in a confluence zone.
The flow characteristics in a confluence zone are controlled by several different factors (Best, 1985):
• The planform geometry, including the confluence angle and planform shape of the up-stream and post-confluence channels.
• The ratio of discharges of the main stream and tributary stream.
• The presence and nature of any bed height discordance between the levels of the channel beds at the location of the confluence.
• A difference in density between the incoming flows.
1.2
Schematized confluence geometries
1.2.1 Cross-sectional area and discharge coefficient
In order to be able to carry out a representative study for different rivers and canals, some simplifications have to be assumed. The process of erosion occurs in every stream. The degree of erosion depends on several factors such as discharge, water velocity and bed sediment type. Due to processes such as erosion, most natural rivers have irregular shapes. Some rivers have cross sections that are V-shaped, some are U-shaped, but most rivers will have very irregular cross sections. Another story can be found in man-made canals. These usually have a prede-termined cross section in the form of a trapezoid or rectangle. For the research in this thesis, the cross section is simplified to a rectangular cross section. This form of cross-section was also used in earlier investigations (lab experiments, as well as numerical modelling) and allows a possible comparison with these investigations (Best, 1985; Biron, Best, et al., 1996; Dordevi´c, 2013; Penna et al., 2018; Weber et al., 2001).
In this research, an asymmetric confluence is considered, consisting of a straight main channel and a straight tributary channel at right angles to the main channel. It is assumed that the main channel and tributary channel of the confluence have the same width. In practice, however, the downstream main channel will often have a larger average width over its length than the upstream main channel and tributary channel (Best, 1985; Kennedy, 1984). The reason for this can be that the downstream main channel will often have to handle a larger discharge than the upstream main channel and the tributary channel. The ratio of the discharge in the upstream main channel to the total discharge in the post-confluence part of main the channel is also called the discharge ratio q and is calculated using Equation 2.3:
q = Qm Qm+ Qt
= Qm
Qtot
(1.1)
Where Qtot represents the total discharge in the main channel post-confluence, Qtthe discharge
in the tributary channel and Qm the discharge in the main channel before the confluence zone.
The discharge is expressed in m3/s, while the discharge ratio is dimensionless. Several discharge
ratios have been examined in the past. These range from studies covering a broad spectrum of discharge ratios (Best, 1985; Creelle, 2017; Weber et al., 2001), to studies showing a predomi-nantly dominant tributary discharge (Schindfessel et al., 2015). The latter case ensures that the features of a confluence zone become very pronounced and can lead to an undesirable impact on sedimentation and erosion which is discussed in a part of the work performed by Schindfessel et al. (2015).
In this thesis, however, a more balanced discharge ratio is investigated. In the literature, a discharge ratio of 0.58 was often investigated (Dordevi´c, 2013; Weber et al., 2001). In order to allow for a possible comparison with the literature, this discharge ratio was applied for the experimental and numerical studies in this research.
1.2.2 Bed discordance
The geometry and flow characteristics of two streams that merge channels affect the bed mor-phology of the confluence zone if the bed is degradable. This can imply scouring of the bed material and the occurrence of bars made out of deposited sediment in the confluence zone (Best, 1985). This may be schematized into a difference in bed elevations between the two chan-nels. Most confluences of natural rivers experience a difference in bed elevation (Biron, Best, et al., 1996; Kennedy, 1984). This difference is called ”a discordant bed elevation” between the two channels. If both channels show the same bed elevation, this is called ”a concordant bed elevation”.
The difference in bed elevation occurs regularly due to a scoured bed. A possible reason for this scoured bed may be the difference in channel-forming discharges between both channels. A remarkable relationship between the cross-sectional area of a channel and the bed discordance was found by Kennedy (1984): the larger the cross-sectional area of one channel compared to the other channel, the larger the bed discordance will be.
Furthermore, a discordance between two channels can also occur due to a different bed and bank material between the main channel and tributary channel. This can occur for example
the bed of the main channel may consist of rock, while the flood-plain, and consequently the bed of the tributary channel, mainly consists of the finer deposited sediment of the main channel.
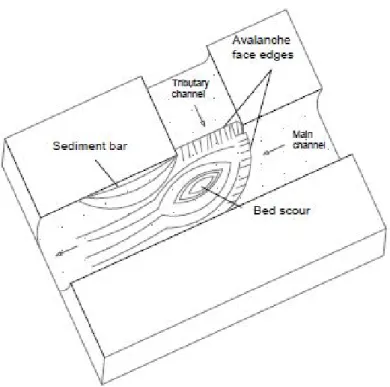
Best (1985) presented a conceptual model of the bed morphology based on experimental tests performed under live bed conditions in asymmetrical confluences with equal channel width. One of the findings made by Best (1985), was the occurrence of so-called avalanche faces at the mouths of the tributary channel and main channel. These avalanche edges are schematized in Figure 1.2 . The avalanche faces are steep slopes that occur close to the confluence.
Figure 1.2: Schematized figure conceptual model of the bed morphology in a confluence zone proposed by Best (1985)
A lot of research has been done in the past between two channels for which there is no bed discordance. Only a few studies were carried out that take the changing bed morphology into account. These studies schematize the avalanche face at the mouth of the tributary by applying a step in the tributary channel. In all these studies it was concluded that the bed discordance creates a highly three dimensional flow and changes the features of the confluence over its depth. This three dimensional flow that is observed in the confluence for a discordant bed elevation between both channels, is an interesting topic to research (Birjukova Canelas et al., 2019; Biron, Best, et al., 1996; Dordevi´c, 2013).
Since a bed discordance brings about some remarkable phenomena and is often present in rivers, this thesis will examine the confluence zone with a bed discordance. The avalanche face that occurs at the tributary mouth will be schematized as the application of a sharp-edged step in the tributary. Apart from this, the bed of both channels is assumed to be even. The bed dis-cordance ratio, σ is the ratio between the height of the step applied in the tributary, s, and the averaged water depth of a downstream monitoring section over the width of the main channel, hd:
σ = s
hd
(1.2)
Both the step height and water depth at the downstream monitoring point are expressed in meters. The bed discordance ratio self is therefore a dimensionless parameter. In reality, the discordance ratio itself can have a value of up to 0.5 (Kennedy, 1984). For the experimental and numerical research performed for this thesis, the intermediate value of 0.25 is taken as σ. This discordance ratio is also simulated in the numerical work of Dordevi´c (2013), which allows a possible comparison with this research.
1.2.3 Confluence angle of the confluence zone
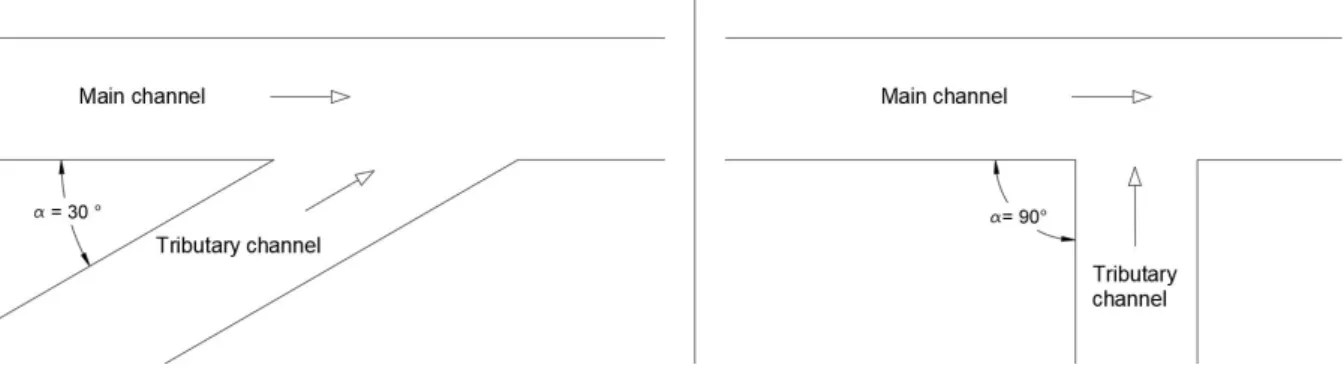
The tributary channel can join the main channel at different angles. The confluence angle is the angle made between the main channel and the tributary channel, as displayed in Figure 1.3.
Low angle junctions, as can be seen in the left part of Figure 1.3, create conditions that ensure the relatively smooth routing of flow and sediment throughout the junction and are therefore desirable for the design of confluences (Best, 1985; Penna et al., 2018). A higher confluence angle, as displayed on the right of Figure 1.3, is therefore less desirable. Nevertheless, a map analysis performed by Best (1985) on 232 rivers and channels , shows that the most common confluence angle lies between 80 and 100 degrees. The most common case in this map analy-sis is a 90 degree junction (Best, 1985). The results of this map analyanaly-sis can be seen in Figure 1.4.
Figure 1.4: Results map analysis performed by Best (1985)
In previous research of the confluence zone, a confluence angle of 90 degrees is often chosen (Best, 1985; Biron, Best, et al., 1996; Dordevi´c, 2013; Weber et al., 2001). Therefore, this research focuses on a confluence angle of 90 degrees, as it is frequently observed in nature and allows the comparison with previous research.
1.3
Flow features of the confluence zone
In the introduction the importance of research into the confluence zone was already emphasized. In the literature a distinction is made between different features of a confluence zone. The flow features of the confluence zone not only have a great influence on the flow conditions pre- and post-confluence, they will also have an influence on the bed morphology. In this section the features of the confluence zone will be discussed and the methodology applied in this thesis will be explained.
This research is mainly focused on the flow characteristics in the confluence zone with a bed discordance, for which no further unevenness of the beds of both channels is taken into account. Nevertheless, the effects of the flow features on the bed morphology will be briefly mentioned in this section.
The features of the confluence zone are further explained by means of a schematic representation of a confluence zone given in Figure 1.5. Note that the features in this schematized confluence zone are only representative over the entire depth of the confluence if a concordant bed case is assumed (since the three-dimensional effects are relatively limited). If a step is placed in the tributary, the flow in the confluence zone will become highly three-dimensional (3D) (Biron, Best, et al., 1996; Bradbrook et al., 2000). This can cause some features to change or even disappear for a certain water depth. This will be discussed more in detail later on.
The origin of the coordinate system used for numerical and experimental analysis is at the loca-tion of the upstream corner at the bed of the main channel. A downstream monitoring secloca-tion is also used in the numerical and experimental analysis. This is located in the downstream main channel, DMC, in a section for which the flow should once again behave uniformly. A section for which uniform flow is present is defined in this thesis as a section for which the flow has the same water depth across the width of the channel and the same velocity across the entire cross section. The influence of the friction of the walls is hereby neglected. The downstream monitoring section is assumed to be located at a dimensionless distance of 16 times the width of the channel, 16W, from the downstream corner. This is also shown in Figure 1.5.
1.3.1 Separation zone and shear layer
The water in the channels located far ahead of the confluence flows parallel to the channel walls. Once the flow coming from the tributary channel, TC, approaches the confluence, it will be deflected by the flow coming from upstream main channel, UMC, towards the downstream main channel, DMC. Flow separation occurs at the downstream junction corner due to the abrupt change in geometry (Best, 1985). This creates a complex zone, called the separation zone. In this thesis, the boundary of the separation zone is considered to be the shear layer. This is a layer of high turbulence due to the mixing of the faster flow coming from the tributary and the flow in the separation zone. The width of the separation zone, WSZ, is determined by the point
of the separation zone furthest from the inner wall.
It has been found in the literature that for a decreasing discharge ratio, due to a decreasing tributary flow, the separation zone length will increase. However, it should be noted that the change of this length will remain relatively small for a changing discharge ratio (Creelle, 2017). The width, on the other hand, shows relatively large changes with a changing discharge ratio. A larger tributary flow, causing a lower discharge ratio, will cause a wider separation zone (Creelle, 2017).
In the separation zone itself there is often a complex flow. For instance, for some circumstances an upstream flow may occur at the inner bank in a part of the separation zone. This upstream flow can then cause a recirculation of the flow, as shown in Figure 1.6.
The literature does not always distinguish the separation zone and the recirculation zone. In this research, however, the recirculation zone is defined as the zone in which recirculation of the flow occurs. This zone is located in the separation zone but is not always present (Dordevi´c, 2013). The dimensions of the recirculation zone can be determined using various methods, such as the isovel method (Dordevi´c, 2013). The isovel method delineates this zone by means of the isoline of zero velocity along the x-axis (Ramos et al., 2019).
In the previous paragraph it was mentioned that within the confluence processes of scour and sediment deposition take place, yielding a degraded bed. According to Biron, Best, et al. (1996), the bed morphology can have a big influence on the presence of a recirculation zone. According to their observations, a recirculation zone is not always present at natural confluences. This can be caused by erosion of the inner bank of the tributary which lowers the actual merging angle of the tributary flow and limits flow detachment (Biron, Best, et al., 1996). Due to this reduction in flow detachment it is possible that the recirculation zone is diminished.
In the literature it was found that sediment is often deposited in the separation zone. This would create a sediment bar close to the downstream corner that extends further into the separation zone in the direction of the DMC. This sediment bar was already discussed in the coneceptual model proposed by Best (1985) and can be seen in Figure 1.2. The possible occurrence of a sediment bar in the separation zone is caused by the reduced velocities in this zone (Biron et al., 1993; Hager, 1987). As this sediment bar may be undesirable , it would be interesting to decrease the separation zone in the design of a man-made confluence (Hager, 1987). Therefore, the question arises how the separation zone may be diminished. In man-made confluences, bed discordance may be introduced to this end. According to the literature, applying a bed discor-dance at the interface between the main channel and the tributary channel could obliterate the flow deflection at the bed (Biron, Best, et al., 1996; Ramos, Schindfessel, De Mulder, et al., 2018).
Furthermore, a discordant bed elevation between the main and tributary channel could obliter-ate the presence of a recirculation zone at the surface according to Dordevi´c (2013). Dordevi´c (2013) investigated the dimensions of the recirculation zone and separation zone for different discordance ratios using a three-dimensional numerical RANS model. The dimensions of the flume that were used in the research performed by Dordevi´c (2013) were based on the experi-mental research by Weber et al. (2001). It was found that the recirculation zone at the surface would be destroyed for discordance ratios larger than or equal to 0.25 due to the large 3D flow.
Like the other flow features, the characteristics of the separation zone change over time. For instance, it was reported by Yoshimura et al. (2016) that the size of the separation zone fluctu-ates over time for a concordant bed case. The research carried out by Yoshimura et al. (2016) , was done using numerical models consisting of Large Eddy Simulations (LES) and an experi-mental study using the Particle Image Velocimetry (PIV) technique. Since a time-dependency
is observed for a concordant case, it is certainly interesting to study this for a discordant case as well.
1.3.2 Flow contraction zone and mixing layer
The TC flow pushes the flow coming from the UMC towards the outer wall. As a result, the flow coming from the UMC flows over a width smaller than the full width of the channel. The UMC flow is contracted by the flow coming from the TC. The flow from the TC is also contracted between the UMC flow and the separation zone. This creates a zone of increased velocities between the separation zone and the outer wall, called the flow contraction zone. Hager (1987) defined the occurence of the flow contraction zone as : ”The separation zone with its relatively large volume contracts the rest of the flow into a region of high velocities and consequentely decreased local water depths.”
In this flow contraction zone the mixing layer is located as well, a layer of gradients in the (lon-gitudinal) velocities of the merging flows, hence contributing to the production of turbulence and mixing.
From the literature it can be deduced that the bed morphology in this flow contraction zone may consist mainly of coarser material due to the higher velocities. Furthermore, it is possible that at the location of the mixing layer an increased scouring effect may occur due to the presence of enhanced turbulence and secondary flow structures.
1.3.3 Stagnation zone
Because both the UMC flow and the TC flow are deflected towards the outer banks, a zone of decreasing velocities is created near the upstream junction corner, called the stagnation zone (Best, 1985). Due to this reduction of velocity on this zone, a higher water depth can be found here. The location of the stagnation zone changes with the discharge ratio. For a low discharge ratio, due to a higher tributary inflow, the stagnation zone shifts to the main channel. Whereas for a high discharge ratio, due to a lower tributary inflow, the stagnation zone will be shifted to the tributary (Creelle, 2017). Furthermore, it was reported that the bed sediments in this zone are generally finer than the mean due to the reduced velocities (Best, 1985; Biron et al., 1993). In large confluences of streams, this zone can even be a rest place for fish and other animals and can, therefore, have an important impact on the ecology in and around the river of canal.
1.4
Objectives
This thesis was created during the outbreak of the COVID-19 pandemic. Because of this, the objectives were slightly adjusted throughout the year. Originally, the thesis was supposed to include mainly experimental results. As the circumstances did not allow for frequent visits to the Hydraulics Lab of UGent, fewer experiments were carried out than foreseen.
The previous paragraphs show that the presence of a bed discordance because of scour or other phenomena can create complex structures in the confluence zone. A first objective of this study is to gain more insight into the flow features and dimensions of the separation zone for a dis-cordant bed case (O1). For this purpose, lab experiments would be performed to gain more information about the separation zone. Originally the lab experiments would consist out of velocity measurements using the Surface Particle Tracking Velocimetry (SPTV) technique and depth measurements. Furthermore, it was foreseen that the velocity measurements would be carried out at three different locations (downstream in the confluence, upstream of the confluence and in the tributary). Due to the circumstances only velocity measurements were performed at one location (downstream in the confluence zone with a focus on the separation zone). To compensate for these unforeseen circumstanstances, numerical models consisting of Large Eddy Simulations will be used to study the in-depth characteristics of the separation zone. Here the focus is mainly directed to the presence or absence of a recirculation zone at the surface (as discussed in Dordevi´c (2013)). Furthermore, a spectral and quadrant analysis will be performed of the shear layer delineating the separation zone in order to study the time-dependency of the separation zone.
The second objective of this study is to perform an analysis of the head losses in the flume (O2). Initially, the head losses would be estimated by performing water depth measurements on the flume of the Hydraulic Lab of UGent. Due to the circumstances, the head loss analysis will be performed using the LES.
Finally, an auxiliary objective of this research is to obtain additional data by performing lab experiments to verify the reliability of (future) numerical models (O3). It is evident that less experimental data could be created than foreseen due to the outbreak of the COVID-19 pan-demic.
1.5
Outline
The outline of this thesis is explained on the basis of Figure 1.7. First, an experimental study will be performed in Chapter 2. Following this, a 3D simulation of a numerical model will be post-processed and compared with the experimental results in Chapter 3. The flow features inside the separation zone will be discussed in Chapter 4. For this the experimental results, the numerical model and some additional qualitative experiments consisting of pictures of the existing flume in the lab will be used. Here, the dimensions of the separation zone for a discordant bed elevation case will be estimated. Furthermore, a spectral and quadrant analysis will be performed to study the time-dependency of the separation zone. In Chapter 5, the head losses in the flume will be estimated and a Borda-Carnot analysis will be performed based on the numerical model from Chapter 3 and the results from Chapter 4. A final chapter will summarize some conclusions drawn from this research.