CLIMATE CHANGE
Scientific Assessment and Policy Analysis
WAB 500102 029
Balancing the carbon market
Overview of carbon price estimates
CLIMATE CHANGE
SCIENTIFIC ASSESSMENT AND POLICY ANALYSIS
BALANCING THE CARBON MARKET
Overview of carbon price estimates
Report
500102 029 ECN-B--09-007Author
T. Bole March 2009This study has been performed within the framework of the Netherlands Research Programme on Scientific Assessment and Policy Analysis for Climate Change (WAB), Balancing the Carbon Market
Page 2 of 52 WAB 500102 029
Wetenschappelijke Assessment en Beleidsanalyse (WAB) Klimaatverandering
Het programma Wetenschappelijke Assessment en Beleidsanalyse Klimaatverandering in opdracht van het ministerie van VROM heeft tot doel:
• Het bijeenbrengen en evalueren van relevante wetenschappelijke informatie ten behoeve van beleidsontwikkeling en besluitvorming op het terrein van klimaatverandering;
• Het analyseren van voornemens en besluiten in het kader van de internationale klimaatonderhandelingen op hun consequenties.
De analyses en assessments beogen een gebalanceerde beoordeling te geven van de stand van de kennis ten behoeve van de onderbouwing van beleidsmatige keuzes. De activiteiten hebben een looptijd van enkele maanden tot maximaal ca. een jaar, afhankelijk van de complexiteit en de urgentie van de beleidsvraag. Per onderwerp wordt een assessment team samengesteld bestaande uit de beste Nederlandse en zonodig buitenlandse experts. Het gaat om incidenteel en additioneel gefinancierde werkzaamheden, te onderscheiden van de reguliere, structureel gefinancierde activiteiten van de deelnemers van het consortium op het gebied van klimaatonderzoek. Er dient steeds te worden uitgegaan van de actuele stand der wetenschap. Doelgroepen zijn de NMP-departementen, met VROM in een coördinerende rol, maar tevens maatschappelijke groeperingen die een belangrijke rol spelen bij de besluitvorming over en uitvoering van het klimaatbeleid. De verantwoordelijkheid voor de uitvoering berust bij een consortium bestaande uit PBL, KNMI, CCB Wageningen-UR, ECN, Vrije Univer-siteit/CCVUA, UM/ICIS en UU/Copernicus Instituut. Het PBL is hoofdaannemer en fungeert als voorzitter van de Stuurgroep.
Scientific Assessment and Policy Analysis (WAB) Climate Change
The Netherlands Programme on Scientific Assessment and Policy Analysis Climate Change (WAB) has the following objectives:
• Collection and evaluation of relevant scientific information for policy development and decision–making in the field of climate change;
• Analysis of resolutions and decisions in the framework of international climate negotiations and their implications.
WAB conducts analyses and assessments intended for a balanced evaluation of the state-of-the-art for underpinning policy choices. These analyses and assessment activities are carried out in periods of several months to a maximum of one year, depending on the complexity and the urgency of the policy issue. Assessment teams organised to handle the various topics consist of the best Dutch experts in their fields. Teams work on incidental and additionally financed activities, as opposed to the regular, structurally financed activities of the climate research consortium. The work should reflect the current state of science on the relevant topic. The main commissioning bodies are the National Environmental Policy Plan departments, with the Ministry of Housing, Spatial Planning and the Environment assuming a coordinating role. Work is also commissioned by organisations in society playing an important role in the decision-making process concerned with and the implementation of the climate policy. A consortium consisting of the Netherlands Environmental Assessment Agency (PBL), the Royal Dutch Meteorological Institute, the Climate Change and Biosphere Research Centre (CCB) of Wageningen University and Research Centre (WUR), the Energy research Centre of the Netherlands (ECN), the Netherlands Research Programme on Climate Change Centre at the VU University of Amsterdam (CCVUA), the International Centre for Integrative Studies of the University of Maastricht (UM/ICIS) and the Copernicus Institute at Utrecht University (UU) is responsible for the implementation. The Netherlands Environmental Assessment Agency (PBL), as the main contracting body, is chairing the Steering Committee.
For further information:
Netherlands Environmental Assessment Agency PBL, WAB Secretariat (ipc 90), P.O. Box 303, 3720 AH Bilthoven, the Netherlands, tel. +31 30 274 3728 or email: wab-info@pbl.nl.
Preface
This report was commissioned by the Netherlands Programme on Scientific Assessment and Policy Analysis (WAB) Climate Change. This report has been written by the Energy research Centre of the Netherlands (ECN), as a deliverable of the WAB project 'Balancing the carbon market'. The steering committee of this project consisted of Gerie Jonk (Ministry of Environment), Marcel Berk (Ministry of Environment), Joelle Rekers (Ministry of Economic affairs), Maurits Blanson Henkemans (Ministry of Economic Affairs), Bas Clabbers (Ministry of Agriculture), Remco vd Molen (Ministry of Finance) and Leo Meyer (PBL).
The author acknowledges receiving helpful comments from Michel den Elzen (PBL) and Jos Sijm (ECN).
Page 4 of 52 WAB 500102 029
This report has been produced by:
Tjaša Bole
Energy research Centre of the Netherlands (ECN)
Name, address of corresponding author:
Tjaša Bole
Energy research Centre of the Netherlands (ECN) Unit Policy Studies
P.O. Box 56890
1040 AW Amsterdam, The Netherlands http://www.ecn.nl
E-mail: bole@ecn.nl
Disclaimer
Statements of views, facts and opinions as described in this report are the responsibility of the author.
Copyright © 2009, Netherlands Environmental Assessment Agency
All rights reserved. No part of this publication may be reproduced, stored in a retrieval system or transmitted in any form or by any means, electronic, mechanical, photocopying, recording or otherwise without the prior written permission of the copyright holder.
Contents
Executive Summary 7 Samenvatting 9 List of acronyms 11 1 Introduction 13 2 Methodology 152.1 Approach and inclusion criteria for literature overview 15
2.2 Results presentation 16
2.3 Approach to assessing the predictive power of model-based carbon price
projections 18
3 Overview of model results and analysis 19
3.1 Models assuming perfect carbon markets and full participation of developing
countries 19
3.2 Traded volumes, costs and benefits of climate policies 24
3.3 Commercial projections 26
4 Uncertainties and limitations of model-based carbon price projections 27
5 Performance of past model-based projections 31
6 Conclusions 35
7 References 37
Appendix A Estimates of costs and emissions trading induced by climate policy 41 List of Tables
ES.1 Summary statistics of model-based projections of 2020 carbon prices ($2008/tCO2) 7 ES.1: Samenvatting van statistieken modelgebaseerde projecties van CO2-prijzen in
2020 ($2008/tCO2) 9
3.1 Overview of studies’ main characteristics and model results for carbon prices in 2020 under a global cooperation climate regime 19 3.2 Summary statistics of model-based projections of 2020 carbon prices ($2008/tCO2) 21 3.3 Overview of studies and model results for carbon prices in 2020 in case of delayed
participation of developing countries 23
3.4 Overview of EUA price projections for the period 2013-2020 26
5.1 Overview of carbon price projections for 2010 (excl US participation) 32
A.1 Total costs of different stabilization levels under different permit allocation schemes 41 A.2 Policy costs of achieving the 550 ppm target across scenarios on NA1 participation
in the global climate agreement and carbon trade 43 A.3 Permit allocations and net costs under allocation scheme equalizing net abatement
costs per unit of GDP-ppp 44 A.4 Permit allocations and net costs under allocation scheme equalize net abatement
cost per unit of GDP-ppp squared 44 A.5 Fraction of total social cost of stabilization at alternative levels of atmospheric CO2
borne by Non-Annex I Regions 45 A.6 Assumed reduction levels below the baseline, by 2020, for the non-Annex I
countries, grouped into Advanced Developing Countries, Other Developing Countries and Least-Developed Countries for three scenarios of Annex I reduction
levels 46
Page 6 of 52 WAB 500102 029
A.8 Emission reductions for developing countries resulting from the three different allocation options and total reductions based on all three simultaneously (in % compared to baseline by 2020). 49 A.9 Costs in developed and developing countries of reducing CO2 emissions from
energy and non-CO2 emissions from industry 50
A.10 Costs in developed and developing countries and trade in emissions rights in the POLES model 51 A.11 Welfare and GDP effects under the imperfect carbon markets in the GEM-E3 51
List of Figures
5.1 Model-based carbon price estimates under the assumption of worldwide trading and
average market CER price (forward contract with delivery in 2010) 33 5.2 Model-based carbon price estimates under Annex B trading only and average ERU
price. 34 A.1 Trade of carbon permits (cumulatively to 2100) in the two stabilisation scenarios
(under equal per capita allocation of initial permits) 42
A.2 Regional policy costs (net present value. Discount rate: 3% declining) 42
A.3 The total amount of emissions traded (MtCO2eq) between the different groups and the rest of the world, for 2020, in the three scenarios (ADCc – advanced developing countries, DCs – other developing countries) 48
Executive Summary
The costs associated with climate policy are of high interest to both governments and economic agents in developed and in developing countries. When a clear climate target is set, the carbon price should reflect the marginal costs associated with implementing the mitigation measures that will stabilize the concentration of GHG to the level specified by the target.
For this report, we performed a literature review of scientific models that calculate a global carbon price. The search ultimately yielded thirty studies presenting results from twenty-seven different scientific models for a total of seventy-six observations and six projections from private actors on the carbon market.
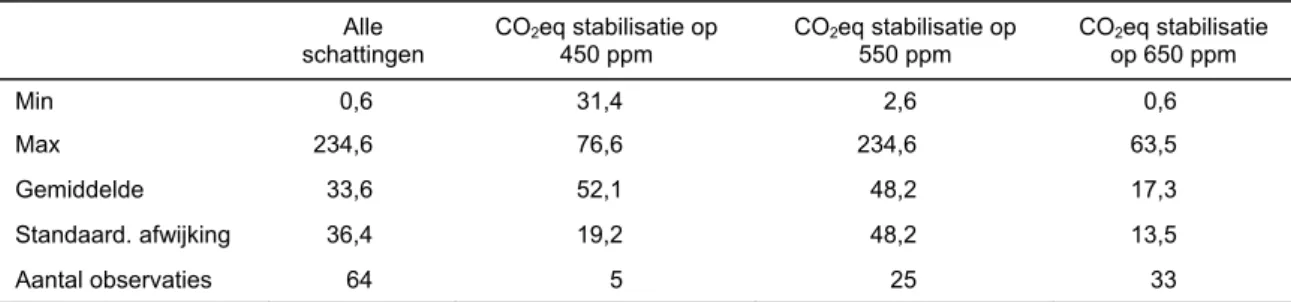
The below table summarizes the outcomes of the literature review of scientific models assuming global cooperation in GHG mitigation. It presents the basic statistics of carbon price projections for different stabilization levels:
Table ES.1 Summary statistics of model-based projections of 2020 carbon prices ($2008/tCO2)
All estimates CO2eq stabilization at 450 ppm CO2eq stabilization at 550 ppm CO2eq stabilization at 650 ppm Min 0.6 31.4 2.6 0.6 Max 234.6 76.6 234.6 63.5 Average 33.6 52.1 48.2 17.3 St. dev 36.4 19.2 48.2 13.5 No of observ. 64 5 25 33
One of the main conclusions stemming from the literature overview is that very little modelling work has been done on low stabilization levels of GHG concentration, which is of most relevance for climate policy. The few studies that do address the implications of achieving low stabilization levels (around 450 ppmv CO2eq), on average estimate a carbon price of 52 $/tCO2, while those analyzing the costs of stabilization around 550 ppm CO2eq come to an average figure of 48 $/tCO2. The high standard deviation around the average estimate testifies to the large model and parameter uncertainties inherent to the modelling process and calls for cautious interpretation of modelling results, both when comparing the outcomes of different models and in their individual use.
Most models assume optimal abatement policies with full when and where flexibility, meaning that abatement can happen whenever and wherever it is cheapest globally. The related carbon credit prices are thus global carbon prices set on a single global carbon market and equal the marginal abatement cost of the last option in the least-cost abatement mix required to achieve a pre-determined climate target. This is of course not the case on the actual carbon market. There are only a few exceptions found in the literature. Those studies explore the effect of delayed developing countries participation on the carbon market. The outcomes of those studies set carbon prices in 2020 to be in the range from a few $/tCO2 to several hundred $/tCO2, depending on the climate target and the date of entry of developing countries into a global climate coalition. Because of the small number of such studies, the different assumptions they use on the date of entry of developing countries into a global climate coalition and the different GHG constraints they apply in their models, it is very difficult to draw any robust conclusions on the cost of global climate policy under imperfect cooperation.
The same reasons make it also difficult to compare the estimates of carbon prices under full and imperfect cooperation. Although the average projected carbon price in studies assuming full global cooperation is indeed lower than the average estimate of studies assuming imperfect cooperation, because of the small number of latter, such comparisons are of limited value.
Page 8 of 52 WAB 500102 029
An altogether different approach is followed by private sector players on the carbon market. They mainly focus on a particular type of carbon credit and because the EU ETS is the largest segment of the carbon market, we collected their estimates on the price of the EUAs in the third commitment period, from 2013 to 2020. Their estimates vary from 33 €/tCO2 to 48 €/tCO2. Finally, to develop an idea on the predictive power of model-based carbon price projections we compared older studies performed on the Kyoto-made carbon market and their projections on the carbon prices for the period 2008-2012 with the real forward carbon prices for the same period. We compare market CER price to the carbon price calculated by models assuming worldwide carbon trading and market ERU price to model-based carbon price estimates under the assumption of carbon trading being restricted to Annex B countries. We find that in the first case, the bias is mostly towards underestimation of the actual market price but can to a large extent be explained by the sales of 'hot air'. In the models, much more 'hot air' is assumed to reach the carbon market then actually has so far. If more excess AAUs were to be sold, they would depress the CER price closer to model-based estimates. The opposite is true for the case of ERUs, where most model-based carbon price estimates appear to be an upward bias and cannot be explained by sales of 'hot air'.
Samenvatting
De kosten die verbonden zijn aan klimaatbeleid zijn van groot belang voor overheden en economische actoren in ontwikkelde landen en ontwikkelingslanden. Zodra een duidelijke klimaatdoelstelling is vastgesteld, zou de prijs van CO2 duidelijk moeten weergeven welke marginale kosten verbonden zijn aan het implementeren van mitigatiemaatregelen die de concentratie van broeikasgassen stabiliseren op het niveau dat is vastgelegd in de doelstelling. Voor dit rapport is een literatuurstudie gedaan naar wetenschappelijke modellen die de mondiale koolstofprijs berekenen. Het onderzoek bracht dertig studies naar voren waarin resultaten werden gepresenteerd van 27 verschillende wetenschappelijke modellen voor een totaal aantal van 76 wetenschappelijke rapporten en zes projecties van private actoren in de koolstofmarkt.
Tabel ES.1 geeft een samenvatting van de resultaten van de literatuurstudie van weten-schappelijke modellen waarbij wordt uitgegaan van wereldwijde samenwerking in broei-kasgasmitigatie. Het geeft de basisstatistieken weer van CO2-prijsprojecties voor verschillende stabilisatieniveaus:
Tabel ES.1: Samenvatting van statistieken modelgebaseerde projecties van CO2-prijzen in 2020 ($2008/tCO2) Alle schattingen CO2eq stabilisatie op 450 ppm CO2eq stabilisatie op 550 ppm CO2eq stabilisatie op 650 ppm Min 0,6 31,4 2,6 0,6 Max 234,6 76,6 234,6 63,5 Gemiddelde 33,6 52,1 48,2 17,3 Standaard. afwijking 36,4 19,2 48,2 13,5 Aantal observaties 64 5 25 33
Een van de belangrijkste conclusies die getrokken kan worden uit het literatuuroverzicht is dat erg weinig modellenwerk is gedaan op het gebied van lage stabilisatieniveaus van broeikasgasconcentraties, iets wat juist zeer relevant is voor klimaatbeleid. De weinige studies die wel aandacht besteden aan de gevolgen van het behalen van lage stabilisatieniveaus (rond 450 ppm CO2eq) komen uit op een gemiddelde schatting van een CO2-prijs die 52 $/tCO2 bedraagt, terwijl diegenen die de kosten analyseren op een niveau van 550 ppm CO2eq uitkomen op 48 $/tCO2. De hoge standaardafwijkingen benadrukken de grote model- en parameteronzekerheden die inherent zijn aan het modelleringproces en tonen de noodzaak aan van voorzichtige interpretatie van modelresultaten, zowel bij vergelijkingen tussen verschillende modellen als bij individueel gebruik van de modellen.
De meeste modellen gaan uit van flexibiliteit ten aanzien van wanneer en waar, wat inhoudt dat emissiereductie kan plaatsvinden wanneer en waar het wereldwijd gezien het goedkoopst is. Het daaruit voortvloeiende carbon credit prijzen zijn dus mondiale koolstofprijzen die zijn vastgesteld op een mondiale broeikasgasmarkt en gelijk zijn aan de marginale reductiekosten of de laagste–kosten-reductiemix die nodig is om een vastgestelde klimaatdoelstelling te behalen. Uiteraard is dit op de huidige koolstofmarkt niet het geval.
Slechts enkele uitzonderingen zijn te vinden in de literatuur. Deze studies onderzoeken het effect van de vertraagde deelname van ontwikkelingslanden aan de koolstofmarkt. De uitkomsten van deze studies geven aan dat de CO2-prijs in 2020 varieert van enkele tot enkele honderden $/tCO2, afhankelijk van de klimaatdoelstelling en het jaar waarop ontwikkelings-landen zijn toegetreden tot de mondiale klimaatcoalitie. Vanwege het beperkte aantal van dit soort studies, de verschillende toetredingsdata van ontwikkelingslanden tot de mondiale klimaatcoalitie die gehanteerd worden en de verschillende broeikasgasbeperkingen die toegepast worden in de modellen is het erg moeilijk om robuuste conclusies te trekken over de
Page 10 of 52 WAB 500102 029
CO2-prijs of welvaartkosten van klimaatbeleid onder gebrekkige samenwerkingsomstandig-heden.
Om dezelfde redenen is het ook moeilijk om de CO2-prijsresultaten bij perfecte en imperfecte competitie te vergelijken. Hoewel de gemiddelde CO2-prijs in studies die perfecte competitie aannemen lager is dan die in studies met imperfecte competitie is, is deze observatie van beperkte waarde door het kleine aantal studies onder zulke aannamen.
Een totaal andere aanpak wordt gevolgd door spelers op de CO2-markt die afkomstig zijn uit de private sector. Zij concentreren zich vooral op een specifiek type carbon credit en omdat de EU ETS het grootste segment van de CO2-markt beslaat hebben we hun schattingen verzameld ten aanzien van de prijs van de EUA’s in de derde budgetperiode, welke loopt van 2013 tot 2020. Hun schattingen variëren van 33 €/tCO2 tot 48 €/tCO2.
Om tot slot ideeën te ontwikkelen over de voorspellende kracht van modelgebaseerde CO2 -prijsprojecties hebben we oudere studies over de door Kyoto gecreëerde koolstofmarkt en hun projecties ten aanzien van de CO2-prijs in de periode 2008-2012 vergeleken met de echte termijnmarktkoers van CO2-prijzen voor dezelfde periode. We vergelijken de CER-marktprijs met de CO2-prijs berekend door modellen die uitgaan van wereldwijde emissiehandel en ERU-marktprijs tot model-gebaseerde koolstofprijsschattingen waarbij aangenomen wordt dat koolstofhandel beperkt wordt tot Annex-B landen. In het eerste geval blijkt er een neiging te bestaan tot onderschatting van de echte marktprijs, maar dit kan grotendeels worden verklaard door de verkoop van ‘hot air’. In de modellen wordt aangenomen dat veel meer ‘hot air’ de markt zal bereiken dan tot nu toe is gebeurd. Als meer AAU’s verkocht zouden worden zou dit de CER-prijs naar beneden drukken richting de schattingen op basis van de modellen. Het tegenovergestelde gebeurt bij ERU’s, waarbij de CO2-prijsschattingen op basis van modellen eerder een neiging tot overschatting tonen welke niet kan worden verklaard door de verkoop van ‘hot air’.
List of acronyms
AI Annex I
AAU Assigned Amount Units
CCS CO2 capture and storage
CDM Clean Development Mechanism
CER Certified Emission Reduction
EUA EU Allowance
ERU Emission Reduction Unit
EU ETS EU Emissions Trading Scheme
GDP Gross Domestic Product
GHG Greenhouse gas
IPCC Intergovernmental Panel on Climate Change
JI Joint Implementation
JRC Joint Research Centre of the European Commission
NAI Non-Annex I
OECD Organisation for Economic Cooperation and Development
1
Introduction
The costs associated with climate policy are of high interest to both governments and economic agents that would incur increased costs related to climate measures. When a clear climate target is set, the carbon price should reflect the costs associated with implementing the mitigation measures that will stabilize the concentration of GHG to the level specified by the target.
The most systematic attempt at quantifying the costs of climate policies is represented by a number of global models that produce estimates of future GHG emission levels, the abatement necessary to achieve a pre-determined stabilization level of GHG concentration and the related costs or welfare losses of achieving those climate goals. The type of models employed for such assessments are presented in section 2.
The main aim of this report is to provide an overview of studies exploring the costs of climate policy and consider their main differences. Therefore, in section 3 we present carbon price projections for 2020 together with the main factors affecting the carbon price calculation. Those factors are crucial to a correct interpretation of the results of model-based studies estimating future carbon prices. Where available, we also present the related aggregate costs for the different regions in terms of loss/gain of welfare and the financial flows resulting from trading on the carbon market. The data allows for a systematic analysis on the current state-of-the-art climate policy modelling and some general conclusions on estimates provided by such models. A rather different approach is followed by carbon market players from the private sector (banks, traders, consultants), who focus mainly on the segment of the carbon market that is relevant for their clients, but nevertheless offers valuable insights into future development of the carbon market. Because such commercial estimates are not built on the same assumptions as those in model-based studies, we cannot directly compare them.
There are large uncertainties that surround model-based projections on carbon prices, which call for caution in their interpretation and use in developing climate policies. Anyone wishing to use model predictions must be careful both when using any particular model as well as when comparing results from different models. Those uncertainties and limitations are discussed in section 4.
Nevertheless, if the relevant limitations are kept in mind, models can give a useful estimate of what would happen if a certain policy was to be implemented and if the assumptions made in the model proved to be correct. To assess to what extent that has happened so far, in section 5 of this report we compare older studies performed on the Kyoto-made carbon market and their projections on the carbon prices for the period 2008-2012 with the real forward carbon prices for the same period. In this way, we develop an idea on the predictive power of carbon price projections.
2
Methodology
2.1 Approach and inclusion criteria for literature overview
A literature review has been conducted to identify studies which use different types of models to assess the costs of stabilizing global GHG emissions at a pre-determined level. Only studies considering stabilization target categories I to IV as defined by the IPCC (Fisher & Nakicenovic, 2007) were included in the overview.
The search covered both scientific and commercial providers of carbon price estimates and was focused on the following sources:
• peer-reviewed journals,
• working papers from institutes developing such models,
• newsletters and reports of banks with carbon trading desks,
• newsletters and reports of carbon service consultants.
Initially, we have relied on the study by Kuik et al (2008) as a useful starting point offering a good overview of the different models that yield carbon prices and expanded on their work by including results from more studies focusing on lower stabilization levels.
The overview presented here includes results of studies from:
• The Energy Modelling Forum (EMF) of the Stanford University in the USA, which is the scientific forum where most such models are developed. Unfortunately, virtually all EMF studies focus on stabilization levels of 650 ppm CO2eq (or 4,7 W/m2) by 2100, which is a level widely regarded as insufficient to keep temperature rises below 2 degrees Celsius.
• The Innovation Modelling Comparison project (IMCP),1 which brought together several modelling teams that analysed the cost stabilization level around 550 ppm CO2eq.
• The studies for the category I stabilization scenario (400 – 490 ppm CO2eq ) found in the IPCC FAR Chapter III (results from the MESSAGE and IMAGE models), which we complement with same-stabilization level results from the WIAGEM (Kemfert & Truong, 2007) and ENTICE-BR models (Popp, 2006). In general, very few studies focus on very low stabilization levels, something that IPCC (2007) already noted as well.
• Several other independently conducted studies not belonging to any particular scientific forum.
• A number of private actors on the carbon market.
The search ultimately yielded thirty studies presenting results from twenty-seven different scientific models for a total of seventy-six observations and six projections from private actors on the carbon market. It has to be noted immediately that the vast majority of scientific models calculate the price of a global carbon credit, while the commercial projections of carbon traders and consultants relate to a specific type of credit, in our case the European Emission Allowance (EUA), which is traded in the European carbon trading scheme (the EU-ETS) and thus cannot be directly compared.
The studies results are originally obtainable in different unit measures and different years of their monetary values. All results presented here are normalized to the unit US$/tCO2 by multiplying prices expressed in $/tC by the conversion factor 12/44 after which all prices were brought to 2008 levels by using IMF world inflation figures (defined by changes in average
1 The IMPCT represents a first systematic attempt to assess and compare the progress made through
Page 16 of 52 WAB 500102 029
consumer prices)2. For prices expressed in EUR, the exchange rate of 1 EUR = 1,27 USD was used3. The 2020 carbon prices reported here are thus constant prices in 2008 US$.
2.2 Results presentation
We present the carbon price projections of the studies surveyed in two parts, depending on their assumption on the level of participation in a global climate coalition. In the first group, which includes the vast majority of studies, are those that assume simultaneous full global participation in the climate coalition, allowing for the most cost-effective mitigation on a global level. Those studies are presented in section 3.1.1. Studies that explicitly model delayed participation of developing countries in a global climate agreement or even differentiate emission reduction targets between developed and developing countries are presented separately in section 3.1.2.
Results of carbon market players from the private sectors are presented last, as they focus on one specific segment of the global carbon market, the EU-ETS. Their forecasts of the price the EU Allowance (EUA) are presented in section 3.3.
2.2.1 Model typology and relevant factors affecting model results
Several types of scientific models are employed around the world to assess the effects of climate policy on economic systems and emission levels. Understanding their differences is crucial for a correct interpretation and comparison of their outcomes. The most basic distinction is between top-down (economic) and bottom-up (engineering) models. In the modelling literature, different and more elaborate model classifications can be found. Most models would fall into one of the categories discussed next, though many models also have characteristics of both.
a) Top-down models
Top-down models are rooted in the macro-economic tradition and hence focus on market interactions within the whole economy. They have little technological detail in the energy sector (van Vuuren et al., 2009). Edenhofer et al (2006) and Springer (2003) provide a concise overview of the different model types. Among top-down models, the most common types are:
• Optimal growth models (or Iintegrated assessment models): In these models economic growth is a major driver of GHG emissions. These models are aimed at understanding growth dynamics over long term horizons. Their key property is their social welfare maximizing behaviour. They help answer the questions of whether, when and how to address the problem of climate change. Their economic component belongs to one of the other model groups described here, most commonly the CGE.
• Computable general equilibrium models (CGE): They can be static or dynamic. Their major advantage is their ability to model the influence of energy policy on other industry sectors and often also on international trade. A major shortcoming is their assumption of perfect markets, which are supposed to be in equilibrium at the starting point of the analysis. Furthermore, CGE models typically do not include any mitigation measures at negative cost, since they assume no-regret options to be developed in the baseline.
• Simulation and econometric models (or macroeconomic models): they are based on a disequilibrium macroeconomic structure and allow for imperfect competition.
2 It must be noted that these carbon prices were usually presented on graphs as a function of time for the
period until 2100 which means most of the figures in the table have been read from such graphs and may not be always accurate to the last cipher.
3 This exchange rate was employed by Russ et al (2007) to convert the outcomes of their GEM-E3 model
b) Bottom-up models
Bottom-up models look at technology from an engineering point of view. A stylized bottom-up approach focuses on the substitutability of individual energy technologies and their relative costs. The typical bottom-up approach focuses on the energy system itself (and not on the relationship with the economy as a whole). In many bottom-up approaches, the current energy system is not necessarily assumed to be optimal. Therefore, analysts tend to find that currently several cost-efficient technologies are not used due to implementation barriers – and low-costs improvements can be made by using these technologies (van Vuuren et al., 2009).
The most typical bottom-up model type is:
• Energy system models: Their main advantage is that they represent the energy sector in much more detail than top-down models, while their main disadvantages are that energy demand is externally determined and independent of price and they represent only the energy sector.
c) Hybrid models
Recently, an increasing number of hybrid models have emerged, which aim at combining the advantages of both perspectives by linking macro-economic and technology model components.
There is considerable debate in the literature on whether there is a systematic difference in the estimates provided by top-down or bottom-up models. Previous model comparison exercises have either shown that:
• Bottom-up models were providing systematically higher reduction potentials and lower costs compared to the top-down studies (Springer, 2003).
• There are differences even within the group of top-down models, as CGE models (top-down) tend to calculate higher mitigation costs than both energy system models (bottom-up) as well as economic growth models (top-down) (Loschel 2002), a finding confirmed by Edenhofer et al. (2006).
• Bottom-up models provide slightly less potential at low prices – and comparable estimates at high prices for total greenhouse gases (van Vuuren et al., 2009), which is contrary to any previous assessments.
• Finally Kuik et al (2008) performed a meta-analysis of recent studies into the costs of GHG mitigation policies that aim at the long-term stabilization of these gases in the atmosphere. They analyzed a data set comprising of differences and results of twenty-six different models to determine which of the different model elements have a statistically significant influence on the results. They find that the model type (so a model being top-down or bottom-up) does not have a statistically significant influence on the resulting carbon price at all.
Regardless on whether there is a systematic bias caused by the model type, (Edenhofer et al. (2006) argue the underlying reason for any differences is most likely in the assumptions commonly made by 'CGE modelers', 'energy system modelers', and 'economic growth modelers', e.g. about foresight and intertemporal behavior of the agents etc.
There are several other parameters to which the marginal carbon price estimates are sensitive, even when they analyse the cost of achieving the same stabilization level. According to Kuik et al. (2008) these are:
• GHG included (CO2 only, multigas),
• emission baselines (increase in emissions within a given timeframe),
• assumed energy prices (oil price assumptions)
• induced technical change (additional technical change that occurs as a result of climate policy),
• intertemporal dynamics (whether a model solves the optimum for any given time step or for the whole period analysed),
• the inclusion of a backstop technology (e.g. CCS or a very expensive renewable option). Most likely there are even more factors affecting the marginal carbon price, such as the discount level and assumptions on the price of renewables. These parameters should be kept in
Page 18 of 52 WAB 500102 029
mind when comparing any model results because even results belonging to models of the same type can be significantly diverging due to different assumptions on those parameters. The overview in this study thus presents the carbon prices calculated by the different models together with the model elements found to have a significant effect on the result.
2.3 Approach to assessing the predictive power of model-based carbon price projections
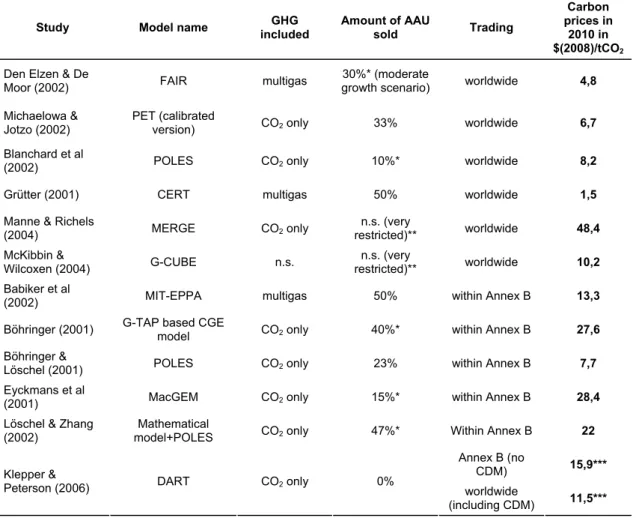
The scientific-model based studies included in the literature overview in section 3 all attempt assessing the economic costs of long-term climate targets and present the carbon price as a function. By contrast, most studies assessing the impact of the first Kyoto commitment period provide a point estimate of the carbon price for the mid-period year 2010. These model-based price estimates for 2010 will be contrasted to actual forward market prices for carbon credits with delivery in 2010 to give an insight into the predictive power of the model-based estimates. As argued by Pan (2005), conceptually, JI and CDM are partial emission trading among Annex I countries and global trading, respectively. This means we can interpret the price projections for trading among Annex B countries as an approximation of the Emission Reduction Units (or ERUs, the carbon credits earned under the JI), while the carbon credit under the assumption of worldwide trading could be seen as a proxy of the Certified Emission Reduction (CER) traded under the CDM. Only one study explicitly attempted at estimating the price of the EUA traded under the EU-ETS (Klepper & Peterson, 2006), to which we compare the market EUA price. To assess the gap between model-based projections and the actual market price of carbon credits we plot both on the same graph. We only present results from studies based on assumptions that were closest to the actual developments of the carbon market in the Kyoto period, these are: 1) the absence of the US in the Kyoto Protocol and 2) limited sales of 'hot air' by the Economies in Transition (EITs).
The average market prices have been calculated from daily closing prices for each type of credit since the beginning of trading. The average forward CER price for delivery in 2010 consists of price quotations from mid 2007 to the end of November 2008, while the average EUA forward price for delivery in 2012 consists of quotations from beginning of 2006 to end of November 2008. The ERU prices are the average 2008 prices, which call for additional caution when comparing model-based price projections for 2010 with market data for 2008 (there is no reported forward prices for this type of carbon credit).
3
Overview of model results and analysis
3.1 Models assuming perfect carbon markets and full participation of developing countries
Table 3.1 presents the carbon price as estimated by the different models together with their individual parameters, such as the GHG included in abatement efforts, assumptions on emission baselines, the presence of induced technological change, intertemporal dynamic optimization and the existence of a back-stop technology4. Twenty-one studies are based on top-down modelling, which include a similar number of CGE models and integrated assessment models. There is only one macro-economic study in the dataset (the E3MG model). There are five studies using bottom-up models and a further five based on hybrid models, often integrating a top-down model of the economic system and a bottom-up model of mitigation options.
Table 3.1 Overview of studies’ main characteristics and model results for carbon prices in 2020 under a global cooperation climate regime
Stu dy no.
Author(s) Model name Model type
stabil. level (in CO2 eq) GHG included Emissions baseline (ratio 2100/ 2000)5 ITCa IDOb BST c Carbon prices in 2020 in $(2008)/ tCO2 1 Kainuma et al. (1998)
AIMS down top- n.s. multigas 3.1 n.s. no n.s. 53.1
550 88.7 2 Bosetti et al. (2007) WITCH hybrid
650
CO2 only
(?) 3.0 yes yes yes 40.8
29.0 3 al. (2007) Tavoni et WITCH+forestry model hybrid 650 CO2 only
(?) 3.0 yes yes yes 9.7
4 Paltsev et al. (2005) EPPA down top- 650 multigas 3.9 yes no yes 25.2
5
Vaillancou rt et al,
2004 MARKAL
bottom-up 650 multigas scenario A1B na na na 13.1
550 2.6 6 Sarofim et al, 2005 MIT-IGSM down
top-650 multigas n.s. no no yes 0.6 490 31.4 7 Kemfert & Truong, 2007
WIAGEM down
top-550 multigas 3.1 yes yes yes 21.8
8 Jensen (2006) EDGE down top- 650 multigas 1.4 (til 2030) no no no 0.7
CO2 only 29.4
9 al. (2006) Fujino et AIM down top- 650
multigas 2.3 no no no 21.0 CO2 only 23.5 10 Hanson and Laitner (2006)
AMIGA down top- 650
multigas 2.8 yes no no 16.1 CO2 only 18.7 11 Böhringer et al. (2006)
PACE down top- 650
multigas 1.9 no yes no 9.3
12 Jiang et IPAC top- 650 CO2 only 2.3 no no n.s. 26.2
4 A backstop technology is a carbon-free technology whose usage is not restricted by scarcity of
non-reproducible production factors.
5 We report the long time horizon for emission baselines (until 2100) because this is the time-span
Page 20 of 52 WAB 500102 029
Stu dy no.
Author(s) Model name Model type
stabil. level (in CO2 eq) GHG included Emissions baseline (ratio 2100/ 2000)5 ITCa IDOb BST c Carbon prices in 2020 in $(2008)/ tCO2 down al. (2006) multigas 14.9 CO2 only 63.5 13 Fawcett and Sands (2006) SGM down top- 650 multigas n.s. no no no 18.7 CO2 only 24.2
14 Kemfert et al. (2006) WIAGEM down top- 650
multigas 2.5 yes yes no 12.1
CO2 only 26.2
15 Aaheim et al. (2006) COMBAT down top- 650
multigas 4.1 no yes no 22.4
CO2 only 67.3
550
multigas 2.9 yes yes yes 14.9
CO2 only 7.5 16 Manne and Richels (2006) MERGE hybrid 650
multigas 2.9 yes yes yes 2.6
450 63.5 550 15.9 17 van Vuren et al. (2007) IMAGE +FAIR-SiMCaP top-down 650
multigas 2.3 yes no yes
7.9
CO2 only 3.9
18 (Rao and Riahi, 2006)
MESSAGE bottom-up 650
multigas 2.2 no yes yes 1.2
550 107.7
IGSM down
top-650 multigas 3.4 no no yes 31.2
550 45.7 MERGE hybrid
650 multigas 3.4 yes yes yes 3.3
550 34.4 19 USCCSP (2006)
MiniCAM* down
top-650 multigas 3.2 no no yes 5.5
yes 4.8 20 al. (2006) Masui et AIM/Dynamic-Global down top- 550 CO2 only 2.0
no
yes yes 4.8
yes 23.9 21 Bosetti et al. (2006) RICE** FEEM/ down top- 550 CO2 only n.s.
no
yes no 43.1
490 yes 34.5
550 yes 12.3
22 (2006) Popp ENTICE-BR down
top-550 CO2 only n.s. no yes yes 28.7 yes 26.3 23 Edenhofer et al. (2006b)
MIND down top- 550 CO2 only n.s.
no yes yes 234.6
yes 4.8 24 Gerlagh (2006) DEMETER-1CCS down top- 550 CO2 only 2.0
no yes yes 9.6
yes 52.7 25 al. (2006) Sano et DNE21+ bottom-up 550 CO2 only 3.4
no no yes 57.4
yes 67.0 26 Hedenus et al.
(2006)
GET-LFL bottom-up 550 CO2 only 3.2
no no yes 67.0
Stu dy no.
Author(s) Model name Model type
stabil. level (in CO2 eq) GHG included Emissions baseline (ratio 2100/ 2000)5 ITCa IDOb BST c Carbon prices in 2020 in $(2008)/ tCO2 (2006) MACRO-MAGICC 2.6 no 14.4 yes 51.7 28 al. (2006) Barker et E3MG
Macro-
eco-nomic 550 CO2 only 2.0 no no yes 88.1
yes 28.7 29
Crassous et al. (2006)
IMACLIM-R down top- 550 n.s. n.s.
no no no 95.7
470 0.9 (B1) 76.6
30 (2007) IIASA MESSAGE bottom-up
480 multigas 1.7 (B2) no yes no 54.6
a- Induced technological change, b-Intertemporal dynamic optimization, c-Back-stop technology * Same results using the MiniCAM have been presented also in Edmonds et al (2006)
** Results reported here are for the FEEM/RICE fast version (assumes faster technological development)
The results of the studies presented vary significantly due to the differences identified earlier, particularly the different assumptions on future emissions under a business-as-usual scenario. These occur because studies use different assumptions on economic growth, industry structure and technological developments, resulting in widely differing baseline emissions paths over time. The studies included in our overview differ significantly in their assumptions on emission baselines up until 2100, which vary from 1.9 to 4.1 times the emission levels in 2000.
Many of them explore cost differences for the two cases where only CO2 mitigation is considered or all GHGs are included in abatement efforts. Induced technological change and inter-temporal dynamic optimization are included in more or less half of the models and backstop technology in two-thirds. An extensive debate about the influence of those determinants on the model results are beyond the scope of this paper but can be found in Kuik et al. (2008).
The carbon credit prices presented here are global carbon prices set on a single global carbon market and equal the marginal abatement cost of the last abatement option in the least-cost abatement mix required to achieve a pre-determined GHG stabilization target. It is worth noting again, that the carbon price can equal the marginal abatement cost only in a perfect carbon market, where no restrictions are posed on emissions trading and perfect information is available to all market players. In reality, carbon markets are far from being perfect and globally integrated (as will be discussed in chapter 4), so these estimates must be considered with care. For a more systematic first analysis, we present the minimum, maximum, average and standard deviation for all estimates, for studies that consider only CO2 abatement, for studies that consider all GHGs and for different stabilization levels (irrespective of the gasses included). A summary of this analysis is presented in table 3.2.
Table 3.2 Summary statistics of model-based projections of 2020 carbon prices ($2008/tCO2)
All estimates CO2 only Multigas
CO2eq stabilization at 450 ppm CO2eq stabilization at 550 ppm CO2eq stabilization at 650 Min 0.6 3.9 0.6 31.4 2.6 0.6 Max 234.6 234.6 107.7 76.6 234.6 63.5 Average 33.6 41.0 24.4 52.1 48.2 17.3 St. dev 36.4 43.5 24.7 19.2 48.2 13.5 No of observ. 64 31 31 5 25 33
Page 22 of 52 WAB 500102 029
As virtually all studies have found, multigas mitigation represents a cheaper abatement option compared to CO2 abatement only; the average carbon price in the first case being 24 $/tCO2 and in the second 41 $/tCO2. As expected, stabilization at lower GHG concentration levels entails higher mitigation costs with the average carbon price in 2020 estimated at 52 $/tCO2 for the 450 ppm stabilization target, 48 $/tCO2 for the 550 ppm target and only 17 $/tCO2 for the 650 ppm target. High figures for standard deviation, which measures the dispersion of the estimates from their mean (average), again point to the large differences between the results of the different models.
Interestingly, the difference between the average carbon credit price for the 450 and 550 ppm targets does not appear to be very large, although it is difficult to draw any solid conclusions on this due to the small number of observations available for the lowest stabilization level. Clearly, more research into the costs of low stabilization levels are required across the scientific forums to allow for significant comparison of different model results.
3.1.1 Models assuming delayed participation of developing countries
The models and their outcomes presented in the previous section assume full global participation in achieving a certain GHG stabilization level that allows the possibility of reducing emissions in the most cost-effective way anywhere in the world, which is often referred to as the 'when' and 'where' flexibility. This efficient mitigation strategy implies that an emissions trading scheme is present and emissions reductions are always made where and when they are cost optimal. Under an optimal mitigation scheme the developing countries are prominent contributors to mitigation efforts from the start of the global regime (Keppo & Rao, 2007). The macroeconomic modelling results reported in the IPCC’s Fourth Assessment Report (IPCC, 2007) also largely rely on the assumptions of full ‘when-and-where’ flexibility. That is, there would be flexibility across both space and time as to where and when reductions would be made (Richels et al., 2007). Such a first-best regime is characterized by the fact that it minimizes the economic costs of stabilization. To the extent the real world deviates from the first-best world, the global cost of stabilization will be higher (Edmonds et al., 2008).
There are few studies available that explore the effect of delayed developing countries participation on the carbon market. They are summarized in table 3.3. The results presented here are based on the assumption of full participation by all Annex I (AI) countries (including the US) and imperfect trade, whereby international trading gradually develops in time including more countries and sectors. Although all the studies in table 3.3 assume that non-Annex I (NAI) countries join the global climate coalition at some point in the future, they differ substantially on the timing of NAI involvement, the reduction levels they achieve and their availability as a source of carbon credits prior to their assuming emission reduction targets. Hence, there is again considerable variation in carbon price projections even for achieving the same stabilization levels.
Table 3.3 Overview of studies and model results for carbon prices in 2020 in case of delayed participation of developing countries
Author(s) Model name
stabilization level ( in CO2 eq) Year of NAI joining climate coalition NAI countries with targets trade with NAI before NAI join coalition Carbon prices in $(2008)/tCO2 in 2020 no 478,7 Bossetti et
al (2008) WITCH 550 2035 all yes 119,7
550 2020-2035 55,5 550 2035-2050 277,4 650 2020-2035 7,4 Edmonds et al. (2008) MiniCAM 650 2035-2050 most advanced no 11,1 550 181,3 Richels et al (2007) MERGE 650 2060 all no 92,5 Russ et al
(2007)6 POLES 450 After 2020 high income yes
48
(in developed countries) 22
(in developing countries) Russ et al
(2009)7 POLES 450 2012 China, India Brazil, yes
66
(in developed countries) 30
(in developing countries) Den Elzen
et al (2008) FAIR 450 2012
All except
LDCs Yes 103
The first three studies assume that after NAI countries join the global climate agreement their participation is full and complete and emission abatement can now proceed in the most cost-efficient manner anywhere in the world, much as in the studies in table 3.1. In Bossetti et al (2008), allowing trading between AI and NAI even if NAI does not take on any emission targets leads to a carbon price which is almost the same as in the case of NAI entering the climate coalition immediately. Of course, for the period prior to NAI joining the climate coalition or if no trading is assumed, AI countries assume higher emission reductions, leading to higher mitigation costs for them.
The main difference of the last three studies in table 3.4 is that they do not simply follow the global MAC curve but they assign a certain level of emission reduction to both AI and NAI countries, and impose a certain level of abatement in AI even if cheaper options in NAI are still available. In all three cases the AI reduction target is 30% below 1990 levels and NAI reductions are 9, 16 and 8 per cent below baseline for Brazil, China and India in Russ et al (2009) and average of 16% below baseline for all NAI in den Elzen et al (2008).
Furthermore, Russ et al (2007) and Russ et al (2009) no longer assume ideal pathways with perfect trading in all sectors across all time periods and world regions. Instead, they aim at being more realistic while at the same time maintaining the idea of economic efficiency by a gradually developing global carbon market across sectors and countries, resulting in different abatement and thus different carbon costs (Russ et al., 2009). A carbon market exists for the sectors included in the EU ETS but it is not perfect and thus it does not equalise marginal abatement costs for the involved sectors on a global scale. Instead of this, the effective carbon prices are assumed to vary between the various regions in the world because of differences in transaction costs (see figure below), and they converge over time. Energy intensive sectors in developing countries are exposed to a low carbon price in 2012, simulating the limited
6 This study includes the scenario analysis conducted as a contribution to the European Commission’s
Communication of January 2007 on 'Limiting Global Climate Change to 2 Degrees Celsius – The Way Ahead for 2020 and Beyond (COM(2007)2).
7 This study summarizes the modelling activities for the European Comission’s Communication 'Towards
Page 24 of 52 WAB 500102 029
penetration or visibility of a carbon price for all individual firms through policy instruments such as the CDM (Russ et al., 2009).
The only conclusions that can be drawn from the studies in table 3.3 is the intuitive finding that trading with NAI countries even before they enter the global climate coalition and pursue domestic mitigation action lowers the carbon price and thus the overall mitigation costs for AI countries.
Apart from this, no other observable trend can be detected: for example, in Edmonds et al (2008), the 550 ppm CO2eq limit becomes unfeasible if NAI countries delay their participation after 2035, while in Richels et al (2007), the same stabilization level is still achievable if NAI only join the climate coalition only by 2060 and even at a cost lower then in both Bossetti et al’s (2008) and Edmonds et al’s (2008) scenario of NAI participation from 2035.
Bossetti et al (2008) estimate a carbon price almost twice as high as Edmonds et al (2008) for the 550 ppm target, despite both employing hybrid models with similar characteristics and similar assumptions on baseline emissions. Furthermore, den Elzen et al (2008) also calculate a price much higher then Russ et al (2009) for the same target of 450 ppm.
The difference in carbon price from the two JRC studies (Russ et al., 2007 and Russ eta al., 2009) is party explained by the fact that in the previous study by Russ et al. (2007), developing countries were assumed to be allowed to sell all their emission reductions compared to the baseline as carbon credits. In the 2009 study however, it has been assumed that they also have to carry out domestic reductions which they can not sell.
Despite their differencies, all studies are in accordance that delaying non-Annex I countries accession to a global climate coalition, significantly increases the cost of stabilizing the atmospheric GHG concentration at low levels. Keppo and Rao (2007) furthermore find that even short-term postponement of participation from some regions can often lead to a delay of mitigation measures on the global level. Mitigation costs are found to substantially increase as a result of delayed participation of NAI-the extent of the increase depends on the relative importance of the region that postpones its participation, the stringency of the climate target and the ability to reorganize mitigation measures. Their analysis also shows that a region's decision to delay its participation in an international climate regime can lead to accumulated inertia in its energy system and thus to a delayed ‘technological transition’ toward a low-carbon future (Keppo & Rao, 2007). All studies thus point to the urgency of domestic mitigation efforts in non-Annex I countries to achieve low stabilization levels without extremely high carbon prices. A comparison with the studies included in the previous section shows that the average projected carbon price in studies assuming full global cooperation is indeed lower than the average estimate of studies assuming imperfect cooperation. However, most estimates assuming delayed NAI country participation (except for Bossetti et al, 2008) fall within the range of estimates of studies assuming full cooperation and because of the small number of former, such comparisons are of limited value.
3.2 Traded volumes, costs and benefits of climate policies
As most studies do not assume region-specific emission reduction targets, but rather assume full flexibility in achieving a certain level of stabilization, they cannot provide estimates of financial flows from one region to the other through carbon trade. In those studies costs are always represented on a global level.
There are, however, few exceptions. Some of the studies included in the overview do attempt some kind of differentiated constraints on a regional (or even country) level by making assumptions on the initial allocation of emission permits (Bossetti et al., 2007; Bossetti et al., 2008, Vaillancourt et al., 2004) or assume outright targets for developed and developing countries (den Elzen et al., 2008; Russ et al., 2009). This way, it is possible to estimate how
much trade would develop under different stabilization scenarios and what kind of costs would be faced by different regions (countries).
Again, different studies have different focuses (from industrial CO2 only to all GHGs), use different delineations of country groups (Annex I & non-Annex I, OECD & non-OECD, major countries only etc), different cost indicators (net present value percent GDP losses until 2100, gross & net mitigation costs in billion USD, fraction of total social cost of stabilization etc) and different time horizons and discount rates. Because of these differences it is extremely difficult to harmonize the different estimates of climate policy costs borne by the different regions, so an overview of those estimates is presented in Appendix A, in the same fashion as they are presented in the original studies. Furthermore, it must be noted that these values are computed under different assumption on the timing and level of participation of countries in the global climate coalition, which crucially affects the results, so they should not be directly compared. Nevertheless, some general insights can be drawn:
• The costs for developing countries as a group participating in a global climate agreement and limiting their emissions in line with a global target of 450 to 550 ppm CO2eq are
estimated to be from a fraction of a percent of their GDP (Russ et al., 2009, den Elzen et al.,
2008, Vaillancourt et al., 2004) to a maximum of 7% of GDP (Bossetti et al., 2007), the latter figure belonging to the unrealistic sovereignty principle for initial allocation of emission permits that assigns most reductions to developing countries.
• Delaying participation in a climate agreement does not seem to significantly reduce costs for developing countries. Bossetti et al (2007) and Bossetti et al (2008) estimate costs (under
different emission allocation schemes) in the order of a few percent of GDP regardless of whether emission constraints are adopted immediately or only in 2035. Vaillancourt et al (2004) estimate the costs to be a fraction of a percent assuming immediate emission constraints for developing countries and den Elzen et al (2008) and Russ et al (2009) arrive at a similar estimate assuming emission reduction targets for developing countries only for the year 2020. Edmonds et al (2008) estimate the fraction of total social cost of stabilization borne by non-Annex I countries for different dates of entry and show that they are only marginally reduced for every subsequent period of entry into the climate coalition (2012, 2020 or even 2035). Even if developing countries do not assume any targets by 2020, they are still likely to experience a slight reduction in GDP, partly due to the reduced economic activity in the developed countries, which affects them through reduced international trade (Russ et., 2007).
• There are large differences between developing countries. According to Bossetti et al (2007),
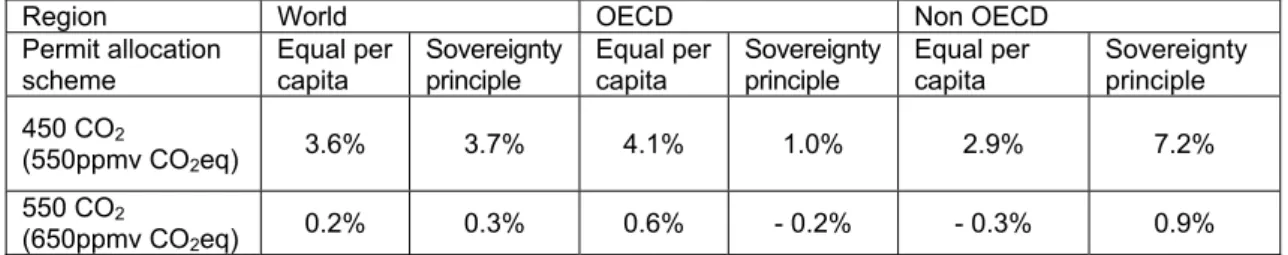
most developing countries, and in particular Sub-Saharan Africa and South Asia would realize considerable sales of carbon credits until 2100, more under a less stringent stabilization target of 550 ppm CO2 (650 CO2-eq) as opposed to a target of 450 ppm CO2 ( 550 CO2-eq). This has a clear implication for the geographical distribution of the costs of stabilising GHG concentrations in the atmosphere. In the 550 ppm CO2 (650 CO2 eq) scenario, all regions but Sub-Saharan Africa and South Asia bear some costs, albeit small. Sub-Saharan Africa and South Asia gain from selling permits. In the 450 ppm CO2 (550 CO2eq) scenario, costs are much larger and but Sub-Saharan Africa and South Asia still get some benefits, while China faces positive costs (Bossetti et al., 2007). The regional policy costs are presented in figure A.2 in Appendix A.
• The size of the carbon market is projected to be very large. Bossetti et al (2007) estimate
that under a 650 ppm CO2eq stabilisation scenario and 'equal per capita' allocation of initial permits, the volumes traded in the carbon market could reach almost 60 GtC (220 Gt CO2eq) (an average of 0.6 GtC/yr (2.2 Gt CO2eq/yr) or 10% of current emissions) over the next century, a figure that goes down to 35 GtC (128 Gt CO2eq) in a 550ppm CO2eq scenario, where the more stringent target requires more domestic action to abate GHG emissions. Den Elzen et al estimate carbon trade to reach almost 1 Gt CO2eq by 2020, from which non-Annex I countries stand to gain revenues of almost 70 billion US$. Russ et al. (2009) estimate this figure at 40 billion US$ for the same year. Vaillancourt et al. (2004) estimate the value of emissions trading between 2010 and 2050 at over one trillion US$.
Page 26 of 52 WAB 500102 029
3.3 Commercial projections
Several market players, such as consultants specializing in support services to the carbon market or banks with carbon trading desks that buy and sell carbon permits for their clients (e.g. utility companies etc) also provide estimates of future carbon prices. Those are also often based on their own in-house developed models complemented with expert judgment. In contrast with global models presented above, which estimate a global carbon price, market players tend to focus on a particular type of carbon credits, mostly the European Emission Allowance (EUAs), which is of most relevance to their clients. Table 3.4 summarizes recent projections of EUA prices for the third EU-ETS trading period ending in 2020.
Table 3.4 Overview of EUA price projections for the period 2013-2020 Company Projected average shortfall (MtCO2eq/y) Internal abatement (MtCO2eq/y) CDM/JI (MtCO2eq/y) EUA price projection (eur/t) Deutsche Bank (2008) 207 100 107 42 Fortis* 480 376 104 up to 48 Societe Generale* 500 475 25 up to 35 UBS* 440 332 108 - JP Morgan (2008) 600 355 - 33
Carbon Trust (2007) and
Grubb (2008)** - - - 20-40
* As reported by World Bank (2008)
** Grubb (2008) updated the original 15-50 eur/t estimate published in Carbon Trust (2007)
A separate category of carbon prices estimates is performed by Point Carbon. They also calculate a global carbon price in 2020, assuming that a cap-and-trade scheme along the lines of the original Lieberman-Warner bill will have been introduced in the US by 2020 and that in the EU ETS there will have been a 25% reduction target, including emissions from aviation8. Based on all this, they assume a carbon price of 50 eur/t (USD 78 $/t) in 2020. The value of the whole market under these assumptions is about 2 trillion EUR (3.1 trillion US$) (Point Carbon, 2008).
8 Furthermore, they assume that by 2020 trading schemes are operational in Australia, New Zealand,
4
Uncertainties and limitations of model-based carbon price
projections
Edenhofer et al (2006) distinguish two basic types of uncertainties, the parameter uncertainty, which applies to use of any model and the model uncertainty, which applies to comparison of results from different models. The latter means a structural uncertainty, defined as the uncertainty arising from having more than one plausible model structure (Morgan and Henrion 1990). This means that even models based on the same assumptions regarding their basic parameters can lead to different results. These issues need to be kept in mind when comparing results of different models.
Parameter uncertainty concerns all models irrespective of their type and must be taken into account when interpreting the results of any model. This type of uncertainty is discussed in more detail. It refers to a lack of empirical knowledge to calibrate the parameters of a model to their 'true' values. Parameter uncertainty implies an uncertainty of the predictions of any one model and discrepancies may result even in case of otherwise very similar models. In other words, no modeler has full information on 'real world developments' and while he can offer his best estimate of a certain development (e.g. on GDP growth rates and the related emission rates), they cannot predict with full certainty what the actual development of those parameters will be (the current credit crises that depressed economic growth rates worldwide, is a good example of the type of uncertainties faced by models trying to mimic global developments). Out of the specific assumptions that influence the results of the model-studies, one of the most important ones underlying the stabilization scenarios includes the flexibility in policy design, seeking out least-cost options for emissions control regardless of where they occur, what substances are controlled, or when they occur (the where, what, and when flexibility). Allowing for these flexibilities will, under specified conditions, lead to least cost abatement. The economic characteristics of the scenarios fed into models normally assume a policy designed with the intent of achieving the required reductions in GHG emissions in a least-cost way. The assumptions used in these scenarios are convenient for analytical purposes, but it must always be kept in mind that they are idealized descriptions of possible outcomes and can be very different from the actual situation for many reasons. Springer & Varilek (2004) group them in factors that could increase and decrease the price. The two most important factors in the first group are:
• Transaction costs: In practice, emissions market participants will face transaction costs such
as emissions monitoring and verification expenditures and fees for lawyers and brokers to assist with transactions. Onerous or complicated trading rules and failure to harmonize national trading systems will increase such costs.9
• Emission trading scheme coverage: Because emissions trading is not well suited to some
sectors of the economy with numerous small sources, such as housing and transport, emissions reduction opportunities will have to be captured by other, potentially less-efficient policies. To the extent that some of these opportunities are not covered by an emissions trading regime or not captured by non-trading policy measures, those sectors that are covered by emissions trading will have to shoulder a greater share of countries’ national emissions reduction targets, which will raise overall abatement costs and permit prices. The opposite effect will come from factors that may decrease prices, which might be the following:
• Banking: Calculations of likely permit prices in any one time period overlook the possibility of
capturing cost savings by banking unused permits from one time period to another. Most emissions trading programs allow for some form of banking. In this sense, intra-period
9 More recently, the transaction costs associated with the use of the Kyoto flexible mechanisms are
assumed to consist of a constant US$0.55 per tonne CO2eq emissions plus 2% of the total costs
(Michaelowa and Jotzo, 2005). The problem with this approach is of course that transaction costs are not constant and can differ significantly among mitigation measures and countries.