Informative Inventory
Report 2017
Emissions of transboundary air pollutants in the Netherlands 1990-2015
Page 2 of 172
Colophon
© RIVM 2017
Parts of this publication may be reproduced, provided acknowledgement is given to: National Institute for Public Health and the Environment, along with the title and year of publication.
DOI 10.21945/RIVM-2017-0002
B.A. Jimmink (author), RIVM P.W.H.G. Coenen (author), TNO S.N.C. Dellaert (author), TNO R. Dröge (author), TNO
G.P. Geilenkirchen (author), PBL P. Hammingh (author), PBL A.J. Leekstra (author), RIVM
C.W.M. van der Maas (author), RIVM R.A.B. te Molder (author), RIVM S.V. Oude Voshaar (author), RIVM C.J. Peek (author), RIVM
S.D. van der Sluis (author), PBL W.L.M. Smeets (author), PBL D. Wever (author), RIVM Contact:
Benno Jimmink RIVM - MIL/L&E
benno.jimmink@rivm.nl
This investigation has been performed by order and for the account of Ministerie voor Infrastructuur en Milieu, within the framework of KLG. This is a publication of:
National Institute for Public Health and the Environment
P.O. Box 1 | 3720 BA Bilthoven The Netherlands
Page 3 of 172
Synopsis
Informative Inventory Report 2017
Emissions of transboundary air pollutants in the Netherlands 1990-2015
Increase in ammonia emissions; whole time series adjusted downwards.
In 2015 slightly more ammonia was emitted than in 2014 and the ceiling set by the European Union was met (128 kilotons). It was more because both cattle numbers and fertilizer use increased, whereas low emission housing systems for pigs and poultry partly countered this.
Furthermore, total ammonia emissions between 1990 and 2015 have been adjusted downwards. This is because new insights have been made into the data used to calculate emissions, called emission factors. For example, from 2008 onwards, the annual amount of ammonia emitted by fertilizer use was 4 kilotons lower than previously calculated. The new insights were recommended by an international scientific review, performed at the request of the Minister for Agriculture.
Emissions of nitrogen oxides, sulphur dioxides and non-methane volatile organic compounds continue to decrease slightly; the Netherlands are, therefore, complying with the ceilings in this regard. Besides the substances mentioned above, the report also includes emissions of carbon monoxide, particulate matter, heavy metals and persistent organic pollutants. The emissions of most of these substances have decreased during the 1990 – 2015 period. The downward trend may, in particular, be attributed to cleaner fuels, cleaner car engines and to emission reductions in industry.
This is concluded by the Informative Inventory Report 2017, drawn up by RIVM and partner institutes which collaborate to annually analyse and report emission data. This is obligatory to member states. The analyses are used to support Dutch policy.
Page 5 of 172
Publiekssamenvatting
Informatieve Inventory Report 2017
Toename ammoniak emissies; jaarreeks vanaf 1990 omlaag
De uitstoot van ammoniak is in 2015 licht gestegen ten opzichte van 2014 en voldoet met 127,6 kiloton aan het Europees gestelde plafond. De toename komt vooral doordat in de agrarische sector meer
kunstmest is gebruikt. De toename wordt voor een deel afgezwakt door een dalende uitstoot in de varkens en pluimveesector als gevolg van schonere stalsystemen.
Verder is de totale uitstoot van ammoniak tussen 1990 en 2015 met terugwerkende kracht naar beneden bijgesteld. Dit komt door nieuwe inzichten in de zogeheten emissiefactoren; daarmee wordt de uitstoot berekend. Zo is vanaf 2008 de jaarlijkse hoeveelheid ammoniak die via kunstmest wordt uitgestoten circa 4 kiloton lager dan eerder was berekend. De inzichten zijn voortgekomen uit een internationale wetenschappelijke review die op verzoek van de staatssecretaris van Economische Zaken is uitgevoerd.
De emissies van stikstofoxiden, zwaveldioxiden en niet-methaan vluchtige organische stoffen blijven licht dalen. Voor deze stoffen blijft Nederland voldoen aan de gestelde plafonds. Behalve deze stoffen is de uitstoot van koolmonoxide, fijn stof, zware metalen en persistente organische stoffen tussen 1990 en 2015 bijna zonder uitzondering gedaald. Dit komt vooral door schonere brandstoffen, schonere automotoren en door emissiebeperkende maatregelen in de industrie. Dit en meer blijkt uit de Informatieve Inventory Report 2017. Het RIVM analyseert en rapporteert hierin jaarlijks met diverse partnerinstituten de uitstoot van stoffen. Lidstaten zijn hiertoe verplicht. Nederland gebruikt de analyses om beleid te onderbouwen.
Dit en meer blijkt uit de Informatieve Inventory Report 2017. Het RIVM analyseert en rapporteert hierin jaarlijks met diverse partnerinstituten de uitstoot van stoffen. Lidstaten zijn hiertoe verplicht. Nederland gebruikt de analyses om beleid te onderbouwen.
Kernwoorden: emissies, grootschalige luchtverontreiniging, emissieregistratie
Page 7 of 172
Contents
1 Introduction — 9
1.1 National inventory background — 9
1.2 Institutional arrangements for inventory preparation — 9
1.3 The process of inventory preparation — 10
1.4 Methods and data sources — 13
1.5 Key source analysis — 14
1.6 Reporting, QA/QC and archiving — 14
1.7 Uncertainties — 18
1.8 Explanation on the use of notation keys — 20
2 Trends in emissions — 23
2.1 Trends in national emissions — 23
2.2 Trends in sulphur dioxide (SO2) — 24
2.3 Trends in nitrogen oxides (NOx) — 26
2.4 Trends in ammonia (NH3) — 27
2.5 Trends in non-methane volatile organic compounds (NMVOC) — 28
2.6 Trends in PM2.5 — 29
2.7 Trends in PM10 — 30
2.8 Trends in Pb — 31
3 Energy — 33
3.1 Overview of the sector — 33
3.2 Public electricity and heat production (1A1a) — 35
3.3 Industrial Combustion (1A1b, 1A1c and 1A2) — 38
3.4 Other Stationary Combustion (1A4ai, 1A4bi, 1A4ci and 1A5a) — 42
3.5 Fugitive emissions (1B) — 46
4 Transport — 49
4.1 Overview of the sector — 49
4.2 Civil Aviation — 51
4.3 Road Transport — 57
4.4 Railways — 74
4.5 Waterborne navigation and recreational craft — 77
4.6 Non-road mobile machinery (NRMM) — 83
4.7 National fishing — 89
5 Industrial Processes and Product Use (NFR 2) — 93
5.1 Overview of the sector — 93
5.2 Mineral products (2A) — 96
5.3 Chemical industry (2B) — 98
5.4 Metal production (2C) — 99
5.5 Solvents and product use (2D) — 102
5.6 Other Production Industry (2H) — 106
6 Agriculture — 109
6.1 Overview of the sector — 109
6.2 Manure management — 112
6.3 Crop production and agricultural soils — 117
Page 8 of 172
7.1 Overview of the sector — 123
7.2 Solid waste disposal on land (5A) — 125
7.3 Composting and anaerobic digestion (5B) — 127
7.4 Waste incineration (5c) — 129
7.5 Waste-water handling (5D) — 132
7.6 Other waste (5E) — 132
8 Other — 135
9 Recalculations and other changes — 137
9.1 Recalculations of certain elements of the IIR2016 — 137
9.2 Improvements — 137
9.3 Effects of recalculations and improvements — 137
10 Projections — 141
11 Spatial distributions — 145
11.1 Background for reporting — 145
11.2 Methodology for disaggregation of emission data — 145
11.3 Maps with geographically distributed emission data — 146
References — 151
Appendix 1 Key category analysis results — 158
Page 9 of 172
1
Introduction
The United Nations Economic Commission for Europe’s’ Geneva 1979 Convention on Long-Range Transboundary Air Pollution (CLRTAP) was accepted by the Netherlands in 1982. Under the Convention, parties are obligated to report emission data to the Conventions’ Executive Body in compliance with the implementation of the Protocols to the Convention (also accepted by the Netherlands). The annual Informative Inventory Report (IIR) on national emissions of SO2, NOX, NMVOC, CO, NH3 and
various heavy metals and POP is prepared using the Guidelines for Reporting Emissions and Projections Data under the Convention on Long-range Transboundary Air Pollution 2014 (UNECE, 2014).
The Dutch IIR2017 is based on data from the national Pollutant Release and Transfer Register (PRTR). The IIR contains information on the Netherlands’ emission inventories for the years 1990 to 2015, including descriptions of methods, data sources, QA/QC activities carried out and a trend analysis. The inventory covers all anthropogenic emissions to be reported in the Nomenclature for Reporting (NFR), including individual polycyclic aromatic hydrocarbons (PAHs), which are to be reported under persistent organic pollutants (POP) in Annex IV.
1.1 National inventory background
Emission estimates in the Netherlands are registered in the national Pollutant Release and Transfer Register (PRTR). This PRTR database is the national database for sectorial monitoring of emissions to air, water and soil of pollutants and greenhouse gases. The database was set up to support national environmental policy as well as to report to the
framework of National Emission Ceilings (EU), the CLRTAP, the United Nations Framework Convention on Climate Change (UNFCCC) and the Kyoto Protocol (National System). The PRTR encompasses the process of data collection, processing and registration, and reporting on emission data for some 350 compounds. Emission data (for the most important pollutants) and documentation can be found at www.prtr.nl.
Instead of using the defaults from the EMEP/EEA air pollutant emission inventory guidebook 2013 (EEA, 2013), the Netherlands often applies country-specific methods with associated activity data and emission factors. The emission estimates are based on official statistics of the Netherlands (e.g. on energy, industry and agriculture) and
environmental reports by companies in the industrial sectors. Both nationally developed and internationally recommended emission factors have been used.
1.2 Institutional arrangements for inventory preparation
The Dutch Ministry of Infrastructure and Environment (IenM) has the overall responsibility for the emission inventory and submissions to CLRTAP. A Pollutant Release and Transfer Register (PRTR) system has been in operation in the Netherlands since 1974. Since 2010, the Ministry of IenM has outsourced the full coordination of the PRTR to the Emission Registration team (ER team) at the National Institute for Public Health and the Environment (RIVM).
Page 10 of 172
The main objective of the PRTR is to annually produce a set of unequivocal emission data that is up to date, complete, transparent, comparable, consistent and accurate. Emission data are produced in annual (project) cycles. In addition to the RIVM, various external
agencies/institutes contribute to the PRTR by performing calculations or submitting activity data:
• Netherlands Environmental Assessment Agency (PBL); • Statistics Netherlands (CBS);
• Netherlands Organisation for Applied Scientific Research (TNO); • Rijkswaterstaat (RWS):
o Centre for Water Management (RWS-WD); o Centre for Transport and Navigation (RWS-DVS); o Water, Traffic and Environment (RWS-WVL);
o Human Environment and Transport Inspectorate (RWS-ILT). • Deltares;
• Alterra WUR;
• Wageningen UR Livestock Research;
• Agricultural Economics Research Institute (LEI);
• Fugro-Ecoplan, which co-ordinates annual environmental reporting (AER) by companies.
Each of the contributing institutes has its own responsibility and role in the data collection, emission calculations and quality control. These are laid down in general agreements with RIVM and in annual project plans.
1.3 The process of inventory preparation Data collection
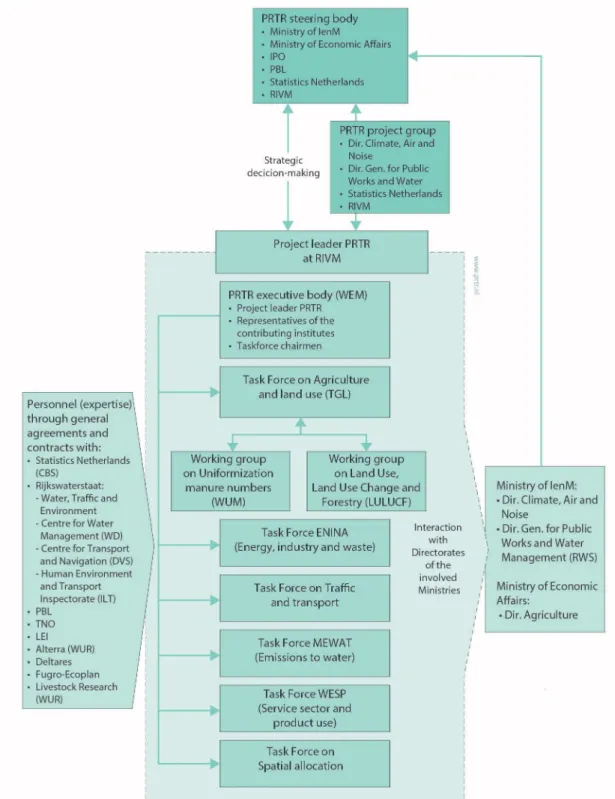
For the collection and processing of data (according to pre-determined methods), the PRTR is organised according to task forces. Task forces consist of sector experts of the participating institutes. Methods are compiled on the basis of the best available scientific views. Changes in scientific views lead to changes in methods, and to recalculation of historical emissions. The following task forces are recognised (see Figure 1.1):
• Task Force on Agriculture and Land Use;
• Task Force on Energy, Industry and Waste Management - ENINA; • Task Force on Traffic and Transportation;
• Task Force on Water - MEWAT;
• Task Force on Service Sector and Product Use - WESP.
Every year, after collection of the emission data, several quality control checks are performed by the task forces during a yearly ‘trend analysis’ workshop. After approval by participating institutes, emission data are released for publication (www.prtr.nl). Subsequently, these data are disaggregated to regional emission data for national use (e.g. 5x5 km grid, municipality scale, provincial scale and water authority scale).
Page 11 of 172 Figure 1.1 The organisational arrangement of the Netherlands Pollutant Release and Transfer Register (PRTR)
Page 12 of 172
1.3.1 Point-source emissions
As result of the Netherlands’ implementation of the EU Directive on the European Pollutant Release and Transfer Register (E-PRTR), since 2011 about 1000 facilities are legally obligated to submit data on their
emissions of air pollutants when they exceed a certain threshold. For some pollutants the Dutch implementation of the E-PRTR directive (VROM, 2008) has set lower thresholds. As a consequence, the total reported amount of the main pollutants for each subsector
approximately meets 80% of the subsector total. This criterion has been set as safeguard for the quality of the supplementary estimate for Small and Medium-sized Enterprises (SMEs).
As from 1 January 2010, the above-mentioned companies can only submit their emissions as part of an Annual Environmental Report (AER), electronically. All these companies have emission monitoring and registration systems with specifications in agreement with the
competent authority. Usually, the licensing authorities (e.g. provinces, central government) validate and verify the reported emissions.
Information from the AERs is stored in a separate database at the RIVM and formally remains property of the companies involved.
Data on point-source emissions in the AER database are checked for consistency by the task forces. The result is a selection of validated data on point-source emissions and activities (ER-I) which are then stored in the PRTR database (Dröge & Ten Broeke, 2012). The ER-I data is combined with supplementary estimates for Small and Medium-sized Enterprises (SMEs). Several methods are applied for calculating these emissions. TNO has derived emission factors for NOx emissions from
small installations, for instance Van Soest-Vercammen et al., (2002), while, for other substances, the Implied Emission Factors (IEFs) derived from the AERs are applied to calculate sector emissions.
1.3.2 Data storage
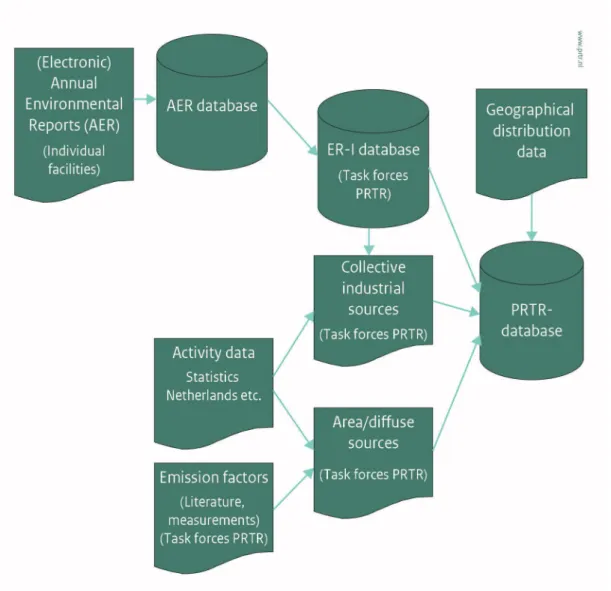
In cooperation with the contributing research institutes, all emission data are collected and stored in the PRTR database managed by the RIVM.
Emission data from the ER-I database and from collectively estimated industrial and non-industrial sources are stored in the PRTR database (see Figure 1.2). The PRTR database, consisting of a large number of geographically distributed emission sources (about 700), contains complete annual records of emissions in the Netherlands. Each emission source includes information on the NACE-code (Nomenclature statistique des Activités économiques dans la Communauté Européenne) and
industrial subsector, separate information on process and combustion emissions, and the relevant environmental compartment and location. These emission sources can be selectively aggregated, per NFR
Page 13 of 172 Figure 1.2 The data flow in the Netherlands Pollutant Release and Transfer Register
1.4 Methods and data sources
Methods used in the Netherlands are documented in several reports and protocols, and in meta-data files, available from www.prtr.nl. However, some reports are only available in Dutch. For greenhouse gases
(http://english.rvo.nl/nie), particulate matter (PM) and all emissions related to mobile sources, the documentation has been translated in English.
In general, two emission models are used in the Netherlands: • A model for emissions from large point sources (e.g. large
industrial and power plants), which are registered separately and supplemented with emission estimates for the remainder of the companies within a subsector (based mainly on IEFs from the individually registered companies). This is the so-called bottom up method.
• A model for emissions from diffuse sources (e.g. road transport, agriculture), which are calculated from activity data and emission
Page 14 of 172
factors from sectorial emission inventory studies in the
Netherlands (e.g. SPIN documents produced by the ‘Co-operation project on industrial emissions’).
In addition, these assumptions are important to consider:
• Condensable emissions are only included for transport emissions, not for emissions from domestic wood burning or industrial emissions.
• Road transport emissions have been calculated using ‘on-road’ measured emission factors, so emission data are insensitive to ‘the diesel scandal’.
1.5 Key source analysis
A trend assessment was carried out for the emission inventory of all components, in addition to a level assessment, to identify key source categories. In both approaches key source categories were identified using a cumulative threshold of 80%. Key categories are those which, when summed together in descending order of magnitude, add up to more than 80% of the total level (EEA, 2013). The level assessments were performed for both the latest inventory year 2015, as well as for the base year of the inventory, 1990. The trend assessments aim to identify categories for which the trend is significantly different from that of the overall inventory. See Appendix 1 for the actual analysis.
1.6 Reporting, QA/QC and archiving Reporting
The Informative Inventory Report is prepared by the inventory compiling team at RIVM (RIVM-NIC), with contributions by experts from the PRTR task forces.
QA/QC
The RIVM has an ISO 9001:2008 based QA/QC system in place. The PRTR quality management is fully in line with the RIVM QA/QC system. Part of the work for the PRTR is done by external agencies (other institutes). QA/QC arrangements and procedures for the contributing institutes are described in an annual project plan (RIVM, 2016). The general QA/QC activities meet the international inventory QA/QC requirements described in part A, chapter 6 of the EMEP inventory guidebook (EEA, 2016).
There are no sector-specific QA/QC procedures in place within the PRTR. In general, the following QA/QC activities are performed:
Quality Assurance (QA)
QA activities can be summarised as follows:
• For the energy, industry and waste sectors, emission calculation in the PRTR is based mainly on AERs by companies (facilities). The companies themselves are responsible for the data quality; the competent authorities (in the Netherlands, mainly provinces and local authorities) are responsible for checking and approving the reported data, as part of the annual quality assurance;
Page 15 of 172
• As part of the RIVM-quality system internal audits are performed at the Department for Emissions and air quality of the RIVM Centre for Environmental Quality;
• Furthermore, there are annual external QA checks on selected areas of the PRTR system.
Quality Control (QC)
A number of general QC checks have been introduced as part of the annual work plan of the PRTR (for results see Table 1.1). The QC checks built into the work plan focus on issues such as consistency,
completeness and accuracy of the emission data. The general QC for the inventory is largely performed within the PRTR as an integrated part of the working processes. For the 2016 inventory the PRTR task forces filled in a standard-format database with emission data from 1990 to 2015. After an automated first check of the emission files, by the data exchange module (DEX) for internal and external consistency, the data becomes available to the specific task force for checking consistency and trend (error checking, comparability, accuracy). The task forces have access to information on all emissions in the database, by means of a web-based emission reporting system, and are facilitated by the ER-team with comparable information on trends and time series. Several weeks before a final data set is fixed, a trend verification workshop is organised by the RIVM (see Text box 1.1). Results of this workshop, including actions for the task forces to resolve the identified clarification issues, are documented at RIVM. Required changes to the database are then made by the task forces.
Table 1.1 Key items of the verification actions on data processing 2016 and NFR/IIR 2017
QC Item/action Date Who Result Documentation *
Automated initial check on internal and external data consistency During each upload Data Exchange Module (DEX) Acceptation or rejection of uploaded sector data
Upload event and result logging in the PRTR-database
Input of hanging issues for this inventory 08-07-2016 RIVM-PRTR List of remaining issues/actions from last inventory
“Actiepunten voorlopige cijfers 2015 v 8 juli 2016.xls”
Input for checking allocations from the PRTR-database to the NFR tables 20-10-2016 RIVM-NIC List of allocations “NFR-ER-Koppellijst-2016-10-20-dtt5148_bj.xlsx”
Input for error checks 22-11-2016 RIVM-PRTR Comparison sheets 2014-2015 data “Verschiltabel_LuchtActueel_22-11-2016.xlsx”
Page 16 of 172
Input for trend analysis
29-11-2016
RIVM-PRTR Updated list
of required actions and updated Comparison sheets 2014-2015 data
“Actiepunten definitieve cijfers 1990-2015 v 29 nov 2016.xls”; “Verschiltabel_LuchtActueel 28-11-2016.xlsx” Trend analysis workshops 01-12-2016 Sector specialists, RIVM-PRTR Explanations for observed trends and actions to resolve before finalising the PRTR dataset
− “Emissies uit de landbouw reeks 1990-2015
Trendanalyse.pptx”; − “Presentatie ENINA
TrendAnalyse reeks 1990-2015.pptx”;
− Trendanalyse verkeer reeks 1990-2015.pptx”;
− WESP Trendanalyse reeks 1990-2015.pptx”;
− TA-dag NEC plafonds NL reeks 1990-2105.pptx”.
Input for resolving the final actions before finalising the PRTR dataset
2-12-2016
RIVM-PRTR Updated
Action list
“Actiepunten definitieve cijfers reeks 1990-2015 v 2 december 2016.xls” Request to the contributing institutes to endorse the PRTR database 14-12-2016 till 19-12-2016 PRTR project secretary, Representatives of the contributing institutes Reactions of the contributing institutes to the PRTR-project leader − Email (14-12-2016 13:46) with the request to endorse the PRTR database;
− “Actiepunten definitieve cijfers 1990-2015 v 14 dec
2016.xls”; Emails with consent from PBL, Deltares and CBS (CBS-15-12-2016 15:16; PBL-19-12-2016 15:27; Deltares- 19-12-2016 08:54).
Input for compiling the NEC report (in NFR-format) 19-12-2016 RIVM-NIC List of allocations for compiling from the PRTR-database to the NFR-tables “NFR-ER-Koppellijst-2016-12-19-dtt52-verwerktBL.xlsx”
Page 17 of 172
* All documentation (e-mails, data sheets and checklists) are stored electronically on a data server at RIVM.
Text box 1.1 Trend verification workshops
About a week in advance of a trend analysis meeting, a snapshot from the database is made available by RIVM in a web-based application (Emission Explorer, EmEx) for checks by the institutes involved, sector and other experts (PRTR task forces) and the RIVM PRTR-team. In this way the task forces can check for level errors and consistency in the algorithm/method used for calculations throughout the time series. The task forces perform checks for relevant gases and sectors. The totals for the sectors are then compared with the previous year's data set. Where significant differences are found, the task forces evaluate the emission data in more detail. The results of these checks form the subject of discussion at the trend analysis workshop and are subsequently documented.
Furthermore, the PRTR-team provides the task forces with time series of emissions per substance for the individual sub sectors. The task forces examine these time series. During the trend analysis for this inventory the emission data were checked in two ways: 1) emissions from 1990 to 2014 from the new time series were compared with the time series of last years’ inventory and 2) the data for 2015 were compared with the trend development per gas since 1990. The checks of outliers are performed on a more detailed level of the sub-sources in all sector background tables:
• annual changes in emissions; • annual changes in activity data;
• annual changes in implied emission factors and • level values of implied emission factors.
Exceptional trend changes and observed outliers are noted and discussed at the trend analysis workshop, resulting in an action list. Items on this list have to be processed within 2 weeks or be dealt with in next year’s inventory.
Archiving and documentation
Internal procedures are agreed on (e.g., in the PRTR work plan) for general data collection and the storage of fixed data sets in the PRTR database, including the documentation/archiving of QC checks. As of 2010, sector experts can store relating documents (i.e. interim results, model runs, etc.) on a central server at the RIVM. These documents then become available through a limited-access website. Moreover, updating of monitoring protocols for substances under the CLRTAP is one of the priorities within the PRTR system. Emphasis is placed on documentation of methodologies for calculating SOx, NOx, NMVOC, NH3,
PM10 and PM2.5. Methodologies, protocols and emission data (including
emissions from large point sources on the basis of Annual Environmental Reports), as well as such emission reports as the National Inventory List of allocations
for compiling from the PRTR-database to the NFR-tables
08-02-2017
RIVM Input for
compiling the EMEP/LRTAP report (NFR format) “NFR-ER-Koppellijst-2017-02-08-dtt52-verwerktBL.xlsx”
Page 18 of 172
Report (UNFCCC) and the Informative Inventory Report (CLRTAP), are made available on the website of the PRTR: www.prtr.nl.
1.7 Uncertainties
Uncertainty assessments constitute a means to either provide the inventory users with a quantitative assessment of the inventory quality or to direct the inventory preparation team to priority areas, where improvements are warranted and can be made cost-effective. For these purposes, quantitative uncertainty assessments have been carried out since 1999. However, awareness of uncertainties in emission figures was expressed earlier in the PRTR in so-called quality indices and in several studies on industrial emissions and generic emission factors for
industrial processes and diffuse sources. To date, the Dutch PRTR is restricted to one value per type of emission (calculation result, rounded off to three significant digits).
The information on the uncertainty about emission figures presented here is based on the TNO report ‘Uncertainty assessment of NOx, SO2
and NH3 emissions in the Netherlands’ (Van Gijlswijk et al., 2004), which
presents the results of a Tier 2 ‘Monte Carlo’ uncertainty assessment. This uncertainty assessment is based on emissions in the year 2000. Since then, several improvements in activity data and methods (e.g. total N to TAN; see Chapter 6) have been implemented. Furthermore, for use of the uncertainties in prioritising improvements it’s necessary that the uncertainties are quantified at the level of emission sources, both for activity data as for emission factors. Therefore, it is necessary to update the uncertainty assessment. This update was started in 2015 with estimating the uncertainties for activity data and emission factors based on expert judgements from the emission experts. The estimation of uncertainties will be finalised in 2017. The uncertainty data is stored in the PRTR database. To process the uncertainty information to the national, sectorial and sub-sectorial level a Monte Carlo-analyses is implemented in the database. The Monte Carlo-analysis on the uncertainties for the pollutants NH3, NOx, SOx, NMVOC and PM is
planned for 2017 and results will be presented in the next IIR. Known – but unquantifiable - systematic biases in emission estimates are not explicitly addressed in the Monte Carlo-analysis. E.g. the share of condensable particles in PM-emissions is still unknown and also possible gaps in enforcement of emission regulations cannot be quantified.
1.7.1 Quantitative uncertainty
Uncertainty estimates on national total emissions have been reported in the Dutch Environmental Balances since 2000 (PBL, 2012). These
estimates were based on uncertainties per source category, using simple error propagation calculations (Tier 1). Most uncertainty estimates were based on the judgement of RIVM/PBL emission experts. A preliminary analysis on NMVOC emissions showed an uncertainty range of about 25%. Van Gijlswijk et al. 2004) assessed the uncertainty in the
contribution from the various emission sources to total acidification (in acidification equivalents) according to the Tier 2 methodology
Page 19 of 172
analysis). See Table 1.2 for results. A comparison was also made between the Tier 1 and Tier 2 methodologies. This was not straightforward, as the two studies used a different knowledge
collection. The 2000 Tier 1 analysis used CLRTAP default uncertainties for several NOx processes, which explains the difference with the 1999
Tier 1 results. For NH3, the difference between the 2000 Tier 1 and Tier
2 can be explained by taking non-normal distributions and dependencies between individual emission sources per animal type into account (both are violations of the Tier 1 assumptions: effects encapsulated in the 1999 Tier 1 analysis). The differences for SO2 and total acidifying
equivalents are small. The conclusion drawn from this comparison is that focusing on the order of magnitude of the individual uncertainty
estimates, as in the RIVM (2001) study, provides a reasonable first assessment of the uncertainty of source categories.
Table 1.2 Uncertainty (95% confidence ranges) in acidifying compounds and for total acidifying equivalents for emissions in 1999 (RIVM, 2001) and 2000 (Van Gijlswijk et al., 2004)
Component Tier 1 for
1999 Tier 1 for 2000 Tier 2 for 2000
NH3 ± 17% ± 12% ± 17%
NOx ± 11% ± 14% ± 15%
SO2 ± 8% ± 6% ± 6%
Total acid
equivalents ± 9% ± 8% ± 10%
The RIVM (2001) study draws on the results from an earlier study on the quality of nitrogen oxide (NOx) and sulphur dioxide (SO2) emissions,
as reported by individual companies for point sources under their national reporting requirements. In addition to providing quantitative uncertainty estimates, the study yielded important conclusions. For example, it was concluded that a limited number of facilities showed high uncertainties (e.g. 50% or more for NOx), which could be reduced
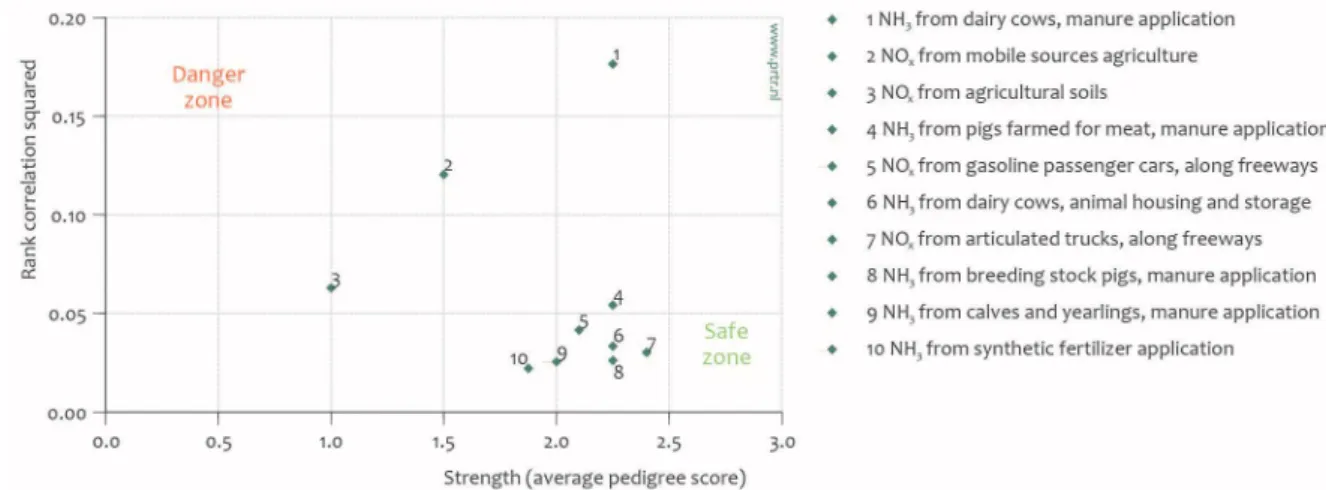
with little extra effort, and that companies generally have a lack of knowledge on the uncertainty about the emissions they report. In the study by Van Gijlswijk et al. (2004), emission experts were systematically interviewed on quantitative uncertainties, which provided simultaneous information on the reliability and quality of the underlying knowledge base. For processes not covered by interviews, standard default uncertainties, derived from the Good Practice Guidance for CLRTAP emission inventories, were used (Pulles & Van Aardenne, 2001). The qualitative knowledge (on data validation, methodological aspects, empirical basis and proximity of data used) was combined into a score for data strength, based on the so-called NUSAP approach (Van der Sluijs et al., 2003; Van der Sluijs et al., 2005). The qualitative and quantitative uncertainties were combined in so-called diagnostic
diagrams that may be used to identify areas for improvement, since the diagrams indicate strong and weak parts of the available knowledge (see Figure 1.3). Sources with a relatively high quantitative uncertainty and weak data strength are thus candidates for improvement. To effectively reduce uncertainties, their nature must be known (e.g. random,
Page 20 of 172
systematic or knowledge uncertainty). A general classification scheme on uncertainty typology is provided by Van Asselt (2000).
Figure 1.3 NUSAP diagnostic diagram indicating strong and weak elements in the available knowledge on acidifying substances
1.8 Explanation on the use of notation keys
The Dutch emission inventory covers all relevant sources specified in the CLRTAP that determine the emissions to air in the Netherlands. Because of the long history of the inventory it is not always possible to specify all subsectors in detail. This is the reason why notation keys are used in the emission tables (NFR). These notation keys will be explained in tables 1.3 to 1.5. For most cases where ‘NE’ as notation key has been used, the respective source is assumed to be negligible and sometimes there is also no method available for estimation of the respective source. IE notation keys have been included in the category listed under Notes in NFR-tables, see column D.
Table 1.3 The Not Estimated (NE) notation key explained
NFR13 code Substance(s) Reason for not estimated
All PCBs respective sources are assumed negligible
1A1b NH3, Pb-Zn, PAHs, HCBs
respective source is assumed negligible; no method available
1A1c All, except SO2 and NOx respective sources are assumed negligible
1A2a NH3, As, Cu, Ni, Se, PAHs HCBs respective sources are assumed negligible
1A2b HCBs respective sources are assumed negligible
1A2c Pb, Cd, As, Se, PAHs, HCBs respective sources are assumed negligible
1A2d Pb, Cd, As, Se, PAHs, HCBs respective sources are assumed negligible
1A2e Pb-Zn respective source is assumed negligible; no method available
1A2f All respective source is assumed negligible
1A2gvii HCBs respective source is assumed negligible
1A3b-d HCBs respective sources are assumed negligible
Page 21 of 172
NFR13 code Substance(s) Reason for not estimated
1A4bi NH3 respective source is assumed negligible
1A4bii HCBs respective source is assumed negligible
1A4ci NH3, Pb-Zn respective source is assumed negligible
1A4cii HCBs respective source is assumed negligible
1A4ciii Pb-As, Se, HCBs respective source is assumed negligible
1A5a NH3, Pb-Zn, HCBs respective source is assumed negligible
1A5b HCBs respective source is assumed negligible
1B1a NMVOC, SOx, CO, Pb-Zn, HCBs respective source is assumed negligible
1B2 SOx respective sources are assumed negligible
1B2av NMVOC respective source is assumed negligible
1B2c Pb-Zn, PCDD/PCDF, PAHs, HCBs respective sources are assumed negligible
1B2d All, except NOx respective sources are assumed negligible
2D3b, 2D3c All respective sources are assumed negligible
3B NMVOC respective sources are assumed negligible
3D, except
3Dc, 3Df TSP, PM10, PM2.5
respective sources are assumed negligible
3Da4 NOx, NH3, TSP, PM10, PM2.5 respective source is assumed negligible
3De NOx, SO2 respective source is assumed negligible
3Df NOSe x, NMVOC, SO2, NH3, CO, Pb- respective source is assumed negligible
3F All respective sources are assumed negligible
3I All respective sources are assumed negligible
6A All, except NH3, TSP, PM10, PM2.5 respective sources are assumed negligible Table 1.4 The Included Elsewhere (IE) notation key explained
NFR13 code Substance(s) Included in NFR code
1A3aii(i) All 1A3ai(i)
1A3e All 1A2f, 1A4cii, 1B2b
1B1a TSP, PM10, PM2.5 2H3
1B2c NMVOC, TSP, PM10, PM2.5, CO 1B2b, 1B2aiv
2A2 NOx, NMVOC, SO2 2A6
2A5a NMVOC 2H3
2A5b NOx, NMVOC, SO2 2A6
2A5c NOx, NMVOC, SO2 2A6
2B1 NMVOC, NH3 2B10a 2B2 NMVOC, NH3 2B10a 2B5 NMVOC, NH3 2B10a 2B6 NMVOC, NH3 2B10a 2B7 NMVOC, NH3 2B10a 2B10b NMVOC, NH3 2B10a 2C4 All 2C7c 2C7d All 2H3 2D3g NMVOC 2B10a 2G All 2D3i
Page 22 of 172
NFR13 code Substance(s) Included in NFR code
2L All 2H3 3B4giii NOx, NH3, PM10, PM2.5 3B4gii 3B4giv NOx, NH3, PM10, PM2.5 3B4gii 3Da1 NOx 11C 3Da3 NOx 11C 5A NOx, SO2, TSP, PM10, PM2.5, BC, CO 1A1a 5B2 NOx, SO2, TSP, PM10, PM2.5, BC, CO 1A4ai 5D1 NOx, SO2, TSP, PM10, PM2.5, BC, CO 1A4ai 5D2 NOx, SO2, TSP, PM10, PM2.5, BC, CO 1A4ai
Table 1.5 Sub-sources accounted for in reporting ‘other’ codes
NFR13 code Substance(s) reported Sub-source description
1A2gviii
Combustion in not elsewhere reported industries, machineries, services and product making activities.
1A5a Combustion gas from landfills.
1A5b Recreational navigation and ground machinery at airports.
2A6 Processes, excl. combustion, in building activities and production of building materials.
2B10a
Production of chemicals, paint, pharmaceutics, soap, detergents, glues and other chemical products.
2C7c Production of non-ferrous metals.
2D3i
Smoking tobacco products, burning candles, air conditioning, use of pesticides; cosmetics, fireworks, preservation and cleaning of wood and other materials.
2H3
Making products of wood, plastics, rubber, metal, textiles and paper. Storage and handling.
3B4h
NOx, NH3,
TSP, PM10,
PM2.5
Rabbits and furbearing animals.
3Da2c NOx, NH3 Use of compost.
5E
Preparation for recycling, scrapping of white goods and decontamination.
6A
Human transpiration and breathing; manure application to private domains and nature; horses and ponies from private owners.
Page 23 of 172
2
Trends in emissions
2.1 Trends in national emissions
The Dutch NH3 emission series are dangling about the national emission
ceiling set for the year 2010 (NEC2010). For NOx, SO2 and NMVOC the
Netherlands is in compliance with the respective ceilings in 2015. The emissions of all substances showed a downward trend in the 1990-2015 period (see Table 2.1). The major overall drivers for this trend are:
• emission reductions in the industrial sectors; • cleaner fuels;
• cleaner cars.
Road transport emissions have decreased 87% since 1990 for NMVOC, 76% for PM, 70% for NOx and 99% for SO2, despite a growth in road
transport of 13%. The decrease is mainly attributable to European emission regulations for new road vehicles. For PM and NOx, standards
have been set for installations by tightening up the extent of emission stocks of heating installations (BEES). In meeting these requirements, Dutch industrial plants have realised a reduction of 93% in PM emissions and 62% in NOx emissions, since 1990. Sections 2.2-2.8 elaborate in
more detail on the drivers for the downward emission trend for specific substances.
Table 2.1 Total national emissions, 1990-2015
Main Pollutants Particulate Matter Other
NO x N M V OC SO x NH 3 PM 2. 5 PM 10 TS P BC CO Year Gg Gg Gg Gg Gg Gg Gg Gg Gg 1990 604 490 193 369 51 74 97 13 1143 1995 505 349 131 227 38 55 73 11 918 2000 420 244 73 178 28 43 51 10 752 2005 369 181 64 156 22 35 43 8 723 2010 300 165 34 135 17 30 37 5 675 2014 234 143 29 127 13 27 35 3 563 2015 228 139 30 128 13 26 34 3 570 1990-2015 period 1) -376 -351 -163 -241 -38 -48 -64 -10 -573 1990-2015 period 2) -62% -72% -84% -65% -75% -64% -65% -75% -50% 1) Absolute difference in Gg 2) Relative difference to 1990 in %
Page 24 of 172
Priority Heavy Metals POPs Other Heavy Metals
Pb Cd Hg DIOX PAH As Cr Cu Ni Se Zn Year Mg Mg Mg g I-Teq Mg Mg Mg Mg Mg Mg Mg 1990 332 2.1 3.6 742 20 1.3 12 37 73 0.4 224 1995 153 1.1 1.5 66 10 0.9 8.5 38 84 0.3 146 2000 27 1.0 1.1 31 5.1 0.9 5.0 39 19 0.5 95 2005 30 1.8 1.0 30 5.1 1.3 4.3 41 10 2.6 88 2010 38 2.6 0.6 31 4.9 0.6 3.8 45 2 1.5 102 2014 9 0.6 0.6 22 4.7 0.7 3.5 43 2 0.8 117 2015 9 0.6 0.5 22 4.7 0.7 3.4 41 2 1.0 101 1990-2015 period 1) -323 -1.5 -3.0 -721 -15 -0.6 -8.4 3.8 -71 0.6 -123 1990-2015 period 2) -97% -71% -85% -97% -76% -49% -71% 10% -97% 150% -55% 1) Absolute difference in Gg 2) Relative difference to 1990 in %
2.2 Trends in sulphur dioxide (SO2)
The Dutch SOx emissions (reported as SO2) decreased by 163 Gg in the
1990-2015 period, corresponding to 84% of the national total in 1990 (Figure 2.1). Main contributions to this decrease came from the energy, industry and transport sectors. The use of coal declined and major coal-fired electricity producers installed flue-gas desulphurisation plants. The sulphur content in fuels for the (chemical) industry and traffic was also reduced. At present the industry, energy and refining sector (IER) is responsible for 97% of the national SO2 emissions.
Page 25 of 172
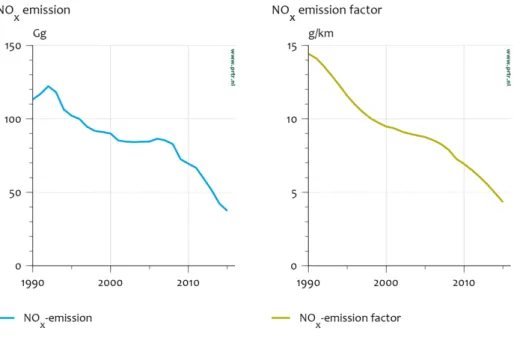
Page 26 of 172
2.3 Trends in nitrogen oxides (NOx)
The Dutch NOx emissions (NO and NO2, expressed as NO2) decreased by
376 Gg in the 1990-2015 period, corresponding to 62% of the national total in 1990 (Figure 2.2). Main contributors to this decrease are road transport and the energy sector. Although emissions per vehicle decreased significantly in this period, an increase in number and
mileages of vehicles partially negated the effect on total road transport emissions. The shares of the different NFR categories in the national total did not change significantly.
Page 27 of 172 2.4 Trends in ammonia (NH3)
Most of the NH3 emissions (at present, 87%) come from agricultural
sources. From 1990-2013, the decreasing trend in NH3 due to emission
reductions from agriculture also shows in the decreasing trend of the national total. From 2014 onwards, however, NH3 emissions rose to a
national total just around 128 Gg which is the maximum set to this by the European Union since 2010. As a result of the good quality of grass, fed to dairy cattle, digestibility and therefore NH3 emission per animal
increased. In combination with the growth in animal number, total NH3
emissions increased.
Page 28 of 172
2.5 Trends in non-methane volatile organic compounds (NMVOC)
The Dutch NMVOC emissions decreased by 351 Gg in the 1990-2015 period, corresponding with 72% of the national total in 1990 (Figure 2.4). All major source categories contributed to this decrease: transport (introduction of catalysts and cleaner engines), product use (intensive programme to reduce NMVOC content in consumer products and paints) and industry (introducing emission abatement specific for NMVOC).
Page 29 of 172 2.6 Trends in PM2.5
PM2.5 emissions are calculated as a specific fraction of PM10 by sector
(based on Visschedijk et al., 2007) and decreased by 38 Gg in the 1990-2015 period, corresponding with 75% of the national total in 1990 (Figure 2.5). The two major source categories contributing to this
decrease were the industrial sector (combustion and process emissions), due to cleaner fuels in refineries and the side effect of emission
abatement for SO2 and NOx and the transport sector.
Page 30 of 172 2.7 Trends in PM10
Dutch PM10 emissions decreased by 48 Gg in the 1990-2015 period,
corresponding with 64% of the national total in 1990 (Figure 2.6). The major source categories contributing to this decrease are:
• industry (combustion and process emissions), due to cleaner fuels in refineries and the side-effect of emission abatement for SO2 and NOx;
• traffic and transport.
Page 31 of 172
PM10 emissions from animal husbandry in agriculture did not change
significantly; neither did the emissions from consumers (1A4bi).
2.8 Trends in Pb
Lead (Pb) emissions in the Netherlands decreased by 323 Mg in the 1990-2015 period, corresponding with 97% of the national total in 1990 (Figure 2.7). This decrease is attributable to the transport sector, where, due to the removal of Pb from gasoline, the Pb emissions collapsed. The remaining sources are industrial process emissions, in particular from the iron and steel industry.
Page 33 of 172
3
Energy
3.1 Overview of the sector
Emissions from this sector include all energy-related emissions from stationary combustion. Furthermore it includes fugitive emissions from the energy sector.
Part of the emissions from stationary combustion for electricity production and industry (NFR categories 1A1 and 1A2) are reported based on environmental reports by large industrial companies. For SO2,
98% of the emissions is reported based on environmental reports, while for other pollutants this is 99% (NH3), 87% (NMVOC), 85% (NOx) and
90% (PM10) in 2015. It should be noted that these percentages include
not only the data directly from the AERs but also the initial gap filling at company level performed by the competent authorities. The emission data in the Annual Environmental Reports (AERs) come from direct emission measurements or from calculations using fuel input and emission factors. Most of the emissions from other stationary combustion (categories 1A4 and 1A5) are calculated with energy statistics and default emission factors.
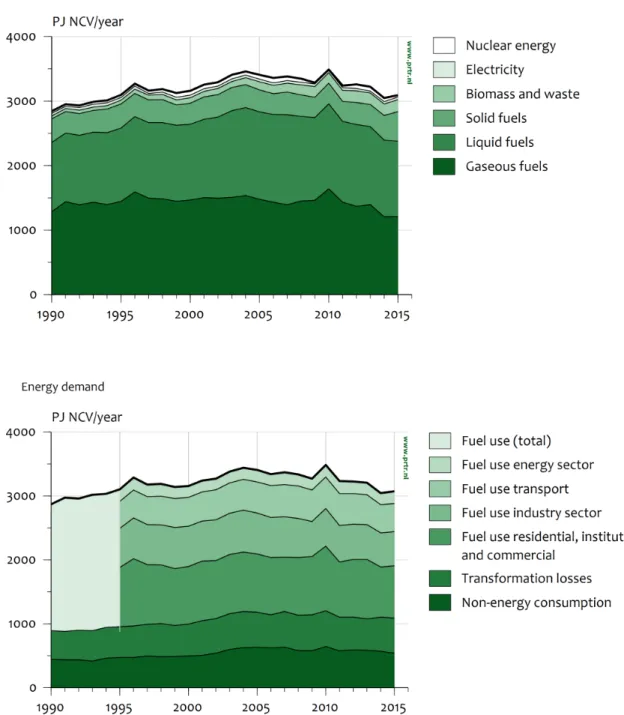
As for most developed countries, the energy system in the Netherlands is largely driven by the combustion of fossil fuels. In 2015, natural gas supplied about 41% of the total primary fuels used in the Netherlands, followed by liquid fuels (39%) and solid fossil fuels (15%). The
contribution of non-fossil fuels, including renewables and waste streams, is rather limited (5%). Figure 3.1 shows the energy supply and energy demand in the Netherlands.
The energy statistics are available on the website of Statistics
Netherlands. The following link refers to the energy statistics of 2015. Using the button “Change selection” on the website, it is possible to select the data of another year.
Energy statistics of 2015:
http://statline.cbs.nl/Statweb/publication/?VW=T&DM=SLEN&PA=83140
Page 34 of 172
Figure 3.1 Energy supply and demand in the Netherlands. For the years 1990 – 1994, only the total fuel use is shown
Page 35 of 172 3.2 Public electricity and heat production (1A1a)
3.2.1 Source category description
In this sector, one source category is included: Public electricity and heat production (1A1a). This sector consists mainly of coal-fired power stations and gas-fired cogeneration plants, with many of the latter being operated as joint ventures with industries. Compared to other countries in the EU, nuclear energy and renewable energy (biomass and wind) provide a small amount of the total primary energy supply in the Netherlands.
3.2.2 Key sources
The sector 1A1a is a key source for the pollutants mentioned in Table 3.1.
Table 3.1 Pollutants for which the Public electricity and heat production (NFR 1A1a) sector is a key source
Category / Sub-category Pollutant Contribution to national
total of 2015 (%) 1A1a Public electricity and
heat production SOx 28.5
NOx 8.8
PM2.5 2.2
Hg 40.8
3.2.3 Overview of shares and trends in emissions
An overview of the trends in emissions is shown in Table 3.2. For almost all pollutants emissions decreased between 1990 and 2015, while fuel consumption increased over the same period.
The NOx and SOx emissions decreased by 76% and 82%. Other pollutant
emissions decreased by 29% to 99%. The decrease in emissions was partly caused by a shift from coal to gas consumption. Furthermore, the decrease in emissions was caused by technological improvements. The only pollutants for which the emissions have increased are NMVOC and NH3 due to an increase in activity rate. For Se, the increase of a factor
45 is caused by environmental reports being considered for the later years, while for the earlier years only little or no information was available.
Page 36 of 172
Table 3.2 Overview of trends in emissions
Main Pollutants Particulate Matter Other
NO x N M V OC SO x NH 3 PM 2. 5 PM 10 TS P BC CO Year Gg Gg Gg Gg Gg Gg Gg Gg Gg 1990 83 0.7 48 0 1.9 2.2 2.3 0 8.2 1995 62 1.1 17 0.039 0.4 0.5 0.5 0 7.4 2000 52 2.2 15 0.038 0.3 0.3 0.3 0 15.8 2005 43 0.6 10 0.252 0.4 0.5 0.6 0 8.2 2010 26 0.3 7 0.074 0.2 0.3 0.4 0 5.0 2014 19 1.4 9 0.081 0.2 0.3 0.5 0 4.4 2015 20 0.5 9 0.090 0.3 0.4 0.5 0 4.2 1990-2015 period 1) -63 -0.2 -40 0.090 -1.6 -1.8 -1.8 0 -4.0 1990-2015 period 2) -76% -29% -82% -85% -83% -78% -49%
Priority Heavy Metals POPs Other Heavy Metals
Pb Cd Hg DIOX PAH As Cr Cu Ni Se Zn Year Mg Mg Mg g I-Teq Mg Mg Mg Mg Mg Mg Mg 1990 16 0.95 1.9 568 0.17 0.50 0.62 2.05 2.49 0.02 40.7 1995 2 0.16 0.4 6.0 0.05 0.20 0.37 0.44 1.41 0.05 3.3 2000 0.2 0.08 0.4 0.1 0.00 0.08 0.19 0.17 0.08 0.45 0.3 2005 0.2 0.09 0.4 0.7 0.01 0.16 0.33 0.28 1.91 1.68 0.5 2010 0.3 0.18 0.2 1.2 0.01 0.11 0.14 0.15 0.16 1.33 3.9 2014 0.2 0.03 0.2 1.0 0.02 0.07 0.18 0.18 0.08 0.70 4.4 2015 0.2 0.03 0.2 1.0 0.03 0.06 0.17 0.17 0.17 0.91 4.1 1990-2015 period 1) -16 -0.9 -1.7 -567 -0.14 -0.44 -0.5 -1.9 -2.3 0.9 -36.6 1990-2015 period 2) -99% -97% -88% -100% -83% -88% -73% -92% -93% 4497% -90% 1) Absolute difference 2) Relative difference to 1990 in %
3.2.4 Activity data and (implied) emission factors
Emission data are based on Annual Environmental Reports (AERs) and collectively estimated industrial sources. For this source category, 90% to 100% of the emissions are based on AERs. For estimation of
emissions from collectively estimated industrial sources, National Energy Statistics (from Statistics Netherlands) are combined with implied
emission factors from the AERs or with default emission factors (see table 3.3).
3.2.5 Methodological issues
Emissions are based on data in Annual Environmental Reports (AERs) from individual facilities (Tier-3 methodology). The emissions and fuel consumption data in the AERs are systematically examined for
Page 37 of 172
inaccuracies by checking the resulting implied emission factors (IEFs). If environmental reports provide data of high enough quality, the
information is used for calculating an ‘implied emission factor’ for a cluster of reporting companies (aggregated by NACE code). These emission factors are fuel and sector dependent and are used to calculate the emissions from companies that are not individually assessed.
EF ER-I (NACE, fuel) =
Emissions ER-I (NACE, fuel)
Energy use ER-I (NACE, fuel)
where:
EF = Emission factor
ER-I = Emission Registration database for individual companies Next, combustion emissions from the companies that are not individually assessed in this NACE category are calculated from the energy use according to the Energy Statistics (from Statistics Netherlands),
multiplied by the implied emission factor. If the data from the individual companies are insufficient to calculate an implied emission factor, then a default emission factor is used (see Table 3.3).
ER-C_emission (NACE, fuel) = EF ER-I(NACE, fuel) * Energy Statistics (NACE, fuel)
where:
ER-C = Emission Registration database for collective emission sources
The total combustion emissions are the sum of the emission from the individual companies (ER-I) plus the emissions from the companies that are not individually assessed (ER-C).
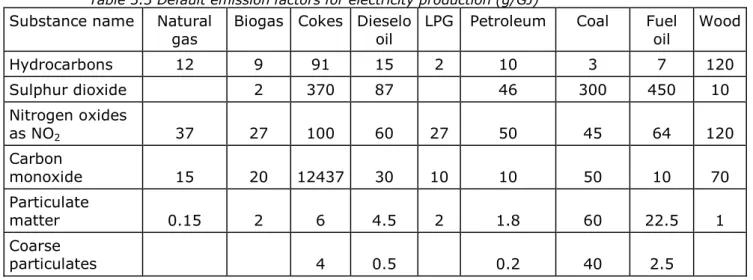
Table 3.3 Default emission factors for electricity production (g/GJ)
Substance name Natural
gas Biogas Cokes Dieselooil LPG Petroleum Coal Fuel oil Wood
Hydrocarbons 12 9 91 15 2 10 3 7 120 Sulphur dioxide 2 370 87 46 300 450 10 Nitrogen oxides as NO2 37 27 100 60 27 50 45 64 120 Carbon monoxide 15 20 12437 30 10 10 50 10 70 Particulate matter 0.15 2 6 4.5 2 1.8 60 22.5 1 Coarse particulates 4 0.5 0.2 40 2.5
3.2.6 Uncertainties and timeseries consistency
Page 38 of 172
3.2.7 Source-specific QA/QC and verification
The emissions and fuel consumption data in the AERs are systematically examined for inaccuracies by checking the resulting implied emission factors. If environmental reports provide data of high enough quality (see section 1.6 on QA/QC), the information is used.
3.2.8 Source-specific recalculations
Emissions of the following sources have been recalculated:
• Following an update in the calculation methodology, Zn and PM10
emissions from waste incineration plants used for electricity generation have been recalculated for the period 2006-2014 • In the waste incineration plants, emissions from other pollutants
have been corrected in 2014 following the use of updated emission factors
3.2.9 Source-specific planned improvements
There are no source-specific planned improvements.
3.3 Industrial Combustion (1A1b, 1A1c and 1A2)
3.3.1 Source category description
This source category consists of the following categories: • 1A1b Petroleum refining
• 1A1c Manufacture of solid fuels and other energy industries • 1A2a Iron and Steel
• 1A2b Non-ferrous Metals • 1A2c Chemicals
• 1A2d Pulp, Paper and Print
• 1A2e Food Processing, Beverages and Tobacco • 1A2f Non-metallic minerals
• 1A2gviii Other
The sector 1A2gviii includes industries for mineral products (cement, bricks, other building materials, glass), textiles, wood and wood products, machinery.
3.3.2 Key sources
The sectors 1A1b, 1A2c and 1A2gviii are key sources for the pollutants mentioned in Table 3.4.
Table 3.4 Pollutants for which the Industrial Combustion (NFR 1A1b, 1A1c and 1A2) sector is a key source
Category / Sub-category Pollutant Contribution to total of 2015 (%)
1A1b Petroleum refining SOx 28.5
1A2a Stationary combustion in manufacturing industries and construction: Iron and steel
SOx NOx CO 9.9 2.6 11.5 1A2c Stationary combustion in
manufacturing industries and construction: Chemicals
NOx 4.0
1A2gviii Stationary combustion in
manufacturing industries and construction: Other
SOx
Page 39 of 172
3.3.3 Overview of shares and trends in emissions
An overview of the trends in emissions is shown in Table 3.5. Emissions have reduced since 1990 for most pollutants, except for NH3 and
dioxins. Reduction in emissions of main pollutants has been caused by improvement in used abatement techniques. Fluctuation in dioxin emissions have been caused by differences in fuels used and/or incidental emissions. Emission reduction of SO2 and PM10 is mainly
caused by a shift in fuel use by refineries from oil to natural gas.
Table 3.5 Overview of trends in emissions
Main Pollutants Particulate Matter Other
NO x N M V OC SO x NH 3 PM 2. 5 PM 10 TS P BC CO Year Gg Gg Gg Gg Gg Gg Gg Gg Gg 1990 101 6.3 110 0.57 6.1 7.9 8.3 0.37 266 1995 78 6.9 89 0.32 5.0 6.4 6.6 0.36 215 2000 49 2.1 46 0.05 3.1 4.7 4.7 0.29 160 2005 49 2.6 46 0.06 0.9 1.8 2.0 0.11 153 2010 40 3.9 24 0.43 0.35 0.5 0.8 0.02 124 2014 35 3.5 19 0.30 0.34 0.5 0.6 0.01 90 2015 35 2.9 20 0.40 0.31 0.4 0.6 0.01 96 1990-2015 period 1) -66 -3.3 -90 -0.17 -5.8 -7.5 -7.7 -0.36 -170 1990-2015 period 2) -65% -53% -82% -30% -95% -95% -93% -98% -64%
Priority Heavy Metals POPs Other Heavy Metals
Pb Cd Hg DIOX PAH As Cr Cu Ni Se Zn Year Mg Mg Mg g I-Teq Mg Mg Mg Mg Mg Mg Mg 1990 1.9 0.14 0.18 0.01 0.99 0.17 2.5 1.4 64 0.04 2.9 1995 3.9 0.17 0.08 1.02 0.38 0.15 3.1 2.3 79 0.05 3.5 2000 0.04 0.01 0.11 0.35 0.004 0 0.51 0.15 17 0.002 0.84 2005 0.01 0.003 0.004 0.94 0.10 0.78 0.08 0.09 7 0.08 0.51 2010 3.1 1.28 0.02 5.79 0.13 0.013 0.14 1.13 0.02 0.12 9.8 2014 0.12 0.001 0.05 0.20 0.09 0.001 0.01 0.00 0.11 0.0001 0.9 2015 0.09 0.001 0.05 0.19 0.10 0.001 0.01 0.00 0.11 0.0001 1.2 1990-2015 period 1) -1.79 -0.14 -0.13 0.18 -0.90 -0.17 -2.47 -1.39 -64 -0.04 -1.78 1990-2015 period 2) -95% -99% -73% 2108% -90% -100% -100% -100% -100% -100% -61% 1) Absolute difference 2) Relative difference to 1990 in %
Page 40 of 172
3.3.4 Activity data and (implied) emission factors
Petroleum refining (1A1b)
All emission data have been based on Annual Environmental Reports (AERs).
Manufacture of solid fuels and other energy industries (1A1c)
Emission data have been based on AERs and collectively estimated industrial sources.
Iron and steel (1A2a)
Emission data have been based on AERs and collectively estimated industrial sources. For this source category, 1% of the SOx emissions
are collectively estimated (in 2015), thus 99% based on the AERs.
Non-ferrous metals (1A2b)
Emission data have been based on AERs and collectively estimated industrial sources. For this source category, 23% of the NMVOC emission, 9% of the NOx emissions and 16% of the SOx emissions are
collectively estimated (in 2015).
Chemicals (1A2c)
Emission data have been based on AERs and collectively estimated industrial sources. For this source category, 4% of the NOx, 3% of the
SOx emissions and 2% of the NMVOC and 1% of the PM10 emissions are
collectively estimated (in 2015).
Pulp, paper and print (1A2d)
Emission data have been based on AERs and collectively estimated industrial sources. For this source category, 32% NMVOC emissions and 12% of NOx emissions are collectively estimated (in 2015).
Food processing, beverages and tobacco (1A2e)
Emission data have been based on AERs and collectively estimated industrial sources.
Non-metallic minerals (1A2f)
Emission data have been based on AERs and collectively estimated industrial sources.
Other (1A2gviii)
This sector includes all combustion emissions from the industrial sectors not belonging to the categories 1A2a to 1A2e. Emission data have been based on AERs and collectively estimated industrial sources.
For some of the above mentioned categories, emissions were not entirely available from the AERs. For these sectors, emissions were calculated using National Energy Statistics and implied emission factors from the environmental reports or default emission factors (see Table 3.6).
3.3.5 Methodological issues
Emissions are based on data in AERs from individual facilities (Tier 3 methodology). The emissions and fuel consumption data in the AERs are systematically examined for inaccuracies by checking the resulting implied emission factors. If environmental reports provide data of high
Page 41 of 172
enough quality, the information is used for calculating an ‘implied emission factor’ for a cluster of reporting companies (aggregated by NACE code). These emission factors are fuel and sector dependent and are used to calculate the emissions from companies that are not individually assessed.
EF ER-I (NACE, fuel) =
Emissions ER-I (NACE, fuel)
Energy use ER-I (NACE, fuel)
where:
EF = Emission factor
ER-I = Emission Registration database for individual companies Next, combustion emissions from the companies that are not individually assessed in this NACE category are calculated from the energy use according to the Energy Statistics (from Statistics Netherlands),
multiplied by the implied emission factor. If the data from the individual companies are insufficient to calculate an implied emission factor, then a default emission factor is used (see Table 3.6).
ER-C_emission (NACE, fuel) = EF ER-I(NACE, fuel) * Energy Statistics (NACE, fuel)
where:
ER-C = Emission Registration database for collective emission sources
The total combustion emissions are the sum of the emission from the individual companies (ER-I) plus the emissions from the companies that are not individually assessed (ER-C).
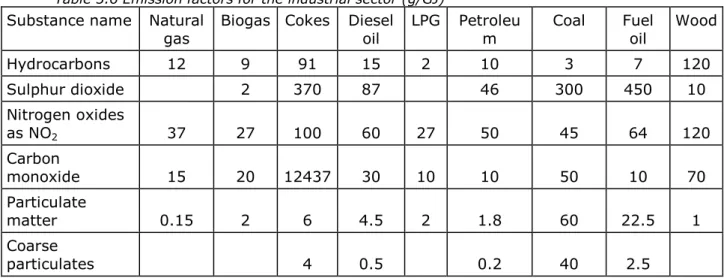
Table 3.6 Emission factors for the industrial sector (g/GJ)
Substance name Natural
gas Biogas Cokes Diesel oil LPG Petroleum Coal Fuel oil Wood
Hydrocarbons 12 9 91 15 2 10 3 7 120 Sulphur dioxide 2 370 87 46 300 450 10 Nitrogen oxides as NO2 37 27 100 60 27 50 45 64 120 Carbon monoxide 15 20 12437 30 10 10 50 10 70 Particulate matter 0.15 2 6 4.5 2 1.8 60 22.5 1 Coarse particulates 4 0.5 0.2 40 2.5
3.3.6 Uncertainties and timeseries consistency
Page 42 of 172
3.3.7 Source-specific QA/QC and verification
The emissions and fuel consumption data in the AERs were
systematically examined for inaccuracies by checking the resulting implied emission factors. If the environmental reports provided data of high enough quality (see section 1.6 on QA/QC), the information was used.
3.3.8 Source-specific recalculations
Emissions of the following sources have been recalculated: • Activity data for diesel in the energy statistics have been
improved
• PM10, PM2.5, BC, NOx and SOx have been corrected for earlier
years (2013, 2014) from the corrected annual environmental reports of two companies
• An error has been corrected in the NOx emissions extracted from the Annual Environmental Reports for 2013 and 2014
• PM2.5 emissions from the chemical industry have been updated, following the use of a company specific EF instead of the default
3.3.9 Source-specific planned improvements
There are no source-specific planned improvements.
3.4 Other Stationary Combustion (1A4ai, 1A4bi, 1A4ci and 1A5a)
3.4.1 Source-category description
This source category comprises the following subcategories:
• 1A4ai Commercial/Institutional: Stationary. This sector comprises commercial and public services, such as banks, schools and hospitals, trade, retail and communication. It also includes the production of drinking water and miscellaneous combustion emissions from waste handling activities and from waste-water treatment plants.
• 1A4bi Residential: Stationary. This sector refers to domestic fuel consumption for space heating, water heating and cooking. About three-quarters of the sector’s consumption of natural gas is used by space heating.
• 1A4ci Agriculture/Forestry/Fisheries: Stationary. This sector comprises stationary combustion emissions from agriculture, horticulture, greenhouse horticulture, cattle breeding and forestry.
• 1A5a Other stationary. This sector includes stationary combustion of waste gas from dumping sites.
3.4.2 Key sources
The Small Combustion sector is a key source for the pollutants presented in Table 3.7.
Page 43 of 172 Table 3.7 Pollutants for which the Small Combustion (NFR 1A4 and 1A5) sector is a key source sector
Category / Sub-category Pollutant Contribution to total
of 2015 (%) 1A4ai Commercial/institutional,
stationary NOx 2.9
1A4bi Residential, stationary NOx
NMVOC CO PM10 PM2.5 BC Cd Dioxine PAH 3.6 8.1 13.7 7.9 15.5 20.7 9.4 31.9 86.9 1A4ci Agriculture/forestry/fishing, stationary NOx 4.8
3.4.3 Overview of shares and trends in emissions
An overview of the trends in emissions is shown in Table 3.8. Emissions of almost all pollutants have decreased since 1990, while fuel use increased slightly.
Page 44 of 172
Table 3.8 Overview of trends in emissions
Main Pollutants Particulate Matter Other
NO x N M V OC SO x NH 3 PM 2. 5 PM 10 TS P BC CO Year Gg Gg Gg Gg Gg Gg Gg Gg Gg 1990 42 16.2 3.3 0 2.7 2.8 5.5 0.9 81 1995 46 17.0 1.5 0 2.6 2.7 5.2 0.9 86 2000 41 15.7 0.9 0 2.3 2.4 4.8 0.9 83 2005 37 15.2 0.7 0 2.3 2.4 4.7 0.8 85 2010 38 15.4 0.6 0 2.2 2.3 4.5 0.7 85 2014 25 13.7 0.5 0 2.0 2.1 4.4 0.7 81 2015 26 13.9 0.6 0 2.0 2.1 4.4 0.7 83 1990-2015 period 1) -16 -2.3 -2.8 0 -0.6 -0.7 -1.1 -0.3 2 1990-2015 period 2) -38% -14% -83% -23% -23% -20% -27% 2%
Priority Heavy Metals POPs Other Heavy Metals
Pb Cd Hg DIOX PAH As Cr Cu Ni Se Zn Year Mg Mg Mg g I-Teq Mg Mg Mg Mg Mg Mg Mg 1990 0.78 0.07 0.12 108 3.8 0.05 3.5 0.72 2.7 0.0036 2 1995 0.12 0.05 0.04 8.1 4.0 0.02 0.05 0.34 0.5 0.0018 0.77 2000 0.08 0.05 0.03 7.3 3.9 0.01 0.00 0.32 0.01 0.0000 0.70 2005 0.08 0.05 0.03 7.0 4.1 0.00 0.01 0.35 0.2 0.0001 0.76 2010 0.09 0.05 0.03 6.8 4.1 0.01 0.00 0.38 0.02 0.0000 0.82 2014 0.09 0.06 0.03 6.9 4.2 0.00 0.00 0.40 0.01 0.0000 0.85 2015 0.09 0.06 0.04 7.0 4.2 0.00 0.00 0.40 0.01 0.0000 0.86 1990-2015 period 1) -0.69 -0.01 -0.08 -101 0.4 -0.05 -3.5 -0.32 -2.7 -0.0036 -1.1 1990-2015 period 2) -88% -13% -69% -94% 11% -97% -100% -44% -100% -100% -57% 1) Absolute difference 2) Relative difference to 1990 in %