RIVM report 320104004/2005
ConsExpo 4.0
Consumer Exposure and Uptake Models Program Manual
J.E. Delmaar, M.V.D.Z. Park, J.G.M. van Engelen
Contact: J.E.Delmaar
Centre for Substances And Integrated Risk Assessment email: christiaan.delmaar@rivm.nl
This research was carried out by order of, and funded by, the Food and Consumer Products Safety Authority (VWA) within the scope of the project 320104, Risk Assessment for the Consumer.
Abstract
Manual for the use of ConsExpo 4.0
This report provides guidance to the use of ConsExpo 4.0, successor to ConsExpo 3.0, a computer program that was developed to assist in the exposure assessment of compounds in non-food consumer products. The wide range of available consumer products is associated with an even wider variation in consumers and product use. Measured data on exposure to compounds in products is not always available. In the absence of these data, ConsExpo 4.0 can be used to estimate the exposure for different exposure scenarios. The program offers a number of generally applicable exposure models and a database with data on exposure factors for a broad set of consumer products. Together, database and models provide the tools to assess exposure for a wide range of consumer products, whereby only basic additional information on product composition and the physicochemical properties of the compound of interest are needed.
Moreover, ConsExpo 4.0 can be used to obtain insight in the factors affecting exposure levels to compounds in consumer product by using the tools of sensitivity analysis and probabilistic calculation.
In the development of the fourth version of the program special effort has been taken to improve transparency and ease of use of the software.
This report provides an overview of ConsExpo 4.0, an explanation of the available exposure and uptake models in ConsExpo 4.0 and important notes on the interpretation of the exposure assessment.
Keywords: ConsExpo, consumer products, exposure assessment, manual, mathematical models
Rapport in het kort
Handleiding voor het gebruik van ConsExpo 4.0
Dit rapport is een handleiding voor het gebruik van ConsExpo 4.0, de opvolger van ConsExpo 3.0, een computer programma dat is ontwikkeld ter ondersteuning van de
blootstellingsschatting van stoffen in consumentenproducten. Er is een grote verscheidenheid aan consumentenproducten, consumenten en wijzen waarop deze consumenten producten gebruiken. Gemeten blootstellingsniveaus aan stoffen in producten zijn niet altijd
voorhanden.
Bij afwezigheid van deze gegevens kan ConsExpo 4.0 gebruikt worden om blootstellingen te schatten voor verschillende blootstellingsscenario’s. Het programma biedt een aantal
algemeen toepasbare blootstellingsmodellen en een database met gegevens over
blootstellingsfactoren. Tezamen bieden modellen en database een uitgangspunt van waaruit blootstelling van een specifiek product geschat kan worden.
Daarnaast kan ConsExpo 4.0 inzicht geven in de factoren die de blootstellingsniveaus van stoffen in consumentenproducten beïnvloeden door gebruik te maken van de mogelijkheden van gevoeligheidsanalyse en probabilistische berekeningen.
Bij de ontwikkeling van ConsExpo 4.0 is speciaal aandacht besteed aan het verbeteren van de transparantie en de gebruikersvriendelijkheid van de software.
Dit rapport geeft een overzicht van ConsExpo 4.0, een uitleg van de beschikbare blootstellings- en opname modellen en belangrijke informatie met betrekking tot het interpreteren van de blootstellingsschatting.
Trefwoorden: ConsExpo, consumentenproducten, blootstellingsschatting, handleiding, mathematische modellen
Contents
Samenvatting 9 Summary 10 1 Introduction 11 2 ConsExpo 4.0 framework 15 2.1 General considerations 15 2.2 Definitions 16 2.3 Available models 162.4 ConsExpo 4.0 factsheets and database 18
3 Using the ConsExpo software: the basics 21
3.1 Exposure assessment procedure 21
3.2 Entering data 22
3.3 Program sections 24
3.3.1 Product & Compound 25
3.3.2 Exposure Scenario 25
3.3.3 Exposure Routes 29
3.3.4 Output 29
4 Using the ConsExpo 4.0 software: models 35
4.1 Inhalation route 35
4.1.1 Inhalation exposure: exposure to vapour 35
4.1.2 Inhalation exposure: exposure to spray 44
4.1.3 Inhalation uptake: the fractional uptake model 51
4.2 Dermal route 52
4.2.1 Dermal exposure: direct contact with product 52
4.2.2 Dermal uptake models 57
4.3 Oral route 60
4.3.1 Oral exposure: oral exposure to product 61
4.3.2 Oral exposure: migration from packaging material 63
4.3.3 Oral uptake: fraction model 65
5 Interpretation of the results 67
5.1 Worst case estimates 67
5.2 Distributions 68
5.3 Sensitivity analysis 70
Samenvatting
ConsExpo is een computerprogramma met mathematische modellen ter ondersteuning van blootstellingsschattingen voor stoffen in consumentenproducten. Dit rapport bevat een handleiding voor het gebruik van de nieuwste versie van het programma, ConsExpo 4.0. In deze nieuwe versie is met name aandacht besteed aan het verbeteren van de
gebruikersvriendelijkheid en de transparantie van het programma.
De grote verscheidenheid aan consumentproducten gaat gepaard met een grote diversiteit van consumenten die de producten op verschillende manieren gebruiken. Deze verscheidenheid vormt een probleem voor het schatten van de blootstelling, daar er zelden gemeten
blootstellingsdata voor alle stoffen in het product voor alle denkbare blootstellingsscenario’s en alle consumentengroepen voorhanden zijn. Ter ondersteuning van de risicoschatting van stoffen in consumentenproducten kan ConsExpo 4.0 gebruikt worden om de blootstelling te schatten voor scenario’s waar gemeten data niet of in beperkte mate voorhanden zijn. Een blootstellingsschatting in ConsExpo 4.0 is een stapsgewijs proces, beginnend met het specificeren van basale informatie over product, stof en blootgestelde persoon. Vervolgens vindt modelselectie plaats per blootstellingsroute, gebaseerd op het blootstellingsscenario van het product. Een aantal duidelijk omschreven blootstellings- en opnamemodellen is
beschikbaar in ConsExpo 4.0 om blootstelling te schatten van stoffen in
consumentenproducten via inademing, via dermale of via orale blootstelling. Ieder model beschrijft een ander blootstellingsscenario, variërend van het spuiten van een insecticide in kieren en naden tot inname van stoffen uit verpakkingsmateriaal via voeding. Ter
ondersteuning van de blootstellingsschatting is er een database beschikbaar met standaard scenario’s en waarden voor allerhande consumentenproducttypes, zoals
schoonmaakmiddelen, cosmetische producten en biociden.
De resultaten van een blootstellingsschatting kunnen op een aantal manieren weergegeven worden. Met een gevoeligheidsanalyse is het mogelijk om te analyseren hoe gevoelig
blootstellings- en opnameberekeningen zijn voor variatie in de waarde van één parameter. De software accepteert ook stochastische verdelingen als invoerwaarden voor
blootstellingsparameters en kan op basis hiervan een verdeelde blootstellingsschatting uitrekenen door middel van een eendimensionale Monte Carlo analyse.
Dit rapport geeft een overzicht van ConsExpo 4.0, inclusief een uitleg van de beschikbare modellen en ondersteuning bij het interpreteren van de resultaten van de
Summary
ConsExpo is a computer program with mathematical models to assist in exposure
assessments for compounds in consumer products. The current report contains a manual for the use of the newest version of the program, ConsExpo 4.0.
In developing this new version of the software, special attention has been paid to improve the user-friendliness and the transparency of the program.
The wide variety of available consumer products is associated with a very diverse group of consumers, which use products in different ways. This variety poses a problem for exposure assessors, who often do not have measured exposure data for all compounds in the product for all conceivable exposure scenarios and all consumer groups. To assist in the risk assessment of compounds in consumer products, ConsExpo 4.0 can be used to estimate exposure for different scenarios for which measured data is insufficient or lacking.
An exposure assessment in the new version of ConsExpo is a step-by-step process, starting with providing basic information on the product, compound and exposed person.
Subsequently, models are selected per exposure route, based on the use scenario of the product. ConsExpo 4.0 offers a number of well-described different exposure and uptake models to estimate inhalation, dermal or oral exposure to compounds in consumer products. Each model describes a different exposure scenario, varying from spraying pest control product in cracks and crevices to ingestion of compounds from packaging materials via food. In support of the exposure assessment, a database is available containing default scenarios and default data for many consumer product types, such as cleaning products, cosmetics and pest control products.
The results of the exposure assessment can be investigated in a number of ways. With a sensitivity analysis it is possible to analyse how sensitive exposure and uptake estimates are to variations in the value of a single parameter. Furthermore, the software also accepts stochastic distributions as input for exposure parameters and can perform a distributed exposure assessment by means of first dimensional Monte Carlo analysis.
This report provides an overview of ConsExpo 4.0, including an explanation of the available models and guidance on the interpretation of the results of the exposure assessment.
1 Introduction
A potentially important exposure pathway of humans to environmental chemicals forms the use of consumer products containing chemicals as ingredients or residues. The assessment of exposure levels via this route is problematic. Due to the wide variety of consumer products and variation in the behavior of consumers, representative exposure data are generally not available. In these circumstances, exposure assessors are often confined to estimating exposure levels by means of (mathematical) models. ConsExpo 4.0 is a computer program with mathematical models to assist in the exposure assessment of chemicals in consumer products. The program was initially developed in the framework of the RIVM project ‘Risk assessment for consumers’ to improve risk assessment for consumer products, on request of the Dutch Food and Food Consumer Product Safety Inspectorate (VWA).
What is the rationale behind the exposure models in ConsExpo? Consumers daily use products for their personal convenience. Part of these products is food, but another part is used for all kinds of purposes. Exposure to the latter category of products is characterised by a large diversity in chemical composition and usage of products. The questions encountered during the process of human risk assessment are manifold. How to estimate exposure? Which exposure data are available? Are they representative for the situation in which the product is used? Which factors controlling exposure are important? Which dose measure to calculate? How to treat multi-route exposure? How to characterise risk? Which effects cause the main risks? On which time scale are effects relevant? For products used in residential settings (biocides, plant protection products, toys, textiles, and other kinds of consumer products) risk assessment follows the same general outline. ConsExpo is set up to facilitate model indoor exposure estimates for this process.
ConsExpo 4.0 implements a wide range of generally applicable mathematical models describing the exposure processes via inhalation, dermal contact and oral ingestion. The program contains algorithms which have also been included in the EU revised Technical Guidance Document on Risk Assessments(ECB, 2003). For all routes of exposure, ConsExpo 4.0 offers models of increasing complexity, from simple, rough estimate models to more detailed mechanistic models. The exposure assessment can be carried out using a tiered approach, starting with simple first order models that can be used to estimate the upper level of exposure, and working down to more detailed and complex models when the exposure estimation needs to be refined. In going to a more detailed exposure assessment, more data are needed. Whereas the simple, first order models require only limited, general information, the more advanced models often require very specific data that may be hard to obtain. To assist the exposure assessment on this point of data demands, the ConsExpo 4.0 program is equipped with a database of default products for which exposure scenarios have been defined
and default values for their model input parameters have been compiled from literature. This database may serve as a starting point for the exposure assessment. The justifications of the default values are given in fact sheets, which are centered on product categories. At present, fact sheets have been published on general exposure facts (Bremmer and van Veen, 2000a), paints (Bremmer and van Veen, 2000b), pest control products (Bremmer et al., 2002), toys (Bremmer and van Veen, 2002) and cosmetics (Bremmer et al., 2003). Fact sheets on cleaning products and disinfectants will be released in the near future.
ConsExpo 4.0 offers different kinds of outputs of the estimated exposures. The program calculates external exposures as air concentrations and potential doses and internal exposures as acute (on day of exposure) and (semi-)chronic (per day averaged over a year) doses. The program produces graphs of the different exposure measures as a function of time. In addition, ConsExpo 4.0 als offers the possibility to perform probabilistic calculations, using stochastically distributed input values.
To encourage the use of this tool by risk assessors, the fourth version of the application has been made substantially more user friendly than the previous versions. Exposure to
compounds in consumer products can now be assessed in a simple step-by-step process, by using limited information on the use of the product and the physicochemical properties of the compound of interest. The mathematical models available in ConsExpo 4.0 are largely the same as those in the previous version, but some have been reformulated to be more generally applicable. A few models and scenarios present in ConsExpo 3.0 were considered
inappropriate and have been removed from the program. The Indoor Exhaust Gas scenario has been removed because it is a highly specialized model- which lies outside the scope of ConsExpo. The inhalation uptake Flow Model and oral diffusion uptake model have been removed because of lack of experimental validation of the uptake models and the practical problems providing input data for these models. A new spray model has been developed on the basis of the results of experimental work conducted on sprays, replacing the spray models of the previous version (to be published).
The aim of this report is to provide guidance on how to use the newest version of the program, ConsExpo 4.0. It includes a description of the available models included in the program, as well as some important notes on the interpretation of the results.
Contact
Information on the ConsExpo program, supporting products and databases, as well as the latest version of the software are available at www.rivm.nl/consexpo. For your remarks, questions, and the reporting of problems or bugs, please contact us at ConsExpo@rivm.nl.
Important warning
It is recommended that experts in the exposure assessment are responsible for the evaluation and selection of data and the application of ConsExpo 4.0. Adequate interpretation of the results of the model is required as a basis for risk assessment.
2 ConsExpo 4.0 framework
The ConsExpo software program was developed to aid in the assessment of human risk from exposure to chemicals. One of the potentially important pathways along which humans can be exposed to chemicals is by the use of consumer products in a residential setting. The ConsExpo program implements a set of process models that facilitate the estimation of chemical exposure arising from the indoor, non-professional use of consumer products. There is a large variety of consumer products. In order to be able to cover most of these products, the ConsExpo software was set up to be generic in the sense that not the exposures from specific products are modelled but rather the more general exposure processes which may be relevant for different types and categories of products.
An important application of the ConsExpo program is in the evaluation of product safety in admittance of a product to the market. This type of evaluation has often to be done in a situation where little of the exposure is known and the exposure assessment is based on limited data. The ConsExpo framework was designed to provided the models, the data on exposure factors and the estimation outputs needed in these situations.
2.1 General considerations
The level of exposure to a compound is determined by factors such as use of products and site of contact. The assessment of the exposure starts with specifying emission of the compounds and transport to other parts of the residential environment. Emission and
transport determine the concentration-time profiles of the compounds, during and after use of the product.
There are various ways in which one can be exposed to a compound. For example, a volatile compound may be emitted into air which subsequently is inhaled. A product may be applied to the hands resulting in dermal exposure to a compound in the product. By hand to mouth contact some of the compound can be transferred to the mouth resulting in oral exposure. Consequently, a compound may be taken up in the body via these different routes, resulting in an internal systemic dose.
It should be noted that assessing exposure to a compound from a single product for a single purpose is often not sufficient. A compound may be present in many different products and one product may be used for many different purposes. Exposure may also occur at the workplace, via dietary intake and via environmental contamination. Therefore, to cover total human exposure to a certain compound, exposure from different sources and uses should be aggregated.
The user should be aware that the ConsExpo 4.0 models, as all models, are only a simplified representation of reality, valid only to an approximation and only in a limited area of
application. Results of an exposure assessment obtained by modeling should always be regarded with care.
2.2 Definitions
ConsExpo 4.0 distinguishes between external and internal exposure. ‘External exposure’ within the ConsExpo 4.0 framework is defined as: contact of the chemical with the outer boundary of the body (i.e. skin, lung or gut wall). ConsExpo 4.0 implements separate models for calculating the release of a chemical and the external exposure, and for the subsequent uptake of the chemical into the body (which results in the systemic dose).
As for the timescales, ConsExpo 4.0 defines Acute and Chronic doses. Acute doses are essentially defined as the contact with the compound during a single exposure event. This can be the mean event air concentration during exposure in case of inhalation exposure or the total amount taken up per kilogram body weight during the exposure event.
Chronic doses are defined as year averaged daily exposures. These can either be average air concentrations or average daily doses (amount of compound taken up per kilogram body weight).
2.3 Available models
Below is an overview of all models available in ConsExpo 4.0 and the input parameters these models need. All models and their boundary conditions are described in more detail in chapter 4.
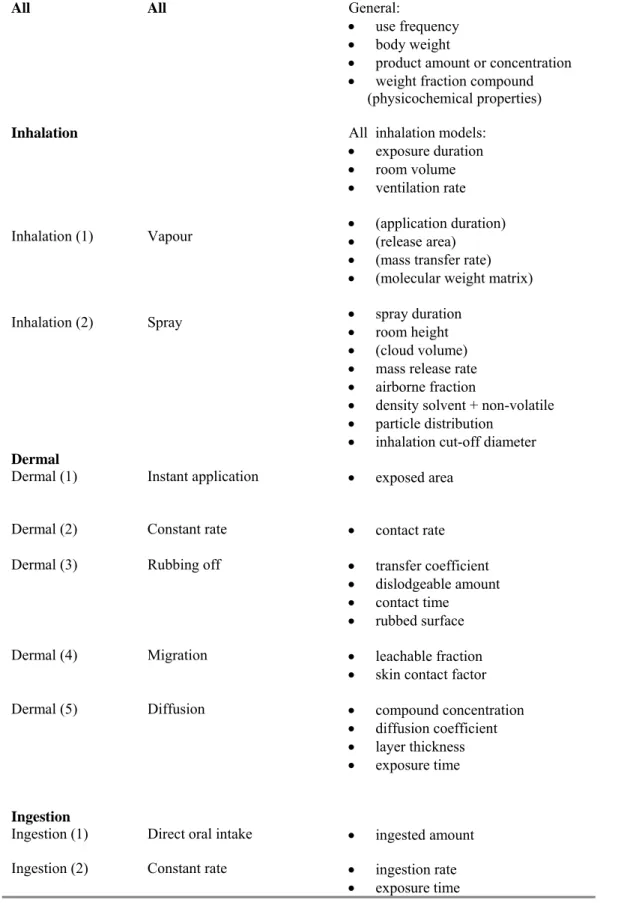
Table 1 Available exposure models in ConsExpo 4.0
Exposure route Model Parameters
All All General:
• use frequency • body weight
• product amount or concentration • weight fraction compound (physicochemical properties)
Inhalation All inhalation models:
Inhalation (1) Vapour Inhalation (2) Spray • exposure duration • room volume • ventilation rate • (application duration) • (release area) • (mass transfer rate) • (molecular weight matrix) • spray duration
• room height • (cloud volume) • mass release rate • airborne fraction
• density solvent + non-volatile • particle distribution
• inhalation cut-off diameter
Dermal
Dermal (1) Instant application • exposed area Dermal (2) Constant rate • contact rate Dermal (3) Rubbing off • transfer coefficient
• dislodgeable amount • contact time
• rubbed surface Dermal (4) Migration • leachable fraction
• skin contact factor Dermal (5) Diffusion • compound concentration
• diffusion coefficient • layer thickness • exposure time
Ingestion
Ingestion (1) Direct oral intake • ingested amount Ingestion (2) Constant rate • ingestion rate
Ingestion (3) Migration • exposure time • contact area
• initial migration rate Ingestion (4) Migration from packaging
material • thickness package • contact area • package amount • ingested amount
2.4 ConsExpo 4.0 factsheets and database
A number of fact sheets have been published, that compile exposure relevant information for a main category of consumer products, such as paint, cosmetics, children`s toys, and pest control products (Bremmer and van Veen, 2002; ECB, 2003; Fiserova-Bergerova et al., 1990; Freijer et al., 1997). A separate fact sheet called the ’General Fact Sheet’ gives general information about the fact sheets, and deals with subjects that are important for several main categories. It gives, for instance, information on anthropometric data and details on housings: data that are needed in all product factsheets (Bremmer and van Veen, 2000a). In the facts sheets, information about exposure to chemical substances from consumer products is collected into certain product categories. These categories are chosen so that products with similar exposures are grouped. For each of the product categories relevant ConsExpo models are described, for a given scenario default parameters are provided and the derivation of the parameters is justified.
The default parameters are available via a database, which is an integral part of ConsExpo 4.0 When selecting a sample product, the database provides default scenarios and parameter values for the models. When using the database, the user should always consult the corresponding fact sheet, in order to be aware of the limitations and the foundations of the selected parameter values. The defaults can serve as a starting point for exposure estimation and should be used in the absence of accurate scenario data only. Whenever more detailed information for the product is available, these data should be used instead.
The basis for the calculation and/or estimation of the default parameter values is a realistic worst case scenario, and considers consumers who frequently use a certain consumer products under relatively less favourable circumstances. For example, when using a
consumer product, basic assumptions are: relatively frequent use, application of a relatively large amount in a small room with a low ventilation rate, and a relatively long stay in that room.
In view of the fact that ConsExpo and the supporting factsheets are intended to be used to make predictive evaluations in the admittance of products to the market, a situation were data is limited and highly uncertain, the models and data described should aim at yielding
conservative (protective) estimates of the exposure. However, when conservative estimates of all input parameters are made, the resulting conservatism in the overall estimate may easily become undesirably high. For instance, if the exposure would be described by a simple multiplication of two (uncorrelated) parameters P1 and P2 (so that E = P1 x P2) and the uncertainty in P1 and P2 could be represented by 2 probability distribution functions, we could chose P1 and P2 to be represented by the 95 percentiles of their uncertainty
distributions. The probability of both parameters being at their 95 percentile would be (0.05)2 = 0.0025, a small probability. If n parameters are multiplied in the same way, the probability of all parameters being at their 95 percentiles becomes (0.05)n, which becomes unrealistically improbable for sizeable n.
For this reason, in the factsheets supporting ConsExpo it was decided to make somewhat less conservative default values for the input parameters. Whenever data on the distribution (either from variability or uncertainty) of the exposure factor was known, a 75 percentile was chosen as a value to represent this particular exposure factor. This yields still conservative, but more realistic estimates of the exposure. It should be noted however that also following this approach we do not know exactly how high the degree of conservatism is that we apply. This can only be made clear in treating uncertainty and variability in the exposure factors explicitly and performing probabilistic estimations (see 5.2 for the details).
3 Using the ConsExpo software: the basics
The following paragraphs provide a general explanation of the ConsExpo 4.0 software and the sections it contains.
3.1 Exposure assessment procedure
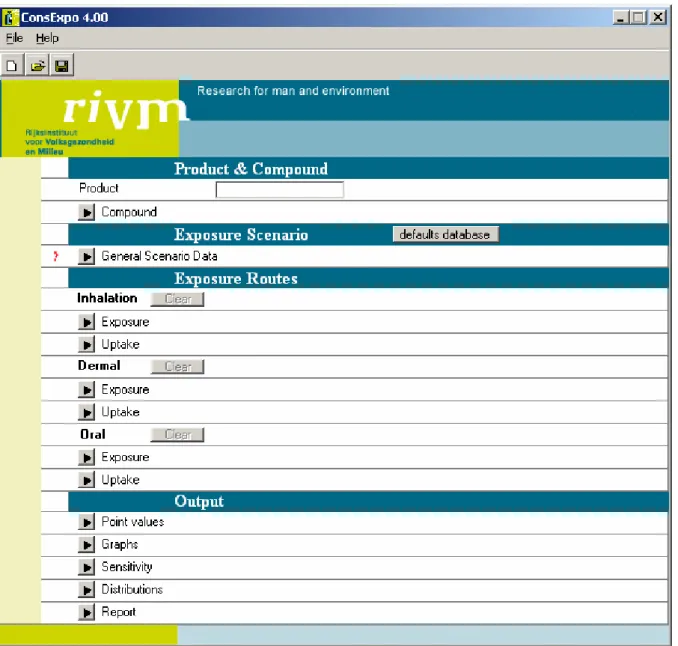
The main screen of ConsExpo 4.0 features a list of steps that have to be completed to assess the exposure from the chosen product.
In a typical exposure assessment one would start a the top of the main screen (at the product text edit) and work one’s way down arriving at the ‘output’-section of the screen where various options are given to study the results of the calculations.
3.2 Entering data
In the various sections values for model parameters can be edited. When all the necessary data have been entered a checkmark appears in front of the item. If data is missing a question mark is shown in the main screen.
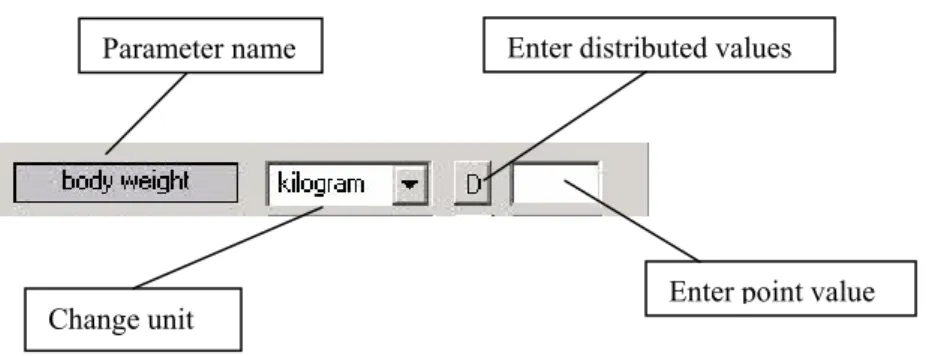
Figure 2 displays a typical parameter editing dialog.
Figure 2 Parameter editing dialog in ConsExpo 4.0
For all parameters it is possible to give a distribution of values instead of a point value. Pressing the distribution button ‘D’ on the parameter editing dialog opens the distribution dialog (Figure 3).
Parameter name
Change unit
Enter distributed values
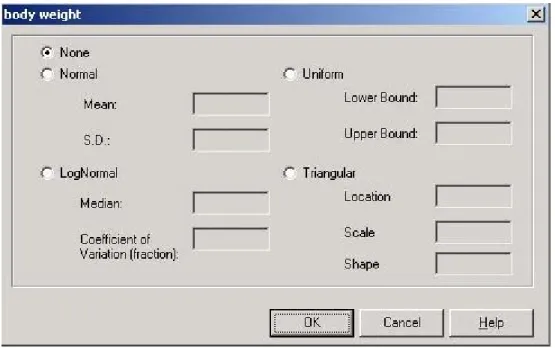
Figure 3 Distribution dialog in ConsExpo 4.0
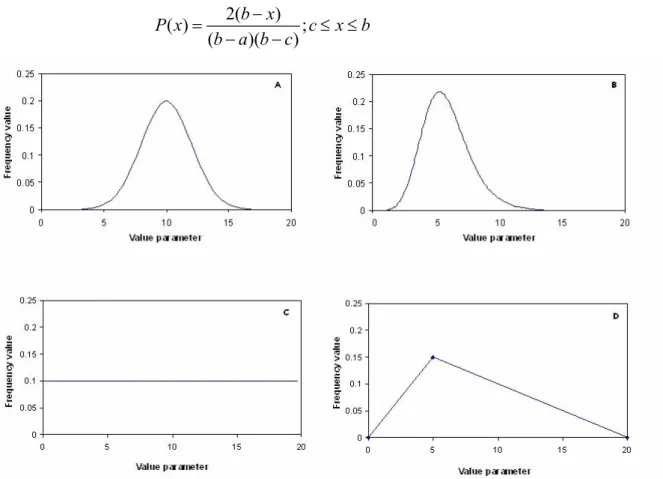
At present ConsExpo 4.0 offers a choice of four distributions (Figure 4):
Normal: specify the mean μ and standard deviation σ (Figure 4a). The distribution is defined by the probability density function:
2 1 1 ( ) exp( ( ) ) 2 2 x P x μ σ σ π − = −
LogNormal: specify the median μ and coefficient of variation (Figure 4b). The probability density is defined as:
2 1 1 ln( ) ln( ) ( ) exp( ( ) ) 2 2 x P x x μ σ σ π − = −
and The coefficient of variation is defined as the quotient of the standard deviation and the mean:
. . /
C V =σ mean
Uniform: specify a lower bound xo and an upper bound x1of the distribution (Figure 4c). The
probability density is defined as:
1 1 ( ) o P x x x = −
Triangular: specify a: location (minimum), b: scale (maximum) and c: shape (maximal probability) (Figure 4d). The probability density is defined as:
2( ) ( ) ; ( )( ) x a P x a x c b a c a − = ≤ ≤ − −
2( ) ( ) ; ( )( ) b x P x c x b b a b c − = ≤ ≤ − −
Figure 4 Example of a normal (A), lognormal (B), uniform (C) and triangular (D) distribution of parameter values
In subsequent calculations, ConsExpo 4.0 takes average values of the distributions when calculating point estimates of exposure and draws randomly from the specified distribution when performing a distributed calculation (Monte Carlo simulation). For more information on using distributions, see section 5.2.
3.3 Program sections
Before starting an exposure assessment in ConsExpo 4.0, the exposure scenario should be described, including the person exposed, the location where the exposure takes place and the amount and frequency of use of the product. This description will be helpful in selecting the appropriate models and values in ConsExpo 4.0. Performing an exposure assessment in ConsExpo 4.0 consists of defining the compound of interest, selecting appropriate models, filling out values for the required parameters and studying the results numerically and
graphically. This process is divided up in a number of different sections, which are described in the following paragraphs.
3.3.1 Product & Compound
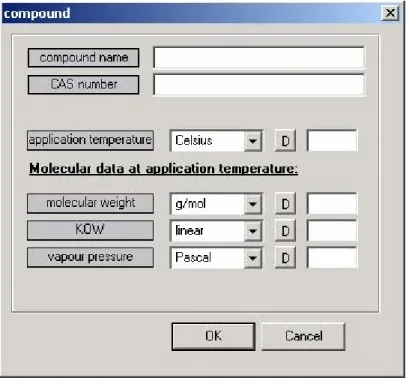
In the Product & Compound section, information on the product and the compound of interest can be entered and edited (Figure 5).
A product name can be specified to identify the exposure assessment. Under the item
‘compound’ one can specify the basic physicochemical properties of the compound for which the assessment is done. The parameters ‘compound name’ and ‘CAS number’ are used for identification purposes only and it is possible to leave their value blank.
Figure 5 Compound properties editing dialog in ConsExpo 4.0
The ‘application temperature’ is the temperature of the room in which the product is used, during the time of exposure. A value for this parameter is required when exposure via inhalation is considered. The physicochemical properties of the compound should be specified at this temperature.
The molecular properties ‘molecular weight’, ‘KOW’ (octanol-water partition coefficient) and ‘vapour pressure’ may be needed in the calculation of the exposure, depending on the chosen scenarios.
3.3.2 Exposure Scenario
To assess the exposure to a compound in a consumer product it is important to start with clearly defining an exposure scenario; who is exposed, how often and via which routes does exposure take place, etc. These factors are important for selecting the appropriate models for the exposure assessment. It should be noted that exposure scenarios for a certain product may differ greatly between population groups. For example, an infant and an adult display very different behaviour, possibly resulting in differences in exposure route and exposure
frequency. In this case, it is recommended to perform separate exposure assessments for each group.
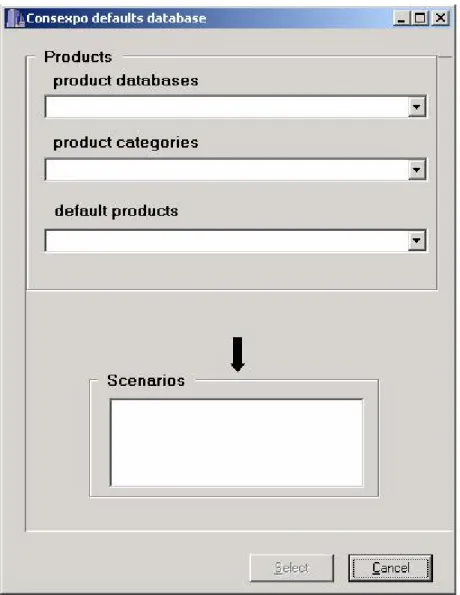
ConsExpo 4.0 database
ConsExpo 4.0 contains a database with defaults for models and parameters linked to types of products (Figure 6). The database is accessible by clicking on the ‘defaults database’ button in the Exposure Scenario section.
The ConsExpo 4.0 defaults database comprises a number of product databases representing distinct product groups such as pest control products, cleaning products and cosmetics. These product databases consist of default models and input parameters for a number of typical products from the corresponding product groups that have been selected to give an as complete overview of the product group as possible.
The default input data have been collected from research and literature. When suitable information was not found, best estimates are made. Details and justification of the default values are described in corresponding fact sheets, which can be found on the ConsExpo website: www.rivm.nl/consexpo.
Figure 6 Database of default scenarios, models and parameter values linked to types of products in ConsExpo 4.0
The product databases drop-down contains the product databases that are included in the present version of the database. The database files will be regularly updated. The latest version will be available from the ConsExpo website.
Default products are organized in sub-categories which are shown in the ‘product categories’ drop-down list when a product database has been chosen.
For the default products one or more exposure scenarios are defined, describing how
exposure will take place. Typical examples of exposure scenarios are mixing-and-loading of a cleaning product, cleaning with a cleaning product, using an insect spray and
post-application exposure of a child crawling in a room treated with a pest control product.
After clicking the appropriate scenario for the default product in the ‘Scenario’ list the default models and input data of this scenario are displayed on screen. Apart from units and
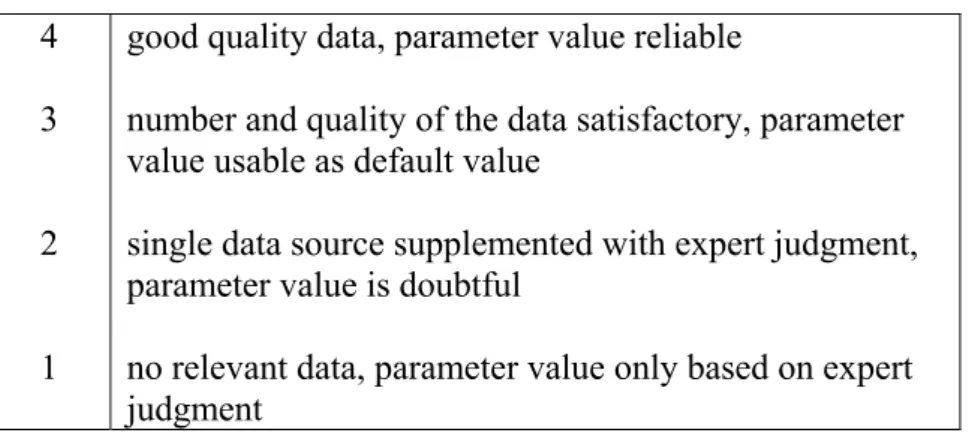
numerical values also quality factors (Q) are shown. These factors indicate the quality of the given data on which the default is based. The quality factor ranges from 1 to 4.
Table 2 Meaning of different quality factors of the data in the ConsExpo 4.0 database 4
3
2
1
good quality data, parameter value reliable
number and quality of the data satisfactory, parameter value usable as default value
single data source supplemented with expert judgment, parameter value is doubtful
no relevant data, parameter value only based on expert judgment
Pressing the ‘Select’ button selects the proposed scenario and reads in the default models and parameter values from the database into ConsExpo 4.0. In general, only additional
information on the compound of interest and the composition of the product are needed to complete the exposure assessment.
It should be noted that the defaults provide data that can be used when nothing more is known. When better data are available to the exposure assessor, these should of course be used.
Additional information on the use of the database and ConsExpo fact sheets can be found in section 2.4.
General Scenario Data
The exposure assessment requires the selection of the relevant exposure routes, and the appropriate exposure models, which require values for different parameters. The parameters in the General Scenario Data item are required to assess exposure for all routes and scenarios (Figure 7).
Figure 7 General Exposure Parameters in ConsExpo 4.0
The parameter ‘body weight’ of the exposed person is needed to calculate internal exposure, which is defined as amount taken up per kg body weight of the exposed person. The ‘use frequency’ is the number of times per unit of time (i.e. per year) that the product is used. The exposure scenarios refer to calculation of the exposure for a single use of the product. The use frequency is needed to estimate chronic exposures.
3.3.3 Exposure Routes
The ‘Exposure Routes section allows the user to select appropriate exposure and uptake models for the relevant exposure routes: inhalation, dermal or oral.
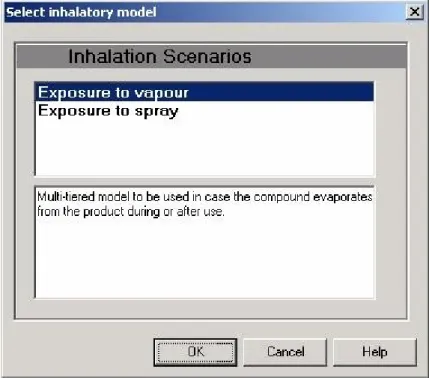
Opening the ‘Exposure’ item for each route reveals the model selection dialog for the chosen route. This dialog allows the user to select an exposure model from a list of available models (Figure 8).
Figure 8 Model selection dialog in ConsExpo 4.0
After selecting a model from the list and pressing ‘OK’, the edit dialog for the scenario is shown, in which different options within the model and the associated parameters can be edited. Selecting the ‘Uptake’ item displays the uptake model dialog where values for uptake model parameters can be edited. The ‘Clear’ button allows the user to clear all the data and select a different model.
All available models will be discussed in more detail in Chapter 4.
3.3.4 Output
The results of a ConsExpo 4.0 exposure calculation can be presented in different ways: as point values, as a graph over (exposure) time, as a distributed result from a Monte Carlo simulation, and in a textual report. In addition, the program offers the possibility to perform sensitivity analysis of the exposure assessments.
Point values
This output item presents calculated results of the exposure in point values. When
distributions are given, ConsExpo 4.0 takes the average values of parameters to calculate the point values. ConsExpo 4.0 distinguishes between external exposure and internal dose. External exposure within the ConsExpo framework is understood as contact of a chemical with the visible exterior of the human body (i.e. concentration of the chemical in the air in the breathing zone of the exposed person, amount of chemical on the skin, amount of chemical swallowed. Internal exposure (dose) is defined as the amount that is actually taken up over the body boundary per kilogram weight of the exposed person.
Exposures and doses are presented both per route and integrated over all routes. Per route various exposure measures are calculated:
• External inhalation exposure is calculated as the air concentration during exposure. Different measures are: mean air concentration during a single exposure event; mean air concentration on the day of exposure and year average air exposure.
• Internal inhalation doses calculated are: the acute (amount taken up during one event per kg bodyweight) and chronic (daily average of the amount taken up per kg bodyweight) dose.
• External dermal exposure is calculated as dermal load (amount of compound per cm2 of
exposed skin) or as external dose (the amount that can potentially be taken up per kg bodyweight).
• Internal dermal doses calculated are: the acute (amount taken up during one event per kg bodyweight) and chronic (daily average of the amount taken up per kg bodyweight) dose. • External oral exposure is calculated as external dose (the amount that can potentially be
taken up per kg bodyweight).
• Internal doses are: the acute (amount taken up during one event per kg bodyweight) and chronic (daily average of the amount taken up per kg bodyweight) dose.
The integrated doses are the summations of the corresponding doses per route. Graphs
Exposure during a single event can be examined via graphs of the time course of the exposure (Figure 9). The time axis will automatically be set to the exposure duration specified by the user (if appropriate), but can be adjusted manually by checking the ‘time axis: fixed’ button and specifying a valid time interval.
Similarly, the y-axis will automatically be fit to include the whole exposure range
encountered during the event, but may be adjusted manually. The data points of the resulting graph can be exported to a Microsoft Excel file.
Figure 9 Example of a graph depicting the exposure calculations
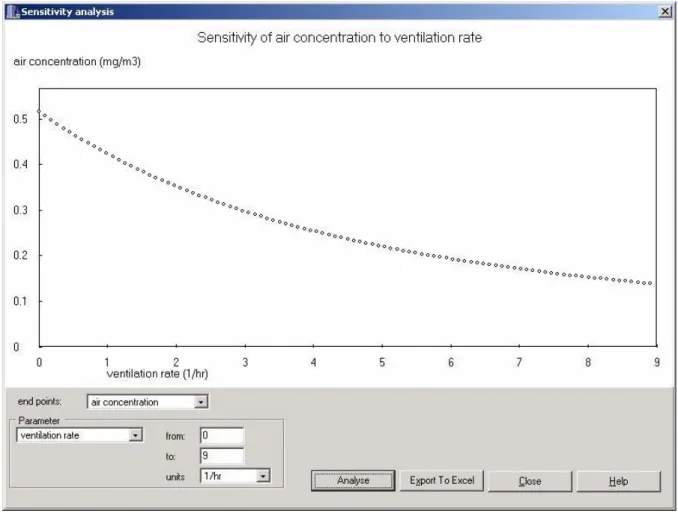
Sensitivity analysis
The sensitivity analysis item allows the user to investigate graphically the sensitivity of the model outcome to changes in one single parameter. The user should select the required calculation endpoint (exposure measure), select the parameter for which the sensitivity analysis is being performed from the ‘Parameter’ drop-down list and set the range of variation for the requested parameter. A graph can be plotted showing the outcome of the calculations for the range of values given for the chosen parameter (Figure 10). The data points of the resulting graph can be exported to a Microsoft Excel file.
Figure 10 Example of a sensitivity analysis graph in ConsExpo 4.0
Distribution
When one or more parameters have been specified as a distribution, ConsExpo 4.0 can perform a distributed (Monte Carlo) calculation. The program will draw a set of random numbers from the specified distributions for distributed parameters and calculates the endpoint of choice with this set. For the non-distributed parameters the specified point value is taken. The calculated exposure measure for the set is stored. This procedure is repeated for a user-specified number of times (the number of Monte Carlo samples). The result of this procedure is a distributed set of calculated exposures. Some characteristics of the distribution such as median, standard deviation 90- and 99-percentile of the calculated distribution are reported.
The calculated distributions are plotted in a graph, and can be exported to a Microsoft Excel file (Figure 11).
Figure 11 Example of a distribution graph in ConsExpo 4.0
More information on the use of distributed values can be found in chapter 5. Report
The ConsExpo 4.0 report gives a complete (textual) overview of the exposure calculation. It displays all parameter values and the calculated exposures. The text can be saved to (text-) file or can be printed directly from ConsExpo 4.0.
4 Using the ConsExpo 4.0 software: models
ConsExpo 4.0 is a multi-route, single compound modelling tool. Exposure and uptake models can be defined for each exposure route. This chapter describes in more detail the available models and their parameters for each exposure route.
In the description of the model equations the units of parameters are given in the standard S.I. system. For some parameters this may be an awkward system of units, but it should be noted that these units are used only for description purposes and that the exposure assessor can choose more appropriate units when using the program.
4.1 Inhalation route
Many consumer products contain compounds that may reach the body via the inhalation route. A simple example is a spray containing a volatile compound. After spraying the
product, the compound may end up in the inhaled air of the product user or of the bystanders. Subsequently, a compound may enter the body by uptake in the lungs. Two exposure models and one uptake model are available in ConsExpo 4.0 to describe indoor inhalation exposure to compounds in consumer products.
4.1.1 Inhalation exposure: exposure to vapour
The ‘exposure to vapour’-model describes a scenario in which a compound evaporates from a surface into the room air, for example, from a painted wall, or a can of product. The
compound may comprise 100% of the product, or be part of a mixture.
The concentration of compound in the room air will depend on the amount of compound present in the room, the room size, ventilation of the room air, vapour pressure of the compound and the rate at which the compound is released into the air.
Depending on the information available on physicochemical properties of the compound and the use of the product, different modes of release of the compound from the product can be selected to estimate the release of the compound into the room air.
General parameters
Parameters that are used for all modes of release within the exposure to vapour model are: • Exposure duration: the total time the exposed person is in the room where the chemical is
being released.
• Product amount: the amount of total product used in one event.
• Weight fraction compound: the fraction of compound in the total product. • Room volume: Volume of the room in which the exposure occurs.
• Ventilation rate: number of total air changes in the room per time. For example, if it takes 20 minutes for all the air in the room to be exchanged with outdoor air, the ventilation rate is 3 times per hour.
Within the exposure to vapour model, there are three options for the mode of release of the compound: the instantaneous release, the constant rate and the evaporation mode. These modes are discussed in the next paragraphs.
Instantaneous release mode
The instantaneous release mode is the mode of release that will usually result in a relatively high exposure, and can therefore be used as a first tier to screen the upper level of exposure (Figure 12). The scenario assumes that all compound is released from the product at once into the room and is subsequently removed by ventilation. This scenario may be a reasonable approximation for volatile compounds with high diffusion rates or can be used as a worst case approach when no information is available on the time during which evaporation takes place.
Figure 12 Instantaneous release mode dialog of the inhalation evaporation model in ConsExpo 4.0 The air concentration of the compound at time t for the instantaneous release mode is calculated as follows: 1) C A qt V
wf
o
air
e
− ××
=
where:
C
air : concentration of compound in the room air [kg/m3]A
o : product amount [kg]wf
: weight fraction of the compound in the total product [fraction]V : room volume [m3]
q : ventilation rate of the room (number of air changes per time unit) [1/s]
t : exposure duration [s]
In actuality, there is a limit to how much of the compound can evaporate into the air, depending on its saturated vapour pressure. If information on the vapour pressure of the compound is known, the checkbox in front of the phrase ‘limit the air concentration to the vapour pressure of pure substance’ can be checked.
When the box is checked, air concentrations as calculated in the ‘instantaneous release’ mode are limited by the maximal air concentration corresponding to the saturated air concentration of the pure compound.
This air concentration Csat is calculated from the saturated vapour pressure using the ideal gas law:
2)
C
sat
=
MP
sat
/
RT
where:M : molecular weight of the compound [kg/mole]
P
sat : saturated vapour pressure [Pa]R : universal gas constant [J/K/Mole]
T : temperature [K]
Constant rate release mode
Contrary to the instantaneous release mode, which describes a release of compound in the air at once, the constant rate mode describes the release of a compound with a constant rate of release over a certain period of time. During this time, the compound is simultaneously removed from the air by ventilation of the room.
This mode of release can be used if information on the evaporation properties of the
compound is not available, but the time period during which the compound evaporates can be estimated. In addition to the parameters used in the instantaneous mode, the constant rate mode of release uses the ‘emission duration’ parameter: a reasonable estimate of the time during which the compound is released.
The air concentration of the compound at time t for the constant rate release mode is calculated as follows:
3a) C
air
Ao wf /tr (1 e qt)qV
− × −×
=
exposure t < tr 3b) / ( ) (1 ) A t o r qtr q t tr Cair e e qVw f
− − − = × − ××
exposure t > tr where:Cair : concentration of compound in the room air [kg/m3]
tr : release time [s]
Ao : amount of product used [kg]
wf : weight fraction of the compound in the product [fraction]
V : room volume [m3]
q : ventilation rate of the room (number of air changes per time) [1/s]
For an explanation on the checkbox before the phrase 'limit the air concentration…', see the paragraph above on the instantaneous release mode.
Evaporation release mode
The evaporation mode describes the release of the compound from the surface of the product by evaporation, and can be used if information on the release area and the release rate of the compound from the product is available (Figure 13).
The evaporation mode explicitly models the evaporation process of the compound.
Evaporation is driven by the difference in vapour pressure in the room air and the saturated vapour pressure of the compound. The rate of evaporation is proportional to this pressure difference and depends on the surface area of the product and the mass transfer rate. This mass transfer rate is a measure of how fast the evaporated substance is removed from the product surface. This is in general a complicated function of diffusivity of the compound through air and through the product and of the air flow right above the product surface. ConsExpo 4.0 offers two approximating models to estimate this mass transfer rate. The first is Langmuir’s method (Zemansky, 1984), which consists in ignoring all transport limiting processes such as diffusion in both product and air boundary layers. It provides an upper limit of the rate of release for any system and will in general result in a high over-estimation of the peak concentrations in the room air. The other method is due to Thibodeaux
(Thibodeaux, 1979) and is a simplification of the more complicated Liss-Slater two-layer model (Liss and Slater, 1974), which describes the release of a compound from water into air. Mass transfer rates calculated using this model will be lower than the ones calculated by Langmuir’s method, but it should be remembered that this method is only an approximation of a specific system (evaporation of a solute from water) and has limited validity outside the domain for which is was derived.
Figure 13 Evaporation release mode dialog of the evaporation inhalation model of ConsExpo 4.0 Parameters in the release area dialog for this mode are:
• Release area: The surface area from which the compound is released. • Application duration: the time period during which the product is applied.
Two options are available for the release area:
• Evaporation is from a constant surface. This option is appropriate if the compound is released from a surface area that remains the same size over time, for example, the surface area of a bucket of product or the area of a wallboard treated with a wood-preservative.
• The area of release increases over time. This option is appropriate when the area from which the compound is released is not of a constant size. For example, while painting a wall, the surface area covered with paint from which the compound is released increases over time.
Parameters in the release rate dialog for this mode are:
• Temperature: the temperature of the room during exposure.
• Molecular weight and vapour pressure: physicochemical properties of the chemical of interest.
• Mass transfer rate: the velocity by which a compound is transferred between the product and the air. ConsExpo 4.0 offers two models to approximate this rate. Langmuir’s method and Thibodeaux’s method.
Figure 14 Default calculation of mass transfer rate for evaporation release mode in inhalation evaporation model in ConsExpo 4.0
Langmuir’s expression for the evaporation rate is given by:
4) K = ×S R T× /(2π×M) [m/s]
where:
K : mass transfer rate [m/s]
S : area from which the compound is released [m2]
M : molecular weight of the compound [kg/mole]
R : universal gas constant [J/K/mole]
Thibodeaux’s expression for the mass transfer rate is given by:
5) 60 1 3 0.018 /
2
K = × ×S M [m/s]
where:
K : mass transfer rate [m/s]
S : area from which the compound is released [m2]
M : molecular weight of the compound [kg/mole]
The mass transfer rate is determined by the speed at which the compound is transported away from the evaporation surface. In general this transport will depend on speed of
diffusion of the compound through air, and the speed of air movement above the product-air surface.
Langmuir’s method effectively assumes that diffusion of the compound is infinitely fast (Zemansky, 1984). It will as a rule highly overestimate the evaporation rate and predict higher peak concentrations than the more conservative Thibodeaux approximation
(Thibodeaux, 1979). Thibodeaux’s method is a simple approximation of the more elaborate Liss-Slater (Liss and Slater, 1974) two layer model describing the evaporation of a
substance from water.
• Molecular weight of the matrix: this parameter needs to be defined if the compound of interest is not in its pure form, but part of a product. It is the average molecular weight of the rest of the total product (the product minus the compound of interest). It is calculated as: j matrix j f j i M M w ≠ =
∑
×where the summation index j is over all compounds in the mixture except for the compound of interest (ith component).
Evaporation of a compound from a layer of product is described by a set of two coupled differential equations.
6) dAair (Peq Pair) Q room C
7) dA (P Pair )
/
eq dtprod
K
A
tot
T
app
w
f
= −×
−+
×
where:Aprod : mass of the compound in the product [kg]
Peq : equilibrium vapour pressure [Pa]
Pair : actual vapour pressure [Pa]
Vroom : room volume [m3]
q : room ventilation rate (number of air changes per time) [1/s]
Atot : total amount of product used [kg]
Tapp : application time [s]
wf : weight fraction compound in product [fraction]
Equation 6) describes the amount evaporating from the product into the air (first term) and the subsequent removal of compound by ventilation of the room air (second term). The evaporation is driven by the difference in vapour pressure in the room air Pair and the
equilibrium vapour pressure of the compound-product mixture Peq. The latter is being
approximated by Raoult’s law:
( vapC ) P eq C C
P
v
M
v
r Mr
=
+
, where:Pvap : saturated vapour pressure of the compound [Pa]
M : molecular weight of the compound [kg/mole]
Cv : concentration of the compound in the product [kg/m3]
Cr : concentration of the rest of the material in the product [kg/m3]
Mr : average molecular weight of the rest of the material [kg/mole]
Note: the last parameter Mr the average molecular weight of the rest of the material (the
product minus the compound of interest) is determined from the molecular weights and concentrations of the product ingredients as:
(1 f) i i r i i r r i i w C w C M M M M ρ ρ − × × = =
∑
=∑
and thus, 1 f r i i i w M w M − =∑
where the index i refers to the ingredients of the rest of the material and ρ is the mass density of the total product (including the compound of interest).
Raoult’s law is valid only for ideal, non-interacting liquids and constitutes only an approximate description of a real situation.
Equation 7) describes the change of compound in the layer of product. It consists of two terms. The first term describes the amount of product evaporating from the product into the room air and is minus the source term in equation 6). The second term describes the increase in amount due to application of the product, if appropriate. When a surface area is covered with an amount Atot of product in a time Tapp, the amount of product applied per unit time is
given by:
/
dAp
A
T
tot
app
dt
=
Multiplication with the fraction wf of compound in the product gives the increase in
compound in the product layer.
Of course, if the surface area from which the compound evaporates is constant, as in the case of evaporation from an open can or from a previously treated surface, the second term is zero.
4.1.2 Inhalation exposure: exposure to spray
The spray model was developed on the basis of the results of experimental work (Delmaar et all., in prep.) and describes the indoor inhalation exposure to slowly evaporating or non-volatile compounds in droplets that are released from a spray can (Figure 15). For non-volatile substances, the modes of release of the 'exposure to vapour' model are more appropriate. Of particular interest in the inhalation exposure of aerosols is the region in the respiratory tract where the droplets deposit. This deposition depends on many factors such as the size of the droplets, the breathing pattern and human physiology. Aerosols that deposit in the higher airways (extrathoracic and tracheobronchial regions) are cleared by a system of cilia and mucous via the gastrointestinal tract. Only the droplets that penetrate to the alveolar region will reach the lung-blood barrier and give rise to inhalation exposure (Vincent, 1995).
The level of exposure may vary largely depending on the way a spray is used, and the type of spray product that is being used. In practice a rough distinction can be made between two types of spray products: spray cans that drive out the product by means of an expanding gas (propellant) and sprays that are operated mechanically by pumping (pump and trigger
sprays). The first type as a rule produces smaller (and therefore better inhalable) droplets than the second type. Pump and trigger sprays are more often used to target surfaces (as in paints or crack&crevice applications for instance) whereas spray cans are more often used as
Figure 15 Inhalation exposure to spray model dialog in ConsExpo 4.0 General exposure parameters needed for this model are:
• Spray duration: the amount of time between start and finish of the spraying.
• Exposure duration: the amount of time spent in the room where the spraying takes place. • Room volume: the volume of the room where the spraying takes place.
• Room height: the height of the room where the spraying takes place.
• Ventilation rate: the number of total air changes in the room per time. For example, if it takes 20 minutes for all the air in the room to be exchanged with outdoor air, the
ventilation rate is 3 times per hour.
• Spraying towards exposed person option. This option is included to account for situations in which a person is inside the spray cloud as is for instance the case in using hairsprays and deodorants. When selecting the model option ‘spraying towards exposed person’ the exposure assessor is given the option to specify the initial volume of the cloud. This volume is defined to be the volume of the cloud after 1 second.
Air concentrations may be inhomogeneous because the spray is released in a cloud. Exposure of a person present will depend on his or her position relative to the cloud and the dispersion of the cloud.
The dispersion of the cloud depends heavily on ventilation of the room, thermal sources in the room, persons walking through the room and dragging air around. In general this dispersion is relatively fast (in the order of a few minutes or less). As a simplification in the
ConsExpo 4.0 spray model, the volume of the cloud after 1 second is assumed to further increase linearly in time until spraying stops or the cloud volume equals the volume of the room. It is assumed that during the use of the spray (the actual spraying) the breathing zone of the exposed person is located inside this volume. After spraying, the sprayed material is assumed to be homogeneously dispersed over the entire room.
The model requires the following values for product specific parameters:
• Mass generation rate: the amount of compound that will be released from the spray container during the spraying per unit of time.
• Airborne fraction: the fraction of the non-volatile material that becomes airborne after spraying as droplets. The airborne fraction will depend on the way in which the product is being used, i.e. in treating a surface (paint, wood preservative) or as an airspace (spraying against flies), and on the droplet size distribution that has been specified.
• Weight fraction non-volatile: the total fraction of non-volatile compounds in the product. Note that in addition to the compound (which is supposed to be non-volatile) other components with low volatility may be present.
• Weight fraction compound: the fraction of compound of interest in the product. • Density non-volatile: mass density of the total of non-volatile compounds.
• Initial particle distribution: the normalized mass distribution of the particles (droplets) immediately after they are ejected. The user has a choice of two parametric distribution functions: normal or lognormal. For both distributions an average particle diameter (mean resp. median) and a width (standard deviation resp. coefficient of variation) has to be specified. In addition the maximal droplet diameter that is produced by the spray has to be given. This maximal droplet diameter should be taken not too high (preferably < 50 µ), since only inhalable droplets are to be considered.
• The inhalation cut-off diameter: the diameter below which the spray droplet can be inhaled and reach the lower areas of the lungs (the alveolar region). Droplets that are above this diameter deposit in the higher parts of the respiratory tract and will be cleared via the gastrointestinal tract, leading to oral exposure. The inhalation cut-off diameter is only an approximation of the complicated process of deposition of particles in the lung. It depends on anthropometrical properties, droplet diameter and pattern of breathing
(Vincent, 1995). In practice its value should be around 10-15 micrometer (Freijer et al., 1997; Vincent and Mark, 1984).
Droplet distributions are in practice determined by a standardized method determining the light scattering profile of the spray at some distance (often 30 centimeters) from the spray can nozzle. It is assumed that at this point all of the solvent has evaporated from the smaller droplets (with diameter < 50µ).
This assumption seems to be adequate for these smaller droplets and for solvents of moderate volatility. For larger droplets in the distribution and for less volatile solvents such as water, this approximation will break down. It is therefore advised to specify droplet distribution functions for droplets up to about 50 µm, which constitute the inhalable fraction of the droplets anyway. In addition the fraction of the non-volatile material that ends up in these droplets will have to be specified. To this end the spray model introduces the parameter ‘airborne fraction’ which combines the fraction of the amount of non-volatile material that ends up in the smaller droplets and the fraction of droplets that becomes airborne. The latter is closely connected to the type of spray and the way it is used. Airborne fractions have been determined experimentally for different sprays (Delmaar et al., in prep.). The following indicative values are advised as (conservative) default values:
Airborne fraction
Air space sprays
Surface sprays; median of the initial particle distribution < 50 µm
Surface sprays; median of the initial particle distribution ≥ 50 µm
1 1 0.2
Since the change of air concentration in time depends on the size of the produced droplets, and sprays produce particles of different sizes, calculations are performed for (size)
distributions of particles.
The mass of particles with diameter δ is given by: 8) ( )Mδ t =Mtot×P( , )δ t dδ
The particle mass distribution function P(δ,t) is determined from the initial distribution specified by the user P(δ,0), the normalized mass distribution immediately after the spray is being released from the nozzle of the spray can.
In the ConsExpo 4.0 spray model the airborne droplets are assumed to contain only non-volatile components, since the evaporation of moderately non-volatile sovents will be fast from the smaller (inhalable) droplets.
The total amount of material in the airborne droplets is a combination of the fraction of non-volatile material that is contained in the specified droplet distribution and the fraction of these droplets that becomes airborne during application. This latter fraction will depend on the way a product is being used, i.e. whether it is sprayed on a surface or directly into the room air. Thus, the total mass of droplets that is being released from a spray can per unit time is given by
9) Rrelease=Rspray×wnon volatile−
where
Rrelease : rate of release of mass in droplets [g/s]
Rspray : rate of release of sprayed product (actual mass sprayed per unit time, including the
propellant) [g/s]
wnon-volatile : weight fraction of the non-volatile component in the product [fraction] And of this mass only the fraction:
10) R f
release× airborne
actually becomes airborne. airborne
f : airborne fraction [fraction]
The amount of the compound of interest that is contained in this mass is given by: 11) wf Rrelease f airborne w non volatile × × −
Multiplying this mass generation rate of airborne particles with the normalized initial distribution yields the mass release rate per particle diameter.
The particles that are released from the spray can are assumed to be evenly distributed over a volume V, which can be either the cloud volume or the room volume.
Particles with diameter δ are removed from the room air by gravitational precipitation and by ventilation of room air.
The velocity vs at which particles fall to the floor is given by Stokes settling velocity (Hinds, 1982) 13) 2 18 g droplet v SC s ρ δ η = × where: g : gravitational constant
ρdroplet : (average) mass density droplet [kg/m3]
η : air viscosity [N s/m2]
SC : Cunningham slip correction factor, which is only important for droplets with diameter smaller than 1 µm. It is taken to be 1 in the model.
Within a time dt the number of particles that reaches the floor (and is thus being removed from the air) is given by:
14) ( )Cair δ × ×S vs( )δ
where
Cair (δ) : concentration of mass of droplets with diameter δ [kg/m3]
S : surface area of the floor where the droplets drop on the floor [m2]
The mass that is being removed by ventilation is given by: 15) ( )Cair δ × ×V qvent
where
qvent : ventilation rate of the room in number of air changes per unit time [1/s]
V : volume of the room [m3]
During spraying the mass of particles with diameter δ generated is given by equation 12). Therefore the change in mass Aair(δ ) of the airborne droplets with diameter δ during spraying is given by:
16) dAair( ) qvent Aair( ) vs( ) S Aair Rairborne( )
dt V
δ
δ δ δ
and after spraying by:
17) dAair( ) qvent Aair( ) vs( ) S Aair
dt V
δ
δ δ
= − × − × ×
Under the simplifying assumption that the cloud disperses immediately through the room, these equations reduce to:
18.a) dAair( ) (qvent vs( ))Aair Rairborne( )
dt h δ δ δ = − + + during spraying, and
18.b) dAair( ) (qvent vs( ))Aair
dt h
δ δ
= − +
after spraying. In these equations:
h : the room height [m] The solution to 18.a) is:
19.a) ( , ) ( )(1 exp( ( ( )) ) ( ) Rairborne vs A t q t air vs vent h qvent h δ δ δ = δ − − + +
After spraying, that is when t > Tspray, the mass of droplets with diameter δ in the room air is determined as: 19.b) ( ) ( ) ( ) ( , ) (1 exp( ( ) ) exp( ( )( )) ( ) R v v airborne s s
Aair t qvent Tspray qvent t Tspray
v h h s q vent h δ δ δ δ = δ − − + × − + − +