Impacts of good practice
policies on regional and global
greenhouse gas emissions
Authors:
Hanna Fekete (NewClimate Institute), Mark Roelfsema (PBL), Niklas Höhne
(NewClimate Institute), Michel den Elzen (PBL), Nicklas Forsell (IIASA), Sara
Becerra (NewClimate Institute)
Disclaimer
The information and views set out in this study are those of the authors and do not necessarily reflect the official opinion of the Commission. The Commission does not guarantee the accuracy of the data included in this study. Neither the Commission nor any person acting on the Commission’s behalf can be held responsible for the use of any information from this study.
Download the report online
http://newclimate.org/publications/ Project number
14008
This report has been prepared by PBL/NewClimate Institute/IIASA under contract to DG CLIMA (Service Contract n°071303/2011/662342/SER/CLIMA.A4 – Renewal (Ares (2013)3407741)) renewed in November 2013.
© NewClimate Institute, PBL Netherlands Environmental Assessment Agency and International Institute for Applied Systems Analysis 2015 by order of DG CLIMA
This project was funded by the European Commission
The impact of good practice
policies on regional and global
greenhouse gas emissions
3
Table of contents
Table of contents ... 3 List of figures ... 5 List of tables... 6 Summary ... 8 1.1 Main findings ... 91.2 Main findings for the sectoral level ... 13
1.2.1 Electricity from renewable energy sources ... 13
1.2.2 Reducing methane emissions from oil and gas production ... 14
1.2.3 Efficiency of industrial processes ... 14
1.2.4 Reductions of fluorinated gases ... 14
1.2.5 Efficiency of building envelopes and appliances ... 15
1.2.6 Efficiency of light duty vehicles and electric cars ... 15
1.3 Main findings for example countries ... 16
1.3.1 China ... 17 1.3.2 United States ... 18 1.3.3 India ... 19 1.3.4 Brazil ... 20 1.3.5 Russian Federation... 21 1.3.6 Japan ... 22 1.3.7 Rest of world ... 22 1 Introduction ... 23 2 Approach ... 25
2.1 Identify good practice policy areas ... 25
2.2 Define indicators for the quantification of the policies ... 25
2.3 Determine impact on countries and globally ... 26
2.4 Comparing the results to scenarios compatible with 2°C ... 27
3 Selection of good practice policies and accompanying indicators ... 28
3.1 Energy supply sector ... 28
3.1.1 Renewable energy in electricity generation ... 28
3.1.2 Methane reduction from fossil fuel production ... 31
3.2 Industry ... 34
3.2.1 Energy efficiency of industrial processes ... 34
3.2.2 Reductions of fluorinated gases ... 37
3.3 Buildings ... 39
3.3.1 Efficiency of the building envelope of new buildings ... 39
4
3.4 Transport ... 42
3.5 LULUCF ... 44
4 Results of good practice by sectors and countries ... 47
4.1 Sectoral results of good practice policies ... 47
4.1.1 Electricity from renewable energy sources ... 47
4.1.2 Reducing methane emissions from oil and gas production ... 50
4.1.3 Efficiency of industrial processes ... 51
4.1.4 Reductions of fluorinated gases ... 51
4.1.5 Efficiency of building envelopes and appliances ... 53
4.1.6 Efficiency of light duty vehicles and electric cars ... 55
4.2 Total economy wide emissions with good practice policies ... 57
4.2.1 World ... 57 4.2.2 China ... 59 4.2.3 United States ... 61 4.2.4 India ... 63 4.2.5 Brazil ... 65 4.2.6 Russian Federation... 67 4.2.7 Japan ... 69 4.2.8 Rest of world ... 71 5 Conclusions ... 72
5.1 The global picture ... 72
5.2 Decarbonisation of sectors ... 72
5.3 Reduction of absolute emissions in the countries ... 73
5.4 Further research ... 73
6 References ... 74
5
List of figures
Figure 1. Global greenhouse gas emissions under current policies scenario and implementation of good practice policies in all countries excl. LULUCF and only LULUCF. Note: emissions in 2010 are
48.8 GtCO2e, and thus slightly lower than other sources (e.g. (UNEP, 2014)). ... 12
Figure 2: Reductions below the implemented policies for each of the nine policy areas covered, based on two methods from NewClimate Institute and PBL. Source: Authors ... 12
Figure 3: Impact of climate policies on greenhouse gas emissions in China. ... 17
Figure 4: Impact of climate policies on greenhouse gas emissions in the United States. ... 18
Figure 5: Impact of climate policies on greenhouse gas emissions in India. ... 19
Figure 6: Impact of climate policies on greenhouse gas emissions in Brazil. ... 20
Figure 7: Impact of climate policies on greenhouse gas emissions in the Russian Federation. ... 21
Figure 8: Impact of climate policies on greenhouse gas emissions in Japan. ... 22
Figure 9: Impact of climate policies on greenhouse gas emissions in “Rest of the World” ... 22
Figure 10 Covered GHG emissions (incl LULUCF) in assessment of good practice policies. The shares indicate % of 2030 emissions under the current policy scenarios for PBL and New Climate insitute ... 27
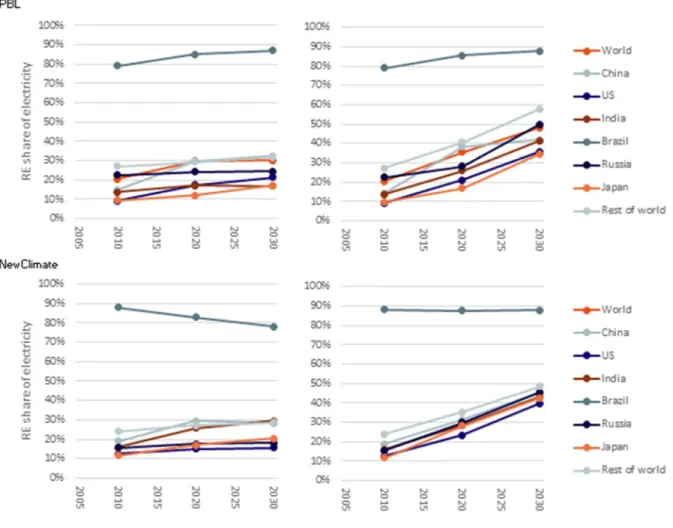
Figure 11: Share of renewable energy electricity generation under current and good practice policy scenarios for the PBL (upper graphs) and NewClimate (lower graphs) ... 48
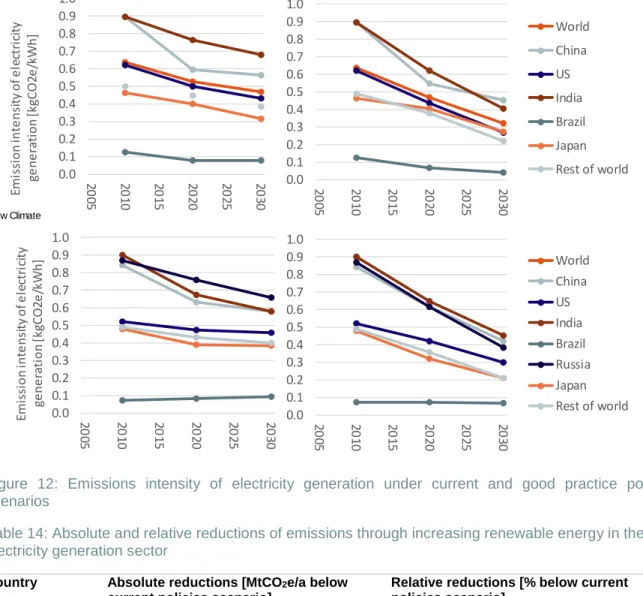
Figure 12: Emissions intensity of electricity generation under current and good practice policy scenarios ... 49
Figure 13: Emissions intensity of oil and gas production under current and good practice policy scenarios ... 50
Figure 14: Energy intensity of the industrial sector under current and good practice policy scenarios 51 Figure 15: F-gas emissions relative to 2010 under current and good practice policy scenarios ... 52
Figure 16 Per capita electricity consumption in the building sector (appliances) under current and good practice policy scenarios ... 53
Figure 17: Per capita energy consumption in the building sector (incl. electricity) under current and good practice efficiency standard of new buildings (Brazil, rest of the world and world not available) . 54 Figure 18: Fuel efficiency of light duty vehicles under current and good practice policy scenarios ... 56
Figure 19: Emission intensity of light duty vehicles under current and good practice policy scenarios 57 Figure 20. Global greenhouse gas emissions under different scenarios. ... 58
Figure 21: Reductions below the current policies projection per policy area covered in detail ... 59
Figure 22: Impact of climate policies on greenhouse gas emissions in China. ... 60
Figure 23: Impact of climate policies on greenhouse gas emissions in the United States. ... 62
Figure 24: Impact of climate policies on greenhouse gas emissions in India. ... 64
Figure 25: Impact of climate policies on greenhouse gas emissions in Brazil. ... 66
Figure 26: Impact of climate policies on greenhouse gas emissions in the Russian Federation. ... 68
Figure 27: Impact of climate policies on greenhouse gas emissions in Japan. ... 70
6
List of tables
Table 1: Annual increase in renewable electricity share as the result of exemplary good practice
policies in the energy supply sector ... 29
Table 2: Topmost countries for RE power capacity and investments by 2013 ... 31
Table 3: Exemplary good practice policies in the energy supply sector (policy area: reduce methane emissions from oil and gas production) ... 33
Table 4: Overview quantification approaches for the energy supply sector ... 34
Table 5: Exemplary good practice policies in the industrial sector (policy area: promotion of energy efficiency) ... 36
Table 6: Exemplary good practice policies in the industrial sector for reduction of F-gases ... 38
Table 7: Overview of quantification approaches for the industrial sector ... 39
Table 8: Exemplary good practice policies for efficiency of the building envelope (Policy area: Energy efficiency of the building envelope (heating/cooling)) ... 40
Table 9: Exemplary good practice policies for efficiency of appliances ... 41
Table 10: Overview of quantification approaches for the buildings sector ... 42
Table 11: Exemplary good practice policies in the transport sector ... 43
Table 12: Overview of quantification approaches for the transport sector ... 44
Table 13: Overview of good practice policies and quantification approaches for LULUCF ... 45
Table 14: Absolute and relative reductions of emissions through increasing renewable energy in the electricity generation sector ... 49
Table 15: Absolute and relative reductions of emissions through improving emission intensity of the oil and gas production ... 50
Table 16: Absolute and relative reductions of emissions from energy efficiency in the industrial sector ... 51
Table 17: Absolute and relative reductions of emissions from accelerated phase out of F-gases ... 52
Table 18: Reduction of electricity consumption in TWh per year ... 53
Table 19: Absolute and relative reductions of emissions through improving efficiency of building envelopes ... 54
Table 20: Per capita energy demand in buildings according to scenarios compatible with 2°C ... 55
Table 21: Absolute and relative reductions of emissions through improved efficiency of light duty vehicles ... 56
Table 22: Absolute and relative reductions of emissions through increasing the share of electric cars (fuelled with electricity generated by renewable energy) ... 57
Table 23: Global greenhouse gas emissions, absolute and relative to 2010, by 2020 and 2030 for different policy scenarios ... 58
Table 24: Absolute and relative reductions below implemented policies projections per policy area for the world ... 59
Table 25: Greenhouse gas emissions for China including LULUCF emissions, absolute and relative to 2010, by 2020 and 2030 for different policy scenarios ... 60
Table 26: Absolute and relative reductions below current policies projections per policy area for China ... 61
Table 27: Greenhouse gas emissions for USA including LULUCF emissions, absolute and relative to 2010, by 2020 and 2030 for different policy scenarios ... 62
Table 28: Absolute and relative reductions below current policies projections per policy area for the US ... 63
Table 29: Greenhouse gas emissions for India including LULUCF emissions, absolute and relative to 2010, by 2020 and 2030 for different policy scenarios ... 64
Table 30: Absolute and relative reductions below current policies projections per policy area for India ... 65
7
Table 31: Greenhouse gas emissions for Brazil including and excluding LULUCF emissions, absolute and relative to 2010, by 2020 and 2030 for different policy scenarios ... 66 Table 32 Absolute and relative reductions below current policies projections (excl. LULUCF) per policy area for Brazil ... 67 Table 33: Greenhouse gas emissions for Russia excluding LULUCF emissions, absolute and relative to 2010, by 2020 and 2030 for different policy scenarios ... 68 Table 34 : Absolute and relative reductions below current policies projections per policy area for Russia ... 69 Table 35: Greenhouse gas emissions for Japan excluding LULUCF emissions, absolute and relative to 2010, by 2020 and 2030 for different policy scenarios ... 70 Table 36 : Absolute and relative reductions below current policies projections per policy area for Japan ... 71 Table 37: Greenhouse gas emissions for “Rest of World” excluding LULUCF emissions, absolute and relative to 2010, by 2020 and 2030 for different policy scenarios ... 71
8
Summary
This report identifies good practice policies (see Box 1) that are currently implemented by individual countries and calculates the impact on greenhouse gas emissions on the global level if these policies were implemented widely. The study covers on an illustrative set of sectors, and provides detail for six example large emitting countries (China, United States, India, Brazil, the Russian Federation and Japan)1. The choice of sectors, regions and methodologies means the study considers around 65% of
global emissions.
The starting point of this study is an earlier report (den Elzen et al., 2015) which analysed the impact of enhanced policies on greenhouse gas emission reductions in the 13 largest emitting countries/regions (Australia, Brazil, Canada, China, the European Union, India, Indonesia, Japan, Mexico, the Russian Federation, South Korea, Turkey, and the United States) compared to the emission trajectories based on the most efficient current and planned climate policies.
The research question of that study was to find out how far countries could reduce emissions with three to five selected most efficient enhanced mitigation measures related to different areas of climate policy in each country, which are related to current national priorities. These areas include support for renewable energy, fuel efficiency in passenger transport, or a phase-down of fluorinated gases. The mitigation measures in this report all relate to the up-scaling of low-carbon energy supply, improvements in energy efficiency, and the adoption of low-emission technologies in all sectors. The analysis in this report extends the scope in three ways:
- It covers more policy areas and enhanced mitigation measures for each country, to illustrate a comprehensive picture of how emissions could develop under the application of existing “good practice” policies.
- It scales up the analysis to the global level, to illustrate how global emissions would develop if all countries would implement good practice policies.
- It assesses the impact of GHG reductions on a sectoral level using sector specific indicators. The purpose of this study is to test how much in terms of emission reductions could be delivered from replicating existing policy approaches in further sectors in other regions. It aims at contributing to identify practical ways to enhance emission reduction on the ground. This study is only a first step: “good practice” mainly refers to a policy with significant mitigation impact. All these “good practices” have been implemented by a broad number of countries across regions and proven their feasibility (e.g. car fuel efficiency standards). In this sense, “good practice” does not necessarily mean cost-effective, compatibility with national processes, or stakeholder interests.
1 We do not consider the European Union separately, but refer to other studies which have analysed the impact of enhanced policies on its emissions (compare e.g. (Bossman, Eichhammer, & Elsland, 2012; Greenpeace, 2012; Labat et al., 2015)). For more detail, see (den Elzen et al., 2015)
9
1.1 Main findings
If current good practice policies were to be implemented by all countries, global emissions in 2020 and 2030 are projected to decrease emissions close to the range necessary to hold global warming below 2°C. This requires fast implementation of policies, as well as complete geographical and broad sectoral coverage. All the parameters chosen for this analysis are based on analysis of policies that have already been implemented by example countries.
Other main findings of the report are:
• There is a large potential in replicating good practice policies: this could bring GHG emissions close to the level necessary to stay on track to meet 2°C.
With current policies, global emissions are expected to increase between 53.9 to 54.3 GtCO2e by
2020 and 58.6 to 60.1 GtCO2e by 2030. With the nine policy areas we have analysed,
implementation of good practice policies is projected to stabilise GHG emissions by 2020 at 49.2 to 49.7 GtCO2e and decrease to 43.7 to 47.4 GtCO2e by 2030, which would be close to the 2°C
range (UNEP, 2014). The emissions range that reflects scenarios compatible with holding temperature increase below 2°C is between 30 to 44 GtCO2e in 2030 in the UNEP Emissions Gap
Report 2014, with the median of all of those scenarios being 42 GtCO2e (UNEP, 2014).
These good practice policies were implemented in sectors representing 65% of global emissions, no additional policies were analysed in the remaining sectors.
• Replicating good practices policies across many different sectors would deliver most significant reductions.
Most emission reductions in our study result from increasing support for electricity generation from renewable energy (3.7 to 6.0 GtCO2e reduction in 2030). The range is due to different
assumptions that can be made for current trends after 2020 for which often no specific renewable policies are yet in place, and different assumptions for the implementation of good practice policies (see Section 3.1.1).
Many countries see these technologies in the electricity sector as an important opportunity to develop a cleaner energy system and are already implementing policies. The good practice policies can build on those efforts.
Good practice policies are climate- and energy policies that have been - or are being - implemented in specific countries and have resulted in significant deviation from business-as-usual emissions development in specific (sub-)sectors. These policies show it is technically and politically possible to implement such policies in one country. We translate this into global implementation to illustrate the impact of replicating very ambitious climate policies and try to learn how far it could bring the world to hold global warming below 2°C.
Further, we give an indication of what these good practice policies mean for the decarbonisation of sectors. Note that, although we show results for six exemplary large emitting countries, the approach does not give a recipe for these specific countries on how to implement ambitious climate policies. It merely inspires to show the possibilities of some chosen standard measures. Actual implementation should consider local circumstances and criteria that go further than mere emission reduction. Based on these considerations, other measures might be more appropriate based on these considerations.
10
Good practice policies in energy efficiency can also lead to emission reductions. Implementing efficiency measures in the transport, appliances and industry sectors could avoid 2.9 to 5.1 GtCO2e/a in 2030. Most countries already have efficiency standards in place that limit the
energy consumption of technologies. These standards could be extended in scope, enhanced in terms of ambition and their enforcement strengthened. Good practice policies for reducing deforestation could imply emission reductions of 1.5 GtCO2e below scenarios with implemented
policies.
• Direct replication of good practice policies is projected to halt emission growth in most regions significantly before 2030
For all countries analysed, the good practice policies can lead to significant emission reductions. In most countries, implementation of these policies halts emission growth at today’s level or decreases emissions from this point. An exception is India, where current activity levels are extremely low and further development will still slightly increase emissions until 2030, even with the implementation of good practice policies.
Depending on country circumstances, the size of absolute reductions differs. Of course, the overall size of the country has an impact, but other factors also matter: countries with high economic growth and fast-changing technology react stronger to technology changes induced by policies (e.g. car fuel efficiency standards). Also, for example a strong increase of electricity demand together with implementation of a high target for the share of renewable electricity has a strong impact on absolute emissions. A difference between the countries also emerges from the choice of sectors and good practice policies. If a country has a particularly large share of emissions of the uncovered sectors (e.g. agriculture), the reductions in our scenario are likely smaller.
• In the sectors analysed, replicating good practice policies can decrease the energy and carbon intensity to levels required for 2°C, at the same time as increasing the level of economic activities in these sectors.
This analysis shows that good practice policies such as decarbonising the energy supply and improving energy efficiency in the demand sectors can significantly reduce the impact that an increase in activity can have on greenhouse gas emissions, such as an increase of floor space, improved access to electrification, and enhanced mobility.
• The implementation of good practice policies identified in our analysis brings global emission levels close to the range consistent with the 2°C warming limit. On average, our study shows that in the electricity generation, transport, and buildings sectors, these policies are in line with this target.
The impact of good practice policies on a sectoral level is compared, using sectoral indicators, to global scenarios compatible with 2°C from the IPCC Fifth Assessment Report. The emission intensity of the electricity sector and the per capita energy consumption in the building sector are in line with the 2°C compatible scenarios for 2030. The same is valid for the reduction of F-gases and the transport sector. For the land use, land use change and forestry (LULUCF) sector, 2°C scenarios indicate emission levels around zero, some even result in negative emissions from this sector already by 2030 (IPCC, 2014). In our assessment, the total emissions for the good practice scenario in the LULUCF sector by 2030 are low but do not go to zero.
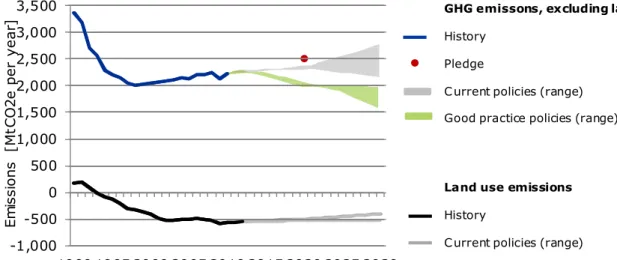
• With current policies, global emissions including LULUCF are expected to increase by 10% to 11% between 2010 and 2020 and 20% to 23% between 2010 and 2030 leading to emission levels of 53.9 to 54.3 GtCO2e in 2020 and 58.6 to 60.1 GtCO2e in 2030. If good practice policies were implemented in the nine policy areas (see Summary Table 1) included in our assessment,
11
emissions could almost remain stable at current levels until 2020 (49.2 to 49.7 GtCO2e in 2020)
and decrease thereafter to 43.7 to 47.4 GtCO2e by 2030 (see Figure 20). The result is a decrease
of global emissions from approximately 59 GtCO2e in the current policies scenario by 2030 (grey
range in Figure 1) to approximately 45 GtCO2e in the good practice policies scenario by 2030
(dark green range in Figure 1). Around 20 GtCO2e emissions are not covered by good practice
policies. This would bring GHG emissions close to the level necessary to stay on track to hold warming below 2°C. Implementation of good practice policies in the sectors not covered in our analysis could close the remaining emissions gap (as in(UNEP, 2014)). Emission reductions could also be achieved by other measures in the electricity sector such as nuclear or CCS (Carbon Capture Storage).
The policy area which has the highest impact on global emissions in this analysis is the strengthened support for electricity generation through renewable energy sources. Implementation of good practice policies in this area could reduce emissions between 3.7 to 6.0 GtCO2e in 2030.
This number goes beyond the potential indicated in the UNEP Emissions Gap Report 2014 of 5 GtCO2e. That report bases its estimates on the 2°C scenario of the Energy Technology
Perspectives report that assumes a less aggressive deployment of renewable energy (IEA, 2014b). Note that implementation of this ambitious renewable policy could bring along high implementation costs, which are not analysed in our study.
Other areas with significant reductions from implementing good practice policies are the reduction of fluorinated gases (‘f-gases’), the promoting of fuel efficiency standards of light duty vehicles and an increase in the efficiency of industrial processes. The area producing the lowest reductions in 2030 are electric cars. The main reason is that this technology is just starting to develop in our scenario: it will have little impact on the short-term but possibly has a high potential to reduce emissions beyond 2030. Further, the reduction indicated is additional to the effect of efficiency in the transport sector. If no fuel efficiency measures were taken, electric cars would have a stronger impact on emissions.
Only relatively small emission reductions can be achieved in the LULUCF2 sector through the
implementation of good practice policies. The main reason for this limited potential is that there is already a strong trend of reduction of deforestation in the baseline development, leading to a total reduction of LULUCF emissions in the range of 3 GtCO2e in 2030 compared to 2010.
12
Figure 1. Global greenhouse gas emissions under current policies scenario and implementation of good practice policies in all countries excl. LULUCF and only LULUCF. Note: emissions in 2010 are 48.8 GtCO2e, and thus slightly lower than other sources (e.g. (UNEP, 2014)).
Figure 2: Reductions below the implemented policies for each of the nine policy areas covered, based on two methods from NewClimate Institute and PBL. Source: Authors
All the results above are based on the assumption that the good practice policies can be technically implemented on a global level. We have not considered country specific circumstances beyond energy and emission data, and sometimes projections of activities. In our calculations, we did not take into account cost estimates or the effect of other benefits. On a local scale and/or concerning specific technologies, however, technological and financial barriers might constrain their mitigation potential (IPCC, 2014).
Summary - Table 1 illustrates the approach in each policy area. For all of the policy areas, there is a wide range of good practice policies, spread across all regions of the world. Chapter 4 illustrates those examples and includes further detail on the approach in each sector.
0 10,000 20,000 30,000 40,000 50,000 60,000 1990 1995 2000 2005 2010 2015 2020 2025 2030
GHG emissons, excluding land use
History
C urrent policies (range) Good practice policies (range)
Land use emissions
History
Good practice policies
E m is s io n s [M tC O 2 e /a ] NewClimate Institute PBL 30 35 40 45 50 55 60 1990 1995 2000 2005 2010 2015 2020 2025 2030 G tC O 2 e /a 30 35 40 45 50 55 60 1990 1995 2000 2005 2010 2015 2020 2025 2030
Promotion of electric vehicles
Efficiency standards for light duty vehicles Efficiency standards for the building envelope
Reduction of f-gases
Promotion of energy efficiency in industry Targets for methane reduction from oil and gas production
Reducing electricity demand from industry and buildings
Support for renewable electricity Current policies (excl. LULUCF)
13
Summary - Table 1: Overview of good practice policies and indicators for quantification Policy area and policy action Indicator Good practice value Increase renewable share in
electricity through country dependent policy mix
Share of renewable energy of electricity generation
+1.35% growth in share of RE generation per year and replace coal before other energy carriers
Emission reductions from production of fossil fuels
Emissions of CH4 and CO2
per unit of produced for oil & gas (associated gas and flaring/venting of gas)
Move from today to good practice values in 2030:
Oil and gas: 77.4 ktCO2e/Mtoe
Promotion of industrial energy efficiency through country specific policy instruments
Additional annual reduction of energy use in industry over current trend
1% better than development under current efforts
HFC and other F-gas emission reductions
Reductions below base year
Reductions below baseline for target years: 2018: 10%
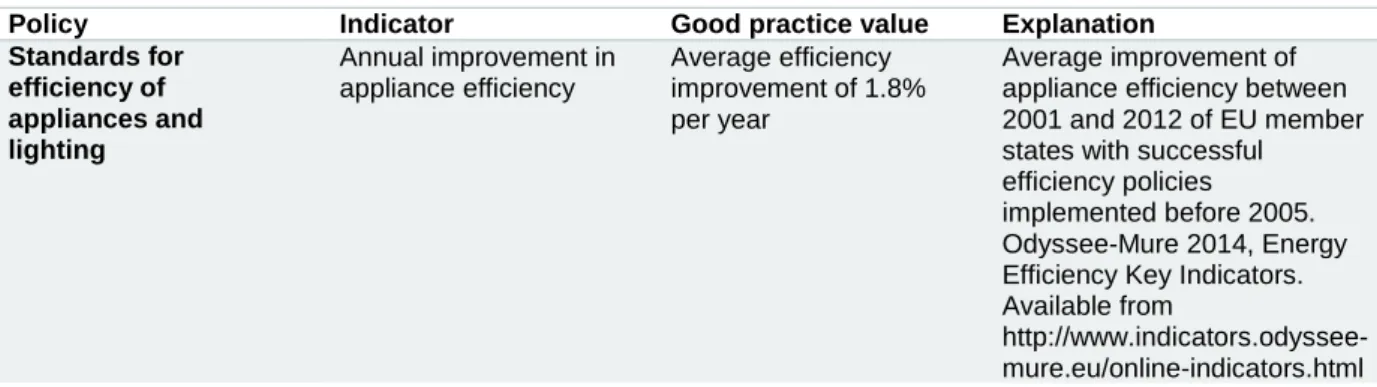
2022: 35% 2029: 70% 2033: 85% Standards for efficiency of
appliances and lighting
Annual improvement in appliance efficiency
Average efficiency improvement of 1.8% per year
Energy efficiency of the building envelope (heating/cooling)
KWh/m2 (energy consumption) for new buildings
Starting value for first year: Current standard for new buildings in kWh/m²
Moving linearly to 0 kWh/m² in 2030 Fuel efficiency / emission
standards light duty vehicles
Light duty vehicles fuel efficiency km/l for new registrations
Linear development from today’s level towards a fuel economy standard of 47.5 km/l in 2030
Support Electric cars driven by renewable electricity
Share of electric cars for new registrations
Starting from today’s share per country increasing to 10% of new vehicles in 2020, 20% in 2030
Emission reduction from deforestation
Yearly deforested area Based an average 2010 deforestation rate,
decreasing deforestation with 22% in 2020, and 44% in 2030.
1.2 Main findings for the sectoral level
1.2.1 Electricity from renewable energy sources
The good practice policy for renewable electricity generation that was selected, is an increase of the share of renewables of 1.35 percentage points per year. Implementation of this policy results in a significantly faster development of renewable energy compared to current policies, especially after 2020. Such good practice policies are projected to decrease emissions on a global level by 0.9 to 1.7 GtCO2e in 2020 and 3.7 to 6.0 GtCO2e in 2030.
Under the current policies scenario, the share of renewable electricity generation moves between 10% and 30% for most countries, with the world average being around 30% in 2030. Under the good practice policy scenario, the shares move up to roughly 40% to 55% in 2030. With its large hydro electricity generation capacity, Brazil’s share is already significantly above the average and remains as high in the good practice scenario.
The contribution of additional renewable energy also significantly decreases the emissions intensity of electricity generation. Especially in coal intensive countries like India and China, the increased share of renewable energy implied by the good practice policies significantly drives down the emission intensity.
The emission intensity of electricity supply after implementation of these good practice policies is within the range of what scenarios indicate would be required to hold temperature increase below 2°C above pre-industrial levels. IPCC AR4 WG3 indicates a 25th to 75th percentile range of 164 to
14
scenarios. However those with a currently very high intensity will require more time to achieve those levels.
The World Bank Report “Decarbonising development: 3 steps to a zero carbon future” mentions that at least 30% of electricity should be generated through renewable energy sources by 2025 (Fay et al., 2015). The IPCC says that in 2030, the share should be at around 35% (the median of all scenarios). The results of the good practice scenario exceed these values for all countries analysed.
Both reports say the electricity sector should be completely decarbonised around the middle of this century. This means the development the good practice policies imply needs to continue, and, in many regions, at an even faster pace. From a climate perspective, implementation of nuclear or CCS could result in similar emission reductions.
1.2.2 Reducing methane emissions from oil and gas production
Another potential area of improvement analysed in this report is the emission intensity of oil and gas production. In most countries, this is expected to increase or roughly stabilise in the next two decades. With aggressive reduction targets as for example foreseen in this sector in the United States, about 0.5 GtCO2e could be globally reduced in 2020, and up to 1.3 GtCO2e in 2030.
A major share of those emission reductions come from major oil-producing countries not covered in detail in this report. Of the countries covered, employing a strong methane reduction target for Russia would lead to the most reductions, given its high production volumes. For Japan, this sector is largely irrelevant, as it imports almost all of its oil and gas. For China, the effect is small as emissions in the sector are not high and the intensity already improves under projections of current policies. For India, the effect is larger than for China although it produces less gas and oil, as the emission intensity of the process is at a significantly high level today and projected to stay high.
1.2.3 Efficiency of industrial processes
If countries worldwide were to implement good practice policies for efficiency in industry, global emissions could decrease by 1.2 GtCO2e in 2020 and 1.8 GtCO2e in 2030. The major share of those
projected reductions comes from China and India. China has the world’s largest industry emissions in both 2020 and 2030, especially for cement and steel. The analysis shows that it could strengthen or expand existing programmes to tap into significant mitigation potential. Efficiency measure in India’s industry sector were projected to have the largest impact because it has relatively large energy savings potential when compared to good practice (Dasgupta, Roy, Bera, Sharma, & Pandey, 2012). Implementing good practice efficiency policies could decrease GHG emissions by 29% in 2030 compared to current policies emission levels.
1.2.4 Reductions of fluorinated gases
Good practice policies implemented in the area of industrial F-gases could achieve high additional emission reductions to current policies. If the North American Montreal Protocol Amendment Proposal were to be implemented and extended to PFC’s and SF6, global emissions could decrease by 0.1 to 0.2 GtCO2 in 2020 and by 1.1 to 2.2 GtCO2e in 2030, relative to the current policies scenario. With
currently implemented policies, the increase can be as high as 300% to 400% above 2010 levels with currently implemented policies, especially in countries with certain developing industrial sectors (e.g. car industry, or refrigerants). With good practice policies, global emissions decrease by 70%-80% below the current policies scenario
15
Global F-gas emissions in the good practice policy scenario decrease to a level of 60% to 65% of 2010 levels. According to Labat et al. (2015) a global mitigation scenario illustrating how all countries can set milestones for action by 2030 - in relation to the common goal of holding global warming below 2°C and integrating national circumstances - would go deeper, to around 70% F-gas reductions compared to 2010 by 2030.
1.2.5 Efficiency of building envelopes and appliances
Implementation of good practice policies in the residential sector could lead to a decrease of electricity consumption of 0.9 TWh and reductions of GHG emissions of up to 1.8 GtCO2e in 2030.
Implementation of good practice policies on efficiency for appliances leads to indirect GHG emission reductions of 1.3 GtCO2 by 2030, while the impact on direct emissions is negligible. Efficiency
measures implemented when constructing new buildings can reduce emissions by 0.2 GtCO2e in 2020
and 0.5 GtCO2e in 2030 in those countries covered in this sectoral analysis (China, US, India, Russia,
Japan)3. The results show the per capita demand in countries with high per capita consumption in this
sector decreases the most with the implementation of the good practice policies compared with a scenario with currently implemented policies. In countries where per capita energy consumption is still increasing to provide basic services to the population, the policy will imply less direct short term changes.
The IPCC scenarios compatible with 2°C illustrate different values for the five regions for 2050. Comparing the country results to their particular regions shows that the results of good practice policies are roughly in line with the efforts needed for 2°C in the building sector. Thereby, some trade-offs between countries may be necessary: while the US even is significantly below the average value for the OECD-1990 region, Russia is - even with good practice policies - still above the threshold. Japan, China and India are close to the value indicated for their region in 2030.
1.2.6 Efficiency of light duty vehicles and electric cars
In the transport sector, strong fuel energy efficiency standards for new light duty vehicles and supporting electric vehicles could reduce emissions by 0.3 to 0.9 GtCO2 in 2020 and 1.9 GtCO2e in
2030 (see Table 21). Already under the current policy scenario, fuel efficiency of light duty vehicles increases as most countries already have car efficiency policies in place. Good practice fuel efficiency standards for new light-duty vehicles are more ambitious and could accelerate this trend significantly and speed up efficiency improvements of the entire car fleet. These good practice standards are based on an extrapolation of proposed 2025 EU car standards to 2030. The standards are comparable to the standards in the 2°C scenario from the Technology Roadmap (IEA, 2012) which are based on estimates of good achievable levels in terms of technology potential and also include changed sales expectations. If these additional standards were implemented, it would lead to 50%-70% global emission reductions for light-duty vehicles compared to current policies scenario.
Similarly, fuel efficiency and a greater share of electric vehicles in the car stock, further decrease the emissions intensity of the distance driven of this sub-sector. The emissions intensity already decreases under current policies, but the rate of improvement are much higher with global good practice action.
IPCC does not break down requirements for the transport sector to light duty vehicles in the illustration of what is compatible with 2°C, but shows that, in 2020, electric mobility should hold a share of approximately 1%, and 9% in 2050 (Sims et al., 2014). With the good practice policies, these shares
16
would be achieved for light duty vehicles. The IPCC also shows that absolute emissions of the sector should roughly stabilize at current levels throughout 2050 and decrease thereafter, while activity strongly increases. For the light duty vehicles considered in this report, this is the case. We even see a reduction in emissions from this segment after 2020.
1.3 Main findings for example countries
In addition to the sectoral results, we provide an estimate of the potential impact of good practice policies globally. With this aim in mind, we also illustrate the potential that replicating those policies has on each country. For all regions, this report finds substantial reductions resulting from the replication of good practice policies.
The extent to which the chosen policies reduce emissions varies between countries, depending on how important the chosen policy areas are in terms of emissions, to what extent countries are already implementing climate action and other country specific circumstances. Our approach assumes that the good practice policies can be implemented with the same effectiveness. When these policies would be actually implemented in these countries, there could be important differences between the countries. The results shown here are only illustrative and serve to give an indication of the potential impact of certain policies, rather than real emission reductions in a particular country.
We compare the good practice scenarios to the current policy projections from (den Elzen et al., 2015). We use these projections as reference, while acknowledging that the literature provides a range of alternative estimates for the countries considered.
17
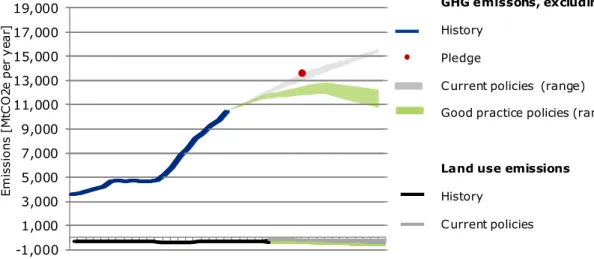
1.3.1 China
In the projections used in this study, current implemented policies in China lead to approximately 13 GtCO2e in 2020 and 15 GtCO2e in 2030. This is an increase of approximately 30% above 2010
levels by 2020, and approximately 50% by 2030. With these emission levels, our projections suggest that China will likely achieve their pledge for 2020 emissions (see Figure 3). When we project that "good practices policies" are replicated in all sectors we find that this translate to peaking emissions in China around 2020 and at a level below 12 GtCO2e. In addition, replicating the “good practice” policies
translates to driving China’s emissions to below current levels by 2030.
Figure 3: Impact of climate policies on greenhouse gas emissions in China.
Historical greenhouse gas emissions are based on energy-related emissions (IEA, 2013a), non-energy-related emissions (EDGAR 4.2) (JRC and PBL, 2012) and LULUCF emissions (FAOSTAT).
-1,000 1,000 3,000 5,000 7,000 9,000 11,000 13,000 15,000 17,000 19,000 1990 1995 2000 2005 2010 2015 2020 2025 2030 E m is s io n s [ M tC O 2 e p e r y e a r]
GHG emissons, excluding land use
History Pledge
C urrent policies (range) Good practice policies (range)
Land use emissions
History
18
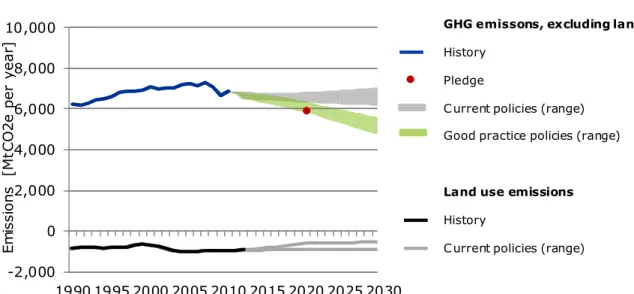
1.3.2 United States
In the projections used in this study, currently implemented policies in the United States lead to approximately 5.4 to 6.2 GtCO2e in 2020 and 5.3 to 6.5 GtCO2e in 2030. This projected trend would
maintain emissions approximately at today’s level. With the emission levels resulting from our projections, the US would likely not achieve their 2020 pledge. However, the country has a number of administrative actions close to implementation which, if fully implemented, could lead to it achieving the target (compare (den Elzen et al., 2015). Replicating “good practice” policies in all sectors analysed in this study, the results indicate that the US could achieve emission reductions of 15% to 37% below current levels by 2030, according to our projections (see Figure 4).
Figure 4: Impact of climate policies on greenhouse gas emissions in the United States.
Historical greenhouse gas emissions (excluding LULUCF) are based on national inventories submitted to UNFCCC, and LULUCF emissions from the Sixth National Communication of the United States of America (United States, 2014).
-2,000 0 2,000 4,000 6,000 8,000 10,000 1990 1995 2000 2005 2010 2015 2020 2025 2030 E m is s io n s [M tC O 2 e p e r y e a r]
GHG emissons, excluding land use
History Pledge
C urrent policies (range) Good practice policies (range)
Land use emissions
History
19
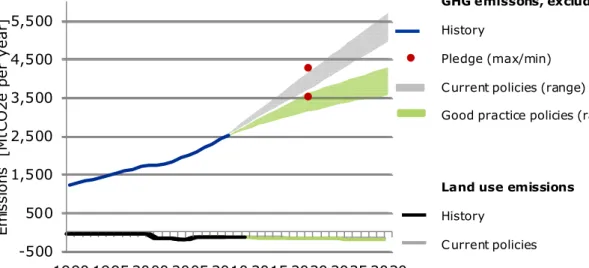
1.3.3 India
In the projections used in this study, current implemented policies in India lead to 3.5 to 4.0 GtCO2e in 2020 and 4.8 to 5.5 GtCO2e in 2030. This is an increase of 50% to 67% above 2010 levels by 2020, and more than double by 2030. With the emission levels resulting from these projections, India will likely achieve their pledge for 2020 emissions (see Figure 5). Replicating “good practice” policies in all sectors, emissions in India are projected to be at 3.0 to 3.5 GtCO2e in 2020 and at 3.4 to 4.1 GtCO2e
in 2030.
Figure 5: Impact of climate policies on greenhouse gas emissions in India.
Historical greenhouse gas emissions are based on energy-related emissions (IEA, 2013a), non-energy-related emissions (EDGAR 4.2) (JRC and PBL, 2012) and LULUCF emissions (FAOSTAT).
-500 500 1,500 2,500 3,500 4,500 5,500 1990 1995 2000 2005 2010 2015 2020 2025 2030 E m is s io n s [M tC O 2 e p e r y e a r]
GHG emissons, excluding land use
History
Pledge (max/min) C urrent policies (range) Good practice policies (range)
Land use emissions
History
20
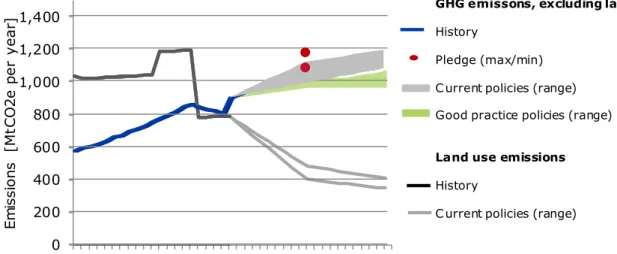
1.3.4 Brazil
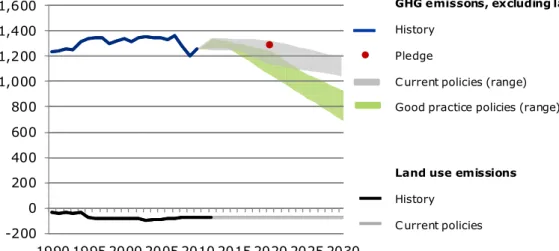
In the projections used in this study, current policies in Brazil lead to 1.5 GtCO2e emissions by both
2020 and 2030, including land use. Brazil has already implemented deforestation policies, especially in the Cerrado region which lead to important reductions from today’s levels, according to our assessment. Therefore the focus in this report is on all other sectors. Excluding land use, current policies projections in this report in Brazil are expected to grow and lead to 1.0 to 1.1 GtCO2 by 2020
and 1.1 to 1.2 GtCO2e by 2030 (see Figure 6). Replicating the “good practice” policies, our study
projects emissions of roughly 1 GtCO2e in 2030.
Figure 6: Impact of climate policies on greenhouse gas emissions in Brazil.
Historical greenhouse gas emissions (excluding LULUCF) are based on inventory data submitted to the UNFCCC (until 2005), energy-related CO2 emissions from IEA (2013a), non-energy-related
emissions from EDGAR 4.2 (JRC and PBL, 2012) and LULUCF emissions from FAOSTAT data (http://faostat3.fao.org/faostat-gateway). 0 200 400 600 800 1,000 1,200 1,400 1990 1995 2000 2005 2010 2015 2020 2025 2030 E m is s io n s [M tC O 2 e p e r y e a r]
Good practice policies projections, min/max
GHG emissons, excluding land use
History
Pledge (max/min) C urrent policies (range) Good practice policies (range)
Land use emissions
History
21
1.3.5 Russian Federation
In the projections used in this study, current policies in Russia lead to 2.3 to 2.4 GtCO2e in 2020 and
2.2 to 2.8 GtCO2e by 2030 (excl. LULUCF). The emission levels calculated here indicate an
achievement of Russia’s pledge for 2020 emissions. Replicating “good practice” policies decreases projected emission levels from 2015 onwards and leads to levels of 2 GtCO2e or below by 2030 (see
Figure 7).
Figure 7: Impact of climate policies on greenhouse gas emissions in the Russian Federation.
Historical greenhouse gas emissions (excluding LULUCF) are based on national inventories submitted to UNFCCC, and forestry emissions from the Sixth National Communication (Russian Federation, 2013)
Implemented policy projections LULUCF min Series3 Only LULUCF -1,000 -500 0 500 1,000 1,500 2,000 2,500 3,000 3,500 1990 1995 2000 2005 2010 2015 2020 2025 2030 E m is s io n s [M tC O 2 e p e r y e a r]
GHG emissons, excluding land use
History Pledge
C urrent policies (range) Good practice policies (range)
Land use emissions
History
22
1.3.6 Japan
In the projections used in this study, emissions after implementation of current policies in Japan remain at around 2010 levels by 2020 and decrease by 5% to 17% by 2030 (see Figure 8). This reflects emission levels of 1.1 to 1.3 GtCO2e by 2020 and 1.0 to 1.2 GtCO2e by 2030. The wide range
can be explained by the uncertainty about the phase-out of nuclear energy, as it is not clear whether this will occur and which energy carriers would replace nuclear energy. With these projections, meeting the 2020 pledge could be challenging for Japan. Replicating “good practice” policies translates to projected emission levels of 0.5 to 0.9 GtCO2e in 2030.
Figure 8: Impact of climate policies on greenhouse gas emissions in Japan.
Historical greenhouse gas emissions (excluding LULUCF) are based on national inventories submitted to UNFCCC.
1.3.7 Rest of world
The previous sections showed the results of implementation of “good practice” policies for six example countries. Replication of “good practice” policies for the rest of the world lead to 5% above 2010 emission levels by 2020 and around 2010 levels by 2030, according to our projections (see Figure 9).
Figure 9: Impact of climate policies on greenhouse gas emissions in “Rest of the World” -200 0 200 400 600 800 1,000 1,200 1,400 1,600 1990 1995 2000 2005 2010 2015 2020 2025 2030 E m is s io n s [M tC O 2 e p e r y e a r]
GHG emissons, excluding land use
History Pledge
C urrent policies (range) Good practice policies (range)
Land use emissions
History C urrent policies -2,000 3,000 8,000 13,000 18,000 23,000 28,000 1990 1995 2000 2005 2010 2015 2020 2025 2030
GHG emissons, excluding land use
History
C urrent policies (range) Good practice policies (range)
E m is s io n s [ M tC O 2 e p e r y e a r]
23
1 Introduction
An earlier study (den Elzen et al., 2015) analysed the impact enhanced policies could have on greenhouse gas emission reductions in the 13 largest emitting countries/regions (Australia, Brazil, Canada, China, the European Union, India, Indonesia, Japan, Mexico, the Russian Federation, South Korea, Turkey, and the United States) compared to the emission trajectories based on the most efficient current and planned climate policies.
The research question of that study was to find out how far countries could reduce emissions with three to five selected most efficient enhanced mitigation measures related to different areas of climate policy in each country, which are related to current national priorities. These areas include support for renewable energy, fuel efficiency in passenger transport, or a phase-down of fluorinated gases. The mitigation measures in this report all relate to the up-scaling of low-carbon energy supply, improvements in energy efficiency, and the adoption of low-emission technologies in all sectors. The analysis in this report extends the scope in three ways:
- It covers more policy areas and enhanced mitigation measures for each country, to illustrate a comprehensive picture of how emissions could develop under the application of existing “good practice” policies.
- It scales up the analysis to the global level, to illustrate how global emissions would develop if all countries would implement good practice policies.
- It assesses the impact of GHG reductions on a sectoral level using sector specific indicators. Another difference to the previous study is a focus on six example countries + rest of the world, rather than looking at a larger number of countries but neglecting the rest of the world.
Good practice policies are climate- and energy policies that have been, or are being implemented in specific countries and have resulted in significant deviation from business-as-usual emission development in specific (sub-)sectors. These policies show that it is technically possible to implement such policies in one country.
We translate this into global implementation to illustrate the impact of replicating very ambitious climate policies and try to learn how far it could bring the world towards holding temperature increase below 2°C. Further, we give an indication of what these good practice policies mean for the decarbonisation of various sectors. Note that, although we show results for six large emitting example countries, the approach does not give a recipe for these specific countries on how to implement ambitious climate policies. It merely inspires to show the possibilities of some chosen standard measures. Actual implementation should consider local circumstances and criteria that go further than mere emission reduction. Other measures might be more appropriate based on these considerations. This report identifies and describes good practice policies, and develops methods to calculate the impact of these policies on GHG emissions projections of six large emitters (China, United States, India, Brazil, the Russian Federation and Japan) 4 and on a global level. Together, these countries
emitted around 55% of global anthropogenic greenhouse gas emissions in 2012 (Joint Research Centre & PBL Netherlands Environmental Assessment Agency, 2014). The results for each country serve to identify policies that could be implemented to raise ambition and have significant co-benefits.
4 We do not consider the European Union separately, but refer to other studies which have analysed the impact of enhanced policies on its emissions (compare e.g. (Bossman et al., 2012; Greenpeace, 2012; Labat et al., 2015)). For more detail, see (den Elzen et al., 2015)
24
Further, one can compare future emission reduction targets and policies of that country to a good practice scenario.
25
2 Approach
The method applied consists of the following steps: • Identify good practice policy areas
• Define indicators for quantification of policies
• Determine impact of good practice policies on countries • Aggregate the global total
The next paragraphs describe these steps further illustrating the approach for fuel efficiency standards for cars.
2.1 Identify good practice policy areas
Starting from the enhanced policies implemented in our previous study (den Elzen et al., 2015), we identify a number of “good practice policies” that could be implemented by all countries. For areas not covered in that report, we consider good practice polices that are currently being implemented or proposed by specific countries.
Additionally to the earlier analysed enhanced policies, existing reports could point to potentially innovative, high impact policies. For example, technical papers from the UNFCCC on mitigation benefits of actions, initiatives and options to enhance mitigation ambition give insights in successful policy making, based on submissions from countries and observers (UNFCCC, 2014)(UNFCCC, 2013b). We also consider specifically innovative or ambitious actions. Criteria for the overall list are a coverage of all important sectors, global applicability of policies and data availability.
The selected policies describe specific good practice policies that go beyond current polices in specific (sub)sectors, but do not necessary cover the total technical mitigation potential in this (sub)sector. For example a question could be what the impact of efficiency standards for cars implemented globally is if the most stringent level currently applied by one country is used for all countries, not what the mitigation potential from more efficient cars is.
To provide a comprehensive global picture and reflect different national priorities of countries in terms of the sectoral focus, it is essential to cover all greenhouse gases and sectors in a balanced manner. Within the scope of this report we cover nine good practice policy areas, which represent roughly 65% of global emissions in 2030 (see Section 3.3).
2.2 Define indicators for the quantification of the policies
To make sure that climate policies will result in emission reductions for different countries, it is necessary to define a method for each policy, which is applicable independently of the countries’ diverse national circumstances as good as possible. Factors which can influence the results are for example the country’s population and density trends, the expected growth of the complete economy or specific sectors, the current status of sectoral structure of the economy (sectoral emission break-up), current status of existing policies, energy production and consumption. It is thus important to find indicators that directly link to the identified climate policies, and which are independent of these country specific factors or can build on them.
As example, the indicator “fuel efficiency of new cars” is independent of starting point and overall energy consumption and activity level of a country, as opposed to the indicator “absolute energy consumption reductions of cars”, which does depends on those.
26
2.3 Determine impact on countries and globally
For each good practice policy, this report elaborates an adequate indicator to express the improvement caused by this policy (e.g. fuel efficiency of new cars in km/l). The good practice case or a combination of different good practice examples then provides the exemplary value for this indicator (e.g. moving towards a fuel efficiency of new cars of 47.5 km/l in 2030, based on the development in a specific country after implementation of policies). The targeted indicator value under good practice policies is the same for all countries. Where adequate, the analysis includes the delay from a decision of the policy to its implementation and impact.
These targets are implemented into energy and land use models to quantify the impact on GHG emissions in 2020 and 2030. Two methods are used to estimate this impact: (i) the PBL FAIR policy model (den Elzen et al., 2014) together with the TIMER energy model (Van Vuuren et al., 2014), and (ii) bottom-up spreadsheet calculations by NewClimate Institute, which are based on existing scenarios from national and international studies (e.g. IEA´s World Energy Outlook 2014), as well as own calculations of the impact of individual policies in various subsectors. Both methods were supplemented with emission projections for land-use policies using IIASA’s global land-use model GLOBIOM (Havlík et al., 2014) and global forest model G4M (Gusti, 2010). For most sectors, both approaches analyse the impact in parallel, and the illustrated results compare the outcomes of the two models. Both methods were also used for the calculation of the impact of the most effective current and planned policies on greenhouse gas emissions, as described in detail in den Elzen et al.(2015). The selection of current and planned policies was based on literature research and expert knowledge. For the analysis of the good practice policies the PBL FAIR policy model and the TIMER energy model allows to account for the impact of possible overlaps between good practice policies. Such overlap could be efficiency targets that lead to lower energy levels and which would have an impact on the results of implementing renewable energy targets, or change in fossil fuel prices could change due to simultaneous implementation of all policies. NewClimate approaches the policy areas in a stepwise integrated way, meaning that for example the model considers first a change in the carbon intensity of the electricity supply, and then reductions in electricity consumption. The model does not consider overlaps between reductions of fossil fuels and emissions from fossil fuel production.
The analysis focuses on the global level an on the six largest emitting countries. The remaining countries are summarised to one additional region (which also includes the EU member states). Reviewing large emitters in detail allows an accurate consideration of country specific differences for a great part of emissions. It provides additional insight in how different policy areas can impact sectoral and total emissions of those countries.
The remaining countries (“rest of world”) are treated as one region, to which both methods apply the same good practice policies. NewClimate Institute sums up all emissions and activity data outside the countries covered in detail and applies the same indicators to this aggregate. PBL calculates the impact of the policies for the individual remaining countries or regions as used with the FAIR policy and TIMER energy models, and then aggregates these to the “rest of world”. Carefully choosing the methods for quantification and using indicators applicable to different circumstances makes it possible to use aggregated data from these countries. For the Land Use, Land Use Change and Forestry sector, this report takes a different approach: it looks at countries with important forest areas individually and then aggregates them to a global value.
This analysis covers nine policy areas in detail, covering approximately 65% of emissions in in 2030 (see Figure 10). For the areas not covered, substantial mitigation options are possibly available, but not considered quantitatively in this report. Sectors, which are not included in our analysis are agriculture, parts of the transport and industrial sector, waste, and bunkers.
27
For a few policy areas, the analysis was only possible with one of the approaches, given complexity of the calculations or data availability. In those cases, the results of one modelling team are transferred to the other model and adjusted where necessary. This is the case for energy efficiency in industry and appliances, where PBL conducted a detailed analysis and NewClimate Institute integrated those results in their framework. For efficiency of the building envelope and the increase of the share of electric cars it is the other way round and NewClimate Institute follows a detailed approach. Thereby, a careful consideration of overlaps is necessary. For example if one of the models estimates reductions for electricity consumption in the building sector due to the implementation of building standards, these reductions need to be reflected as a decrease in emissions of the power sector in the other model and vice versa.
Figure 10 Covered GHG emissions (incl LULUCF) in assessment of good practice policies. The shares indicate % of 2030 emissions under the current policy scenarios for PBL and New Climate insitute
After calculating the emissions of individual countries and the “rest of world”, this last step aggregates the results on a global level.
2.4 Comparing the results to scenarios compatible with 2°C
To conclude, it was assessed whether the globally applied good practice policies are sufficient to hold global temperature increase below 2°C above pre-industrial levels, taken into account that our analysis only account for 65% of global emissions by 2030. Two options give an indication to answer this question in this report:
• On global level, compare overall global emission levels after implementation of good practice policies up to 2030 with global emission projection compatible with meeting the 2°C target with a likely chance, as assessed by UNEP (2014).
• On sectoral level, compare intensity indicators with those in scenarios compatible with 2°C levels (mainly from UNEP (2014), and partly based on the IPCC AR5, Working Group III)
Covered - Power supply Covered - Industry (energy related)
Covered - Transport (cars only) Covered - F-gases
Covered - Oil & gas production Covered - Buildings
Covered - LULUCF Uncovered - total rest
Covered - Energy Supply Covered - Industry
Covered - Transport Covered - Buildings
Covered - AFOLU Uncovered - AFOLU
Uncovered - Transport Uncovered - Waste
Uncovered - Energy Supply Uncovered - Buildings
Uncovered - Industry Uncovered - Bunkers
28
3 Selection of good practice policies and accompanying
indicators
This chapter describes the selection of good practice policies for all sectors. The text and tables illustrate and explain the indicators chosen and how the past or current impacts of existing policies on greenhouse gas emissions translate into good practice values. Further, for each policy area, the text describes how the level of the chosen indicator is translated to emission reductions.
3.1 Energy supply sector
For the energy supply sector, we consider two areas: power generation and the production of fossil fuels.
For increasing the deployment of renewable energy technologies, the mitigation potential is high (5 GtCO2e in 2030 (UNEP, 2014)), and immediate implementation of such policies can lead to
long-term transformational effects, as GHG emissions from this sector are avoided.
During the production of fossil fuels, a high amount of energy is wasted through flaring or venting of methane emissions, or leakage during the transport of the fuels. Although measures can be cost-effective as the captured methane can be used as an energy sources, only few countries have policies in place to control this sector (Braun et al., 2014). The potential of this sector is also significant (2 GtCO2e in 2030 (UNEP, 2014)).
3.1.1 Renewable energy in electricity generation
More and more countries are already starting to implement policies supporting renewable energy technologies. Over 140 countries have renewable energy targets and many of those are supported by economic incentives or regulatory instruments (REN21, 2014). In this section, we describe exemplary policy activities in Uruguay, Costa Rica, the Pacific Islands and the Dominican Republic, developing countries with specifically ambitious target and comprehensive supportive policies. We also include the UK and Germany, countries which have implemented RE policies for long time periods already. As an example from the African continent, the section describes RE policies in Morocco also. Other good practice examples – not further described in this report – are the RE policy frameworks of Kenya and Philippines (UNFCCC, 2014). For countries, where renewable energy policies have existed for a certain period of time, we compare historic trends of the share of renewables, for countries which are just starting to develop such frameworks, we focus on the targets to compare their ambition.
As an example, Uruguay has enacted several laws that constitute the basis of their ambitious renewable energy target. Uruguay has set a target of 90% share of the power generation from RE by 2015 (REN21, 2014). Furthermore, the different policies on biofuels, solar power, and wind power also support achieving this target. Innovative promotion schemes have been developed, granting industries up to 80% tax reductions on the investment in renewable energy generation (MIEM, 2014). According to Montano (2014) this successful model has been taken as a reference and is being currently imitated by other countries. Uruguay is among the “top countries for investment in new renewable power” (REN21, 2014) and by 2011 its share for RE of electricity generation was at approximately 72% (IEA, 2013a). Uruguay is especially investing in wind power to hedge their hydropower risk and has installed the largest per capita capacity during 2014. For achieving the target, the annual percentage point increase of the share of RE electricity generation would need to be 4.5 percentage point. It is worth noting the main drivers of Uruguay’s ambitious RE target are the lack of gas and oil resources in the country and the fact that almost all their hydroelectric potential has being used (Montano, 2014).
29
Likewise, Costa Rica and the Dominican Republic have enacted targets and supporting policies on RE, which include tax exemptions, tendering and technology specific targets. Costa Rica aims to achieve a 100% of RE by 2021 (REN21, 2014). In 2011 91% of electricity came from renewable energy IEA (2013) and are 93% are expected for 2015, leading to more modest growth rates of the share of RE of 0.9 percentage point on average per year. The Dominican Republic aims at achieving 20% renewable electricity by 2020, their share of RE by 2011 was 12% (IEA, 2013a) (0.9 percentage point annual increase of the share).
Other ambitious RE policy examples include Morocco, which has in place various targets for renewable capacity, as well as support policies for promoting the development of such technologies. Morocco is considered among the most ambitious countries in terms of renewable energy within the African continent (Braun et al., 2014). According to IEA (2014c) Morocco’s energy strategy and RE targets are on track and it “has made important advances in wind and solar energy, and fuel subsidy reform”. The capacity target of the country aims to increase 6 GW in wind, solar and hydro power by 2020 (2 GW each) (IEA, 2014c).
The Pacific Islands, through their Greenhouse Gas Abatement through Renewable Energy Project (PIGGAREP) have also set targets for power generation from RE. The PIGGAREP is being implemented by the UNDP and funded by the GEF (SPREP, 2014). Furthermore, the PIGGAREP has set RE as “a priority issue at the national level and has been mainstreamed in national and sectoral policies, strategies, plans and/or roadmaps in most countries” (SPREP, 2014). Some small islands states have the most ambitious target among the Pacific Islands such as Tuvalu and Niue whit a 100% target of RE by 2020.
Various countries have had policies in place for longer time periods in the past. For example, UK implemented the Renewable Obligation in 2002, a system requiring energy suppliers to fulfil a certain quota of RE, either through own installations or through the purchase of certificates. Germany has in place the Renewable Energy Act (Erneuerbaren Energien Gesetz (EEG)), with a feed-in tariff as the main instrument incentivising investments in RE since 2000. Both policies have boosted renewable energy deployment in the electricity sector (Braun et al., 2014). On average, the share of renewable electricity has increased by 1.35 percentage points per year in the two countries since 2002 (Own calculations based on IEA Energy Balances (IEA, 2014a)).
Table 1: Annual increase in renewable electricity share as the result of exemplary good practice policies in the energy supply sector
Country
Indicator value: annual required increase in renewable energy share of electricity in percentage points to
meet target
Description of policy
Uruguay 4.55
RE target 90% in 2015
Tax exemptions for RE investments
Increase renewable share in electricity through country dependent policy mix
Costa Rica 0.96
RE target 100% in 2021
Diversification of the energy matrix
5 According to IEA (2013b) the RE share by 2011 was approximately 72%. Taking into account the RE target by 2015, thus the increase per year is of 4.5 percentage point.