RIVM
Oral bioavailability of lead from Dutch
made grounds
A validation study
Colophon
© RIVM 2014
Parts of this publication may be reproduced, provided acknowledgement is given to: National Institute for Public Health and the Environment, along with the title and year of publication.
This is a publication of:
National Institute for Public Health and the Environment
P.O. Box 1│3720 BA Bilthoven The Netherlands
www.rivm.nl/en
P.C.E. van Kesteren (RIVM-VSP) N. Walraven (Geoconnect)
T. Schuurman, R. A. Dekker (WUR-ASG) R. Havenaar, A.J.H. Maathuis (TNO Zeist)
H. Bouwmeester, E. Kramer, R. Hoogenboom (RIKILT) W Slob, E.F.A. Brandon (RIVM-VPZ)
J.C.H. van Eijkeren (RIVM-RIO)
G. Boom, K. Miermans, S. Piso (TNO Utrecht) M. Cave (British Geological Survey)
P. Schwillens (RIVM-GZB) J.P.A. Lijzen (RIVM-DMG) M.I. Bakker (RIVM-VSP)
Contact: Martine I. Bakker, RIVM-VSP martine.bakker@rivm.nl
This investigation was performed by order and for the account of the Ministry of Infrastructure and Environment and of the City of Amsterdam, within the framework of Project M/607711 (‘Soil Quality and risk assessment’)
Publiekssamenvatting
Orale biobeschikbaarheid van lood uit Nederlandse stedelijke ophooglagen
In Nederland zijn de bodems van oude binnensteden (ophooglagen) in het verleden gevormd door stadsafval en puin, onder andere afkomstig van industriële activiteiten. Dit materiaal is vaak verontreinigd met lood, en zo ook de bodems. Vooral kinderen zijn gevoelig voor de schadelijke effecten van lood als zij dat via de mond binnenkrijgen. Een te hoge blootstelling aan lood kan de ontwikkeling van de hersens verstoren. Er bestaan meerdere laboratorium-modellen die schatten hoeveel lood uit de bodem in het maag-darmkanaal vrijkomt en vervolgens bij kinderen in het bloed kan terechtkomen
(biobeschikbaarheid). Het RIVM heeft onderzocht hoe goed drie van deze modellen deze schatting kunnen maken. Hieruit blijkt dat al deze methoden sterke én zwakke punten hebben, maar dat het zogeheten Unified BARGE Model het meest geschikt is om biobeschikbaarheid van lood in ophooglagen te
schatten.
Met de drie modellen is de biobeschikbaarheid van lood in zes bodems geschat. De uitkomsten zijn vervolgens vergeleken met de resultaten van biobeschik-baarheidsonderzoek met jonge varkens. De manier waarop lood zich in het maag-darmkanaal van deze dieren gedraagt, is vergelijkbaar met het gedrag in dat van kinderen. Het Unified BARGE Model en het Tiny-TIM model laten eenzelfde patroon zien als de dierproeven, maar de uitkomsten van Tiny-TIM leiden tot een onderschatting van de werkelijke biobeschikbaarheid. Het IVD-model blijkt alleen geschikt als wordt gecorrigeerd voor het kalkgehalte in de bodem. Een relatief eenvoudige methode om de hoeveelheid beschikbaar lood in een bodem te schatten is extractie met verdund salpeterzuur. Deze methode kan als een eerste screening worden gebruikt om de hoeveelheid biobeschikbaar lood in een bodem te schatten.
Uit de resultaten van de dierproeven kan een standaardwaarde voor de biobeschikbaarheid van lood in stedelijke ophooglagen worden afgeleid. Beleidsmakers kunnen deze waarde als maatstaf gebruiken om te bepalen hoeveel lood beschikbaar is om door het menselijk lichaam te kunnen worden opgenomen. Op basis van de standaardwaarde en het totaalgehalte aan lood in de bodem wordt bepaald of er een onacceptabel risico voor de gezondheid is en maatregelen nodig zijn. Het gebruik van deze standaardwaarde heeft als voordeel dat er geen experimenten met de testmodellen nodig zijn, wat geld en tijd bespaart. De bevindingen van dit onderzoek geven aan dat er meer lood in de bodem beschikbaar is dan eerder werd verondersteld. Dit kan aanleiding zijn om de normstelling van lood in bodem opnieuw te bekijken.
Trefwoorden: lood, biobeschikbaarheid, bioaccessibility, bodem, in vitro digestie, in vivo, validatie
Abstract
Oral bioavailability of lead from Dutch made grounds
The soils of historical inner cities in the Netherlands (made grounds) are often contaminated with lead as result of their formation by dumped trash and debris from industrial activities in the past. Children are particularly susceptible to the adverse effects of lead ingestion; a high exposure to lead can affect brain development. Several in vitro laboratory models exist which can estimate the amount of lead released from the soil and able to enter a child’s blood (bioavailability). The RIVM has examined the predictability of three of these models. All models have their strengths and limitations, but the so-called Unified BARGE model appears to be the best applicable model for estimating the
bioavailability of lead in made grounds.
The bioavailibility of lead in six soils was estimated using the three models and the results were compared with the results of a bioavailability study conducted on juvenile swine. The behavior of lead in the gastrointestinal tract of swine was comparable to that in children. Both the Unified BARGE model and the Tiny-TIM model show the same pattern as the results of the animal experiments.
However, the Tiny-TIM values underestimate the true bioavailability. The IVD model is only suitable after a correction for calcium content of the soil. An alternative, relatively simple method is to estimate the bioavailable lead in a soil using an extraction with diluted nitric acid. This method can be used as a
screening method to estimate the bioavailability of lead in the soil.
From the results of the swine study, a standard value can be derived for the bioavailability of lead in made grounds. Policy makers can use this value as a benchmark to determine which fraction of the lead is bioavailable for uptake in the human body. Consequently, by combining the total lead content in the soil and the standard value, it can be determined whether there is a health risk and whether measures should be taken. The use of this standard value renders experiments with laboratory models redundant, thus saving time and money. The outcome of this study indicates that more lead is bioavailable than
previously assumed. This may be a reason to re-evaluate the criteria for lead in soils.
Key words: lead, bioavailability, bioaccessibility, soil, in vitro digestion, in vivo, validation
Contents
Summary – 9
List of abbreviations – 11
1
Introduction – 13
2
Soil samples – 19
2.1
Characteristics soil samples – 19
2.2
Lead concentrations soil – 19
3
Pilot study - materials and methods – 21
3.1
In vitro digestion (IVD) model – 21
3.1.1
First pilot experiment – 21
3.1.2
Second IVD pilot experiment – 23
3.2
In vitro Tiny-TIM system – 23
3.2.1
Tiny-TIM pilot experiment – 24
3.3
In vivo pilot experiment – 25
3.4
Extraction and analysis of lead in chyme, dialysate, blood and tissue – 26
4
Pilot study - results – 27
4.1
IVD model – 27
4.1.1
First pilot experiment – 27 4.1.2
Second pilot experiment – 28
4.2
Tiny-TIM model – 29
4.3
In vivo study – 30
5
Validation study – materials and methods – 33
5.1
In vitro digestion (IVD) model – 33
5.2
Tiny-TIM model – 33
5.3
Unified BARGE Method – 33
5.4
In vivo study – 33
5.5
Relative bioaccessibility – 35
6
Validation study – results – 37
6.1
IVD model – 37
6.2
Tiny-TIM model – 37
6.2.1
Analyses of centrifuged residues for comparison with IVD – 38
6.3
Unified BARGE method – 39
6.4
In vivo validation – 39
6.5
In vitro versus in vivo – 41
6.6
Correlation of in vivo RBAs with soil extracts (diluted HNO3) – 42
7
Influence of soil characteristics and lead speciation on RBA – 45
7.1
Introduction – 45
7.2
Correlating soil characteristics with relative bioavailability – 45 7.2.1
Regression analysis on soil characteristics – 46
7.2.2
Multiple regression analysis – 46
7.3
Correlating soil and anthropogenic lead characteristics with relative bioavailability – 50
7.3.1
Introduction – 50
7.3.3
PPS-ranking – 53
8
Discussion – 55
8.1
In vitro models – 55
8.1.1
IVD model – 55 8.1.2
Tiny-TIM – 56
8.1.3
Differences between IVD and Tiny-TIM explained – 56 8.1.4
UBM compared with the other two in vitro models – 57
8.1.5
Measured bioaccessibilities compared with previous studies – 58
8.2
In vivo study – 59
8.2.1
Effect of amount of soil – 59 8.2.2
In vivo-in vitro correlations – 59 8.2.3
Bioavailability of lead acetate – 61
8.3
Implication for risk assessment of lead in made grounds for children – 61 8.3.1
Bioavailability of lead from made grounds to children – 61
8.3.2
Best applicable in vitro model – 63 8.3.3
Use of PPS-ranking – 64
8.3.4
Derivation of Rel F – 65
8.4
Variability and uncertainty – 66
9
Conclusions and recommendations – 67
9.1
Conclusions – 67
9.2
Recommendations for research – 67
10
References – 69
Appendix 1 In vitro digestion model under semi-fed conditions – 74
Appendix 2 Extraction of lead from in vivo samples – 76
Appendix 3 RBA and RBAc based on XRF analyses – 77
Appendix 4 Plots of single linear regression analyses – 80
Appendix 5 Plots of multiple regression analyses – 85
Appendix 6 Influence of lead characteristics on RBA – 86
Appendix 7 SEM photos – 90
Summary
Children in historical inner cities may be exposed to lead because the soil in these areas, called ‘made grounds’, holds lead-containing waste products and building rubble associated with centuries of urban development and industrial activities. In 2009, the bioaccessibility of lead in Dutch made grounds was measured with two in vitro digestion models potentially suitable for human risk assessment. These models generated very different results (factor 5 difference). The aim of the present study was to validate three in vitro digestion models with respect to the bioavailability of lead from Dutch made grounds. The
bioavailability of lead from six made ground samples was measured in an in vivo juvenile swine study (model for toddlers). Homogenized soil samples for six contaminated sites were sieved at 2 mm. The total amount of lead was determined with X-ray fluorescence and extraction was carried out with aqua
regia. Additionally, an extraction with 0.43 M HNO3 was conducted representing
the potentially available fraction. Soil was added to a small portion of moist pig feed and fed to groups of six juvenile male pigs once a day for one week. The lead exposure period was followed by an elimination phase (no lead exposure) of one week. Blood samples were collected (almost) daily during the exposure and elimination phase in order to measure lead concentration. After sacrifice, livers were extracted and analysed for lead. The in vivo results were compared to the bioaccessibility values of the same soils measured in the three in vitro digestion models.
The in vitro digestion models tested were the dynamic Tiny-TIM model (n=2), and the static models IVD (In Vitro Digestion model; n=4) and UBM (Unified Barge Method; n=3). For the latter method, the lead bioaccessibility was measured after the gastric phase (referred to as UBMgastric) as well as after the intestinal phase (referred to as UBM). In order to compare the different models, in addition to lead from soils, the bioavailability and bioaccessibility of a
reference substance (lead acetate) was measured.
Due to a low bioavailability of lead acetate in the in vivo validation study, the relative bioavailabilities (RBA, i.e. the bioavailability of lead in soil divided by the bioavailability of lead acetate) for the blood data were calculated using the bioavailability for lead acetate determined in the pilot study (13%). The absolute bioavailability of lead for children, as determined in the in vivo study, ranged from 22%- 45% for the six soils sampled in this study. The results of Tiny-TIM and UBM correlated well with the RBAblood data, but those of Tiny-TIM
underestimated the bioavailability. The bioaccessibilities determined with IVD and UBMgastric showed a low correlation with the in vivo data. A multiple regression analysis showed that when the calcite fraction of the soil was taken into account, the IVD could predict the RBAblood well. However, a scientific rationale for a calcite correction is limited and the analysis was based on six soils only. Thus, application of a correction factor was not considered appropriate. At present, the UBM model is the best applicable model, although it is a fasted model not mimicking a semi-fed child and has a high solid: liquid ratio of 1:100, which is known to decrease the lead bioaccessibility. If this type of model is desirable, further model adaptations and validations are required.
The lead extractions with 0.43 M HNO3 correlated well with the relative bioavailability measured in swine. Since these are simple and inexpensive extractions, this method is recommended as a screening method in location-specific estimates of the bioavailability of lead in made grounds. Since this method is not physiologically based and only six soils were tested, additional validation is needed to ensure that extraction with diluted nitric acid does simulate bioavailability of lead from soils, before it can be used as a reliable method rather than for screening purposes only.
Because of the small spread in physicochemical characteristics as well as in the bioavailabilities of the made grounds as measured in the in vivo experiment, it is appropriate to apply a generic bioavailability correction factor in human risk assessment of lead in made grounds from (historical) inner cities. Nevertheless, the results indicate that the lead from some of the Dutch made grounds may be as bioavailable as lead from food. From the data generated in this study, it can be concluded that the value of Rel F of 0.4, currently used as generic value, is too low from a scientific point of view. An increase of the Rel F to 0.58 (P50)-0.84 (P80) is recommended, depending on the level of conservatism desired by the risk manager. This range corresponds with the Rel F determined for 90 soils in the previous study, which equaled 0.67 (P50) – 0.91 (P80). Due to the small variation in the RBAs of the studied made grounds, the role of location-specific determination of bioaccessibility of lead in made grounds is expected to be small.
List of abbreviations
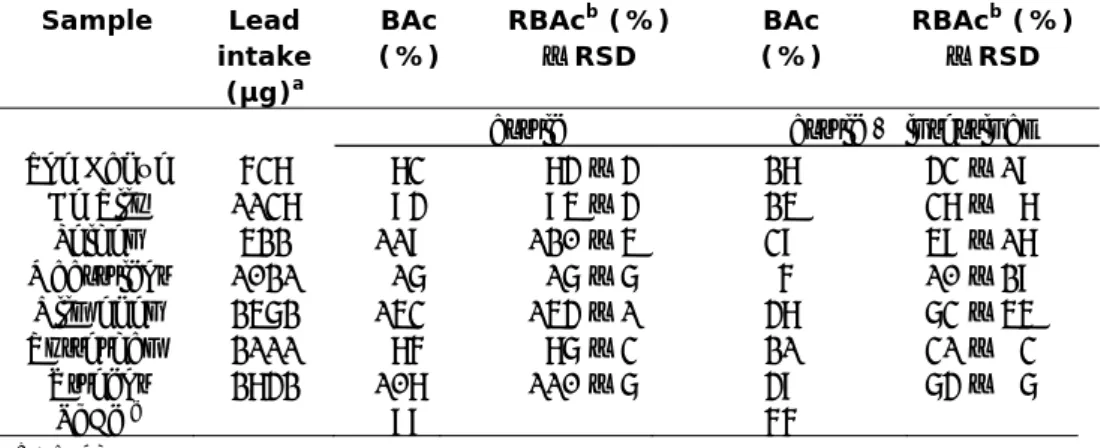
ABA absolute bioavailability AUC area under the curve BA bioavailability BAc bioaccessibility
BARGE Bioaccessibility Research Group Europe
ICP-MS inductively coupled plasma mass spectrometry IVD in vitro digestion
Pb lead
PbAc lead acetate
RBA relative bioavailability (relative to PbAc) RBAc relative bioaccessibility (relative to PbAc) RSD Relative standard deviation
TIM TNO in vitro model
UBM Unified BARGE model XRF X-ray fluorescence
1
Introduction
Dutch made grounds
The soil in the historical inner (city) areas of many Dutch cities and villages is often polluted with lead (Pb). This lead originates from various sources,
including the accumulation of lead-containing waste products and building rubble associated with centuries of urban development and industrial activities. This has resulted in a layer referred to as (man) made ground. This lead mainly originates from white lead (lead carbonate) factories, coal combustion waste, and construction waste. The lead concentrations in soil reach levels high enough to cause a potential health risk for humans. Especially children may be exposed to too high amounts of lead by ingesting lead-containing soil after hand-to-mouth contact. In addition, lead is better absorbed in children than in adults. This notion originates from a number of studies which suggest that lead is absorbed by the same mechanism as calcium (Diamond et al., 1998). Calcium is better absorbed in children than in adults as their growth requires more calcium (Clarkson, 1993; Fullmer, 1992) The main target for lead toxicity is the nervous system (reviewed by Bellinger (2004), Koller et al. (2004), Lidsky et al. (2003) and Needleman (2004)), resulting in a reduced IQ. At high levels of exposure, lead can severely damage the brain and kidneys (Boreiko and Battersby, 2008). In recent years, international and European health-based guidance values for lead exposure have been amended several times. In 2010, the European Food Safety Authority’s (EFSA) Panel on Contaminants in the Food Chain concluded that the provisional tolerable weekly intake (PTWI) of 25 µg/kg b.w. was no longer appropriate (EFSA, 2010). The Panel decided that, as there was no evidence for a threshold for a number of critical endpoints including developmental neurotoxicity and adult nephrotoxicity, it would not be
appropriate to derive a PTWI. This conclusion was confirmed by JECFA in 2010 and the PTWI was withdrawn (FAO/WHO, 2011). Using an alternative measure, the 2010 EFSA opinion identified a 95th percentile lower confidence limit of the benchmark dose of 1% extra risk (BMDL01) of 0.50 µg/kg b.w. per day for developmental neurotoxicity in young children.
In light of the particular concern regarding lead exposure in children, it is important to improve estimates of the bioavailability of lead in Dutch made grounds.
Bioaccessibility versus bioavailability
Oral bioavailability (F) can be divided into three different major processes (equation 1; Oomen et al., 2006):
B A H
F F
F
F
[1]After ingestion of soil, the total bioavailability (F) depends on the amount of contaminant released from the matrix (i.e. soil) during digestion in the gastrointestinal tract into the intestinal fluids. This is referred to as
fraction is transported across the intestinal epithelium and reaches the portal vein (absorbed fraction; FA). Metabolism of the contaminant may occur in the intestinal epithelium and/or in the liver. The fraction that is not metabolized (FH) passes the liver via the portal vein to the systemic circulation and is transported throughout the body, and represents the bioavailable fraction (F). Note that lead is not metabolized, resulting in a FH fraction of 1.
The in vitro models simulate the release of substances from their matrix during digestion, and can be applied to estimate the bioaccessibility (FB) of lead from soil. Two in vitro digestion models are currently in use in the Netherlands: The In Vitro Digestion (IVD) model and the Tiny TNO In Vitro Model (Tiny-TIM). A third model, the Unified BARGE method (UBM), is the digestion model used by the Bioaccessibility Research Group Europe (BARGE) and has many similarities with the IVD model.
Note that in animal models, the bioavailability (F) of a substance is investigated.
Current practice
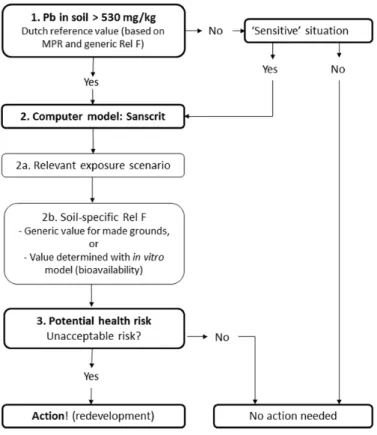
The current practice of risk assessment of lead in soils is illustrated in Figure 1. The Dutch Intervention Value for lead in standard soil is 530 mg/kg. This standard relates to a maximum permissible risk (MPR) value of 3.6 µg/kg bw/day, which is based on epidemiological and toxicological studies (Baars et al., 2001)1. The studies which determined the MPR value were based on lead
intake in children via food. However, the bioavailability of lead from food is often higher than the bioavailability of lead from ingested soil. Therefore, for human risk assessment of lead from soil, the reference value is corrected with the relative bioavailability correction factor (Rel F). By default, a generic value of 0.74 that applies to all grounds is used for the Rel F. This value is based on the relative bioavailability of lead in soils as determined in the In Vitro Digestion (IVD) model (Hagens et al. 2008).
When the lead concentration in soil exceeds the Intervention Value, further risk assessment is performed using the computer programme Sanscrit
(www.sanscrit.nl). If the reference value is not exceeded, no further action is required unless there is a specific ‘sensitive’ situation, such as a vegetable garden. Sanscrit is a decision-support tool that can be used to determine if there is an unacceptable risk of soil pollution for humans and for the environment. Based on the outcome, it can be determined whether further action, such as remediation or redevelopment, is required to ensure safety. Two main aspects of the tool can be distinguished. First, the relevant human exposure scenario can be determined. Secondly, further soil-specific evaluation can be performed by adjusting the value for Rel F. For made grounds, a Rel F of 0.4 is currently used in soil policy (Circulaire bodemsanering, 2013). A site-specific Rel F can also be calculated by determining the bioavailability of lead from the soil in in vitro digestion models.
Based on the adjusted Rel F in the Sanscrit calculations, it can be determined if there is a potential health risk and if further action is required.
Figure 1 Current practice of risk assessment of lead
Aim and method of present study
This report describes the validation study as recommended in the workshop. The aim of the study is to select the in vitro model that, for children, gives the best prediction of the bioavailability of lead in made grounds. The selected model can be applied in the site-specific risk assessment of lead in Dutch made grounds as explained above (Staatscourant, 2012). Additionally, if the results from the in
vivo experiment allow, a generic bioavailability factor (Rel F) for lead in Dutch
made grounds will be deducted.
The in vivo study was performed in juvenile swine, which provide a good model for the gastrointestinal system of a human child (US EPA, 2007). Weis et al. (1991) and Casteel et al. (1996) determined that gastric function in juvenile swine is sufficiently similar to that of human children for juvenile swine to serve as a model for predicting RBA of soil-borne lead in children. This view is
supported by several reviews on the comparative anatomy and physiology of the human and pig gastrointestinal systems (Dodds, 1982; Miller et al., 1987; Moughan et al., 1992). The swine were fed a small amount of food containing soil from made grounds. The same made ground samples were studied in the three in vitro models (IVD, Tiny-TIM and UBM). In addition, the samples were extracted with 0.43 M HNO3, as this is a method used in ecological studies to
extract the potential bioavailable fraction. HNO3 extractionsof soil can be used to predict the concentration of free (unbound) metals in the soil, which is related to the bioaccessibility of the metals in the soil (Dijkstra et al., 2009;
Groenenberg et al., 2010). This is in contrast with aqua regia which also extracts non-bioavailable parts of the metals from the soil.
Previous study
In 2009, the bioaccessibility of lead in 90 Dutch made grounds was determined with the IVD model (Hagens et al., 2009). Sixteen of these samples were also investigated with the Tiny-TIM model. The results of the two in vitro models appeared to be very different: the bioaccessibility of lead determined with the Tiny-TIM model was, on average, a factor five lower than that of the IVD model. In an international workshop in 2009 organized by TNO and RIVM, it was concluded that the different results of the two methods were mainly caused by the pH of the gastric phase and the different separation techniques (ultra-filtration vs. centrifugation) (Bakker, 2009). Another conclusion was that an in
vivo validation study, preferably using young swine, would be required for a
responsible justification of the application of the in vitro models for risk
assessment of lead in soils. The model showing the highest correlation with the
in vivo data (for a large bioavailability range) will be considered the best model
to predict the bioavailability of lead in made grounds for young children (Bakker, 2009). In addition, the selected model should be: 1) simple (feasible to operate in routine application at more than one location), 2) responsive to different lead and soil characteristics, and 3) accompanied by rigorous Quality
Assurance/Quality Control data requirements (e.g. with regard to recoveries, blanks, reproducibility) (Bakker, 2009).
Use of reference substance
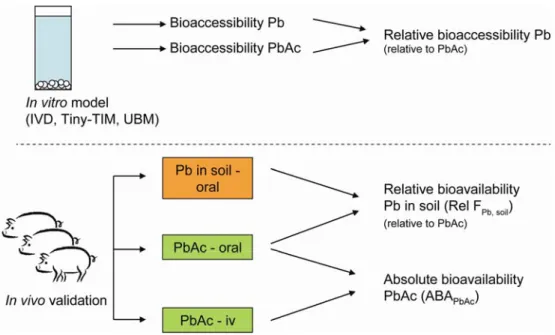
To compare the bioaccessibility (or bioavailability in case of in vivo models) measured with different models, the bioaccessibility of lead in soil samples was determined relative to the bioaccessibility of a soluble reference material. The reference substance used in this study was lead acetate, a readily soluble lead salt of which the bioaccessibility and bioavailability was studied both in vitro and
in vivo, with the same method and at the same time as was done with the soil
samples (see Figure 2). Using the relative bioaccessibility (or bioavailability) of lead from soil is the common way to compare in vitro with in vivo models (Denys et al., 2012; US EPA, 2007) and this was also done in the present study.
In addition, the oral bioavailability of lead acetate was determined from the ratio between the bioavailability of orally dosed and intravenously dosed lead acetate. Oral lead acetate was not dosed via drinking water, but via a small portion of feed, which could reduce the bioavailability. Currently, the bioavailability of lead acetate from drinking water is used as standard bioavailability in risk
Figure 2 Overview of experimental studies and derivation of relative bioaccessibility and absolute and relative bioavailability. To compare the
different models the relative bioavailability is used. For the determination of the absolute bioavailability lead acetate was also dosed intravenously. Pb: lead, PbAc: lead acetate, iv: intravenous, ABA: absolute bioavailability.
2
Soil samples
2.1 Characteristics soil samples
Soil with different characteristics and lead contamination was sampled from seven locations in the Netherlands (Table 1) based on a previous study by Hagens et al. (2009). All samples were dried (40°C) and sieved; only particles smaller than 2 mm were used. This fraction is based on Dutch legislation where maximum tolerable levels are expressed as concentrations of lead in the soil of < 2 mm (Dutch standard NEN5709:2006; Sample preparation for the
determination of organic and inorganic parameters in soil). In many other countries (e.g. UK, France, USA) particle fractions of < 250 µm are generally used, as U.S. EPA considers particles < 250 μm to be the most likely to adhere to hands and be ingested by children (US EPA, 2000; US EPA, 2007).
Soil samples were characterized for dry matter, organic matter, clay and pH according to AS3010 (AlControl, the Netherlands). Calcite (carbonate content) was determined according to methods by AlControl (Rotterdam, the
Netherlands). The characteristics are presented in Table 1. The lead source, the primary and secondary lead phases, and the chemical composition and size of the lead phases in the samples were previously determined by Hagens et al. (2009). These analyses were performed in other samples that originated from the same made ground sample locations. For this reason, they will be regarded as providing an indication for the current samples.
Table 1. Soil characteristics of the sampled Dutch made grounds.
Location Original soil type Dry matter (DM) Calcite Organic matter Clay pH (CaCl2) % weight % CaCO3 % DM % DM
The Hague* Dune sand 99.2 1.5 3.1 1.4 6.7
De Rijp Marine sand / clay 93.1 0.6 7.4 11 6.7
Leiden Fluviatile sand / clay 99.0 1.5 4 3.2 6.9
Maastricht Loess 98.4 10.0 6.5 4.8 6.9
Nijmegen Aeolian sands 99.2 13.0 2.8 1.8 7.1
Rotterdam Marine sand / clay 97.2 1.7 9.5 13 6.8
Utrecht Fluviatile sand / clay 98.8 2.6 4.8 5.5 6.5
* This soil was only used in the in vitro models, not in the in vivo study.
2.2 Lead concentrations soil
The amount of lead in the soil samples was determined using three methods: X-ray fluorescence (XRF) conducted by the British Geological Survey
(BGS) according to BS EN ISO17025. Summarized, the samples were milled to produce a fine powder and further pressed into pellets. The concentration of Pb was determined by analysis of pressed powder pellets using a PANalytical Axios maX WD-XRFS fitted with automatic sample changer. The spectrometer was fitted with a 60 kV generator
and 4 kW rhodium end–window X-ray tube. The instrument was calibrated using a set of synthetic standards (Pro-Trace).
Inductively coupled plasma mass spectrometry (ICP-MS) with aqua regia extraction. The total lead concentration was detected by a method based on the microwave-assisted destruction of the soil according to NEN 6961 using a 1:3 dilution of aqua regia with distilled water. Following the destruction, the soluble lead in the acidic mixture was detected with ICP-MS according to NEN-ISO 17294-2. The extraction and analysis were conducted at TNO Utrecht.
ICP-MS with HNO3 extraction. The total lead concentration was detected based on NEN 6961 using 0.43 M HNO3 solution. Following the
destruction, the soluble lead in the acidic mixture was detected with ICP-MS according to NEN-ISO 17294-2. The extraction and analysis were conducted at TNO Utrecht.
In the Netherlands, the total lead concentration in soil is commonly determined by extraction with aqua regia. The milder extraction with 0.43 M HNO3 was performed to investigate whether this method could predict the bioaccessibility of the metals in the soil. Validation of the aqua regia extraction was performed using X-ray fluorescence (XRF) analysis. Aqua regia cannot liberate the lead that is very tightly bound to soil particles, and the efficacy of the extraction is
dependent on the duration and temperature used, whereas XRF detects all lead present in a soil sample.
The results of each method are presented in Table 2, and show that for most samples the lowest lead concentration was, as expected, for the method using 0.43 M HNO3 and the highest for XRF. Note that the results for these methods were obtained from different subsamples from a sampled soil and that there might have been differences due to inhomogeneity of the soils. This appears to be the case for the sample locations Nijmegen and Utrecht. Lead concentrations from these two locations are highly variable and in addition, they are higher in the HNO3 extracts than in the aqua regia extracts, which cannot occur when testing the same, homogeneous subsample.
Table 2. Lead concentrations (mg/kg) ± SD in the test soils, based on three methods (n = 3)
Location Lead concentration (mg/kg)
Aqua regia 0.43 M HNO3 XRF
The Hague* 604, 673a 526 ± 58 662 ± 112 De Rijp 1138 ± 104 975 ± 55 1370 ± 232 Leiden 522 ± 28 468 ± 33 706 ± 119 Maastricht 1021 ± 169 593 ± 29 991 ± 167 Nijmegen 2572 ± 76 3014 ± 578 4285 ± 724 Rotterdam 2111 ± 68 1887 ± 78 2317 ± 392 Utrecht 2842 ± 399 3573 ± 865 3567 ± 603
* This soil was only used in the in vitro models, not in the in vivo study a n=2
3
Pilot study - materials and methods
3.1 In vitro digestion (IVD) model
3.1.1 First pilot experiment
The main aim of the first pilot experiment was to investigate the reproducibility of the bioaccessibility using different amounts of soil in the IVD model. A second aim was to identify the influence of the separation method on the bioaccessibility of lead by testing two separation techniques, i.e. centrifugation and
ultrafiltration.
The IVD model is a static gastrointestinal model. The model was developed by RIVM based on the model of Rotard et al. (1995) and is currently operated by RIKILT (Wageningen UR). The model simulates the bioaccessibility of a substance (FB), which is the amount of a substance that can be maximally absorbed. Digestive juices are prepared artificially and the composition is based on human physiology. The digestive juices are added to a soil sample according to physiological transit times and are mixed thoroughly. The rationale for choosing the number of simulated compartments of the gastrointestinal tract, temperature, soil-to-fluid ratio, ratio of digestive juices, transit times,
centrifugation, pH values, mixing, constituents and their concentrations, and bile, are addressed in Oomen et al. (2003). The initially developed in vitro digestion model simulates fasted conditions of the human gastrointestinal tract; in follow-up experiments the model was developed for simulation of fed
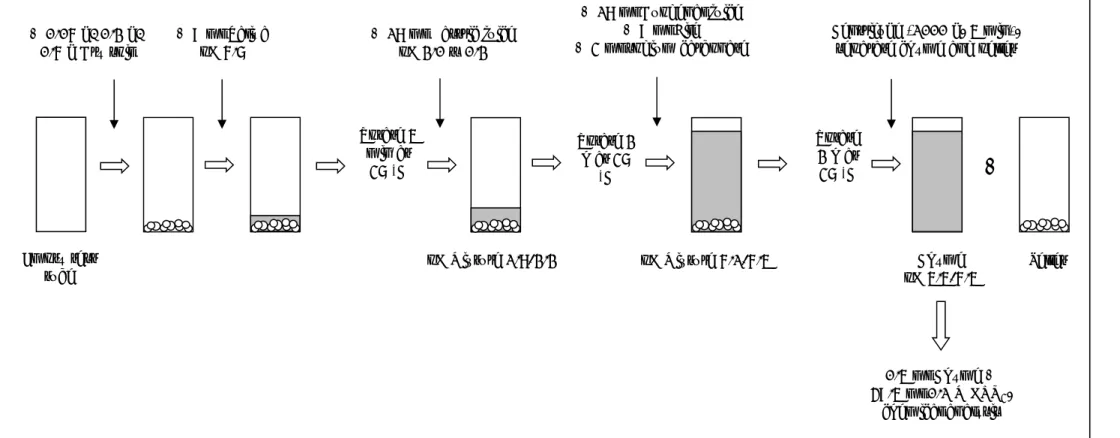
conditions of the human gastrointestinal tract (Versantvoort, 2004; Versantvoort et al., 2005). Since children are mostly in a semi-fed state, in the present study a semi-fed model was used (Figure 3), which has a pH and concentrations of constituents with values in between the fasted and the fed model.
Figure 3 Schematic representation of the in vitro digestion (IVD) model simulating semi-fasted conditions + 9 ml Saliva pH 6.7 + 18 ml Gastric juice pH 2.0 ± 0.2 Rotate 5 min at 37 C Rotate 2 h at 37 C + 18 ml Duodenal juice + 9 ml Bile + 3 ml sodium carbonate Rotate 2 h at 37 C Centrifuge (1000 g, 5 min), separate chyme and pellet
Chyme pH 5.5-6.5 0.5 ml Chyme + 49.5 ml 0.1 M HNO3, chemical analysis Pellet pH Mixture 1.8-2.2 pH Mixture 6.1-6.5
+
+ 0.06 g/ 0.2 g/ 0.6 g Dry soil Empty test tubeDifferent amounts of soil were tested with the semi-fed model (for details see Appendix 1) with or without adding food and using different solid-to-fluid ratios:
0.06 g soil, standard model (ratio 1:1000) 0.6 g soil, standard model (ratio 1:100) 0.2 g soil, standard model (ratio 1:300) 0.2 g soil, up-scaled model (ratio 1:1000)
Although the use of 0.06 g soil in the standard model has the preferred solid-to-fluid ratio, it is a very small amount and it may be questioned if this is sufficient for obtaining a reproducible bioaccessibility value, due to inhomogeneity of the soil sample. For this reason, various amounts of soil and upscaling of the used volumes were investigated to determine the optimal conditions for further testing. In addition, the effect of the separation technique on the bioaccessibility of lead was investigated. In addition to centrifugation as a method to separate the chyme from the solid residues, ultrafiltration (10 kDa filter column) was also tested.
As the soils for the current validation study in swine had not yet been sampled at the start of the first IVD pilot experiment, samples from the previous study from the location Leiden (#29) were used (Hagens et al., 2009).
3.1.2 Second IVD pilot experiment
In a second IVD pilot experiment, it was tested whether:
1) separation of the chyme by microfiltration is suitable for determination of the bioaccessibility,
2) the solid-to-fluid ratio at 0.2 g should be 1:300 or 1:1000, to further determine the influence of the volumes on the bioaccessibility and,
3) which amount of lead acetate is most suitable for further use as a reference compound in the in vivo study.
Three experimental conditions were tested:
Standard model (soil-to-fluid ratio 1:300), separation by centrifugation Standard model (soil-to-fluid ratio 1:300), separation by microfiltration Upscaled model (soil-to-fluid ratio 1:1000), separation by centrifugation The standard and upscaled model (both with 0.2 g) were carried out as
described in Appendix 1. The chyme was separated from the fraction that is too large to be absorbed in the intestine either by centrifugation for 5 min at 2900 g or by filtration using a 0.45 µm cellulose acetate disk filter. The chyme samples were diluted with 0.1 M HNO3 in a ratio of 1:100 and stored at ≤-20°C until analysis with ICP-MS.
3.2 In vitro Tiny-TIM system
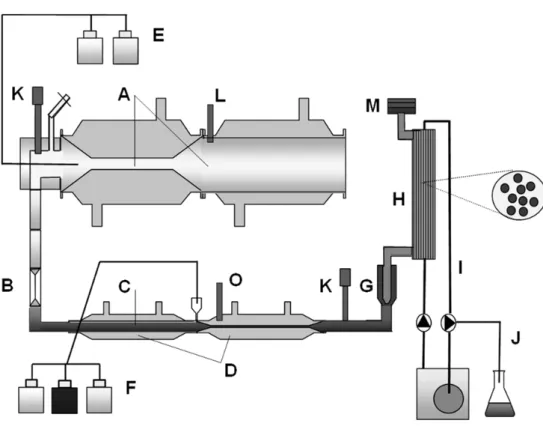
TIM (TNO gastro-Intestinal Model) is a dynamic in vitro model simulating the gradual transit of a meal through the gastrointestinal tract including emptying curves, pH profiles and secretion of the different digestion fluids (Minekus et al., 1995) (Figure 4). A simplified TIM system called Tiny-TIM was previously validated for the determination of protein digestion and bioaccessibility of amino acids (protein quality) in foods and digestion of carbohydrates (Schaafsma, 2005; Havenaar et al., 2013) and also used to determine bioaccessibility of lead from soil (Hagens et al., 2009). The Tiny-TIM model was also used in the current study, however, no food was added during any of the experiments.
The Tiny-TIM system was used as described by Hagens et al. (2009), with some modifications. Duplicate experiments were performed in the Tiny-TIM system, with simulation of the gastrointestinal conditions of young children between two meals. The different soils were introduced into the gastric compartment together with water and artificial saliva (total intake of 125 g). The simulated
gastrointestinal parameters were, among others: body temperature of 37°C; mixing of the gastric and intestinal contents by peristaltic movements; the pH curve in the stomach compartment in relation to the secretion of gastric acid (from pH 2.8 to 1.7 in 120 min); the kinetics of gastric emptying (halftime was 60 minutes). The gastrointestinal transit time was 6 h. After 4 h a glass of water was added to the stomach, simulating the intake of drinking water and
supporting the emptying of the soil from the stomach into the small-intestinal compartment. A semi-permeable membrane unit (cut-off of 5-7 kDa) was connected to the intestinal compartment (Figure 4) for the continuous dialysis of digested, released and dissolved small MW compounds (e.g. Pb) and water into the dialysis liquid2.
3.2.1 Tiny-TIM pilot experiment
In the pilot study, three soils were tested from the locations The Hague Rotterdam, and Nijmegen (n=2) and a negative control (water) in portions of 0.5 and 5 g.
The dialysis liquid was collected in a HNO3 solution (final concentration 0.1 M). Pooled samples (0-4 h and 0-6h) were frozen in duplicate at ≤ -18°C. The dialysis liquid samples were analyzed for the concentration of lead to calculate the bioaccessible amount of lead. At the end of the experiments, for all soil samples the total residues were sampled, mixed with HNO3 (final concentration 0.1 M) and stored at ≤ -18°C. The residues were analyzed for total lead (n=1) to determine the recovery of the Pb from the Tiny-TIM system.
Before addition of HNO3 to the residue, first a 50 ml fraction of the intestinal residue was centrifuged (2900 g, 5 min) and 2.5 ml of this supernatant was diluted in 2.5 ml 0.2 M HNO3 and stored at ≤ -18°C for analysis. The remainder was added to the residue again.
2 Note that the TIM systems mimic the bioaccessibility x passive absorption (FB x FA) of a substance, in contrast
to the static models used in this study, which simulate bioaccessibility (FB) only. The TIM model does not mimic active transport of compounds across the intestinal tract.
Figure 4 Schematic view of the Tiny-TIM system: A, gastric
compartment; B, pyloric sphincter; C, chyme; D, small-intestinal compartment; E, gastric secretion; F, intestinal secretion; G, pre-filter; H, semi-permeable membrane; I, dialysis liquid; J, water absorption; K; pH electrodes; L, pressure sensor; M, level sensor; O, temperature sensor.
3.3 In vivo pilot experiment
Six 5-week-old juvenile male pigs (obtained from Verbeek, Lelystad) were housed in pairs and acclimatized for one week prior to the experiment. Pigs received two meals per day (slurry with feed: water ratio of 1:2.5) from one batch in the morning (0800h) and in the afternoon (1600h). No drinking water was available between the morning and afternoon meal. Pigs had free access to tap water in the period between the afternoon and morning meal. Clinical symptoms were scored daily and body weights were measured every other day. The study was agreed upon by the institute’s ethical committee on experimental animals, in accordance to national legislation.
Animals were dosed with 0, 25, 50, 150, 300, 750 µg/kg bow/day lead acetate solution mixed in feed (standard pig feed, Abdiets) with one animal per dose group. Lead acetate was administered at 13.00h on day 1 until day 7, followed by an elimination period from day 8 until day 14. During dieting and feeding of lead acetate, the pigs were separated to prevent cross-contamination. Blood samples were collected daily from the jugular vein at 11.00h on day 1 until 14. Samples were collected in heparin-coated Vacutainer tubes and stored on ice for the maximal duration of one hour. Thereafter, blood samples were stored at -20°C until analysis. At Day 15, animals were anesthetized and subsequently euthanized by exsanguination. Macroscopic observation of the intestine was performed on all animals, and samples of the liver, kidney and femur were
collected and stored at -20°C until extraction and analysis for lead concentration.
3.4 Extraction and analysis of lead in chyme, dialysate, blood and tissue The extraction of lead from blood, soft tissues, and femur was based on
methods as described by Casteel et al. (2006), Koyashiki et al. (2010), Smith et al. (2009), Martena et al. (2010) and Perello et al. (2008); see Appendix 2 for details.
The soluble lead in the extractions from blood, liver and kidney (in vivo experiment) and the chyme, dialysate and small-intestinal residue samples (in
4
Pilot study - results
4.1 IVD model
4.1.1 First pilot experiment
Reproducibility
The bioaccessibility values for the different amount of soil in the different models and corresponding relative standard deviation (RSD) are presented in Table 3. The reproducibility of the eight 0.06 g soil samples was low, shown by the relatively high RSD. Increasing the amount of soil to 0.2 or 0.6 g soil (n=8) resulted in an increased reproducibility in the models without food, with the lowest variation observed with 0.2 g soil in the upscaled model (n=4). The effect of food addition on the bioaccessibility and reproducibility was inconclusive.
Table 3. Reproducibility of different amounts of soil in the semi-fed IVD model.
Bioaccessibility (%) without food
Bioaccessibility (%) with food
Mean RSD Mean RSD
0.06 g soil, standard model, n=8
Location De Rijp (#17) a 20 5.5 26 22
Location Leiden (#29) a 39 13 46 15
Location Montana (2710a)b 18 21 32 11
0.6 g soil, standard model, n=8
Location Leiden (#29)a 31 9.4 21 6.5
0.2 g soil, standard model, n=8
Location Leiden (#29)a 45 8.5 32 12
0.2 g soil, upscaled model, n=4
Location Leiden (#29)a 42 4.9 50 15
Lead acetate, n=2
0.05 mg 53, 58 71, 75
5 mg 73, 52 68, 77
a Soil sample from previous study (Hagens et al., 2009) b Reference soil
The bioaccessibility measured for samples from De Rijp and Leiden was comparable with the results from a previous study (Hagens et al., 2009), in which a bioaccessibility of 26% (RSD 0.3%) for location De Rijp (#17) and 42% (RSD 7.0%) for location Leiden (#29) was measured using 0.06 g soil in the fasted IVD model. The bioaccessibility measured with 0.6 g soil (with and without food) and 0.2 g soil (standard model, with food) was lower as compared with 0.06 g soil. All other test conditions resulted in comparable
bioaccessibilities. The results of the first pilot experiment show that the amount of soil clearly influences the bioaccessibility and its reproducibility and further experiments are conducted with 0.2 g soil, standard and upscaled model.
Separation techniques
The influence of the separation technique on the reproducibility was investigated for centrifugation and ultrafiltration, using 0.2 g soil from location Leiden
(standard model). Centrifugation resulted in a bioaccessibility of 45% without food and 32% with food (Table 3). The bioaccessibility after ultrafiltration was very low with only 1% bioaccessibility in conditions with and without food. Therefore, ultrafiltration was excluded from further experiments.
Bioaccessibility of lead acetate
The bioaccessibility of lead was determined by addition of 0.05 or 5 mg lead acetate, with and without food, to the semi-fed IVD model. The bioaccessibility of 0.05 and 5 mg lead acetate in a model without food was 55% and 62% respectively and in a model with food 73% for both amounts of lead acetate. These results are quite comparable to the bioaccessibilities found previously by Hagens et al. (2009), where samples with spiked lead acetate gave a
bioaccessibility of 51-53% under fasted conditions and 40-58% under fed conditions.
4.1.2 Second pilot experiment
Table 4 shows that the bioaccessibility of PbAc in the standard semi-fed IVD model with separation by centrifugation is between 8% and 30%, which is considerably lower than the historical range (52% for fasted and 40-57% for fed model, Hagens 2009) and lower than the values found in the first pilot
experiment. In addition, the relative standard deviation is large (RSD of 55%). Also, results for the Montana 2710A soil were somewhat lower than before. A possible cause for the high variation in the lead acetate samples is the
formation of precipitation containing lead, caused by freezing the samples, which was visually observed after thawing the samples. In future studies, samples will be stored at room temperature and analyzed for lead concentration within 1-2 days, which will prevent the precipitation of lead salts.
Due to the low values and the large variation, these results for PbAc were considered unreliable and were not used for further calculations of the bioaccessibility relative to PbAc.
The results of the first pilot experiment suggest that 0.2 g soil does not affect the bioaccessibility and is a suitable amount to put into the model. Nevertheless, this was only based on one soil type (Leiden sample from Hagens et al. (2009)). For this reason, in the second pilot experiment, three other soils (De Rijp, Utrecht and Leiden, from Hagens et al. (2009)) were tested in a standard and upscaled model with 0.2 g soil. These soils were selected based on their different expected bioaccessibilities (low for De Rijp, high for Utrecht and intermediate for Leiden). Although the upscaled model resulted in slightly higher bioaccessibilities than the standard model, the upscaling of digestion fluid volumes does not seem to be essential for determining a reliable bioaccessibility. For the validation study, it was decided to use the standard semi-fed model.
Separation by microfiltration resulted in very low bioaccessibilities ranging from 1.1 to 4.2%. These values are too low to give good detectable results. Moreover, such low bioaccessilibities for lead from soil are considered unlikely based on knowledge of the bioavailability of lead in humans (Maddaloni et al., 1998). This may be explained by the active transport of lead in the gastrointestinal tract of humans. Microfiltration simulates only passive transport and underestimates the
actual absorbed fraction, while centrifugation also includes lead (reversibly) bound to large complexes which can potentially be taken up. For these reasons, the use of microfiltration to separate the chyme was excluded from the follow-up study.
Table 4. Bioaccessibility of lead from soil (± RSD) determined in chyme samples obtained from the IVD model (in triplicate).
Bioaccessibilitya (%)
Sample Amount Standard modelb
- centrifugation Upscaled modelc - centrifugation Standard modelb - microfiltration 1 PbAc 0.05 mg 24 ± 26 33 ± 31 2 PbAc 0.05 mg 22 ± 5 25 ± 24 3 PbAc 0.05 mg 20 ± 16 40 ± 15 1 PbAc 0.5 mg 10 ± 55 17 ± 22 2 PbAc 0.5 mg 11 ± 41 16 ± 5 3 PbAc 0.5 mg 8.2 ± 22 16 ± 18 1 PbAc 5 mg 30 ± 10 44, 51 d 2 PbAc 5 mg 26 ± 7 34, 34 d 3 PbAc 5 mg 29 ± 18 40, 42 d 1 Montana 0.2 g 13 ± 29 - 1.8 ± 53.3 2 Montana 0.2 g 13 ± 23 - 1.4 ± 43.4 3 Montana 0.2 g 14 ± 18 - 1.1 ± 45.1 1 Utrecht 0.2 g 20 ± 5 25 ± 14 2.6 ± 24.1 2 Utrecht 0.2 g 22 ± 27 32 ± 4 4.2 ± 35.8 3 Utrecht 0.2 g 20 ± 13 32 ± 34 2.6 ± 19.8 1 De Rijp 0.2 g 15 ± 18 25 ± 11 2.8 ± 19.9 2 De Rijp 0.2 g 12 ± 17 23 ± 20 3.7 ± 56.9 3 De Rijp 0.2 g 22 ± 23 24 ± 8 2.6 ± 19.8 1 Leiden 0.2 g 25 ± 9 27 ± 17 4.1 ± 43.1 2 Leiden 0.2 g 17 ± 35 22 ± 7 2.5 ± 32.7 3 Leiden 0.2 g 19 ± 4 12 ± 22 3.2 ± 31.2
a Values represent the average of triplicates ± RSD. b Solid to fluid ratio is 1:300
c Solid to fluid ratio is 1:1000 d n=2
4.2 Tiny-TIM model
A pilot study for the Tiny-TIM system was performed to examine the possibility of using a shorter running time (4 h) than usual (6 h), and to determine the optimal amount of soil to be tested. Residues (remainder in model after 6h) were sampled to be able to determine the lead recovery from the system (performed for a limited number of runs). Furthermore, a fraction of the intestinal residue was centrifuged according to RIVM settings to enable a comparison between the IVD model and the Tiny-TIM system.
A difference between the lead concentrations measured in the 0-4 h samples and 0-6 h samples was observed. The 0-6 h samples showed a higher
bioaccessibility compared to the 0-4 h samples (data not shown). Therefore, it was decided to use a 0-6 h running time for the pilot experiment and the validation experiments.
The amount of soil added to the Tiny-TIM system influenced the lead
bioaccessibility. The experiments in which 0.5 g soil was added resulted in a 4-7 fold higher bioaccessibility (BAc) as compared to addition of 5 g soil (Table 5). To mimic a worst-case and more realistic intake of the amount of soil, it was decided to test 0.5 g soil in the validation study.
To determine the lead recovery (Table 5) from the system, the total amount of lead in the gastric plus intestinal residues and dialysate was determined, summed and compared to the total amount that was present in the amount of soil brought into the gastric compartment of the system (n=1; lead intake was based on the extractions with aqua regia).
Table 5. Bioaccessibility (BAc) of lead from soil determined in dialysate (n=2) in the pilot experiment using the Tiny-TIM system.
Sample Amount soil (g) Lead intake (µg) BAc dialysate (%) Recovery of Pb in total residue (%)a The Hague 5 3190 3.8, 3.4 52.5 The Hague 0.5 319 12.9, 17.2 55.4 Rotterdam 5 10554 2.6, 2.2 47.5 Rotterdam 0.5 1055 16.8, 15.6 74.5 Nijmegen 5 12860 3.7, 3.4 125.2 Nijmegen 0.5 1286 14.0, 25.1 291.8
a Recovery of lead from soil based on total residues + dialysate was based on a single
experiment (second run)
The high recovery found for the Nijmegen runs is most likely due to non-homogenous distribution of lead over the soil sample. This was only tested as n=1. Because recovery was not measured in the other methods, it was decided to take no further actions and to not exclude this result.
The recovery for The Hague and Rotterdam (n=1) is below 90-100%, indicating that either not all soil can be sampled out of the system, or not all lead can be measured (despite the used destruction method for the residue samples). It indicates that thorough cleaning of the model after each run is necessary. 4.3 In vivo study
No clinical signs were observed in any of the dose groups. Body weight gain was comparable between the different dose groups. Figure 5 shows the lead
concentrations in blood over time as determined with ICP-MS. At a dose level of 150 µg/kg bw/day, the measured concentrations clearly exceeded the control levels. During the exposure phase of the upper three dose levels, lead
concentration in blood gradually increased. Blood lead concentration decreased during the elimination phase.
Figure 5 Lead concentrations in blood of pigs (n=1 per dose) orally treated with lead acetate.
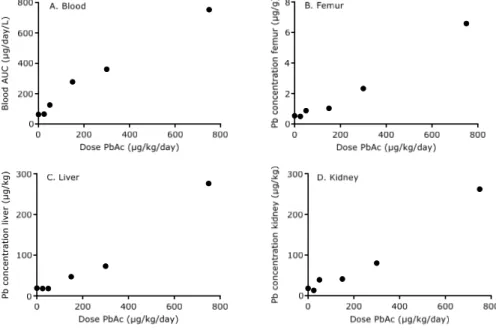
Clear dose response patterns were observed for blood, femur, liver and kidney (Figure 6). Lead concentrations in pig feed were below the limit of detection.
Figure 6 Dose response curves of lead in blood (A), femur (B), liver (C)
and kidney (D) from swine (n=1 per dose) administered with lead acetate.
The validation study will be performed with 150 µg/kg bw/day lead acetate as a reference. This concentration results in a detectable level of lead in the blood and tissues, above the control level, and it is sufficiently low to prevent
saturation by binding to blood (Casteel et al., 2006). Lead concentrations will be determined in blood and liver.
5
Validation study – materials and methods
5.1 In vitro digestion (IVD) model
For the validation study, the standard model (soil-to-fluid ratio 1:300) with separation by centrifugation was used, based on the results of the pilot study. The seven soil samples and the Montana 2710A soil (n=4) were studied. PbAc (n=4) was included in two doses: 0.1 and 0.5 mg. The study was performed with 0.2 g soil under semi-fed conditions (without adding food) as described in section 3.1. The samples were collected in 0.1 M HNO3 in a 1:100 dilution, except for the blank samples and PbAc 0.1 g samples that were diluted at a 1:10 ratio. The chyme samples were stored at room temperature and were analysed with ICP-MS within one day after isolation.
5.2 Tiny-TIM model
The Tiny-TIM system was used as described above in sections 3.2 and 4.2. Soil samples from Leiden, Maastricht, De Rijp and Utrecht (0.5 g) were used, tested in duplicate (the other soils had been tested in the pilot experiment). The dialysate was collected after a 6 h digestion time. PbAc (1 ml containing 1 mg/ml Pb; pH 4.5) was included as a reference.
In addition, from all soil runs and for the PbAc reference the total residues were sampled, mixed with HNO3 (final concentration 0.1 M) and stored at ≤-18°C. Only the residues (n=2) of the PbAc runs were analyzed for total lead to determine the recovery of Pb from the Tiny-TIM system. Furthermore, to compare the bioaccessibility measured in Tiny-TIM and IVD a fraction of the intestinal residue of the Tiny-TIM model was centrifuged in the same manner as the IVD samples. The Pb in the supernatant was measured and added to the Pb amount present in the dialysate of Tiny-TIM, to obtain a value ‘corresponding’ to the bioaccessibility value of the IVD model.
5.3 Unified BARGE Method
The Unified BARGE Method (UBM) is based on the IVD model, with a few adaptations. See for the compositions of digestive solutions Wragg et al. (2011) and for a detailed description of the method the supplementary information in Denys et al. (2012). In short: The temperature was maintained at 37°C throughout the procedure. Nine mL of saliva was added to 0.6 g of soil and the suspension was shaken by hand for 10 seconds. Then, 13.5 mL of gastric solution was added to the soil suspension and the pH of the solution was measured and adjusted to 1.20 ± 0.05 by the addition of HCl (37%) or NaOH (1.0M). After an initial 1 h incubation time, samples were taken and analyzed to obtain the bioaccessibility of lead in the gastric phase. To simulate the intestinal phase, 9 mL of bile and 27 mL of duodenal fluids were added and the pH was adjusted to 6.3 ± 0.5. The suspension was mixed end-over-end for a further 4 hours at 37ºC. The gastrointestinal phase was then removed for analysis by careful pipetting after centrifuging the suspension at 4500 g for 15 minutes and acidification by the addition of 1.0 mL HNO3 (67%). The experiments were carried out in triplicate.
5.4 In vivo study
Juvenile male pigs (6 per dose group) were dosed with 0.4 or 1 g soil per kg body weight to achieve a blood concentration that corresponds to the intake of
approximately 150 µg lead/kg bw/day. Soil samples from Utrecht were divided into two dose levels with three animals per dose group (Table 7). Animals were dosed at day 1 until day 7 by mixing the soil with feed, followed by an
elimination period from day 8 until day 14. Blood samples were collected from the jugular vein at day 1, 2, 4, 5, 7, 8, 9, 11, 12 and 14. Samples were collected two hours before dosing in heparin-coated Vacutainer tubes and stored on ice for the maximal duration of one hour. Thereafter, blood samples were stored at -20°C until analysis. At day 15, all animals were anesthetized and
subsequently euthanized by exsanguination. Macroscopic observation was performed on all animals and samples of the liver were collected and stored at -20°C until analysis.
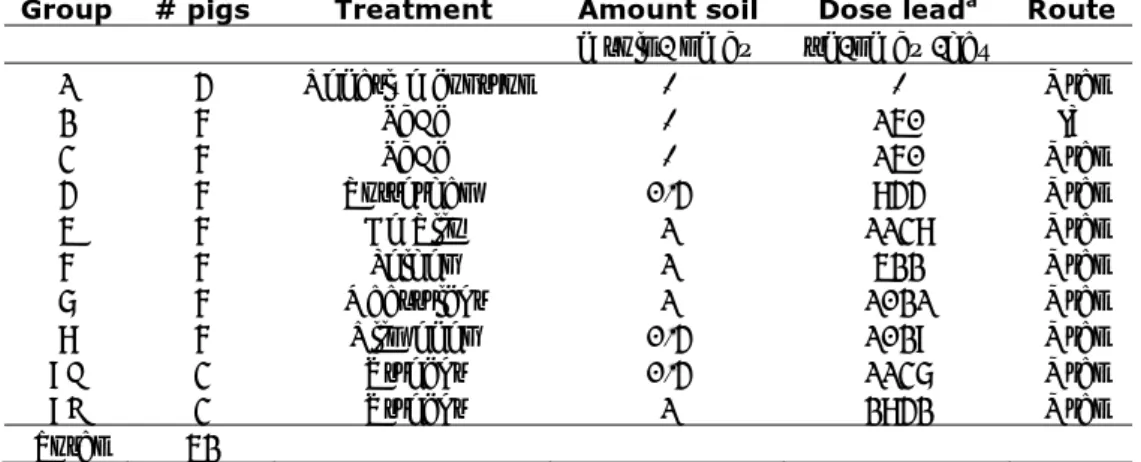
Table 7. Treatment groups for in vivo validation study.
Group # pigs Treatment Amount soil Dose leada Route
g soil / kg bw µg/kg bw/day
1 4 Negative control - - Oral
2 6 PbAc - 150 IV 3 6 PbAc - 150 Oral 4 6 Rotterdam 0.4 844 Oral 5 6 De Rijp 1 1138 Oral 6 6 Leiden 1 522 Oral 7 6 Maastricht 1 1021 Oral 8 6 Nijmegen 0.4 1029 Oral 9A 3 Utrecht 0.4 1137 Oral 9B 3 Utrecht 1 2842 Oral Total 52
a Calculated based on the total lead concentration in soil as determined by extraction with
5.5 Relative bioaccessibility
For comparison of the bioaccessibilities measured in the different models, the results are expressed as the relative bioaccessibility or relative bioavailability, i.e. relative to that of the reference compound lead acetate.
The relative bioaccessibility (RBAc, in vitro) for the IVD model (chyme), Tiny-TIM model (dialysate) and UBM (chyme) was calculated by the ratio of the bioaccessibility of lead from soil and the bioaccessibility of PbAc, corrected for the lead dose, according to equation 2 and 3:
[2]
[3]
The relative bioavailability (RBA, in vivo) of lead from soil determined in blood and liver are calculated according to equation 4 and 5 respectively:
[4]
[5] Where:
AUC = area under de curve
PbAc oral PbAc, Pb oral Pb, Dose / AUC Dose / AUC RBA PbAc oral Pb oral Dose / PbAc Liver Dose / Pb Liver RBA 100 x Dose / chyme in PbAc Dose / chyme in Pb RBAc PbAc Pb 100 x Dose / dialysate in PbAc Dose / dialysate in Pb RBAc PbAc Pb
6
Validation study – results
The bioaccessibilities and bioavailabilities in the validation study are calculated based on the lead concentrations in soil as determined by aqua regia extraction, as this is the method used in location-specific soil investigations in the
Netherlands. Calculations based on XRF analyses are included in Appendix 3. The lead concentrations in soil from The Hague, De Rijp, Maastricht, and
Rotterdam, as determined by XRF, are comparable to those determined by aqua
regia extraction and lead to similar bioaccessibilities and bioavailabilities.
However, lead concentrations in soil from Leiden, Nijmegen, and Utrecht, as determined by XRF, were 1.3-1.7x higher than for aqua regia extraction, leading to lower bioaccessibilities and bioavailabilities and subsequently to differences in correlation between in vitro and in vivo data.
6.1 IVD model
The absolute bioaccessibilities (BAc) for the seven Dutch made grounds measured in the IVD model varied between 18% and 60% (n=4), (Table 8). Remarkably, both PbAc concentrations resulted in very low bioaccessibilities of 0.5% and 5%. The cause of these low values is not clear. Hence, these data were not considered suitable for further calculation of the RBAc. For this reason, the PbAc results from the first IVD pilot study were used to determine the RBAc (Table 8). The RBAc in the seven soils varied between 30% and 102%.
Table 8. Absolute (BAc) and relative (RBAc) bioaccessibility (± RSD) of made ground samples determined by IVD model.
Sample Amount soil
(g) Lead intake (µg)a BAc chyme (%) RBAc chyme (%)b Montana 0.2 g 1085 24 41 ± 1 The Hague 0.2 g 128 45 77 ± 42 De Rijp 0.2 g 228 60 102 ± 7 Leiden 0.2 g 104 53 90 ± 5 Maastricht 0.2 g 204 18 30 ± 25 Nijmegen 0.2 g 517 33 56 ± 45 Rotterdam 0.2 g 423 40 68 ± 9 Utrecht 0.2 g 568 60 102 ± 6 PbAc 0.1 mg 55 0.5 PbAc 0.5 mg 273 5 PbAc pilotc 0.05 / 5 mg 59 ± 16 -
a Based on lead concentration in soil as determined by aqua regia extraction.
b Bioaccessibility of lead from soil relative to bioaccessibility from PbAc as determined in
the pilot study.
c PbAc value obtained from the first pilot IVD study.
6.2 Tiny-TIM model
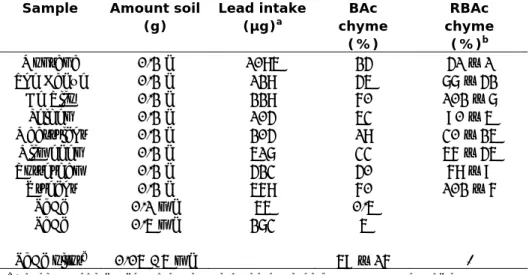
Soil bioaccessibility values measured using the Tiny-TIM system were calculated based on the lead concentration in the dialysate, relative to the bioaccessibility measured for PbAc. The RBAcs (n=2) were, on average, 4 fold lower than obtained from the IVD model and ranged from 7% to 43%. Table 9 presents the
absolute and relative bioaccessibilities measured for the made grounds both in the pilot and validation study.
Table 9. Absolute and relative bioaccessibility of lead from soil determined by the Tiny-TIM model.
Sample Amount soil (g) Lead intake (µg)a BAc dialysate (%) RBAc dialysate (%)b The Hague 0.5 319 12.9, 17.2 28, 37 De Rijp 0.5 569 9.8, 8.8 21, 19 Leiden 0.5 261 6.7, 5.6 14, 12 Maastricht 0.5 510 3.0, 3.5 6, 8 Nijmegen 0.5 1286 14.0, 25.1 30, 54 Rotterdam 0.5 1055 15.6, 16.8 36, 33 Utrecht 0.5 1421 21.0, 19.3 45, 41 PbAc 0.001 1000 46.9, 46.3 -
a Based on lead concentration in soil as determined by aqua regia extraction. b Average bioaccessibility relative to PbAc
The total recovery of lead from the Tiny-TIM system as measured for PbAc (n=2) was 92.5%.
6.2.1 Analyses of centrifuged residues for comparison with IVD
To be able to compare the bioaccessibility measured in the IVD model and Tiny-TIM model, a fraction of the intestinal residue from Tiny-Tiny-TIM was centrifuged in the same manner as the IVD samples. The amount of Pb in the dialysis liquid and in the intestinal residue were summed to obtain an ‘IVD-like’ BAc and RBAc. The results show that the bioaccessibility from the dialysate and the centrifuged intestinal residue combined are closer to the findings from the IVD model than the dialysate only. The absolute and relative bioaccessibility obtained from the dialysate was on average a factor 4-5 lower than the bioaccessibility from the IVD model, however, combined with the centrifuged residue samples, the difference is reduced to an average factor of 1.5-1.8. These data indicate that the (remaining) difference between the Tiny-TIM system and IVD model may be largely explained by the difference between the separation methods used (semi-permeable membrane vs centrifugation).
Table 10. Absolute (BAc) and relative (RBAc) bioaccessibility of lead from soil determined in the centrifuged residue samples of the Tiny-TIM system.
Sample BAc centrifuged residues (%) BAc dialysate (%) BAc total (%) RBAc total (%) BAc IVD (%) RBAc IVD (%) The Hague 21 15 36 50 45 77 De Rijp 15 10 25 35 60 102 Leiden 20 7 27 37 53 90 Maastricht 11 3 14 20 18 30 Nijmegen ND ND ND ND ND ND Rotterdam 21 17 37 53 40 68 Utrecht 35 20 55 78 60 102 PbAc 24 47 71 - 59 -
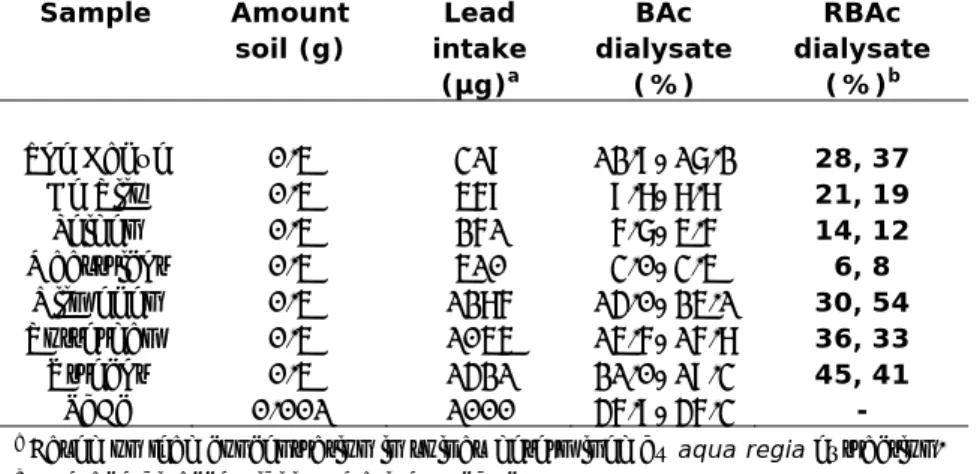
6.3 Unified BARGE method
Bioaccessibilities of the Dutch made grounds using the UBM are presented in Table 11. The RBAc values of the gastric phase are higher than those of the gastric + intestinal phase, which is explained by the differing pH values of these two phases.
The RBAc for the gastric phase is in some cases > 100% (Leiden, Nijmegen and Utrecht). However, this is not the case when the soil concentrations are based on XRF data (see Appendix 3).
Table 11. Absolute (BAc) and relative (RBAc) bioaccessibility of lead from soil determined by UBM (n=3). Sample Lead intake (µg)a BAc (%) RBAcb (%) ± RSD BAc (%) RBAcb (%) ± RSD
Gastric Gastric + intestinal
The Hague 638 83 84 ± 4 28 43 ± 19 De Rijp 1138 94 95 ± 4 25 38 ± 8 Leiden 522 119 120 ± 5 39 59 ± 18 Maastricht 1021 17 17 ± 7 6 10 ± 29 Nijmegen 2572 153 154 ± 1 48 73 ± 55 Rotterdam 2111 86 87 ± 3 21 31 ± 3 Utrecht 2842 108 110 ± 7 49 74 ± 7 PbAc c 99 66
a Based on aqua regia
b Average bioaccessibility relative to PbAc
c Bioaccessibility of PbAc was obtained from previous experiments (Denys et al., 2012)
6.4 In vivo validation
The bioavailability of lead in swine was calculated based on the lead
concentrations in blood (AUCs) and livers from swine that ingested soil samples or PbAc for seven days.
The AUCs of the group of swine that were orally dosed with the reference material PbAc (150 mg/kg/d) were a factor 2 lower than in the pilot study. Compared with the intravenously dosed group of swine (representing 100% bioavailability of lead acetate), the bioavailability of the orally dosed lead acetate appeared to be only 7% (pilot study: 13%). Furthermore, the concentrations in livers of this group of swine were so low that they barely exceeded the
concentrations in the control group. For this reason, and because the liver data correlated well with the blood data (r2 = 0.94) it was decided not to calculate relative bioavailabilities (RBAs) based on the liver data.
For the calculation of the RBAs, the bioavailability of the orally dosed lead acetate is required. As this resulted in very different values in the two in vivo experiments (13 and 7%), we used the results of both experiments to calculate the RBAs.
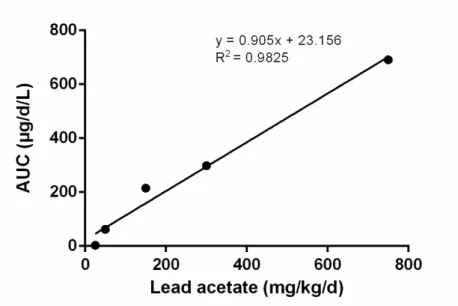
First, the RBAs were calculated using the bioavailability of the single oral dose (150 mg/kg/d) of lead acetate from the validation study (7%). However, it appeared that most resulting RBAs were higher than 100% (see Table 12), which was considered highly improbable. In the second approach, the RBAs were calculated using the bioavailability of the orally dosed lead acetate from the pilot study, using the equation depicted in Figure 7. Table 12 shows that RBAs based on this second approach are much lower than those based on the validation study, due to the larger bioavailability (AUC) of orally dosed lead acetate in the
pilot (13%). The value of 12% is close to the bioavailability of orally dosed soluble lead in swine in the study of the US EPA (2007), which equalled 15%. For these reasons, in the remainder of this report we will work with the RBA values determined with the dose-response curve of the pilot study (second approach) rather than the RBAs based on the lead acetate data in the validation study.
Figure 7 Dose-response curve for blood for orally dosed lead acetate in
pilot study (corrected for background).
The influence of the amount of soil on the bioavailability of lead from soil was examined by splitting the Utrecht soil and testing two amounts of soil. Table 12 shows that a lower amount of Utrecht soil resulted in a higher bioavailability determined in blood. A possible cause is that saturation is reached in the swine treated with 1 g soil and not all the lead that is accessible can be dissolved.
Table 12. Calculated bioavailability of lead in soil relative to that of orally dosed lead acetate (RBA): two approaches
Location
First approach: RBA based on validation studya
(%)
Second approach: RBA based on pilot studyb
(%) RSDc (%) De Rijp 104 58 28 Leiden 105 59 33 Maastricht 85 47 31 Nijmegen 150 84 15 Rotterdam 100 56 26 Utrecht - 0.4 171 95 12 Utrecht - 1 86 48 2 PbAc (oral)d 7 13 a BA of soil (AUC
soil/Dose) divided by BA of single oral dose of lead acetate (AUCPbAc/dose)
from validation study
b BA of soil (AUC
soil/Dose) divided by BA of orally dosed lead acetate (AUCPbAc/dose) from
pilot study. The BA of PbAc was calculated with the dose-response curve obtained in the pilot study (AUC = 0.905 x dose +23.2)
c RSD is the same for both methods
d BA of PbAc compared to the intravenously dosed PbAc (AUC
oral/dose divided by
AUCIV/dose)
6.5 In vitro versus in vivo
Figure 8 shows the correlation of the in vivo RBAs (second approach, see section 6.4) for blood with the RBAc of the IVD model, Tiny-TIM system and UBM model. The best correlation with in vivo RBAs was observed for UBM (R2=0.80) and for Tiny-TIM (R2=0.67), while those for IVD (R2=0.15) and UBM
gastric (r2=0.45) were low. Note that the correlations may be (mainly) determined by the most