Appendix 7 and 8 of RIVM Report
71170186
Appendix RIVM Report 711701086A/2009
Appendix RIVM Report 71170186A/2009
Appendix 7 and 8 of RIVM Report 71170186
Relative oral bioavailability of lead from Dutch made grounds
The SEM/EDS analyses and photos
W.I. Hagens1 N. Walraven2 M. Minekus3 R. Havenaar3 J.P.A. Lijzen4 A.G. Oomen1
1: RIVM, Centre for Substances and Integrated Risk Assessment (SIR), Bilthoven 2: Geoconnect, Castricum
3: TNO-quality of life, Zeist
4: RIVM, Laboratory for Ecological Risk Assessment (LER), Bilthoven
Contact:
RIVM/SIR Werner.Hagens@rivm.nl Agnes.Oomen@rivm.nl
© RIVM 2009
Parts of this publication may be reproduced, provided acknowledgement is given to the 'National Institute for Public Health and the Environment', along with the title and year of publication.
Preface
This document contains the Appendices 7 and 8 of the RIVM Report 71170186/2009 “Relative oral bioavailability of lead from Dutch made grounds”, written by W.I. Hagens, N. Walraven, M. Minekus, R. Havenaar, J.P.A. Lijzen, A.G. Oomen. This RIVM report is available at the RIVM website (www.rivm.nl).
Appendix 7 contains the SEM/EDS analysis (SEM: Scanning Electronic Microscopy, EDS: Energy Dispersive röntgen fluorescence Spectrometer), of sixteen selected made grounds, performed at CORUS (IJmuiden, the Netherlands). Data interpretation was performed by N. Walraven (Geoconnect, Castricum, the Netherlands).
Appendix 8 contains the SEM photos of sixteen selected made grounds. These photos were taken by CORUS (IJmuiden, the Netherlands).
Appendix 7: SEM/EDS analyses
This appendix contains the results of the SEM/EDS analyses of the 16 selected soil samples. The SEM photos are given in Appendix 8.
Sample 1: Schoonhoven
An element map of soil Sample 1 (Schoonhoven) is given in Figure A1.
Figure A1: Element map of soil Sample 1 (red=Pb; green=P; blue=Si; yellow=Pb+P; purple=Pb+Si; light blue=P+Si).
Figure A1 shows that Pb containing particles are finely dispersed throughout a silicate rich matrix (mainly sand). The particles are in general <10 μm in diameter, with some particles measuring up to 30 μm in diameter. A few Pb-P phases are present, with diameters ranging from <5 to 20 μm.
The diameters (in μm) and chemical compositions of the representative Pb phases in Sample 1 (Schoonhoven) are presented in Table A1.
Table A1: Diameter and chemical composition (in wt %) of representative Pb phases in Sample 1 (Schoonhoven).
Photo Point Diameter (μm) AlO3 2
SiO2 P2O5 S Cl CaO Fe2O3 Pb Pb-phase
1 1 10 <1 nd nd nd nd 1 1 98 Pb, Pb oxide or Pb carbonate
2 1 15 1 2 9 - 4 12 2 68 Pb apatite
1 2 10 <1 1 8 <1 4 14 3 67 Pb apatite
3 3 10 6 11 7 nd 3 7 2 58 Pb glass/glaze with Pb apatite
4 1 15 7 36 <1 <1 <1 <1 1 56 Pb glass/glaze
3 1 5 2 5 13 nd 2 29 1 46 Pb apatite
5 2 10 <1 <1 29 nd 1 34 1 33 Pb apatite
Sample 1 mainly contains the following Pb phases: 1) Elemental Pb, Pb oxide or Pb carbonate, 2) Pb glass/glaze and 3) Pb apatite. Elemental Pb, Pb oxide, Pb carbonate and Pb glass/glaze are primary Pb phases (Table A1). Pb apatite is a secondary Pb phase. With the used SEM/EDS technique it was not possible to distinguish between elemental Pb, Pb oxide and Pb carbonate (due to the inaccuracy of the C and O analysis). The diameter of the primary Pb phases varies between 10 to 15 μm, with Pb glass/glaze being the largest particles. The diameter of the secondary Pb phases varies from 5 to 15 μm.
When primary Pb phases dissolve, dissolved Pb can adsorb to organic matter. The chemical composition of selected organic rich particles in Sample 1 (Schoonhoven) is given in Table A2.
TableA2: Chemical composition (in wt %) of selected organic rich particles in Sample 1 (Schoonhoven). Photo Point C* Na2O MgO Al2O3 SiO2 P2O5 S K2O CaO Pb
6 1 84 <1 <1 2 4 <1 <1 <1 6 1.23 6 8 81 <1 <1 1 6 <1 <1 <1 5 1.81 2 2 73 <1 1 4 15 1 <1 1 2 0.66 2 5 72 <1 1 5 16 <1 <1 1 2 0.07 3 6 70 nd 1 5 16 <1 <1 1 4 0.44 3 7 67 <1 1 6 19 <1 <1 1 1 0.11 5 11 66 nd 1 1 8 <1 <1 <1 <1 0.21
* The accuracy of the C analyses with the used technique is limited, the C content is therefore semi-quantitative. nd=not detectable.
The Pb content of the selected organic rich particles varies from not detectable to 1.81 wt %. The highest Pb content is measured in the most C-rich organic particles.
Sample 11: Utrecht
An element map of soil Sample 11 (Utrecht) is given in Figure A2.
Figure A2: Element map of soil Sample 11 (red=Pb; green=P; blue=Si; yellow=Pb+P; purple=Pb+Si; light blue=P+Si).
Figure A2 shows that Pb containing particles are finely dispersed throughout a silicate rich matrix (mainly sand). The particles are in general <10 μm in diameter, with some particles measuring up to 30 μm in diameter.
The diameters and chemical compositions of the representative Pb phases in Sample 11 (Utrecht) are presented in Table A3.
Table A3: Diameter and chemical composition (in wt %) of representative Pb phases in Sample 11 (Utrecht).
Photo Point Dia
meter (μm) Al2O3 SiO2 P2O5 S Cl CaO Fe2O3 Pb Pb-phase 8 1 10 <1 <1 16 nd 3 7 4 68 Pb-apatite 9 1 10 nd nd 17 nd 3 6 6 67 Pb-apatite 10 1 30 1 2 19 nd 3 11 1 61 Pb-apatite 10 4 10 13 28 10 <1 3 7 7 24 Pb-apatite 11 4 10 1 1 1 11 1 2 31 5 Fe-Pb 11 1 <5 <1 1 <1 nd <1 <1 79 4 Fe-Pb 12 1 <5 <1 1 1 <1 <1 <1 77 4 Fe-Pb 9 5 10 1 1 1 <1 <1 1 77 4 Fe-Pb nd=not detectable
Sample 11 mainly contains the following Pb phases: 1) Pb apatite (10-30 μm) and 2) Pb bound to iron particles (<5-10 μm).
When primary Pb phases dissolve, dissolved Pb can adsorb to organic matter. The chemical composition of selected organic rich particles in Sample 11 (Utrecht) is given in Table A4.
Table A4: Chemical composition (in wt %) of selected organic rich particles in Sample 11 (Utrecht). Photo Point C* Na2O MgO Al2O3 SiO2 P2O5 CaO Fe2O3 Pb
13 a 6 83 <1 <1 2 9 <1 1 2 0.24 13 a 2 2 1 1 1 d 8 < < 2 9 < 2 2 n 13a 4 82 <1 1 3 9 <1 2 2 0.07 13a 9 82 <1 1 2 7 <1 2 4 0.13 13a 1 78 <1 <1 2 9 1 2 6 nd 13a 3 78 <1 <1 2 14 <1 2 1 0.06 13a 7 78 <1 <1 4 12 <1 2 2 0.17 13a 5 77 <1 <1 3 14 <1 1 2 0.18 8 6 75 <1 1 3 10 1 4 4 0.19 8 5 75 nd 1 3 10 1 4 3 0.22 13a 8 67 <1 1 5 20 <1 1 2 0.16 10 4 61 nd 1 5 11 4 3 3 9.38
* The acc y of th ana with ed te ique is l d, the theref semi-q e.
nd=not detectable.
of the selected organic rich particles varies from not detectable to 0.24 wt % xcluding photo 10, point 4). In one organic rich particle (photo 10 point 4) a Pb content of
urac e C lyses the us chn imite C content is ore uantitativ
The Pb content (e
Sample 17: De Rijp
An element map of soil Sample 17 (De Rijp) is given in Figure A3.
Figure A3: Element map of soil Sample 17 (red=Pb; green=P; blue=Si; yellow=Pb+P; purple=Pb+Si; light blue=P+Si).
Figure A3 shows that Pb containing particles are finely dispersed throughout a silicate rich matrix (mainly sand). The particles are in general <10 μm in diameter, with some particles measuring up to 30 μm in diameter.
The diameters and chemical compositions of the representative Pb phases in Sample 17 (De Rijp) are presented in Table A5.
Table A5: Diameter and chemical composition (in wt %) of representative Pb phases in Sample 17 (De Rijp).
Photo Point Dia meter (μm)
Al2O3 SiO2 P S Cl CaO Fe2O3 Pb Pb phase
14 1 300 5 25 <1 <1 <1 <1 1 67 Pb glass/glaze 15 1 20 5 27 <1 <1 <1 <1 2 63 Pb glass/glaze 16 1 25 2 1 11 <1 3 19 4 58 Pb-apatite 17 1, 2 170 6 34-36 <1 0-1 <1 2 2 50-53 Pb glass/glaze 18 1,2, 3 350 14 35-38 <1 <1 <1 <1 2-6 39-43 Pb glass/glaze 19 1 40 2 68 <1 <1 <1 <1 1 28 Pb glass/glaze 20 2 675 2 51 <1 <1 1 3 1 22 Pb glass/glaze nd=not detectable
Sample 17 mainly contains Pb glass/glaze particles. The diameter of these particles varies from 20 to 675 μm. Only one Pb-apatite particle was found (25 μm in diameter).
When primary Pb phases dissolve, dissolved Pb can adsorb to organic matter. The chemical composition of selected organic rich particles in Sample 17 (De Rijp) is given in Table A6.
Table A6: Chemical composition (in wt %) of selected organic rich particles in Sample 17 (De Rijp). Photo Point C* Al2O3 SiO2 P2O5 S Cl K2O CaO Fe2O3 Pb
21 1 97 1 1 <1 1 <1 <1 <1 <1 nd 22 2 97 <1 <1 nd 1 <1 <1 <1 <1 nd 22 7 95 1 2 <1 <1 1 <1 <1 <1 0.2 22 1 93 2 3 <1 <1 <1 <1 1 <1 nd 23 4 93 <1 1 <1 1 <1 nd 1 3 nd 23 9 89 4 5 <1 <1 <1 <1 1 <1 nd 21 3 88 2 3 <1 1 <1 <1 3 1 nd 23 6 87 2 7 <1 <1 1 <1 1 2 0.16 22 5 87 2 7 <1 <1 1 <1 1 1 0.09 24 5 86 2 7 <1 <1 1 <1 1 1 0.19 22 4 85 2 9 <1 <1 1 <1 1 1 0.02 23 5 84 2 9 <1 <1 1 <1 1 1 0.08 24 4 84 2 8 <1 <1 1 <1 1 1 0.02 24 2 84 3 4 <1 <1 <1 1 5 2 0.15 22 3 83 3 10 <1 <1 <1 <1 1 2 0.25 24 3 82 2 10 1 <1 <1 <1 1 1 nd 21 2 81 3 4 <1 <1 <1 1 5 4 nd 24 1 79 2 4 1 2 <1 1 6 3 0.37 23 8 73 5 15 1 <1 <1 1 1 2 nd 22 6 66 13 17 <1 <1 <1 1 <1 1 0.07
* The accuracy of the C analyses with the used technique is limited, the C content is therefore semi-quantitative. nd=not detectable.
The Pb content of the selected organic rich particles varies from not detectable to 0.37 wt %. In half of the selected organic-rich particles the Pb content is not detectable.
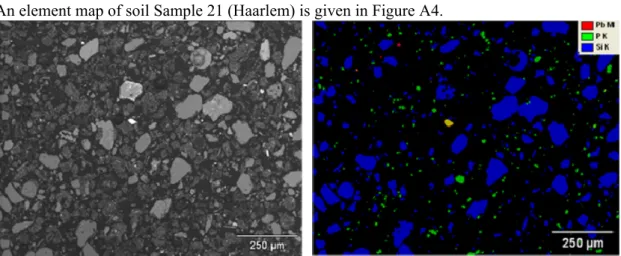
Sample 21: Haarlem
An element map of soil Sample 21 (Haarlem) is given in Figure A4.
Figure A4: Element map of soil Sample 21 (red=Pb; green=P; blue=Si; yellow=Pb+P; purple=Pb+Si; light blue=P+Si).
Figure A4 shows that the number of Pb phases is limited. The present Pb containing particles are finely dispersed throughout a silicate rich matrix (mainly sand). The particles are in general 10 μm in diameter, with some particles measuring up to 50 μm in diameter.
The diameters and chemical compositions of the representative Pb phases in Sample 21 (Haarlem) are presented in Table A7.
Table A7: Diameter and chemical composition (in wt %) of representative Pb phases in Sample 21 (Haarlem).
Photo Point Diameter
(μm) Al2O3 SiO2 P S Cl CaO Fe2O3 Pb Pb-phase
24 1 50 <1 nd <1 nd nd nd 1 97 24 2 50 nd nd nd <1 nd nd 1 97 25 1, 2, 3 75 <1 0-2 <1 nd 0-2 0-1 <1 94-97 Pb, Pb oxide or Pb carbonate 26 1, 2 10 <1 nd 7 <1 2-3 4 1 81-84 Pb-apatite 27 1, 4 5 1-3 3-10 <1 11-12 <1 <1 0-1 70-82 Pb-S 28 1, 2, 3 30 0-3 1-9 7-8 0-1 2-3 6-8 1-4 64-77 Pb-apatite 29 1 5 2 4 nd 1 <1 1 2 70 Pb, Pb oxide or Pb carbonate 30 1 ? 2 3 8 nd 3 9 2 69 Pb-apatite 29 2 <5 2 4 <1 nd <1 <1 3 67 Pb, Pb oxide or Pb carbonate 31 1, 3 80 2 11 7 <1 3 6 2 66 Pb-apatite 30 3 ? 3 9 8 <1 3 15 2 55 Pb-apatite 30 2 ? 4 4 2 6 1 3 18 49 Pb-Fe-S nd=not detectable
Sample 21 mainly contains the following Pb phases: 1) Elemental Pb, Pb oxide or Pb carbonate, 2) Pb-S, 3) Pb apatite and 4) a Pb-Fe-S phase. Elemental Pb, Pb oxide, Pb carbonate, and Pb-S (in this sample) are primary Pb phases (Table A7). Pb apatite and Pb-Fe-S are secondary Pb phases. With the used SEM/EDS technique it was not possible to distinguish between elemental Pb, Pb oxide and Pb carbonate (due to the inaccuracy of the C and O analysis). The diameter of the primary Pb phases varies between 5 to 75 μm, with Pb glass/glaze being the largest particles. The diameter of the secondary Pb phases varies from 10 to 80 μm.
When primary Pb phases dissolve, dissolved Pb can adsorb to organic matter. The chemical composition of selected organic rich particles in Sample 21 (Haarlem) is given in Table A8.
Table A8: Chemical composition (in wt %) of selected organic rich particles in Sample 21 (Haarlem). Photo Point C* Al2O3 SiO2 P2O5 S Cl K2O CaO Fe2O3 Pb
32 6 91 1 5 <1 <1 1 <1 1 1 nd 32 7 86 2 6 1 <1 1 <1 2 1 nd 32 2 84 2 7 1 <1 <1 <1 3 2 0.02 33 8 81 3 9 1 <1 1 <1 2 2 0.21 32 5 81 3 8 1 <1 <1 <1 2 2 0.25 33 4 81 2 8 1 <1 <1 <1 3 2 0.01 32 7 81 2 9 1 <1 <1 <1 2 2 0.31 33 10 80 3 8 1 <1 <1 1 3 2 0.27 33 4 79 3 10 1 <1 1 <1 2 2 0.32 33 8 79 2 6 1 1 <1 1 5 2 0.18 33 6 77 3 11 2 <1 1 <1 3 2 0.27 33 4 76 3 10 2 <1 <1 1 3 2 0.18 34 6 76 3 12 1 <1 <1 1 2 3 0.39 34 7 75 3 12 1 <1 <1 1 2 3 0.3 34 5 74 3 12 1 <1 <1 1 3 3 0.2 34 3 74 3 13 2 <1 <1 1 3 3 0.23 32 3 73 1 2 3 <1 <1 <1 2 18 0.37 34 2 71 3 15 2 <1 <1 1 2 3 0.4 32 1 70 8 14 1 <1 <1 1 1 3 nd 34 3 68 4 16 2 <1 <1 1 3 4 0.27 32 5 67 9 16 1 <1 <1 1 3 3 nd
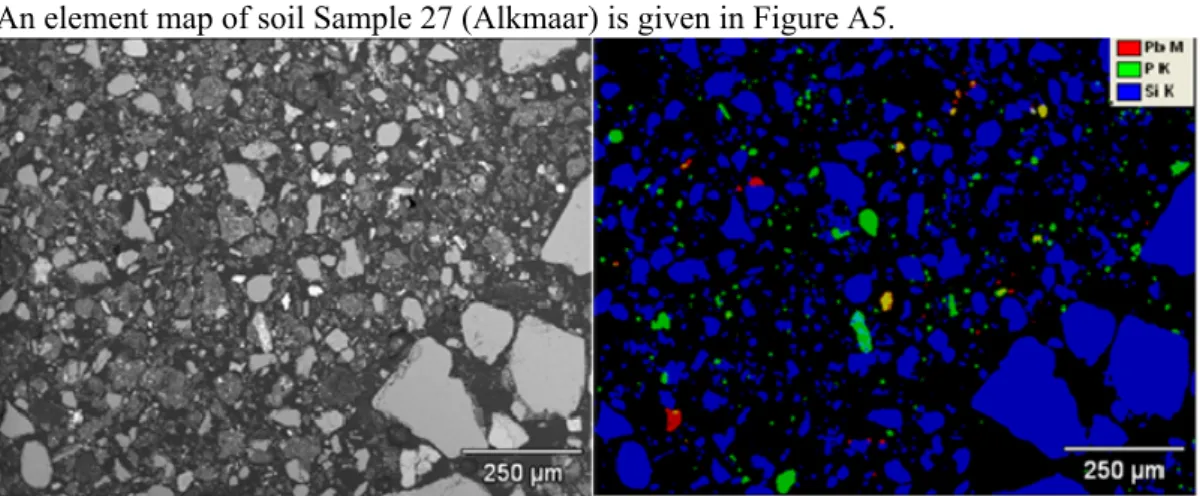
Sample 27: Alkmaar
An element map of soil Sample 27 (Alkmaar) is given in Figure A5.
Figure A5: Element map of soil Sample 27 (red=Pb; green=P; blue=Si; yellow=Pb+P; purple=Pb+Si; light blue=P+Si).
Figure A5 shows that Pb containing particles are finely dispersed throughout a silicate rich matrix (mainly sand). A relatively large number of Pb-P particles is present in this sample. The particles are in general around 10 μm in diameter, with some particles measuring up to 50 μm in diameter.
The diameters and chemical compositions of the representative Pb phases in Sample 27 (Alkmaar) are presented in Table A9.
Table A9: Diameter and chemical composition (in wt %) of representative Pb phases in Sample 27 (Alkmaar).
Photo Point Diameter
(μm) Al2O3 SiO2 P2O5 S Cl CaO Fe2O3 Pb Pb phase
35 4 5 <1 <1 <1 nd nd <1 <1 98 35 5 5 <1 1 - nd nd <1 <1 97 Pb, Pb oxide or Pb carbonate 35 3 35 <1 <1 15 nd 2 5 2 75 36 5 5 1 4 2 nd 1 13 2 73 36 1,2,3 15 0-1 <1 16-20 nd 2-6 6-14 1-5 54-72 37 3 5 <1 1 16 nd 4 7 1 70 38 1,3,4 70 1-2 0-7 17-18 nd 2-3 8-10 1-3 57-68 35 1 30 <1 <1 17 1 3 8 2 67 36 4 5 1 6 14 <1 4 6 1 65 35 7 5 1 3 18 1 3 7 2 63 39 2 20 1 7 18 nd 2 14 3 52 Pb apatite 37 1, 2 15 5 37 nd 0-1 <1 1 3 48-50 Pb glass/glaze 35 2 30 4 12 17 nd 2 10 4 48 Pb apatite 39 1 55 5 40 nd nd <1 1 3 47 Pb glass/glaze nd=not detectable
Sample 27 mainly contains the following Pb phases: 1) Elemental Pb, Pb oxide or Pb carbonate, 2) Pb glass/glaze, and 3) Pb-apatite. Elemental Pb, Pb oxide, Pb carbonate and Pb glass/glaze are primary Pb phases (Table A9). Pb apatite is a secondary Pb phases. With the used SEM/EDS technique it was not possible to distinguish between elemental Pb, Pb oxide and Pb carbonate (due to the inaccuracy of the C and O analysis).
Pb apatite is clearly the dominant Pb phase. The diameter of the Pb-apatites varies between 5 and 70 μm. The diameter of Pb, Pb oxide or Pb carbonate is approximately 5 μm, and the diameter of the Pb glass/glaze particles is 15 to 55 μm.
When primary Pb phases dissolve, dissolved Pb can adsorb to organic matter. The chemical composition of selected organic rich particles in Sample 27 (Alkmaar) is given in Table A10.
Table A10: Chemical composition (in wt %) of selected organic rich particles in Sample 27 (Alkmaar). Photo Point C* Al2O3 SiO2 P2O5 S Cl K2O CaO Fe2O3 Pb
37 7 84 1 5 <1 <1 1 <1 4 2 nd 39 4 80 1 4 2 <1 1 <1 2 1 7 38 7 73 4 16 1 <1 1 1 1 3 nd 39 6 72 2 15 <1 <1 1 <1 5 3 nd 37 9 71 4 17 1 <1 <1 <1 2 3 0.27 35 8 69 3 18 1 <1 1 1 2 3 0.17
* The accuracy of the C analyses with the used technique is limited; the C content is therefore semi-quantitative. nd=not detectable.
The Pb content of the selected organic rich particles varies from not detectable to 0.27 wt % (excluding photo 39, point 4). In one organic rich particle (photo 39, point 4) a Pb content of 7 wt % is measured. Most likely a primary Pb phase is included in the analysis.
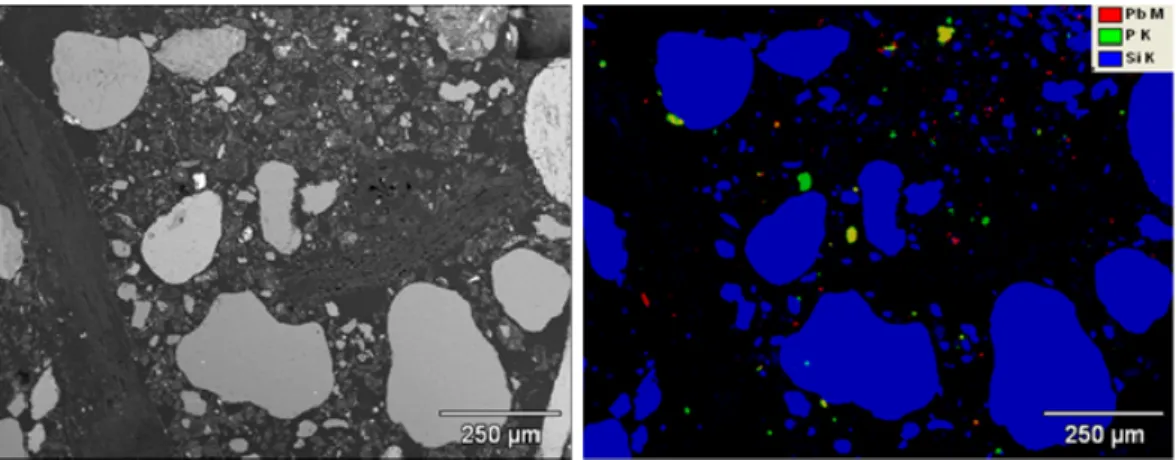
Sample 29: Leiden
An element map of soil Sample 29 (Leiden) is given in Figure A6.
Figure A6: Element map of soil Sample 29 (red=Pb; green=P; blue=Si; yellow=Pb+P; purple=Pb+Si; light blue=P+Si).
Figure A6 shows that Pb containing particles are finely dispersed throughout a silicate rich matrix (mainly sand). A relatively large number of Pb-P particles is present in this sample. The particles are in general around 10 μm in diameter, with some particles, mainly the Pb-P particles, measuring up to 40 μm in diameter.
The diameters and chemical compositions of the representative Pb phases in Sample 29 (Leiden) are presented in Table A11.
Table A11: Diameter and chemical composition (in wt %) of representative Pb phases in Sample 29 (Leiden).
Photo Point Diameter
(μm) Al2O3 SiO2 P2O5 S Cl CaO Fe2O3 Pb Pb phase
40 1 25 <1 <1 16 <1 3 5 <1 72.9 Pb apatite 41 2 5 11 33 1 5 24 9 7 8.6 42 1 15 73 2 nd 0 15 nd nd 8.5 Pb glass/glaze nd=not detectable
Sample 29 mainly contains the Pb phases Pb glass/glaze and Pb-apatite (Table A11), with Pb apatite being the particles with the largest diameter (up to 40 μm).
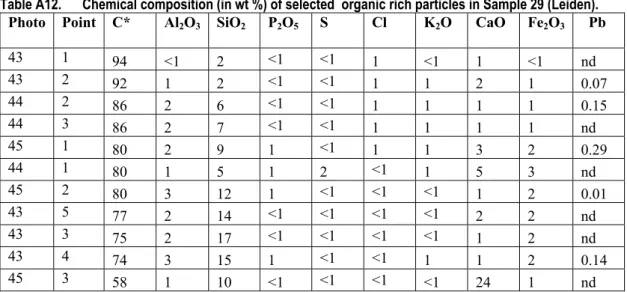
When primary Pb phases dissolve, dissolved Pb can adsorb to organic matter. The chemical composition of selected organic rich particles in Sample 29 (Leiden) is given in Table A12.
Table A12. Chemical composition (in wt %) of selected organic rich particles in Sample 29 (Leiden). Photo Point C* Al2O3 SiO2 P2O5 S Cl K2O CaO Fe2O3 Pb
43 1 94 <1 2 <1 <1 1 <1 1 <1 nd 43 2 92 1 2 <1 <1 1 1 2 1 0.07 44 2 86 2 6 <1 <1 1 1 1 1 0.15 44 3 86 2 7 <1 <1 1 1 1 1 nd 45 1 80 2 9 1 <1 1 1 3 2 0.29 44 1 80 1 5 1 2 <1 1 5 3 nd 45 2 80 3 12 1 <1 <1 <1 1 2 0.01 43 5 77 2 14 <1 <1 <1 <1 2 2 nd 43 3 75 2 17 <1 <1 <1 <1 1 2 nd 43 4 74 3 15 1 <1 <1 1 1 2 0.14 45 3 58 1 10 <1 <1 <1 <1 24 1 nd
* The accuracy of the C analyses with the used technique is limited, the C content is therefore semi-quantitative. nd=not detectable.
The Pb content of the selected organic rich particles varies from not detectable to 0.29 wt %. The Pb content of half of the measured organic rich particles is not detectable.
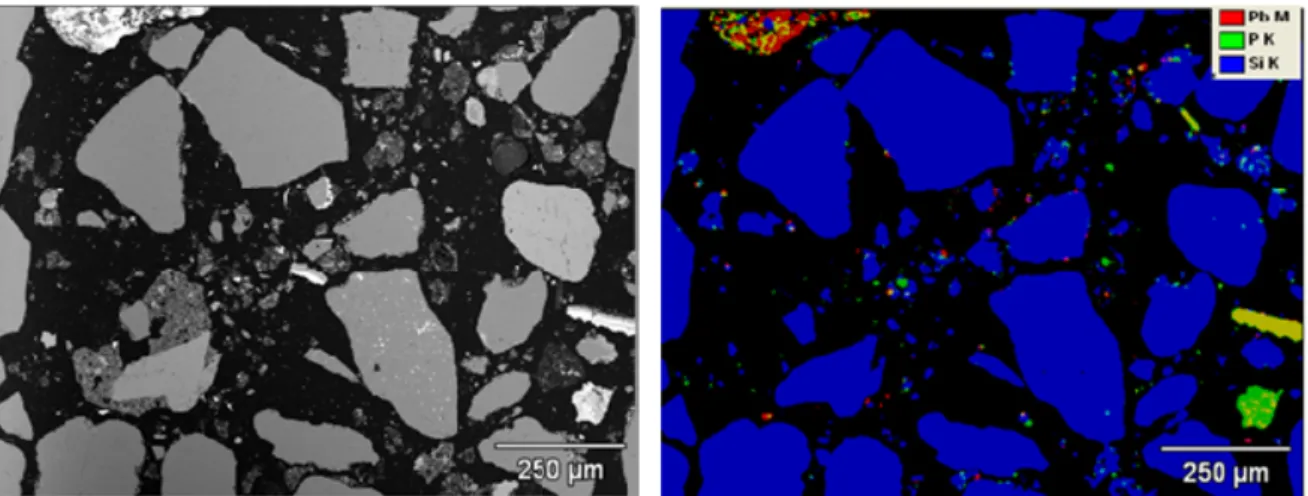
Sample 33: Delft
An element map of soil Sample 33 (Delft) is given in Figure A7.
Figure A7: Element map of soil Sample 33 (red=Pb; green=P; blue=Si; yellow=Pb+P; purple=Pb+Si; light blue=P+Si).
Figure A7 shows that Pb containing particles are finely dispersed throughout a silicate rich matrix (mainly sand). A relatively large number of Pb-P particles is present in this sample. The particles are in general around 10 μm in diameter, with some particles, mainly the Pb-P particles, measuring up to 250 μm in diameter.
The diameters and chemical compositions of the representative Pb phases in Sample 33 (Delft) are presented in Table A13.
Table A13: Diameter and chemical composition (in wt %) of representative Pb phases in Sample 33 (Delft).
Photo Point Diameter
(μm) Al2O3 SiO2 P S Cl CaO Fe2O3 Pb Pb phases
46 1,3,4 35 nd nd nd nd nd <1 3-4 94-95 46 2 15 nd nd nd nd <1 <1 4 93 47 4 10 nd nd <1 nd <1 1 4 93 Pb, Pb oxide or Pb carbonate 47 3 5 <1 <1 1 nd 2 1 9 85 Fe-Pb 48 2 Vein (75) 1 nd <1 <1 7 <1 9 82 Fe-Pb 48 1 Vein (75) <1 0 <1 3 4 <1 5 82 Fe-Pb 49 1 40 <1 0 8 nd 4 6 4 78 50 1 25 <1 nd 9 nd 3 11 1 73 51 1 20 <1 1 7 <1 3 10 <1 73 Pb-apatite 52 1 375 1 34 nd nd <1 1 2 43 53 1 2.8 mm 1 38 <1 <1 1 2 1 32 Pb glass/glaze nd=not detectable
Sample 33 mainly contains the following Pb phases: 1) Elemental Pb, Pb oxide or Pb carbonate, 2) Pb glass/glaze, 3) Pb veins in Fe and 4) Pb apatite. Elemental Pb, Pb oxide, Pb carbonate, Pb
glass/glaze and Pb veins in Fe are primary Pb phases (Table A13). Pb apatite is a secondary Pb phase. With the used SEM/EDS technique it was not possible to distinguish between elemental Pb, Pb oxide and Pb carbonate (due to the inaccuracy of the C and O analysis). The diameter of the primary Pb phases varies between 10 μm to 2.8 mm, with Pb glass/glaze being the largest particles. The diameter of the secondary Pb phases varies from 20 to 40 μm.
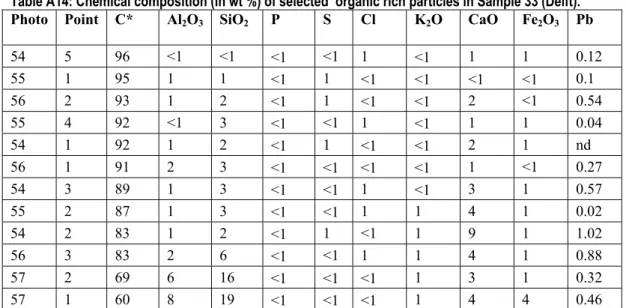
When primary Pb phases dissolve, dissolved Pb can adsorb to organic matter. The chemical composition of selected organic rich particles in Sample 33 (Delft) is given in Table A14.
Table A14: Chemical composition (in wt %) of selected organic rich particles in Sample 33 (Delft). Photo Point C* Al2O3 SiO2 P S Cl K2O CaO Fe2O3 Pb
54 5 96 <1 <1 <1 <1 1 <1 1 1 0.12 55 1 95 1 1 <1 1 <1 <1 <1 <1 0.1 56 2 93 1 2 <1 1 <1 <1 2 <1 0.54 55 4 92 <1 3 <1 <1 1 <1 1 1 0.04 54 1 92 1 2 <1 1 <1 <1 2 1 nd 56 1 91 2 3 <1 <1 <1 <1 1 <1 0.27 54 3 89 1 3 <1 <1 1 <1 3 1 0.57 55 2 87 1 3 <1 <1 1 1 4 1 0.02 54 2 83 1 2 <1 1 <1 1 9 1 1.02 56 3 83 2 6 <1 <1 1 1 4 1 0.88 57 2 69 6 16 <1 <1 <1 1 3 1 0.32 57 1 60 8 19 <1 <1 <1 1 4 4 0.46
* The accuracy of the C analyses with the used technique is limited, the C content is therefore semi-quantitative. nd=not detectable.
The Pb content of the selected organic rich particles varies from not detectable to 1.02 wt %. The Pb content of only one measured organic rich particle is not detectable.
Sample 43: Den Haag
An element map of soil Sample 43 (Den Haag) is given in Figure A8.
Figure A8: Element map of soil Sample 43 (red=Pb; green=P; blue=Si; yellow=Pb+P; purple=Pb+Si; light blue=P+Si).
Figure A8 shows that Pb containing particles are finely dispersed throughout a silicate rich matrix (mainly sand). The particles are all <10 μm (diameter).
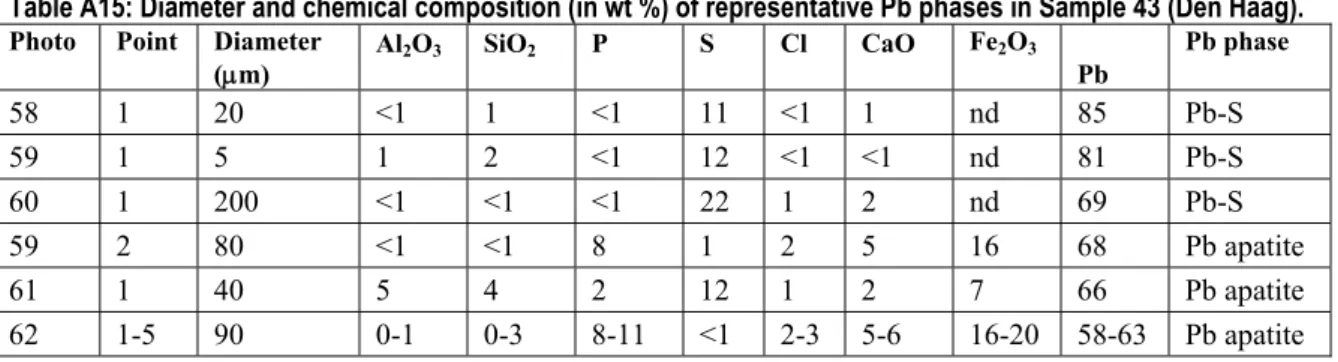
The diameters and chemical compositions of the representative Pb phases in Sample 43 (Den Haag) are presented in Table A15.
Table A15: Diameter and chemical composition (in wt %) of representative Pb phases in Sample 43 (Den Haag).
Photo Point Diameter
(μm) Al2O3 SiO2 P S Cl CaO Fe2O3 Pb Pb phase 58 1 20 <1 1 <1 11 <1 1 nd 85 Pb-S 59 1 5 1 2 <1 12 <1 <1 nd 81 Pb-S 60 1 200 <1 <1 <1 22 1 2 nd 69 Pb-S 59 2 80 <1 <1 8 1 2 5 16 68 Pb apatite 61 1 40 5 4 2 12 1 2 7 66 Pb apatite 62 1-5 90 0-1 0-3 8-11 <1 2-3 5-6 16-20 58-63 Pb apatite nd=not detectable
Sample 43 mainly contains the Pb phases Pb-S and Pb-apatite (Table A15). Pb can be a primary Pb phase and/or a secondary Pb phase. The diameter of the Pb-S particles varies from 5 to 200 μm. Pb apatite is a secondary Pb phase, with particle diameters ranging from 40 to 90 μm.
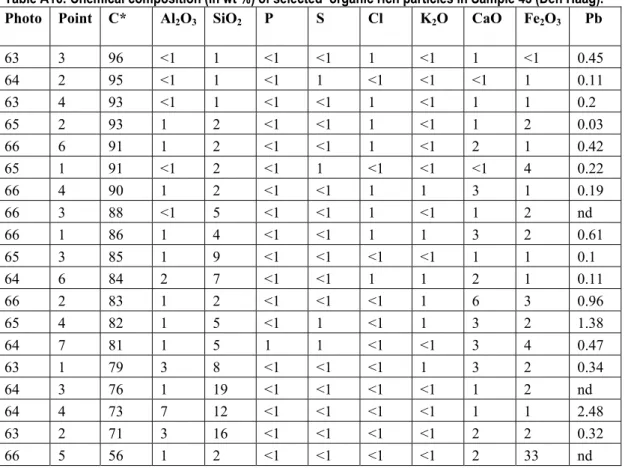
When primary Pb phases dissolve, dissolved Pb can adsorb to organic matter. The chemical composition of selected organic rich particles in Sample 43 (Den Haag) is given in Table A16.
Table A16: Chemical composition (in wt %) of selected organic rich particles in Sample 43 (Den Haag). Photo Point C* Al2O3 SiO2 P S Cl K2O CaO Fe2O3 Pb
63 3 96 <1 1 <1 <1 1 <1 1 <1 0.45 64 2 95 <1 1 <1 1 <1 <1 <1 1 0.11 63 4 93 <1 1 <1 <1 1 <1 1 1 0.2 65 2 93 1 2 <1 <1 1 <1 1 2 0.03 66 6 91 1 2 <1 <1 1 <1 2 1 0.42 65 1 91 <1 2 <1 1 <1 <1 <1 4 0.22 66 4 90 1 2 <1 <1 1 1 3 1 0.19 66 3 88 <1 5 <1 <1 1 <1 1 2 nd 66 1 86 1 4 <1 <1 1 1 3 2 0.61 65 3 85 1 9 <1 <1 <1 <1 1 1 0.1 64 6 84 2 7 <1 <1 1 1 2 1 0.11 66 2 83 1 2 <1 <1 <1 1 6 3 0.96 65 4 82 1 5 <1 1 <1 1 3 2 1.38 64 7 81 1 5 1 1 <1 <1 3 4 0.47 63 1 79 3 8 <1 <1 <1 1 3 2 0.34 64 3 76 1 19 <1 <1 <1 <1 1 2 nd 64 4 73 7 12 <1 <1 <1 <1 1 1 2.48 63 2 71 3 16 <1 <1 <1 <1 2 2 0.32 66 5 56 1 2 <1 <1 <1 <1 2 33 nd
* The accuracy of the C analyses with the used technique is limited, the C content is therefore semi-quantitative. nd=not detectable.
Sample 45: Rotterdam
An element map of soil Sample 45 (Rotterdam) is given in Figure A9.
Figure A9: Element map of soil Sample 45 (red=Pb; green=P; blue=Si; yellow=Pb+P; purple=Pb+Si; light blue=P+Si).
Figure A9 shows that Sample 45 contains only a limited number of Pb containing particles The particles are all <10 μm (diameter).
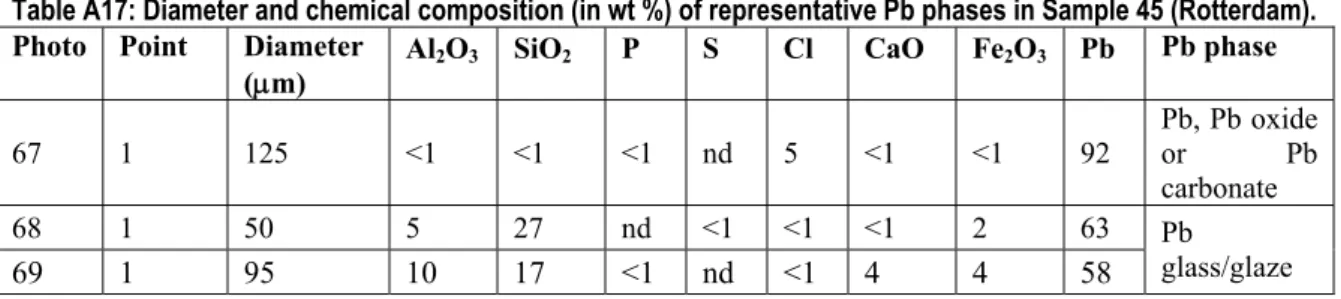
The diameters and chemical compositions of the representative Pb phases in Sample 45 (Rotterdam) are presented in Table A17.
Table A17: Diameter and chemical composition (in wt %) of representative Pb phases in Sample 45 (Rotterdam). Photo Point Diameter
(μm) Al2O3 SiO2 P S Cl CaO Fe2O3 Pb Pb phase
67 1 125 <1 <1 <1 nd 5 <1 <1 92 Pb, Pb oxide or Pb carbonate 68 1 50 5 27 nd <1 <1 <1 2 63 69 1 95 10 17 <1 nd <1 4 4 58 Pb glass/glaze nd=not detectable
Sample 45 mainly contains the Pb phases, 1) elemental Pb, Pb oxide or Pb carbonate and 2) Pb glass/glaze (Table A17). These are all primary Pb phases. With the used SEM/EDS technique it was not possible to distinguish between elemental Pb, Pb oxide and Pb carbonate (due to the inaccuracy of the C and O analysis). The diameter of the primary Pb phases varies between 50 to 125 μm.
When primary Pb phases dissolve, dissolved Pb can adsorb to organic matter. The chemical composition of selected organic rich particles in Sample 45 (Rotterdam) is given in Table A18.
Table A18: Chemical composition (in wt %) of selected organic rich particles in Sample 45 (Rotterdam). Photo Point C* Al2O3 SiO2 P2O5 S Cl K2O CaO Fe2O3 Pb
70 2 96 <1 <1 <1 1 <1 <1 1 1 0.07 71 2 96 <1 1 <1 1 <1 <1 <1 1 0.03 72 2 94 1 2 <1 <1 <1 <1 1 <1 0.01 73 1 93 1 3 <1 <1 <1 <1 1 1 0.05 73 3 92 1 3 <1 <1 1 <1 1 1 0.07 74 3 91 1 2 <1 <1 1 <1 2 1 0.01 74 2 90 1 4 <1 <1 1 <1 1 1 nd 70 3 89 1 2 <1 <1 1 <1 3 2 nd 75 1 87 <1 3 1 1 <1 <1 3 4 nd 74 1 86 1 3 1 <1 <1 1 3 3 0.32 71 1 84 1 3 2 <1 1 <1 2 6 nd 71 3 83 3 7 <1 1 1 1 2 2 nd 73 4 81 3 10 <1 <1 <1 1 1 2 0.06 73 2 81 2 6 1 1 <1 1 3 2 0.11 72 3 80 3 11 1 <1 <1 1 1 2 0.05 71 4 77 4 12 1 <1 <1 1 1 2 nd 70 1 74 4 15 <1 <1 <1 1 1 2 nd 71 5 74 6 13 1 <1 <1 1 1 3 0.04 72 4 73 4 14 1 <1 <1 1 2 2 0.13 72 1 72 4 16 1 <1 <1 1 3 2 0.27 72 5 70 5 18 1 <1 <1 1 1 2 0.03
* The accuracy of the C analyses with the used technique is limited, the C content is therefore semi-quantitative. nd=not detectable.
Sample 51: Schiedam
An element map of soil Sample 51 (Schiedam) is given in Figure A10.
Figure A10: Element map of soil Sample 51 (red=Pb; green=P; blue=Si; yellow=Pb+P; purple=Pb+Si; light blue=P+Si).
Figure A10 shows that the Pb containing particles are finely dispersed throughout a silicate rich matrix (mainly sand). The particles are predominantly <10 μm in diameter.
The diameters and chemical compositions of the representative Pb phases in Sample 51 (Schiedam) are presented in Table A19.
Table A19: Diameter and chemical composition (in wt %) of representative Pb phases in Sample 51 (Schiedam). Photo Point Diameter
(μm) Al2O3 SiO2 P S Cl CaO Fe2O3 Pb Pb phases 76 1,2,3 10 4 <1 7 0-1 2-3 4 3-4 71-75 Pb-apatite
77 1 50 1 2 1 10 3 4 3 69 Pb-S
78 1 50 5 35 <1 <1 <1 1 2 51 Pb glass/glaze
Sample 51 mainly contains the following Pb phases: 1) Pb glass/glaze, 2) Pb-S and 3) Pb-apatite. Pb glass/glaze are primary Pb phases. Pb apatite is a secondary Pb phase. Pb-S can be both a primary or secondary Pb phase. The diameter of the Pb phases varies from 10 to 50 μm.
When primary Pb phases dissolve, dissolved Pb can adsorb to organic matter. The chemical composition of selected organic rich particles in Sample 51 (Schiedam) is given in Table A20.
Table A20: Chemical composition (in wt %) of selected organic rich particles in Sample 51 (Schiedam). Photo Point C* Al2O3 SiO2 P2O5 S Cl K2O CaO Fe2O3 Pb
79 3 94 1 2 <1 1 <1 <1 1 1 0.05 80 1 89 1 2 <1 1 <1 <1 5 1 0.08 81 1 86 1 5 1 <1 1 1 2 2 0.31 79 1 85 1 7 <1 <1 <1 1 3 1 0.16 79 4 85 2 4 1 <1 <1 <1 4 2 0.36 82 1 84 2 3 <1 <1 <1 1 6 1 nd 83 2 74 4 13 <1 <1 1 1 6 1 0.26 79 2 68 13 16 <1 <1 <1 <1 1 1 nd
* The accuracy of the C analyses with the used technique is limited, the C content is therefore semi-quantitative. nd=not detectable.
Sample 53: Groningen
An element map of soil Sample 53 (Groningen) is given in Figure A11.
Figure A11: Element map of soil Sample 53 (red=Pb; green=P; blue=Si; yellow=Pb+P; purple=Pb+Si; light blue=P+Si).
Figure A11 shows that Pb containing particles are finely dispersed throughout a silicate rich matrix (mainly sand). A relatively large number of Pb-P particles is present in this sample. The particles are in general around 10 μm in diameter, with some particles, mainly the Pb-P particles, measuring up to 45 μm in diameter.
The diameters and chemical compositions of the representative Pb phases in Sample 53 (Schiedam) are presented in Table A21.
Table A21: Diameter and chemical composition (in wt %) of representative Pb phases in Sample 53 (Groningen). Photo Point Diameter
(μm) Al2O3 SiO2 P2O5 S Cl CaO Fe2O3 Pb Pb phase
84 1 15 <1 4 1 <1 <1 nd 2 85 Pb, Pb oxide or Pb carbonate 85 1,2 15 0-1 0-2 7-8 nd 2-3 2 2 82-84 Pb-apatite 86 1 10 1 2 8 nd 4 4 2 79 Pb-apatite 87 1 20 <1 <1 16 <1 3 6 1 72 Pb-apatite 88 1 10 <1 1 18 <1 3 12 2 62 Pb-apatite 88 4 <5 7 21 12 <1 4 8 3 40 Pb-apatite 89 1 10 1 6 70 nd <1 11 7 4 Pb-apatite 84 2 ? 3 2 3 7 nd 49 26 4 ? nd=not detectable
Sample 53 mainly contains the following Pb phases: 1) Pb, Pb oxide or Pb carbonate and 2) Pb-apatite. Elemental Pb, Pb oxide and Pb carbonate are primary Pb phases (Table A21). Pb apatite is a secondary Pb phase. With the used SEM/EDS technique it was not possible to
distinguish between elemental Pb, Pb oxide and Pb carbonate (due to the inaccuracy of the C and O analysis). The diameter of the Pb phases varies between <5 to 20 μm.
When primary Pb phases dissolve, dissolved Pb can adsorb to organic matter. The chemical composition of selected organic rich particles in Sample 53 (Groningen) is given in Table A22.
Table A22: Chemical composition (in wt %) of selected organic rich particles in Sample 53 (Groningen). Photo Point C* Al2O3 SiO2 P2O5 S Cl K2O CaO Fe2O3 Pb
90 9 88 1 3 <1 <1 1 1 3 1 0.08 90 8 87 1 3 <1 <1 1 1 3 2 0.07 84 7 87 1 4 <1 <1 1 <1 3 2 0.17 91 6 87 1 2 1 <1 <1 1 5 2 0.14 91 7 85 2 8 <1 <1 1 1 2 1 0.07 90 3 84 1 2 1 <1 <1 1 6 3 0.08 91 3 84 2 6 <1 <1 <1 1 3 1 0.12 90 2 84 1 2 2 <1 <1 1 5 4 0.05 90 6 84 1 2 <1 <1 <1 1 6 3 0.14 90 4 84 2 9 <1 <1 <1 <1 2 1 0.04 84 4 81 <1 <1 <1 1 nd <1 9 5 0.73 84 6 81 1 3 1 2 1 1 6 4 0.27 91 5 79 2 12 <1 <1 <1 1 2 2 0.02 90 1 79 2 6 1 <1 <1 1 6 3 0.19 91 2 79 2 5 1 <1 <1 1 6 5 0.45 91 1 77 3 11 1 <1 <1 1 3 3 0.17 90 7 74 3 16 <1 <1 <1 1 2 2 0.1 84 5 74 1 1 1 1 <1 3 10 6 nd
* The accuracy of the C analyses with the used technique is limited, the C content is therefore semi-quantitative. nd=not detectable.
The Pb content of the selected organic rich particles varies from not detectable to 0.73 wt %. In only 1 of the eighteen samples the Pb contact was not detectable.
Sample 59: Zutphen
An element map of soil Sample 59 (Zutphen) is given in Figure A12.
Figure A12: Element map of soil Sample 59 (red=Pb; green=P; blue=Si; yellow=Pb+P; purple=Pb+Si; light blue=P+Si).
Figure A12 shows that Sample 59 only contains a limited number of Pb containing particles The particles are in general <10 μm in diameter, with some large Pb-P particles (up to 45 μm).
The diameters and chemical compositions of the representative Pb phases in Sample 59 (Zutphen) are presented in Table A21.
Table A23: Diameter and chemical composition (in wt %) of representative Pb phases in Sample 59 (Zutphen). Photo Point Diameter
(μm) Al2O3 SiO2 P S Cl CaO Fe2O3 Pb Pb phase 92 1,2,4, 5,6 55 <1 <1 0-1 0-1 nd 0-1 0-1 94-99 Pb, Pb oxide, Pb carbonate 93 1-10 215 0-2 0-2 1-7 1-7 0-4 0-9 0-3 66-98 Pb-apatite 94 2 40 <1 nd 1 nd <1 1 1 96 Pb, Pb oxide, Pb carbonate 94 1 40 1 <1 4 <1 2 4 1 86 Pb-apatite 92 3 5 <1 <1 7 <1 3 6 2 78 Pb-apatite 96 1 5 <1 1 7 1 3 5 1 75 Pb-apatite 94 3 25 1 nd 11 <1 2 19 1 64 Pb-apatite 99 1 40 2 1 9 1 2 15 11 55 Pb-apatite 98 1 10 1 7 nd 3 45 nd 6 32 Pb glass/glaze 97 1 5 2 54 <1 <1 1 2 1 30 Pb glass/glaze 97 2 5 2 57 <1 <1 1 2 1 28 Pb glass/glaze 95 1 5 1 26 nd 2 38 nd 1 27 Pb glass/glaze nd=not detectable
Sample 59 mainly contains the following Pb phases: 1) Elemental Pb, Pb oxide or Pb carbonate, 2) Pb glass/glaze and 3) Pb apatite. Elemental Pb, Pb oxide, Pb carbonate and Pb glass/glaze are primary Pb phases (Table A12). Pb apatite is a secondary Pb phase. With the used SEM/EDS technique it was not possible to distinguish between elemental Pb, Pb oxide and Pb carbonate (due to the inaccuracy of the C and O analysis). The diameter of the primary Pb phases varies between 5 to 55 μm, with Pb, Pb oxide or Pb carbonate being the largest particles. The diameter of the secondary Pb phases varies from 5 to 215 μm.
When primary Pb phases dissolve, dissolved Pb can adsorb to organic matter. The chemical composition of selected organic rich particles in Sample 59 (Zutphen) is given in Table A24.
Table A24: Chemical composition (in wt %) of selected organic rich particles in Sample 59 (Zutphen). Photo Point C* Al2O3 SiO2 P S Cl K2O CaO Fe2O3 Pb
100 3 91 1 3 <1 1 <1 <1 2 1 0.1 101 1 90 1 4 <1 <1 1 <1 2 1 nd 100 1 88 1 6 <1 <1 1 <1 1 1 0.18 101 5 87 2 4 <1 <1 <1 <1 4 1 0.24 100 9 86 2 7 <1 <1 1 <1 2 1 nd 100 4 85 2 8 <1 <1 <1 <1 1 1 0.2 101 3 82 2 10 <1 <1 <1 <1 1 2 0.02 101 6 81 3 9 <1 <1 1 1 3 2 0.11 100 5 80 3 11 <1 <1 <1 1 1 3 0.15 100 10 80 3 11 <1 <1 <1 <1 2 2 nd 100 6 79 2 10 <1 <1 1 <1 3 2 1.02 100 2 79 3 12 <1 <1 <1 <1 2 2 0.11 100 7 79 2 12 <1 <1 <1 <1 2 3 nd 100 8 69 4 19 <1 <1 <1 1 3 2 0.07 101 4 68 8 16 <1 <1 <1 2 2 2 nd
* The accuracy of the C analyses with the used technique is limited, the C content is therefore semi-quantitative. nd=not detectable.
Sample 63, Nijmegen
An element map of soil Sample 63 (Nijmegen) is given in Figure A13.
Figure A13: Element map of soil Sample 63 (red=Pb; green=P; blue=Si; yellow=Pb+P; purple=Pb+Si; light blue=P+Si).
Figure A13 shows that Pb containing particles are finely dispersed throughout a silicate rich matrix (mainly sand). The particles are in approximately 10 μm in diameter, with some particles measuring up to 40 μm in diameter.
The diameters and chemical compositions of the representative Pb phases in Sample 63 (Nijmegen) are presented in Table A25.
Table A25: Diameter and chemical composition (in wt %) of representative Pb phases in Sample 63 (Nijmegen). Photo Point Diameter
(μm) Al2O3 SiO2 P S Cl CaO Fe2O3 PbO Pb phase 102 1,2 75 nd nd nd nd nd 0-3 0-1 95-99 Pb oxide 103 1 135 <1 nd nd <1 <1 <1 nd 99 Pb oxide 104 1,3,4 100 <1 nd nd 0-1 <1 0-1 nd 95-98 Pb oxide 105 1, 2 20 <1 nd nd <1 nd <1 <1 96-97 Pb oxide 106 1 20 nd nd <1 nd nd <1 1 97 Pb oxide 107 1 2 <1 nd nd nd nd <1 <1 96 Pb oxide 107 2, 3 2 <1 0-1 nd nd nd <1 nd 95-96 Pb oxide 108 1, 2 135 <1 nd nd nd 0-1 nd nd 94-96 Pb oxide 109 1 30 nd nd nd nd nd 3 nd 95 Pb oxide 109 2,3 195 nd nd <1 nd <1 0-3 <1 93-95 Pb oxide 110 1 25 <1 1 nd <1 nd 1 <1 93 Pb oxide 111 1,2,3 110 <1 <1 nd 0-2 0-1 0-2 0-1 86-93 Pb oxide 112 1, 2 55 <1 nd nd nd nd 1-2 nd 91-92 Pb oxide nd=not detectable
Sample 63 mainly contains the Pb phase Pb oxide1. The diameter of the Pb oxides varies from 2 to
195 μm. Some Pb oxides show dissolution holes (e.g. photo 104 and photo 111) .
When primary Pb phases dissolve, dissolved Pb can adsorb to organic matter. The chemical composition of selected organic rich particles in Sample 63 (Nijmegen) is given in Table A26.
Table A26: Chemical composition (in wt %) of selected organic rich particles in Sample 63 (Nijmegen). Photo Point C* Al2O3 SiO2 P S Cl K2O CaO Fe2O3 Pb
113 1 97 <1 1 nd 1 <1 <1 <1 <1 nd 114 1 97 1 1 <1 1 <1 nd <1 nd 0.14 115 1 95 1 1 nd 1 <1 <1 1 <1 0.11 116 1 94 <1 <1 nd 1 <1 <1 2 nd 0.29 117 2 92 1 1 <1 1 <1 <1 3 <1 0.61 118 1 92 1 1 nd 1 <1 <1 4 <1 0.54 117 1 91 1 2 <1 1 <1 <1 3 nd 0.38 119 1 90 1 3 <1 1 <1 <1 2 1 0.29 120 1 87 1 2 <1 <1 <1 <1 6 <1 1.28 120 2 86 1 3 <1 <1 <1 <1 7 1 0.67 117 3 81 2 8 nd <1 1 <1 5 1 0.15 116 2 72 <1 <1 <1 1 <1 3 16 nd 3.55
* The accuracy of the C analyses with the used technique is limited, the C content is therefore semi-quantitative. nd=not detectable.
Sample 69, Maastricht
No Pb containing particles were found in Sample 69. Also the Pb content of the organic rich particles was quite low (compared with the other studied samples, Table A27).
Table A27: Chemical composition (in wt %) of selected organic rich particles in Sample 69 (Maastricht). Photo Point C* Al2O3 SiO2 P S Cl K2O CaO Fe2O3 Pb
121 2 96 <1 1 <1 1 <1 - <1 1 nd 122 2 95 1 2 nd 1 <1 <1 <1 <1 nd 123 1 95 1 2 <1 1 <1 <1 <1 1 nd 123 2 93 1 2 <1 1 <1 <1 <1 1 nd 123 7 93 1 4 <1 <1 <1 <1 <1 1 nd 122 1 93 1 2 <1 <1 <1 <1 <1 1 0.16 123 3 91 <1 3 nd 1 <1 <1 1 2 nd 121 4 91 1 3 <1 1 <1 <1 <1 1 nd 122 3 91 2 3 <1 1 <1 <1 <1 1 0.04 121 3 90 1 3 nd 1 <1 <1 <1 2 nd 121 5 90 1 5 nd <1 <1 <1 <1 1 0.07 122 4 90 1 3 <1 <1 <1 <1 3 2 nd 122 5 86 2 7 <1 <1 1 <1 1 2 nd 121 1 86 2 6 <1 <1 <1 <1 1 1 nd 121 6 82 2 9 <1 <1 <1 1 <1 2 0.23
* The accuracy of the C analyses with the used technique is limited; the C content is therefore semi-quantitative. nd=not detectable.
The Pb content of the selected organic rich particles varies from not detectable to 0.23 wt %. In only 4 of the 15 particles the Pb contact was detectable.
Sample 71, Maastricht
An element map of soil Sample 71 (Maastricht) is given in Figure A14.
Figure A14: Element map of soil Sample 71 (red=Pb; green=P; blue=Si; yellow=Pb+P; purple=Pb+Si; light blue=P+Si).
Figure A14 shows that Pb containing particles are finely dispersed throughout a silicate rich matrix (mainly sand). The particles are in general <10 μm in diameter, with some particles measuring up to 45 μm in diameter.
The diameters and chemical compositions of the representative Pb phases in Sample 71 (Maastricht) are presented in Table A28. The Pb containing particles in Figure A14 were hard to find with the point measurements. Most likely these are remnants of glazed ceramic materials.
Table A28: Size and chemical composition (in wt %) of representative Pb phases in Sample 71(Maastricht). Photo Point Diameter
(μm) Al2O3 SiO2 P S Cl CaO Fe2O3 Pb Pb fase 124 1 5 <1 1 <1 <1 <1 <1 <1 98 Pb, Pb oxide or Pb carbonate 125 1,2,3 40 5 29-30 <1 <1 <1 4 <1 59-60 Pb glass/glaze 126 1 25 5 30 <1 <1 <1 4 <1 59 Pb glass/glaze 127 1 10 5 35 <1 <1 <1 4 1 53 Pb glass/glaze
Table A29: Chemical composition (in wt %) of selected organic rich particles in Sample 71 (Maastricht). Photo Point C* Al2O3 SiO2 P2O5 S Cl K2O CaO Fe2O3 Pb
128 2 98 <1 1 nd 1 <1 <1 <1 <1 nd 129 2 97 <1 1 nd 1 <1 <1 <1 <1 nd 130 1 97 1 1 nd 1 <1 <1 <1 <1 nd 131 2 97 <1 1 nd 1 <1 <1 <1 <1 nd 132 3 97 <1 1 <1 1 <1 <1 <1 <1 nd 128 1 96 <1 1 <1 1 <1 <1 <1 <1 0.01 133 2 93 2 3 <1 <1 <1 <1 1 1 0.03 131 5 93 1 4 nd 1 <1 <1 <1 1 nd 134 2 93 1 1 nd 1 <1 <1 3 <1 0.11 133 3 92 2 3 <1 1 <1 <1 1 1 nd 131 1 92 1 3 nd 1 <1 <1 2 1 nd 128 3 92 1 4 <1 <1 1 <1 <1 1 nd 133 4 90 2 6 <1 <1 <1 <1 <1 1 nd 132 2 89 <1 1 nd 1 <1 <1 8 nd 0.07 132 1 89 1 5 <1 <1 1 <1 1 1 0.32 133 4 87 2 5 <1 1 <1 <1 3 1 nd 134 3 86 1 2 <1 1 <1 1 9 <1 0.08 134 1 86 2 4 <1 2 <1 1 4 <1 0.08 131 4 86 1 3 nd 3 1 <1 6 <1 nd 131 3 83 3 10 <1 <1 <1 <1 1 1 0.11 130 2 83 4 8 <1 <1 <1 1 1 1 0.19 133 1 76 1 3 <1 6 1 <1 10 1 nd 130 3 72 5 15 <1 2 <1 1 3 1 0.02 129 1 71 2 14 nd 9 <1 <1 <1 <1 1.62
* The accuracy of the C analyses with the used technique is limited, the C content is therefore semi-quantitative. nd=not detectable.
The Pb content of the selected organic rich particles varies from not detectable to 1.62 wt %. In more than half of the measured organic rich particles the Pb content was not detectable.
Sample 77, Echt Susteren
An element map of soil Sample 77 (Echt Susteren) is given in Figure A15.
Figure A15: Element map of soil Sample 77 (red=Pb; green=P; blue=Si; yellow=Pb+P; purple=Pb+Si; light blue=P+Si).
Figure A15 shows that Pb containing particles are finely dispersed throughout a silicate rich matrix (mainly sand). The particles are in general <10 μm in diameter, with some particles measuring up to 20 μm in diameter.
The diameters and chemical compositions of the representative Pb phases in Sample 77 (Echt Susteren) are presented in Table A30.
Table A30: Diameter and chemical composition (in wt %) of representative Pb phases in Sample 77 (Echt Susteren).
Photo Point Diameter
(μm) Al2O3 SiO2 P2O5 S Cl CaO Fe2O3 Pb Pb phase
135 1 ? <1 <1 <1 <1 <1 3 1 95 Pb, Pb oxide or Pb carbonate 136 1 40 <1 <1 <1 <1 <1 11 1 65 Ca-P 137 1 20 8 25 <1 1 <1 <1 <1 64 Pb glass/glaze 138 1 20 5 35 <1 <1 <1 <1 <1 52 Pb glass/glaze 139 1 55 7 36 <1 <1 <1 1 1 47 Pb glass/glaze 140 1-5 250 10-38 14-59 0-1 nd <1 0-5 1-7 7-32 Pb glass/glaze
When primary Pb phases dissolve, dissolved Pb can adsorb to organic matter. The chemical composition of selected organic rich particles in Sample 77 (Echt Susteren) is given in Table A31.
Table A31: Chemical composition (in wt %) of selected organic rich particles in Sample 77 (Echt Susteren). Photo Point C* Al2O3 SiO2 P2O5 S Cl K2O CaO Fe2O3 Pb
139 3 86 2 7 <1 nd 1 <1 1 1 nd 136 3 68 7 18 <1 <1 <1 1 1 3 nd
* The accuracy of the C analyses with the used technique is limited, the C content is therefore semi-quantitative. nd=not detectable.
There were hardly any organic matter particles found with a SiO2 content <20%. The Pb content of
Appendix 8: SEM photos
Sample 1: Schoonhoven
Photo 1. Photo 2. Photo 3. Photo 4.
Photo 5. Photo 6.
Sample 11: Utrecht
Photo 8. Photo 9.
Sample 17: De Rijp
Photo 13b. Photo 14. Photo 15. Photo 16. Photo 17. Photo 18.
Photo 19. Photo 20.
Sample 21: Haarlem
Photo 24. Photo 25. Photo 26. Photo 27. Photo 28. Photo 29.
Photo 30. Photo 31.
Sample 27: Alkmaar
Photo 35. Photo 36. Photo 37. Photo 38. Photo 39.Sample 29: Leiden
Photo 40. Photo 41.
Sample 33: Delft
Photo 46. Photo 47. Photo 48. Photo 49. Photo 50. Photo 51.
Photo 52. Photo 53.
Sample 43: Den Haag
Photo 58. Photo 59. Photo 60. Photo 61. Photo 62. Photo 63.
Photo 64. Photo 65.
Sample 45: Rotterdam
Photo 67. Photo 68. Photo 69. Photo 70. Photo 71. Photo 72.
Photo 73. Photo 74.
Sample 51: Schiedam
Photo 76. Photo 77. Photo 78. Photo 79. Photo 80. Photo 81.
Sample 53: Groningen
Photo 84. Photo 85. Photo 86. Photo 87. Photo 88. Photo 89.
Sample 59: Zutphen
Photo 92. Photo 93. Photo 94. Photo 95. Photo 96. Photo 97.
Photo 98. Photo 99.
Sample 63: Nijmegen
Photo 102 Photo 103 Photo 104 Photo 105 Photo 106 Photo 107
Photo 108 Photo 109
Photo 114 Photo 115 Photo 116 Photo 117 Photo 118 Photo 119
Sample 69: Maastricht
Photo 121 Photo 122
Sample 71: Maastricht
Photo 124 Photo 125 Photo 126 Photo 127 Photo 128 Photo 129
Photo 130 Photo 131
Sample 77: Echt Susteren
Photo 135 Photo 136 Photo 137 Photo 138 Photo 139 Photo 140
RIVM
National Institute for Public Health and the Environment P.O. Box 1
3720 BA Bilthoven The Netherlands