Environmental risk limits for xylenes
Update of the 2009 reportRIVM Letter report 2014-0043 L.C. van Leeuwen │ C.E. Smit
Page 2 of 44
Colophon
© RIVM 2014
Parts of this publication may be reproduced, provided acknowledgement is given to: National Institute for Public Health and the Environment, along with the title and year of publication.
This is a publication of:
National Institute for Public Health and the Environment
P.O. Box 1│3720 BA Bilthoven The Netherlands www.rivm.nl/en L.C. van Leeuwen, C.E. Smit Contact: Els Smit
Centre for Safety of Substances and Products (VSP) els.smit@rivm.nl
This investigation has been performed by order and for the account of Ministry of Infrastructure and the Environment, within the framework of the project “Nationaal Stoffenbeleid”.
Publiekssamenvatting
Het RIVM doet voorstellen voor nieuwe risicogrenzen voor de stof xyleen in water, bodem en lucht. Aanpassing was nodig omdat er aanvullende gegevens beschikbaar waren en omdat de Europese methodiek om waterkwaliteitsnormen af te leiden, is veranderd.
Xyleen wordt gebruikt in brandstof voor motoren en als grondstof voor de productie van polyesterverbindingen. De stof komt voor in drie verschillende vormen (isomeren), die elk een iets andere chemische structuur hebben: ortho-, meta- en para-xyleen. Omdat de giftigheid van deze afzonderlijke isomeren van xyleen vergelijkbaar is, worden ze in dit rapport als een groep behandeld. Om te bepalen of de risicogrenzen worden overschreden, moeten daarom de
meetgegevens van alle drie de isomeren bij elkaar worden opgeteld. Op basis van deze totale hoeveelheid kan een conclusie worden getrokken.
De voorgestelde normen voor oppervlaktewater zijn inmiddels overgenomen door het ministerie van Infrastructuur en Milieu.
Abstract
RIVM proposes new risk limits for xylene xyleen in water, soil and air. Revision was needed because additional data have become available and because of changes in the European methodology for deriving water quality standards. Xylene is used in engine fuels and as a basis for the production of polyester. The chemical exists in three different chemical forms (isomers), each of which has a slightly different chemical structure: ortho-, meta- and para-xylene. Because these isomers have comparable ecotoxicity, they are considered as a group in this report. The summed concentrations of the three isomers should be used to draw conclusions on compliance of monitoring data with the standards. The proposed quality standards for surface water have been adopted by the Ministry of Infrastructure and the Environment.
Contents
1
Introduction ─ 11
1.1
Reasons for the update ─ 11
1.2
Environmental risk limits in the Netherlands ─ 11
1.3
Risk limits or quality standards ─ 13
1.4
Methodology ─ 14
1.5
Status of the results ─ 16
2
Substance identification, physico-chemical properties, fate and human toxicology ─ 17
2.1
Identity and use of m-, o- and p-xylene ─ 17
2.2
Physico-chemical properties ─ 18
2.3
Behaviour in the environment ─ 19
2.4
Bioconcentration ─ 19
2.5
Human toxicology ─ 19
2.6
Trigger values ─ 19
3
Toxicity data and derivation of risk limits for water ─ 21
3.1
Differences between isomers ─ 21
3.2
Derivation of the MAC-EQS ─ 25
3.3
Derivation of AA-EQS ─ 25
3.4
Derivation of the QSdw, hh ─ 25
3.5
Derivation of the NC ─ 25
3.6
Derivation of the SRC ─ 25
4
Derivation of risk limits for soil, groundwater and air ─ 27
4.1
Derivation of ERLS for soil ─ 27
4.2
Derivation of ERLs for groundwater ─ 27
4.3
Derivation of ERLs for air ─ 28
5
Conclusions ─ 29
References ─ 31
List of terms and abbreviations ─ 35
Appendix 1. Information on bioconcentration ─ 37
Summary
In this report, updated environmental risk limits (ERLs) for surface water (freshwater and marine), soil, groundwater and air are derived for xylenes. Xylenes are listed as a specific pollutant in the Dutch decree on monitoring in the context of the Water Framework Directive (WFD). An update of the existing water quality standards was considered necessary because additional chronic ecotoxicity data have become available, which allow for a lower assessment factor than used previously. Changes in the methodology for deriving water quality standards under the WFD were implemented as well. The proposed standards for surface water have been adopted by the Ministry of Infrastructure and the Environment and will be used for the preparation of the next generation of river basin management plans under the WFD.
Xylene can be present in three forms: the isomers ortho-, meta- and
paraxylene. Based on an analysis of ecotoxicity data for the individual isomers, it is concluded that effect levels are similar. The differences between the
previously derived standards for the individual isomers were due to the different datasets rather than to differences in ecotoxicity. Therefore, the isomers are treated as a group in this report and the proposed ERLs apply to the isomers together.
The WFD-standards for surface water quality include the Annual Average EQS (AA-EQS) for long-term exposure and the Maximum Acceptable Concentration EQS (MAC-EQS) for short-term concentration peaks. A separate human-health based quality standard is derived for surface water that is used for drinking water abstraction (QSdw, hh). Next to these WFD-specific standards, Maximum
Permissible Concentrations (MPC) are derived for soil, groundwater and air, partly based on the aquatic dataset. For all compartments, the national specific risk limits Negligible Concentration (NC) and Serious Risk Concentration for ecosystems (SRC) are derived in addition. The derived risk limits are summarised in the table below:
Table 1 Derived AA-EQS, MAC-EQS, QSdw, hh, MPC, NC, and SRC values for
xylene. Values for water are given in two significant digits where appropriate.
Compartment Environmental Risk Limit
AA-EQS MAC-EQS NC SRC
Freshwater [µg/L] 17 244 0.17 872
Marine water [µg/L] 1.7 49 0.020 872
Surface water [µg/L] (drinking water abstraction)
500 MPC NC SRC Soil [µg/kg dwt] 229 - 2.3 11600 Groundwater [µg/L] 17 - 0.17 872 Air [µg/m3] 870 - 8.7 - - = not applicable
1
Introduction
1.1 Reasons for the update
In this report, updated environmental risk limits (ERLs) for surface water (freshwater and marine), soil, groundwater and air are derived for xylenes. Xylenes are listed as a specific pollutant in the Dutch decree on WFD-monitoring (Regeling monitoring Kaderrichtlijn water). The current water quality standards are based on an RIVM report that was published in 2009 [1]. An update of that report was considered necessary for several reasons:
- The current chronic standards for water (2.44 and 0.24 µg/L for fresh and saltwater, respectively) were derived by applying a high assessment factor on the acute ecotoxicity data, because chronic ecotoxicity data were present for algae only. Meanwhile it was noted that valid ecotoxicity studies for
crustaceans have become available.
- Since the publication of the 2009-report, the guidance for deriving water quality standards under the Water Framework Directive (WFD) has been updated [2]. According to the new guidance, a lower assessment factor may be applied when deriving the risk limit for peak exposure of
non-bioaccumulating substances in water.
- In the 2009-report, separate ERLs were derived for the individual isomers, and for the xylenes as a group, while it was noted that the latter was most appropriate. The large differences in ERLs for the individual isomers were merely the result of differences in the datasets which led to different assessment factors. Because there is no need to present ERLs for the individual isomers, they are left out in this report.
- In the 2009-report, a provisional drinking water standard was used to derive a quality standard for surface water intended for drinking water abstraction. According to the WFD-guidance, the WHO guidelines for drinking water quality should be used.
1.2 Environmental risk limits in the Netherlands
Three types of ERLs are considered in the Dutch policy on substances: the Maximum Permissible Concentration (MPC), the Negligible Concentration (NC) and the Serious Risk Concentration (SRC). These ERLs are denoted as Maximaal
Toelaatbaar Risiconiveau (MTR), Verwaarloosbaar Risiconiveau (VR) and Ernstig Risiconiveau (ER), respectively, and are described as follows:
- Maximum Permissible Concentration (MPC) – defined in [3,4] as the standard based on scientific data which indicates the concentration in an environmental compartment for which:
1 no effect to be rated as negative is to be expected for ecosystems;
2a no effect to be rated as negative is to be expected for humans (for non-carcinogenic substances);
2b for humans no more than a probability of 10-6 per year of death
can be calculated (for carcinogenic substances).
- Negligible Concentration (NC) – the environmental concentration at which effects to ecosystems are expected to be negligible and functional
properties of ecosystems are safeguarded fully. It defines a safety margin which should exclude combination toxicity. The NC is derived by dividing the MPC by a factor of 100.
Page 12 of 44
- Serious Risk Concentration for ecosystems (SRCeco) – the environmental
concentration at which possibly serious ecotoxicological effects are to be expected. The SRCeco for water is valid for the freshwater and saltwater
compartment.
With the implementation of the WFD, the MPC for fresh- and marine surface water has been replaced with two quality standards to cover both long- and short-term effects resulting from exposure:
- a long-term standard, indicated as the annual average environmental quality standard (AA-EQS) and normally based on chronic toxicity data, and
- a short-term standard, referred to as a maximum acceptable
concentration EQS (MAC-EQS) which is based on acute toxicity data. The terms AA-EQS and MAC-EQS are used in the European priority substances directive 2013/39/EU1 and are indicated as ‘JG-MKN’ and ‘MAC-MKN’,
respectively2, in Dutch legislation based on the WFD. In addition, a quality
standard for surface water intended for drinking water extraction is derived (QSdw, hh). The WFD-standards are described as follows:
- Annual Average EQS (AA-EQS) – a long-term standard, expressed as an annual average concentration (AA-EQS) and normally based on chronic toxicity data which should protect the ecosystem agains adverse effects resulting from long-term exposure.
The AA-EQS should not result in risks due to secondary poisoning and/or risks for human health aspects. These aspects are therefore also
addressed in the AA-EQS, when triggered by the characteristics of the compound (i.e. human toxicology and/or potential to bioaccumulate). Separate AA-EQSs are derived for the freshwater and saltwater environment.
- Maximum Acceptable Concentration EQS (MAC-EQS) for aquatic ecosystems – the concentration protecting aquatic ecosystems from effects due to short-term exposure or concentration peaks. The MAC-EQS is derived for freshwater and saltwater ecosystems, and is based on direct ecotoxicity only.
- Quality standard for surface water that is used for drinking water
abstraction (QSdw, hh). This is the concentration in surface water that meets
the requirements for use of surface water for drinking water production. The QSdw, hh specifically refers to locations that are used for drinking water
abstraction.
The quality standards for water in the context of the WFD refer to the absence of any impact on community structure of aquatic ecosystems. Hence, long-term undisturbed function is the protection objective under the WFD, not the potential to recover after transient exposure.
1 Directive 2013/39/EU of the European Parliament and of the Council of 12 August 2013 amending Directives
2000/60/EC and 2008/105/EC as regards priority substances in the field of water policy.
Given the methodology and protection goals, the definition of the AA-EQS more or less equals that of the former MPC for water. However, the risk for predators due to secondary poisoning, and exposure of humans via fish consumption have now explicitly been integrated in the AA-EQS. For genotoxic substances, the WFD uses cancer probability of 10-6 per life in line with the recommendations in
the REACH-guidance [2,5]. As indicated above, the Dutch MPC is related to instead of 10-6 per year, which considered equal to 10-4 per life. Furthermore,
the MPC used to be compared with 90th percentile of the measured
concentrations, while under the WFD the annual average concentration is used for complicance checking.
Table 2 gives a summary of the risk limits used in Dutch environmental protection policy.
Table 2 Types of risk limits and exposure routes considered for the respective compartments. Compartments/routes indicated with * are subject of trigger values: derivation of risk limits depends on the characteristics of the compound.
Compartment Type of
risk limit
Route considered
air MPC
NC
humans via inhalation
soil
MPC NC
humans via consumption of vegetables, meat, milk* predatory birds / mammals via earthworms*
soil organisms
SRC soil organisms
groundwater
MPC NC
humans via drinking water groundwater organisms SRC groundwater organisms sediment* MPC NC SRC sediment organisms water AA-EQS NC
humans via fish consumption* predatory birds / mammals via fish* water organisms
MAC-EQS SRC
water organisms
QSdw, hh humans via drinking water
MPC = Maximum Permissible Concentration NC = Negligible Concentration
SRC = Serious Risk Concentration EQS = Environmental Quality Standard AA-EQS = Annual Average EQS
MAC-EQS = Maximum Acceptable Concentration EQS
QSdw, hh = Quality Standard for surface water intended for drinking water abstraction
1.3 Risk limits or quality standards
In the Netherlands, there has always been a clear distinction between
scientifically based advisory values, indicated as environmental risk limits, and the final regulatory values, indicated as environmental quality standards. Standards are set by the responsible ministeries primarily on the basis of a scientific advice, but other (socio-economic) aspects may be taken into account as well. It may happen that the final standard deviates from the scientifically based risk limit. Therefore, the national guidance documents and reports based thereon refer as much as possible to the derivation of risk limits, the word
Page 14 of 44
already been taken. However, special considerations are made for the water compartment. As indicated above, compliance check differs between the WFD water quality standards and the previously used MPC (MTR) values. To prevent confusion, the abbreviations MPC (and MTR) have been abandoned for the water compartment and the terminology of the WFD-guidance is followed instead. Still, although indicated as quality standards (EQS), the values that are derived in this report should be interpreted as being risk limits, in a sense that they are
scientific advisory values until approved as official standards by the responsible ministry.
1.4 Methodology
1.4.1 Water and sediment
The methodology for the derivation of quality standards for water and sediment is laid down in the European guidance document for derivation of environmental quality standards under the WFD [2]. This document is further referred to as the WFD-guidance. Due to the characteristics of xylenes, derivation of risk limits for sediment is not considered relevant according to the triggers of the WFD-guidance. Additional guidance for derivation of ERLs that are specific for the Netherlands, such as the NC and SRC, can be found in [6], further referred to as the INS-guidance. Similar to the WFD-guidance, the INS-guidance is based on the Technical Guidance Document (TGD), issued by the European Commission and developed in support of the risk assessment of new notified chemical substances, existing substances and biocides [7] and on the Manual for the derivation of Environmental Quality Standards in accordance with the Water Framework Directive [8]. The WFD-guidance also takes into account the most recent guidance developed under REACH [5].
1.4.2 Soil, groundwater and air
For derivation of ERLs for soil, groundwater and air, the INS-guidance is followed. As for water, the guidance for these other environmental
compartments builds on the Technical Guidance Document (TGD), issued by the European Commission and developed in support of the risk assessment of new notified chemical substances, existing substances and biocides [7].
1.4.3 Data sources
For the 2009-report, an online literature search was performed on TOXLINE (literature from 1985 to 2001) and Current Contents (literature from 1997 to 2007). The search resulted in approximately 110 references, of which more than 60 references were considered relevant. In addition to this, all references in the RIVM e-tox base and US EPA ECOTOX database were evaluated (an additional 30 references).
For the current report, an additional on-line literature search was performed via SCOPUS, available via http://www.scopus.com/ in December, 2013. For
information on coverage, see http://info.scopus.com/detail/what/. This search did not result in additional references from which an endpoint could be derived, neither did the US EPA database contain new studies. The public REACH
summary dossiers for o-, m-, and p-xylene were consulted via the ECHA website (www.echa.europe.eu) and additional data for crustaceans and algae were retrieved.
1.4.4 Data evaluation
For the 2009-report, ecotoxicity studies were screened for relevant endpoints (i.e. those endpoints that have consequences at the population level of the test species) and thoroughly evaluated with respect to the validity (scientific
reliability) of the study. A detailed description of the evaluation procedure is given in the Annex to the EQS-guidance under the WFD. In short, the following reliability indices were assigned, based on [9]:
Ri 1: Reliable without restriction
’Studies or data … generated according to generally valid and/or internationally accepted testing guidelines (preferably performed according to GLP) or in which the test parameters documented are based on a specific (national) testing guideline … or in which all parameters described are closely related/comparable to a guideline method.’
Ri 2: Reliable with restrictions
’Studies or data … (mostly not performed according to GLP), in which the test parameters documented do not totally comply with the specific testing guideline, but are sufficient to accept the data or in which investigations are described which cannot be subsumed under a testing guideline, but which are nevertheless well documented and scientifically acceptable.’
Ri 3: Not reliable
’Studies or data … in which there are interferences between the measuring system and the test substance or in which organisms/test systems were used which are not relevant in relation to the exposure (e.g., unphysiologic pathways of application) or which were carried out or generated according to a method which is not acceptable, the documentation of which is not sufficient for an assessment and which is not convincing for an expert judgment.’
Ri 4: Not assignable
’Studies or data … which do not give sufficient experimental details and which are only listed in short abstracts or secondary literature (books, reviews, etc.).’
Citations
In case of (self-)citations, the original (or first cited) value is considered for further assessment, and an asterisk is added to the Ri of the endpoint that is cited.
The data of the 2009-report were used in this report without additional re-evaluation. The available studies are summarised in data tables, that are included as Appendices to this report. These tables contain information on species characteristics, test conditions and endpoints. Explanatory notes are included with respect to the assignment of the reliability indices.
1.4.5 Data treatment
Endpoints with Ri 1 or 2 are accepted as valid, but this does not automatically mean that the endpoint is selected for the derivation of ERLs. The validity scores are assigned on the basis of scientific reliability, but valid endpoints may not be relevant for the purpose of ERL-derivation (e.g. due to inappropriate exposure times or test conditions that are not relevant for the Dutch situation).
For the xylene isomers, fast volatilisation puts special demands on the way toxicity tests are performed. This implies that in some cases endpoints were not
Page 16 of 44
considered reliable, although the test was performed and documented according to accepted guidelines. When xylene concentrations were not monitored in an open test system, a Ri of 3 was attributed to the study.
After data collection and validation, toxicity data were combined into an aggregated data table with one effect value per species according to the guidance. When for a species several effect data were available, the geometric mean of multiple values for the same endpoint was calculated where possible. Subsequently, when several endpoints were available for one species, the lowest of these endpoints (per species) is reported in the aggregated data table. Geometric means were calculated with unrounded figures, the aggregated data are presented in three digits where underlying data allow, otherwise in two. 1.5 Status of the results
The results presented in this report have been discussed by the members of the scientific advisory group for standard setting in the Netherlands
(Wetenschappelijke Klankbordgroep normstelling water en lucht). As indicated above, the ERLs in this report are scientifically derived values, based on (eco)toxicological, fate and physico-chemical data. They serve as advisory values for the Dutch Steering Committee for standard setting for water and air, which is appointed to set the final standards.
2
Substance identification, physico-chemical properties, fate
and human toxicology
2.1 Identity and use of m-, o- and p-xylene
The identity of the xylene isomers is presented in Table 3.
Table 3 Identity of m-, o-, and p-xylene. Data from [10]
Parameter Name or number
Chemical name 1,3-dimethylbenzene
Common/trivial/other name meta-xylene, m-xylol, 3-methyltoluene
CAS number 108-38-3 EC number 203-576-3 Molecular weight 106.165 Structural formula
CH
3CH
3 SMILES code Cc1cccc(C)c1Chemical name 1,2-dimethylbenzene
Common/trivial/other name ortho-xylene, o-xylol, 2-methyltoluene
CAS number 95-47-6 EC number 202-422-2 Molecular weight 106.165 Structural formula
CH
3CH
3 SMILES code Cc1ccccc1CChemical name 1,4-dimethylbenzene
Common/trivial/other name para-xylene, p-xylol, 4-methyltoluene
CAS number 106-42-3 EC number 203-396-5 Molecular weight 106.165 Structural formula
CH
3CH
3 SMILES code Cc1ccc(C)cc1Page 18 of 44
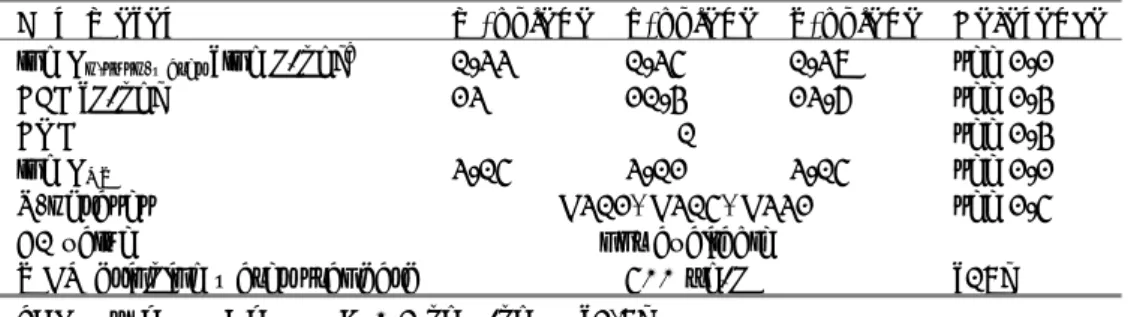
The following information on production and use is obtained from [11]: A large proportion of xylenes is used in motor fuel, due to gasoline containing about 10% xylenes. The capacity for production of pure xylene was 35,000,000 tonnes in Asia, the USA and the EU in 2010. The main part is used for further separation in the three isomers through distillation fractionated crystallisation. 82 % ends up in p-xylene for the production of phtalate compounds that are used for polyester, e.g. polyethylene terephthalate (PET). About 10% ends up as o-xylene used for synthesis of phthalic acid anhydride to polymers and
phthalates, and about 1 % becomes meta-xylene for isophthalic acid. All three isomers are raw materials for synthesis of special chemicals such as vitamins, pharmaceuticals, flavouring agents etc. About 10 % of the world production, is estimated to be used as the isomer mixture xylene. It is used as a solvent in a number of products where good solvent capacity and relatively fast evaporation are needed, such as paints, degreasing agents, glues, sealing agents and carcare products.
2.2 Physico-chemical properties
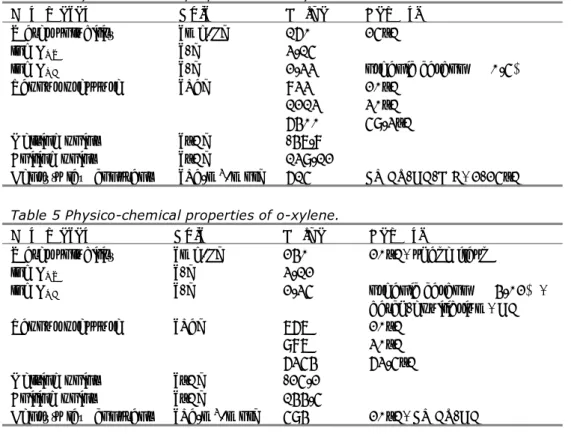
The physico-chemical properties of the xylene isomers are summarised in the tables below. Data originate from [10].
Table 4 Physico-chemical properties of m-xylene.
Parameter Unit Value Remark
Water solubility [mg/L] 160 25°C
log KOW [-] 3.15
log KOC [-] 2.33 organic carbon ≥ 0.5%
Vapour pressure [Pa] 833
1213 6400 20°C 30°C 59.3°C Melting point [°C] -47.8 Boiling point [°C] 139.12
Henry’s law constant [Pa.m3/mol] 615 EPICS-GC-FID, 2-25°C
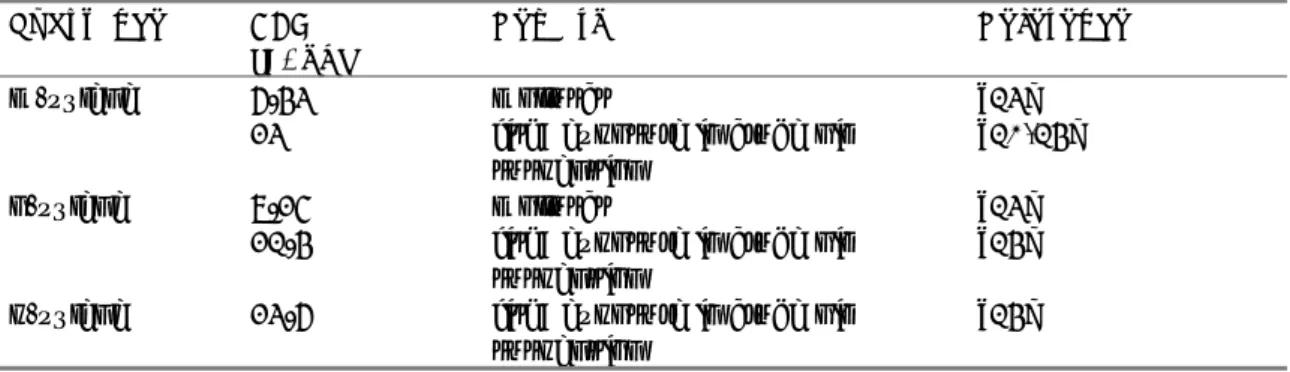
Table 5 Physico-chemical properties of o-xylene.
Parameter Unit Value Remark
Water solubility [mg/L] 240 20°C, shake flask
log KOW [-] 3.12
log KOC [-] 2.35 organic carbon ≥ 4.02%,
batch-equilibrium, GC
Vapour pressure [Pa] 767
987 6354 20°C 30°C 63.5°C Melting point [°C] -25.2 Boiling point [°C] 144.5
Table 6 Physico-chemical properties of p-xylene.
Parameter Unit Value Remark
Water solubility [mg/L] 191 20°C, shake flask
log KOW [-] 3.15
log KOC [-] 2.37 HPLC screening method
Vapour pressure [Pa] 787 20°C
Melting point [°C] 13.25
Boiling point [°C] 138.37
Henry’s law constant [Pa.m3/mol] 754 EPIC-GC-FID
2.3 Behaviour in the environment
Xylenes are not susceptible to hydrolysis [10]. Photolysis half-life is 9.6 hours for m-xylene and 30 hours for o-xylene [12]. In water, volatilisation seems to be the dominant removal process [10], with half-lives of about 3 hours at 1 m depth, wind speed 3 m/s, current 1 m/s.
2.4 Bioconcentration
An overview of the bioaccumulation data for xylenes is given in Table 7. Detailed bioaccumulation data are tabulated in Appendix 1. Based on these BCF-values, a default biomagnification factor (BMF) of 1 is assumed.
Table 7 Overview of bioaccumulation data for xylenes.
Substance BCF [L/kg]
Remark Reference
m-xylene 6.43 molluscs [13]
23 fish; exposure in crude oil
suspension
[10,14]
o-xylene 7.25 molluscs [13]
21.4 fish; exposure in crude oil
suspension
[14]
p-xylene 23.6 fish; exposure in crude oil
suspension
[14]
2.5 Human toxicology
The Tolerable Daily Intake (TDI) for xylenes is 150 μg/kg bw day [15]. Harmonised classification of the respective xylenes with respect to human toxicology under the CLP Regulation 1272/2008/EC is as follows: H312 (harmful in contact with skin), H315 (causes skin irritation), H332 (harmful if inhaled). The xylene isomers are included in the Community Rolling Action Plan under REACH [16], because of concerns about a.o. suspected carcinogenic, mutagenic or reprotoxic (CMR) properties. The substance evaluation, which will be carried out by Germany, is scheduled for 20153 and may eventually lead to an adapted
classification.
2.6 Trigger values
The collected properties for m-, o-, and p-xylene are compared to the triggers for ERL-derivation according to the WFD-guidance.
Page 20 of 44
Table 8 Collected properties for comparison to ERL triggers.
Parameter m-xylene o-xylene p-xylene Reference
log Kp,susp-water [log L/kg]a 1.33 1.35 1.37 see 2.2
BCF [L/kg] 23 21.4 23.6 see 2.4
BMF 1 see 2.4
log KOW 3.15 3.12 3.15 see 2.2
R-phrases H312, H315, H332 see 2.5
A1 value not available
WHO drinking water standard 500 µg/L [17]
a: KOC × fOC,susp; fOC,susp = 0.1 kgOC/kgsolid [2,7]
Since the log Kp,susp-water is < 3, derivation of the MPC for sediment is not
triggered and expression of the quality standards for water on the basis of suspended matter is not needed. The BCF is < 100 L/kg, assessment of secondary poisoning is not needed.
Derivation of the water quality standard for human consumption of fish is not triggered based on the current classification, but possible future classification as CMR would trigger such a derivation. However, based on the TDI and the reported BCF, the outcome would not be critical as compared to the derived values based on ecotoxicity (see section 3.3). Therefore, this route is not further evaluated.
3
Toxicity data and derivation of risk limits for water
3.1 Differences between isomers
The available ecotoxicity data are presented in Appendix 2. The dataset for marine species is too small for a meaningful comparison. There are no further indications of a difference in sensitivity between freshwater and marine organisms. Therefore, the fresh- and saltwater data are combined into one dataset. Very view valid chronic data are available, and a comparison between the respective isomers can only be made on the basis of the acute data. Table 9 shows the individual acute data for the most sensitive endpoint per species.
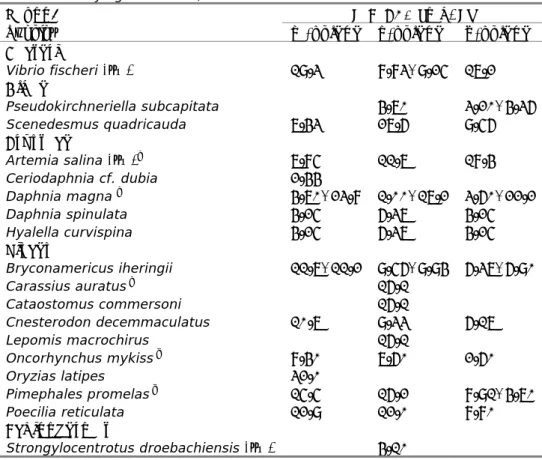
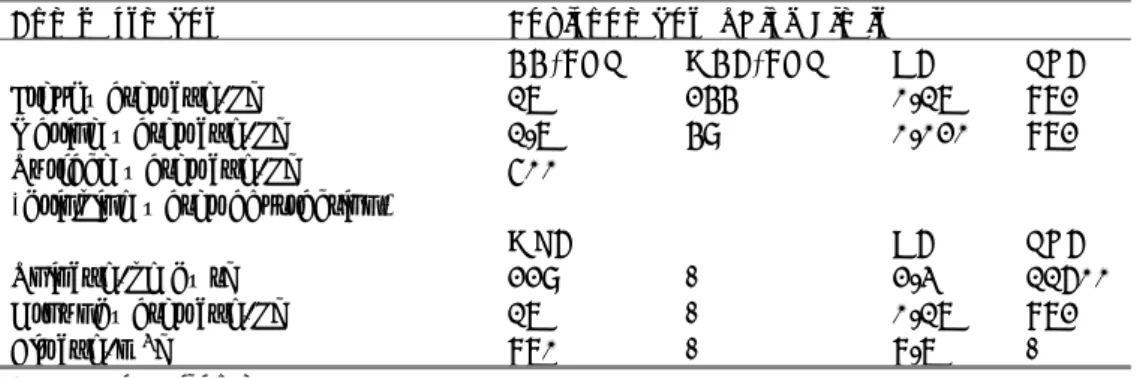
Table 9. Overview of valid acute ecotoxicity data for xylene isomers. Marine species are indicated with (sw). Data are rounded to three significant digits where underlying data allow, otherwise to two.
Taxon/ Species
L(E)C50 [mg/L]
m-xylene o-xylene p-xylene Bacteria Vibrio fischeri (sw) 19.3 8.83, 9.25 17.2 Algae Pseudokirchneriella subcapitata 4.70 3.20, 4.36 Scenedesmus quadricauda 7.43 27.6 9.56 Crustacea Artemia salina (sw)a 7.85 11.7 18.4 Ceriodaphnia cf. dubia 2.44 Daphnia magna b 4.70, 23.8 1.00, 17.2 3.60, 22.2 Daphnia spinulata 4.25 6.37 4.25 Hyalella curvispina 4.25 6.37 4.25 Pisces Bryconamericus iheringii 11.7, 11.2 9.56, 9.94 6.37, 6.90 Carassius auratus c 16.1 Cataostomus commersoni 16.1 Cnesterodon decemmaculatus 10.7 9.33 6.17 Lepomis macrochirus 16.1 Oncorhynchus mykiss d 8.40 7.60 2.60 Oryzias latipes 32.0 Pimephales promelas d 15.5 16.2 8.91, 4.70 Poecilia reticulata 12.9 12.0 8.80 Echinodermata Strongylocentrotus droebachiensis (sw) 4.10 a: 48-hours immobilisation b: 24-hours immobilisation
c: endpoint for relevant test duration (48 hours) included only d: data for 96 hours selected
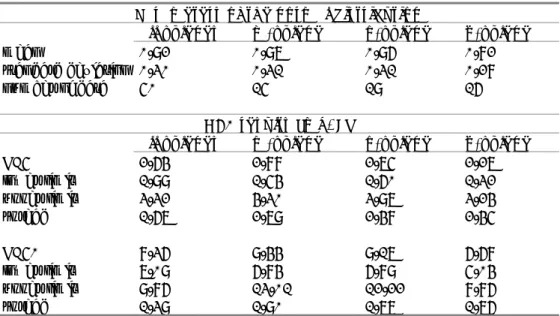
Using ANOVA (with unrounded data), there is no significant difference between the datasets for the three isomers. To compare the toxicity of the isomers, species sensitivity distributions (SSD) were made with ETX 2.0 [18], using the unrounded data for all xylenes together, or the separate data for the individual isomers. Note that these SSDs are made only for the purpose of comparing the datasets, and not for derivation of ERLs. Table 10 shows the results of the SSD calculations.
Page 22 of 44
Table 10. Characteristics of the Species Sensitivity Distributions (SSDs) constructed using the unrounded data for all xylenes, and for the m-, o- and p-isomer.
Parameters of the normal distribution
all xylenes m-xylene o-xylene p-xylene
mean 0.92 0.97 0.96 0.82
standard deviation 0.30 0.31 0.31 0.28
number of data 50 15 19 16
HC5 results [mg/L]
all xylenes m-xylene o-xylene p-xylene
HC5 2.64 2.88 2.75 2.27 lower limit 1.99 1.54 1.60 1.32 upper limit 3.32 4.30 3.97 3.24 spread 1.67 2.79 2.48 2.45 HC50 8.36 9.44 9.17 6.68 lower limit 7.09 6.84 6.89 5.04 upper limit 9.86 13.01 12.22 8.86 spread 1.39 1.90 1.77 1.76
Figure 1 shows the respective SSD-curves. As can be seen from the data in Table 10 and Figure 1, the SSD-results for the combined xylenes are similar to that of o- and m-xylene. The curves for o- and m-xylene are at the right hand side, indicating that the sensitivity towards these isomers is generally lower as compared to p-xylene. However, the lower tail of the distribution of the combined xylenes is determined by the low values for Ceriodaphnia dubia and
Daphnia magna obtained with o-xylene.
Figure 1. Species Sensitivity Distributions based on acute endpoints for all xylenes, and for the m-, o- and p-isomer. The X-axis represents acute L(E)50-values in mg/L, presented on a log-scale. The Y-axis represents the potentially affected fraction. 0 0.1 0.2 0.3 0.4 0.5 0.6 0.7 0.8 0.9 1 0.5 5 50
Po
te
n
ti
ally
A
ff
ec
te
d
F
ra
ct
io
n
L(E)C50 [mg/L]
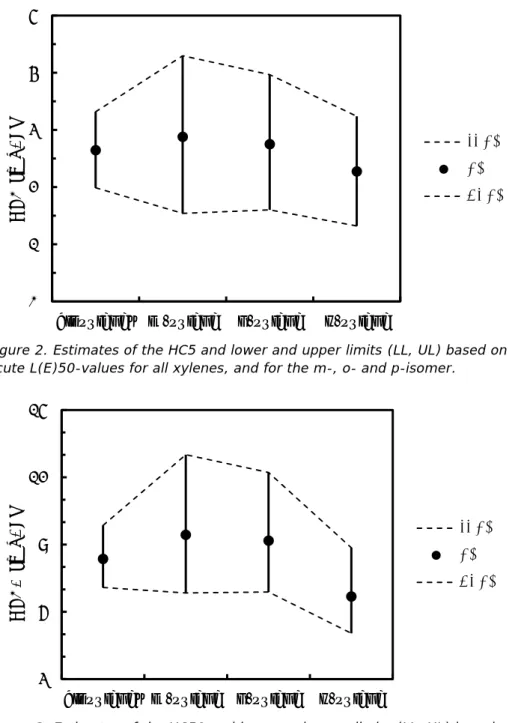
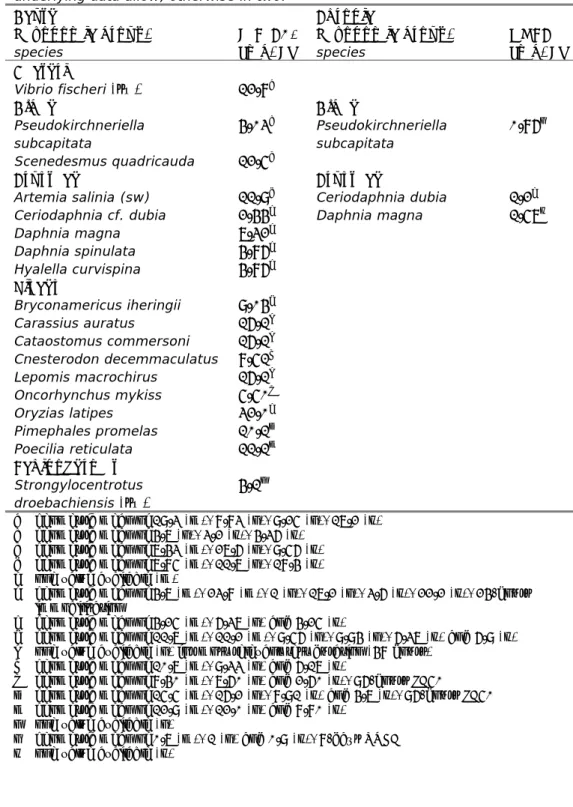
p-xylene m-xylene o-xylene xylenes combinedFigure 2 and 3 show the median estimates of the HC5 and HC50, respectively, with upper and lower limits. The HC5 for m-xylene is higher than the other values, but has a larger 95% confidence interval. The confidence intervals around the respective HC5-values overlap. The difference between the HC5 for all xylenes and the lowest HC5 for p-xylene is a factor of 1.2. The HC50-values of m-, o- and p-xylene are also ranked in decreasing order, but the difference between the highest HC50 for m-xylene and the lowest for p-xylene is relatively small (factor of 1.4). The difference between all xylenes and p-xylene is a factor of 1.3. The 95% confidence limits still overlap. Based on this analysis, it is considered justified to group the data and use them to derive a single value per species for xylene (Table 11).
Figure 2. Estimates of the HC5 and lower and upper limits (LL, UL) based on acute L(E)50-values for all xylenes, and for the m-, o- and p-isomer.
Figure 3. Estimates of the HC50 and lower and upper limits (LL, UL) based on acute L(E)50-values for all xylenes, and for the m-, o- and p-isomer.
0
1
2
3
4
5
all xylenes m-xylene
o-xylene
p-xylene
HC5 [mg/L]
LL HC5
HC5
UL HC5
3
6
9
12
15
all xylenes m-xylene o-xylene p-xylene
HC50 [mg/L]
LL HC50
HC50
UL HC50
Page 24 of 44
Table 11. Xylene: selected aquatic toxicity data for ERL derivation. Values represent lowest endpoint per species, test results from individual isomers are indicated in footnotes by (m), (o) or (p) for m-, o-, or p-xylene, respectively. See also Table 5. Marine species are indicated with (sw). Geometric means are calculated with unrounded values and expressed in three significant digits where underlying data allow, otherwise in two.
Acute Chronic Taxonomic group/ species L(E)C50 [mg/L] Taxonomic group/ species NOEC [mg/L] Bacteria Vibrio fischeri (sw) 12.8a Algae Algae Pseudokirchneriella subcapitata 4.03b Pseudokirchneriella subcapitata 0.86o Scenedesmus quadricauda 12.5c Crustacea Crustacea
Artemia salinia (sw) 11.9d Ceriodaphnia dubia 1.2e Ceriodaphnia cf. dubia 2.44e Daphnia magna 1.57p Daphnia magna 7.32f Daphnia spinulata 4.86g Hyalella curvispina 4.86g Pisces Bryconamericus iheringii 9.04h Carassius auratus 16.1i Cataostomus commersoni 16.1i Cnesterodon decemmaculatus 8.51j Lepomis macrochirus 16.1i Oncorhynchus mykiss 5.50k Oryzias latipes 32.0e Pimephales promelas 10.1l Poecilia reticulata 11.1m Echinodermata Strongylocentrotus droebachiensis (sw) 4.1n
a geometric mean of 19.3 (m), 8.83 (o), 9.25 (o), 17.2 (p) b geometric mean of 4.7 (o), 3.2 (p), 4.36 (p)
c geometric mean of 7.43 (m), 27.6 (o), 9.56 (p) d geometric mean of 7.85 (m), 11.7 (o), 18.4 (p) e one value available (m)
f geometric mean of 4.7 (m), 23.8 (m), 1 (o), 17.2 (o), 3.6 (p), 22.2 (p), 24-hours immobilisation
g geometric mean of 4.25 (m), 6.37 (o) and 4.25 (p)
h geometric mean of 11.7 (m), 11.2 (m), 9.56 (o), 9.94 (o), 6.37 (p) and 6.9 (p) i one value available (o) for most relevant test duration (48 hours)
j geometric mean of 10.7 (m), 9.33 (o) and 6.17 (p)
k geometric mean of 8.40 (m), 7.60 (o) and 2.60 (p), 96-hours LC50
l geometric mean of 15.5 (m), 16.2 (o), 8.91 (p) and 4.7 (p), 96-hours LC50 m geometric mean of 12.9 (m), 12.0 (o) and 8.80 (p)
n one value available (o)
o geometric mean of 0.7 (m), 1 (o) and 0.9 (p), 8-days NOEC p one value available (p)
3.2 Derivation of the MAC-EQS
3.2.1 Freshwater
The acute base set for xylene is complete, and the standard deviation of the log-transformed L(E)50-values is < 0.5. Therefore, an assessment factor of 10 can be used on the lowest EC50 value of 2.4 mg/L for Ceriodaphnia cf. dubia. This results in a MAC-EQSfw of 2.44 / 10 = 0.244 mg/L = 244 µg/L.
3.2.2 Saltwater
There is one endpoint for a specific marine species (echinoderm), and the MAC-EQSsw can be derived by putting an additional assessment factor of 5 on
the MAC-EQSfw. The MAC-EQSsw is 48.8 µg/L.
3.3 Derivation of AA-EQS
Since secondary poisoning and human consumption of fish are not relevant for derivation of the AA-EQS, only the QSfw, eco and QSsw, eco for direct ecotoxicity are
derived.
3.3.1 Freshwater
The acute base set is complete, chronic NOECs are available for algae and crustacea and the acutely most sensitive species is represented in the chronic dataset. Therefore, to derive the QSfw, eco an assessment factor of 50 is used on
the lowest NOEC-value of 0.86 mg/L for Pseudokirchneriella subcapitata. This results in an AA-EQSfw of 0.86 / 50 = 0.0172 mg/L = 17.2 μg/L.
3.3.2 Saltwater
The datasets for freshwater and marine species can be combined, but there is no chronic NOEC for a typically marine species. The QSsw, eco is therefore derived
using an additional assessment factor of 10 on the QSfw, eco. The AA-EQSsw is
1.72 μg/L.
3.4 Derivation of the QSdw, hh
For xylene, a drinking water standard of 500 µg/L is available [17]. According to the WFD, a substance specific removal rate should be considered to derive the QSdw, hh. At present, such information is not available and water treatment is not
taken into account. The QSdw, hh is 500 µg/L. It should be noted that
concentrations of the substance at or below this health-based guideline value may affect the appearance, taste or odour of the water, leading to consumer complaints [17].
3.5 Derivation of the NC
The Negligible Concentration (NC) is derived by dividing the AA-EQS by a factor of 100, resulting in an NCfw of 0.172 µg/L and an NCsw of 0.020 µg/L.
3.6 Derivation of the SRC
The base set is complete and NOEC values are available for algae and crustacea. The geometric mean of the combined L(E)C50 values is 8.72 mg/L, the
geometric mean value of the NOECs is 1.20 mg/L. The geometric mean of the acute values divided by 10 is smaller than the geometric mean of the NOEC values. Therefore, the SRCwater, eco is based on the geometric mean of the LC50
values using an assessment factor of 10. The SRCwater, eco is 0.872 mg/L =
4
Derivation of risk limits for soil, groundwater and air
4.1 Derivation of ERLS for soil
4.1.1 Derivation of the MPC
4.1.1.1 Derivation of the MPCsoil, eco
Because no experimental terrestrial ecotoxicity data for xylene are available, the equilibrium partitioning method is used ([6], section 3.7). Using the AA-EQS of 17.2 µg/L, a log Koc of 2.35 and a Henry's law constant of 651 Pa.m3/mol
(geometric mean of values for individual isomers), this results in a MPCsoil, eco of
229 μg/kg, expressed on the basis of dry soil with Dutch standard conditions (10% organic matter).
4.1.1.2 Derivation of the MPCsoil, hh
Using the TDI of 150 µg/kg bw per day, a Koc of 224 L/kg, Henry coefficient of 651 Pa.m3/mol, log Kow of 3.14 and water solubility of 194 mg/L (geometric
mean of values for individual isomers), the MPCsoil, hh is calculated as
1811 mg/kg dwt according to the methods in section 3.3.6 of the INS Guidance [6].
4.1.1.3 Selection of the MPCsoil
The MPCsoil is set to the lowest value of the routes included, and is 229 μg/kg
dwt soil at 10% organic matter.
4.1.2 Derivation of the NC
The NCsoil is derived by dividing the MPCsoil by a factor of 100, resulting in an
NCsoil of 2.3 µg/kg dwt soil. 4.1.3 Derivation of the SRC
The SRCsoil, eco is derived similar to the MPCsoil, eco using equilibrium partitioning.
With the SRCwater, eco of 0.872 mg/L, the SRCsoil, eco is 11.6 mg/kg dwt for Dutch
standard soil with 10% organic matter (11600 µg/kg dwt soil). 4.2 Derivation of ERLs for groundwater
4.2.1 Derivation of the MPC
4.2.1.1 Derivation of the MPCgrw, eco
Since groundwater-specific ecotoxicological data are not available for xylene, the AA-EQS for freshwater is used as a substitute [6]. The MPCgrw, eco is 17.2 µg/L.
4.2.1.2 Derivation of the MPCgrw, hh
The human health based MPC for groundwater is set equal to the QSdw, hh. The
MPCgrw, hh is 500 μg/L.
4.2.1.3 Selection of the MPCgrw
The MPCgrw is set to the lowest value of the routes included, and is 17.2 μg/L. 4.2.2 Derivation of the NC
The NCgrw is derived by dividing the MPCgrw by a factor of 100, resulting in an
NCgrw of 0.172 µg/L. This is about equal to the current target value for
Page 28 of 44
4.2.3 Derivation of the SRC
Since groundwater-specific ecotoxicological data are not available for xylene, the SRC for freshwater is used as a substitute. The SRCgrw, eco is 872 µg/L.
4.3 Derivation of ERLs for air
4.3.1 Derivation of the MPC
The MPCair is derived taking into account the human toxicological risk limits for
inhalation (Tolerable Concentration in Air). Ecotoxicological effects due to exposure via air is considered if data indicate that this is a relevant route, but this is not the case. A TCA of 870 μg/m3was derived in 2001 [15]. The MPC
air is
set to 870 μg/m3. 4.3.2 Derivation of the NC
The NCair is derived by dividing the MPCair by a factor of 100, resulting in an NCair
5
Conclusions
Updated risk limits for xylenes are derived for fresh and marine surface water, groundwater, soil and air. The update was performed because additional ecotoxicity information on water organisms was available which together with changes in methodology lead to substantially different values. Moreover, it was decided to present ERLs only for the xylenes as a group, because this is most relevant from an ecotoxicological point of view.
The proposed AA-EQS, MAC-EQS and QSdw, hh for surface water and the
additional national specific risk limits Negligible Concentration (NC), Maximum Permissible Concentration (MPC), and Serious Risk Concentration for ecosystems (SRC) are summarised in the table below.
Monitoring data reported for o-xylene in surface water indicate that concentrations of this isomer are far below the proposed water quality standards [20]. It should be noted that the sum limits (Table 12) only apply when all three isomers are monitored. Therefore, a definitive conclusion as to whether the new standards will be met can only be drawn on the basis of the summed concentration of the three individual isomers.
Table 12 Derived AA-EQS, MAC-EQS, QSdw, hh, MPC, NC, and SRC values for
xylene. Values for water are given in two significant digits where appropriate.
Compartment Environmental Risk Limit
AA-EQS MAC-EQS NC SRC
Freshwater [µg/L] 17 244 0.17 872
Marine water [µg/L] 1.7 49 0.020 872
Surface water [µg/L] (drinking water abstraction)
500 MPC NC SRC Soil [µg/kg dwt] 229 - 2.3 11600 Groundwater [µg/L] 17 - 0.17 872 Air [µg/m3] 870 - 8.7 - - = not applicable
References
Reference list includes references used in the appendices
1. Van Leeuwen LC. 2009. Environmental risk limits for xylene (m-xylene, o-xylene and p-xylene) Bilthoven, the Netherlands. National Institute for Public Health and the Environment. Report 601782011.
2. EC. 2011. Technical guidance for deriving environmental quality
standards. Common Implementation Strategy for the Water Framework Directive (2000/60/EC). Guidance Document No. 27. Brussels. European Communities.
3. VROM. 1999. Environmental risk limits in the Netherlands. A review of environmental quality standards and their policy framework in the Netherlands. The Hague, The Netherlands. Ministry of Housing, Spatial Planning and the Environment.
4. VROM. 2004. (Inter)nationale Normen Stoffen. Den Haag, The
Netherlands. Ministry of Housing, Spatial Planning and the Environment. 5. ECHA. 2008. Guidance on information requirements and chemical safety assessment Chapter R.7c: Endpoint specific guidance. Helsinki, Finland. European Chemicals Agency.
6. Van Vlaardingen PLA, Verbruggen EM, J. 2007. Guidance for the derivation of environmental risk limits within the framework of "International and national environmental quality standards for substances in the Netherlands" (INS). Bilthoven, the Netherlands. National Institute for Public Health and the Environment (RIVM). 7. EC. 2003. Technical Guidance Document on risk assessment in support
of Commission Directive 93/67/EEC on risk assessment for new notified substances, Commission Regulation (EC) No 1488/94 on risk assessment for existing substances and Directive 98/8/EC of the European
Parliament and of the Council concerning the placing of biocidal products on the market. Ispra, Italy. European Commission Joint Research Centre.
8. Lepper P. 2005. Manual on the Methodological Framework to Derive Environmental Quality Standards for Priority Substances in accordance with Article 16 of the Water Framework Directive (2000/60/EC). Schmallenberg, Germany. Fraunhofer-Institute Molecular Biology and Applied Ecology.
9. Klimisch HJ, Andreae M, Tillman U. 1997. A systematic approach for evaluating the quality of experimetnal toxicological and ecotoxicological data. Regulatory Toxicology and Pharmacology 25, 1-5.
10. Mackay D, Shiu WY, Ma KC. 2006. Physical-chemical properties and environmental fate. Handbook.: Chapman and Hall/ CRCnetBase. 11. KEMI. 2010. Information on substances. Xylene. [Accessed July 2014].
Available from:
http://apps.kemi.se/flodessok/floden/kemamne_eng/xylen_eng.htm. 12. EC/ECB. 2000. International Uniform Chemical Information Database
(IUCLID). European Commission/European Chemicals Bureau. 13. Nunes P, Benville PEJ. 1979. Uptake and depuration of petroleum
hydrocarbons in the manila clam, Tapes semidecussata Reeve. Bull Environ Contam Toxicol 21, 719-726.
14. Ogata M, Fujisawa K, Ogino Y, Mano E. 1984. Partition coefficents as a measure of bioconcentration potential of crude oil compounds in fish and shellfish. Bull Environ Contam Toxicol 33, 561-567.
Page 32 of 44
15. Baars AJ, Theelen RMC, Janssen PJCM, Hesse JM, Van Apeldoorn ME, Meijerink MCM, Verdam L, Zeilmaker MJ. 2001. Re-evaluation of human-toxicological maximum permissible risk levels. Bilthoven, the
Netherlands. RIM.
16. ECHA. 2013. Community rolling action plan (CoRAP) update covering years 2013, 2014 and 2015.
http://echa.europa.eu/documents/10162/13628/corap_2013_en.pdf. 17. WHO. 2011. Guidelines for drinking-water quality, fourth edition 2011.
Geneva, Switzerland. World Health Organization.
18. Van Vlaardingen PLA, Traas TP, Wintersen AM, Aldenberg T. 2004. ETX 2.0. A program to calculate Hazardous Concentrations and Fraction Affected, based on normally distributed toxicity data. Bilthoven, The Netherlands. National Institute for Public Health and the Environment. Report 601501028.
19. Van de Plassche EJ, Bockting GJM. 1993. Towards integrated environmental quality objectives for several volatile compounds.
Bilthoven, the Netherlands. National Institute for Publich Health and the Environment. Report 679101011.
20. Van Duijnhoven N. 2011. Inzicht in landelijke kwaliteitsdata 2006-2009. Achtergronddocument t.b.v. update stoffenlijst MR monitoring. Utrecht, Nederland. Deltares.
21. Herman DC, Mayfield CI, Inniss WE. 1991. The relationship between toxicity and bioconcentration of volatile aromatic hydrocarbons by the alga Selenastrum capricornutum. Chemosphere 22(7), 665-676. 22. Di Marzio W, Saenz ME. 2006. QSARS for aromatic hydrocarbons at
several trophic levels. Environ Toxicol 21, 118-124.
23. Ogata M, Miyake Y. 1978. Disappearance of aromatic hydrocarbons and organic sulfur compounds from fish flesh reared in crude oil suspension. Wat Res 12, 1041-1044.
24. Schultz TW, Bryant SE, Kissel TS. 1996. Toxicological assessment in
Tetrahymena of intermediated in aerobic microbial transformation of
toluene and p-xylene. Bulletin of Environmental Contamination and Toxicology 56, 129-134.
25. Herman DC, Inniss WE, Mayfield CI. 1990. Impact of volatile aromatic hydrocarbons, alone and in combination, on growth of the freshwater alga Selenastrum capricornutum. Aquat Toxicol 18(2).
26. Galassi S, Mingazzini M, Vigano L, Cesareo D, Tosato ML. 1988. Approaches to modeling toxic responses of aquatic organisms to aromatic hydrocarbons. Ecotoxicol Environ Saf 16, 158-169. 27. Rose RM, Warne MSJ, Lim RP. 1998. Quantitative structure-activity
relationships and volume fraction analysis for nonpolar narcotic
chemicals to the australian cladoceran ceriodaphnia cf. dubia. Archives of Environmental Contamination and Toxicology 34, 248-252.
28. MacLean MM, Doe KG. 1989. The comparative toxicity of crude and refined oils to daphnia magna and artemia. Ottawa. Environment Canada.
29. Bobra AM, Shiu WY, Mackay D. 1983. A predictive correlation for the acute toxicity of hydrocarbons and chlorinated hydrocarbons to the water flea (Daphnia magna). Chemosphere 12, 1121-1129. Report nr. 9/10.
30. Zhao YH, He YB, Wang LS. 1995. Predicting toxicities of substituted aromatic hydrocarbons to fish by toxicities to Dahpnia magna or Photobacterium phosphoreum. Toxicological and Environmental Chemistry 51, 191-195.
31. Di Marzio W, Saenz ME. 2004. Quantitative structure-activity relationship for aromatic hydrocarbons on freshwater fish. Ecotoxicology and
Environmental Safety 59, 256-262.
32. Bridié AL, Wolff CJM, Winter M. 1979. The acute toxicity of some petrochemicals to goldfish. Water Research 13, 623-626.
33. Di Marzio W, Galassi S, Todeschini R, Consolaro F. 2001. Traditional versus WHIM molecular descriptors in QSAR approaches applied to fish toxicity studies. Chemosphere 44, 401-406.
34. Yoshioka Y, Ose Y. 1993. A quantitative structure-activity relationship study and ecotoxicological risk quotient for the protection from chemical pollution. Environ Toxicol Wat Qual 8, 87-101.
35. Könemann H. 1981. Quantitative structure-activity relationships in fish toxicity studies. Toxicology 19, 209-221.
36. Abernethy S, Bobra AM, Shiu WY, Wells PG, Mackay D. 1986. Acute lethal toxicity of hydrocarbons and chlorinated hydrocarbons to two planktonic crustaceans: the key role of organism-water partitioning. Aquatic Toxicology 8, 163-174.
37. Benville Jr PE, Korn S. 1977. The acute toxicity of six monocyclic
aromatic crude oil components to stiped bass (Morone saxatilis) and bay shrimp (Crago franciscorum). California Fish and Game 63, 204-209. 38. Kjorsvik E, Saethre LJ, Lonning S. 1982. Effects of short-term exposure
to xylenes on the early cleavage stages of cod eggs (Gadus morhua L.). Sarsia 67, 299-308.
39. Niederlehner BR, Cairns Jr J, Smith EP. 1998. Modeling acute and chronic toxicity of nonpolar narcotic chemicals and mixtures to Ceriodaphnia dubia. Ecotox Environ Saf 39, 136-146.
40. Holcombe GW, Phipps GL, Sulaiman AH, Hoffman AD. 1987.
Simultaneous multiple species testing: acute toxicity of 13 chemicals to 12 diverse freswater amphibian, fish and invertebrate families. Arch Environ Contam Toxicol 16, 697-710.
41. Dowden BF, Bennett HJ. 1965. Toxicity of selected chemicals to certain animals. Journal - Water Pollution Control Federation 37, 1308-1316. Report nr. 9.
42. Mattson VR, Arthur JW, Walbridge CT. 1974. Acute toxicity of selected organic compounds to fathead minnows. US EPA Report.
43. Hermens J, Busser F, Leeuwangh P, Musch A. 1985. Quantitive
structure-activity relationship and mixture toxicity of organic chemicals in photobacterium phosphoreum: the microtox test. Ecotox Environ Saf 9, 17-25.
44. Kafka Z, Puncochárová J, Hrebíková M, Kuras M. 1995. Determination of acute toxicity of chemical soil contaminants. Fresen. Environ. Bull. 4, 707-712.
45. Falk-Petersen I-B, Kjorsvik E, Lonning S, Moller Naley A, Synes LK. 1985. Toxic effects of hydroxylated aromatic hydrocarbons on marine embryos. Sarsia 70, 11-16.
46. Kauss PB, Hutchinson TC. 1975. The effects of water-soluble petroleum components on the growth of Chlorella vulgaris beijerinck. Environ. Pollut. 9, 157-174.
47. Juchelka CM, Snell TW. 1994. Rapid toxicity assessment using rotifer ingestion rate. Archives of Environmental Contamination and Toxicology 26, 549-554.
48. Oldersma H, Van Dijk NRM, Hanstveit AO. 2004. Determination of the effect of p-xylene (CAS#106-42- 3) on the growth of the fresh water green alga Selenastrum capricornutum. (Guidelines: OECD 201 and EU C.3). Zeist, the Netherlands. TNO. Report V5819/01.
Page 34 of 44
49. Bjørnestad E. 2004. Daphnia magna reproduction test with p-xylene. Hørsholm, Denmark. Report 91337/449.
List of terms and abbreviations
AA-EQS Annual Average Environmental Quality Standard
BCF Bioconcentration Factor
BMF Biomagnification Factor
CLP Classification Labelling and Packaging of substances
CMR Carcinogenic, Mutagenic, Reprotoxic
ECHA European Chemicals Agency
ECx Concentration at which x% effect is observed
EQS Environmental Quality Standard
ER Ernstig Risiconiveau (= SRC)
ERL Environmental risk limit
foc, susp fraction organic carbon in suspended matter
HC5, HC50 Hazardous Concentration for 5%, 50% of the species
INS International and National Environmental Quality Standards for
Substances in the Netherlands
JG-MKN Jaargemiddelde milieukwaliteitsnorm (= AA-EQS)
Koc Organic carbon-water partitioning coefficient
Kow Octanol-water partitioning coefficient
LCx Concentration at which x% mortality is observed
MAC-EQS Maximum Acceptable Concentration for ecosystems
MAC-EQSfw Maximum Acceptable Concentration for ecosystems in freshwater
MAC-EQSsw Maximum Acceptable Concentration for ecosystems in the
saltwater compartment
MAC-MKN Maximum Aanvaardbare Concentratie milieukwaliteitsnorm (= MAC-EQS)
Marine species
Species that are representative for marine and brackish water environments and that are tested in water with salinity > 0.5 ‰.
MKN milieukwaliteitsnorm (= EQS)
MPC Maximum Permissible Concentration
MPCair Maximum permissible Concentration in air
MPCgrw, eco Maximum Permissible Concentration in groundwater, based on
ecotoxicity
MPCgrw, hh Maximum Permissible Concentration in groundwater, based on
human health
MPCsoil, eco Maximum Permissible Concentration in soil, based on ecotoxicity
MPCsoil, hh Maximum Permissible Concentration in soil, based on human
health
MTR Maximaal Toelaatbaar Risiconiveau (= MPC)
NC Negligible Concentration
NCair Negligible Concentration in air
NCfw Negligible Concentration in freshwater
NCgrw Negligible Concentration in groundwater
NCsoil Negligible Concentration in soil
NCsw Negligible Concentration in saltwater
NOEC No Observed Effect Concentration
QSdw, hh Quality standard for water used for abstraction of drinking water
QSfw, eco Quality standard for freshwater based on ecotoxicological data
QSsw, eco Quality standard for saltwater based on ecotoxicological data
REACH Regulation Registration, Evaluation, Authorisation of Chemicals EC/1907/2006
RIVM Rijksinstituut voor Volksgezondheid en Milieu (= National Institute for Public Health and the Environment)
Page 36 of 44
SRC Serious Risk Concentration for ecosystems
SRCeco Serious Risk Concentration for ecosystems
SRCfw, eco Serious risk concentration for freshwater ecosystems
SRCgrw, eco Serious Risk Concentration for ecosystems in groundwater
SRCsoil, eco Serious Risk Concentration for ecosystems in soil
SRCsw, eco Serious risk concentration for saltwater ecosystems
SRCwater, eco Serious Risk Concentration for ecosystems in water
SSD Species Sensitivity Distribution
TDI Tolerable Daily Intake
TGD Technical Guidance Document
VR Verwaarloosbaar Risiconiveau (= NC)
WFD Water Framework Directive (2000/60/EC)
properties purity type water salinity time conc.
[%] [mg CaCO3/L] [°C] [mg/L] [L/kgww]
Algae
Pseudokirchneriella subcapitata GC 23 12h 8.33 251.19 3 1,2 [21]
Scenedesmus quadricauda GC standard GC-FID S am 7.5 22 96h 37.65 2 3 [22] Crustacea
Daphnia spinulata < 24h GC standard GC-FID S am 7.8 95.8 20 48h 63.96 2 3 [22]
Hyalella curvispina 10 day GC standard GC-FID dw 8.3 126 21 96h 62.90 2 3 [22] Mollusca
Tapes semidecussata GC-FID CF 30‰ 14 8d 3.1 6.43 2 4 [13] Pisces
Anguilla japonica 130-180g GC-FID 20 10d 50 23.6 2 3 [23]
Carassius auratus GC-FID S? 1 14.79 4 5 [14] Notes
1 Recalculated from µg/kg 2 BTEX mixture used for exposure 3 Exposure in crude oil suspension
4 Water is filtered and sterilized using UV light, exposure 3.1ppm, analysis 3x/day 5 No data on test type or exposure time, logBCF=1.17
Table A1.2 Bioconcentration of o-xylene
Species Species Substance Analysed Test Test pH Hardness/ Temp Exposure Exp. BCF Ri Notes Reference
properties purity type water salinity time conc.
[%] [mg CaCO3/L] [°C] [mg/L] [L/kgww]
Algae
Pseudokirchneriella subcapitata GC 23 12h 8.33 218.78 3 1, 2 [21]
Scenedesmus quadricauda GC standard GC-FID S am 7.5 22 96h 9.76 2 3 [22] Crustacea
Daphnia spinulata < 24h GC standard GC-FID S am 7.8 95.8 20 48h 43.44 2 3 [22]
Hyalella curvispina 10 day GC standard GC-FID dw 8.3 126 21 96h 42.60 2 3 [22] Mollusca
Tapes semidecussata GC-FID CF 30‰ 14 8d 3.1 7.25 2 4 [13] Pisces
Anguilla japonica 130-180g GC-FID 20 10d 50 21.4 2 3 [23]
Carassius auratus GC-FID S? 1 14.13 4 5 [14] Notes
1 Recalculated from µg/kg 2 BTEX mixture used for exposure 3 Exposure in crude oil suspension
4 Water is filtered and sterilized using UV light, exposure 3.1ppm, analysis 3x/day 5 No data on test type or exposure time, logBCF=1.17
Daphnia spinulata < 24h GC standard GC-FID S am 7.8 95.8 20 48h 60.60 2 3 [22]
Hyalella curvispina 10 day GC standard GC-FID dw 8.3 126 21 96h 58.34 2 3 [22]
Pisces
Anguilla japonica 130-180g GC-FID 20 10d 50 23.6 2 3 [23]
Carassius auratus GC-FID S? 1 14.79 4 4 [14] Notes
1 Recalculated from µg/kg 2 BTEX mixture used for exposure 3 Exposure in crude oil suspension
Test type S = static; R = renewal; F = flow through; c = closed
Purity refers to purity of active substance or content of active substance in formulation; GC standard= gaschromatogrphy; ag = analytical grade; tg = technical grade
Test water am = artificial medium; dtw = dechlorinated tap water; dw = deionised/dechlorinated/distilled water; nw = natural water; rw = reconstituted water; rtw = reconstituted tap water; tw = tap water
T temperature
Ri Reliability index according to [9]. Valid studies (Ri 2 or higher) are considered for EQS-derivation, depending on relevance and considering notes on data treatment Table A.2.1 Acute toxicity of m-xylene to freshwater organisms
Species Species A Test Purity Test pH T Hardness Exp. Criterion Test Value Ri Notes Reference
properties type water as CaCO3 time endpoint
[%] [°C] [mg /L] [mg/L]
Protozoa
Tetrahymena pyriformis stat. phase S am 28 20 24h LC100 Mortality 399.60 3 3,17 [24] in [12] Algae
Scenedesmus quadricauda y S GC std. am 7.5 22 96h EC50 Growth 7.43 2 4,6,8 [22]
Pseudokirchneriella subcapitata log phase S am 7 8d EC50 Growth 3.90 3 7 [25] in [12]
Pseudokirchneriella subcapitata n Sc? GC std. 72h EC50 Growth 4.90 3 2,4,8 [26] Crustacea
Cerodaphnia cf. dubia y Sc >97 7.7 65.2 48h EC50 Immobilisation 2.44 2 9,10,11 [27]
Daphnia magna 24h y Sc am 7.2-8 20 250 48h LC50 Mortality 36.26 2 19 [28]
Daphnia magna juvenile (4-6 day) S 6-7 23 48h LC50 Mortality 9.56 4* [29] in [12]
Daphnia magna 4 - 6 days n Sc >97 dw 6.5 23 48h LC50 Mortality 9.55 3 12 [29]
Daphnia magna y Sc GC std. 24h IC50 Immobilisation 4.70 2 2,4,8 [26]
Daphnia magna 6-24h old Sc >95 dw 22 24h IC50 Immobilisation 23.77 2 13 [30]
Daphnia spinulata < 24h y S GC std. am 7.8 20 95.8 48h LC50 Mortality 4.25 2 4,8,14,15 [22]
Hyalella curvispina 10 day y S GC std. dw 8.3 21 82 96h LC50 Mortality 4.25 2 4,8,15 [22] Pisces
Bryconamericus iberingii 4.7 cm. 2.85g y Sc GC std. nw 7.9 20 98 96h LC50 Mortality 11.68 1 2,4,8,16 [22]
Bryconamericus iberingii 2.85g. 4.7cm y Sc GC std. 96h LC50 Mortality 11.23 2 2,4,8 [31]
Carassius auratus 96h LC50 Mortality 16.00 4 [12]
Carassius auratus 6.2 cm. y S tw 6-7 20 24h LC50 Mortality 16.00 2 1,4 [32]
Cnesterodon decemmaculatus y Sc GC std. dw 8.59 19.5 141.6 96h LC50 Mortality 10.72 2 2,4,5,8,18 [33]
Oncorhynchus mykiss y R GC std. 12 96h LC50 Mortality 8.40 2 2,5,8 [26]
Oryzias latipes R tw 7.2 20 ± 1 96 h LC50 Mortality 32.00 2 2 [34]
Pimephales promelas y Sc GC std. 46 96h LC50 Mortality 15.49 2 2,4,8 [33]
Poecilia reticulata y R GC std. 21 96h LC50 Mortality 12.90 2 2,5,8 [26]
Poecilia reticulata 2-3 m n R tw 22 25 14d LC50 Mortality 37.67 3 1 [35] Notes
1 System not closed, no prevention of volatilisation 8 Mean measured concentrations 15 Recalculated from 0.04 mM
2 According to OECD guidelines 9 According to US EPA standards 16 Recalculated from 0.11 mM
3 LC 100 value reported 10 GC quantification 17 Value exceeds water solubility
4 Concentrations measured at beginning and end of test 11 Recalculated from 23 µmol/L 18 Recalculated from log1/LC50 (mg/L)
5 Concentrations measured at renewals 12 Recalculated from mmol/m3 19 Geomean of 23.6 and 55.7
6 Recalculated from 0.07 mM 13 Recalculated from 3,74 log1/value (mol/L); 14h light, 10h dark
Artemia salina y Sc aw 8-8.3 21.5-23 30 48h EC50 Immobilisation 7.85 2 6 [28]
Artemia salina n Sc >97 20 30 24h LC50 Mortality 19.32 3 2 [36]
Crago franciscorum 1.8g y S >99 nw 16 25 96h LC50 Mortality 3.70 3 3 [37] Pisces
Gadus morrhua eggs S >98,5 sea 4-6 34 6h 40-50% increase of mortality Mortality 16-35 3 4 [38] in [12]
Morone saxatilis 6.0g y S >99 nw 16 25 96h LC50 Mortality 9.20 3 3 [37] Notes
1 Recalculated from log1/value (3.74 mol/L)
2 Methods in Wells et al 1982, value recalculated from mmoL/m3
3 >99% loss of concentration after 96h, GC analysis after 0, 24, 48, 72, 96 hours
4 Eggs were exposed 1,5 hour after fertilisation an the effect measured 17 days post-exposure 5 Geomean of 14.8, 12.2, 8.84, 8.52
6 Geomean of 8.54, 10.9, 7.09, 5.75
Table A.2.3 Chronic toxicity of m-xylene to freshwater organisms
Species Species A Test Purity Test pH T Hardness Exp. Criterion Test Value Ri Notes Reference
properties type water as CaCO3 time endpoint
[%] [°C] [mg /L] [mg/L]
Algae
Pseudokirchneriella subcapitata y Sc neutral 8d NOEC Growth 0.7 2 1 [25] Crustacea
Ceriodaphnia dubia y Rc >99 7.6 68.3 7d NOEC Reproduction 1.2 2 2 [39] Notes
1 16h/8h light/dark cycle; value based on measured concentrations; unclear when analysis is performed
2 Test according to US EPA Whole Effluent Testing Program; 16h/8h light/dark cycle; daily renewal, actual concentrations 86% of nominal; individual data provided; endpoint based on nominal concentration, recalculated from reported value of 11 μM.
Daphnia magna 24h y Sc am 7.8-8.1 19.5-22 250 48h LC50 Mortality 17.43 2 17 [28]
Daphnia magna 4 - 6 days n Sc 97 dw 6.5 23 48h LC50 Mortality 3.18 3 5 [29]
Daphnia magna y Sc GC std. 24h IC50 Immobilisation 1.00 2 1,2,4 [26]
Daphnia magna <24h y CF nw 7.39 17 44.7 48h LC50 Mortality 3.82 2 [40]
Daphnia magna dw LC50 Mortality >100. <1000 4 [41]
Daphnia magna 6-24h old Sc >95 dw 22 24h IC50 Immobilisation 17.22 2 9 [30]
Daphnia spinulata < 24h y S GC std. am 7.8 20 95.8 48h LC50 Mortality 6.37 2 2,4,6,10 [22]
Hyalella curvispina 10 day y S GC std. dw 8.3 21 82 96h LC50 Mortality 6.37 2 2,4,10 [22] Amphibiae
Xenopus laevis larvae Sc TW 20 48h LC50 Mortality 73.00 4 [12] Pisces
Bryconamericus iheringii 4.7 cm. 2.85g y Sc GC std. am 7.9 20 98 96h LC50 Mortality 9.56 1 1,2,4,11 [22]
Bryconamericus iheringii 4.7 cm. 2.85g y Sc GC std. 96h LC50 Mortality 9.94 2 1,2,4 [31]
Carassius auratus 6.2 cm. 3.3 g y S tw 6-7 20 24h LC50 Mortality 13.00 3 2,2 [32]
Carassius auratus 2.5g y CF nw 7.39 17 44.7 48h LC50 Mortality 16.10 2 12 [40]
Catostomus commersoni 2.4g y CF nw 7.39 17 44.7 48h LC50 Mortality 16.10 2 12 [40]
Cnesterodon decemmaculatus y Sc GC std. dw 8.59 19.5 141.6 96h LC50 Mortality 9.33 2 1,2,3,4,16 [33]
Lepomis macrochirus 1.1 y CF nw 7.39 17 44.7 48h LC50 Mortality 16.10 2 12 [40]
Oncorhynchus mykiss y R GC std. 12 96h LC50 Mortality 7.60 2 1,3,4 [26]
Oncorhynchus mykiss 13.1g y CF nw 7.39 17 44.7 48h LC50 Mortality 8.05 2 12 [40]
Pimephales promelas 0.3 y CF nw 7.39 17 44.7 48h LC50 Mortality 16.10 2 13 [40]
Pimephales promelas y Sc GC std. 96h LC50 Mortality 16.22 2 1,2 [33]
Pimephales promelas 4-6wks. 1.1-3.1 cm n S dw 18-22 96h LC50 Mortality 42.00 3 14 [42]
Poecilia reticulata n S 22 25 7d LC50 Mortality 35.00 3* [12]
Poecilia reticulata y R GC std. 21 96h LC50 Mortality 12.00 2 1,3,4 [26]
Poecilia reticulata 2-3 months n R tw 22 25 7d LC50 Mortality 35.15 3 15 [35] Notes
1 According to OECD guidelines 10 Recalculated from 0,06 mM
2 Concentrations measured at beginning and end of test 11 Recalculated from 0,09 mM
3 Concentrations measured at renewals 12 Water analysis 4x/day
4 Mean measured concentrations 13 Large differences in weight
5 Recalculated from mmol/m3 14 All concentratrions are nominal
6 Artificial pond water 15 Recalculated from 2.52 uM
7 Photoperiod 12 hours 16 Recalculated from Log1/LC50 (mg/L)
8 Recalculated from 0,26 mM 17 Geomean of 17.2, 19.6 and 15.7
![Table 3 Identity of m-, o-, and p-xylene. Data from [10]](https://thumb-eu.123doks.com/thumbv2/5doknet/3034728.7879/18.892.164.653.355.1165/table-identity-m-o-p-xylene-data.webp)