State of
Infectious
Diseases
in the Netherlands,
2014
State of Infectious
Diseases in the
Netherlands, 2014
P. Bijkerk
A.W.M. Suijkerbuijk
A.K. Lugnér
D.R.E. Nijsten
S.J.M. Hahné
Colophon
© RIVM 2015
Parts of this publication may be reproduced, provided acknowledgement is given to the ‘National Institute for Public Health and the Environment’, along with the title and year of publication.
Editors: P. Bijkerk1, A.W.M. Suijkerbuijk2, A.K. Lugnér1, D.R.E. Nijsten1, S.J.M. Hahné1.
Contact: paul.bijkerk@rivm.nl Chapter 1: Introduction P. Bijkerk1
Chapter 2: The state of infectious diseases in the Netherlands, 2014 D.R.E. Nijsten1
Chapter 3: Economic perspectives on infectious diseases in the Netherlands P. Bijkerk1, A.K. Lugnér1, A.W.M. Suijkerbuijk2
Chapter 4: Acknowledgements P. Bijkerk1
1. Centre for Infectious Disease Control, Epidemiology and Surveillance, RIVM, Bilthoven, the Netherlands. 2. Centre for Public Health and Health Services, Nutrition, Prevention and Health Services, RIVM, Bilthoven,
the Netherlands. ISSN: 1875-0885
This report has been prepared by the Epidemiology and Surveillance Centre, Centre for Infectious Disease Control, RIVM, by order and under the responsibility of the Ministry of Health, Welfare and Sports.
Publiekssamenvatting
Staat van Infectieziekten in Nederland
2014
De wereldwijde epidemie van ebola was de meest in het oog springende infectieziekte van dit jaar. In Nederland waren geen ebolapatiënten, maar is veel tijd besteed aan de voorbereiding om patiënten te kunnen verzorgen en verspreiding van het virus te voorkomen. Daarnaast was er de uitbraak van mazelen in Nederland, die in 2013 begon en eindigde in de eerste maanden van 2014. In die periode zijn verspreid over Nederland 2700 zieken gemeld en is 3,9 miljoen euro besteed om de epidemie te bestrijden. De grootste kostenposten waren de werkzaamheden van de betrokken GGD’en en de kosten van ziekenhuisopname van ernstig zieke patiënten. Dit blijkt uit de Staat van Infectieziekten in Nederland 2014, een jaarlijks rapport dat inzicht geeft in ontwik-kelingen van infectieziekten bij de Nederlandse bevolking. Daarnaast worden elk jaar de ontwikke-lingen op het gebied van de infectieziekten in het buitenland beschreven die voor Nederland relevant zijn. Met deze jaarlijkse uitgave informeert het RIVM beleidsmakers van het ministerie van Volksgezondheid, Welzijn en Sport (VWS). Het thema van dit jaar zijn de kosten voor de behandeling, preventie en bestrijding van de infectieziekten.
Om inzicht in de kosten te krijgen, zijn deze berekend voor de mazelenepidemie en voor de Salmonella Thompson-uitbraak door gerookte zalm in 2012. Voor deze twee is gekozen omdat ze omvangrijk waren en verspreid over heel Nederland zieken veroorzaakten. Bij de Salmonella Thompson-uitbraak zijn 1149 ziekte gevallen gemeld die met behulp van laboratoriumdiagnostiek werden vastgesteld en is 1,7 miljoen euro aan kosten gemaakt. De grootste kostenposten betroffen de inzet van de Nederlandse Voedsel en Warenautoriteit (NVWA) om de bron van de besmetting op te sporen en de kosten van zieken-huisopname van ernstig zieke patiënten.
In de studie staat ook beschreven hoe de kosten en de opbrengsten van interventies met elkaar kunnen worden vergeleken. Met kosteneffectiviteitstudies kan worden bepaald hoe budgetten het meest efficiënt voor de gezondheidszorg kunnen worden ingezet. In dit rapport zijn de meest gebruikte methoden van kosteneffectiviteitsstudies en bijbeho-rende uitkomstmaten toegelicht.
Synopsis
State of Infectious Diseases in the Netherlands,
2014
The global Ebola epidemic was the most striking infectious disease this year. In the Netherlands, no Ebola patients were identified, but much time was spent on preventative measures. In addition, there was an outbreak of measles in the Netherlands, which began in 2013 and ended in the first months of 2014. In this, 2,700 patients were reported and €3.9 million was spent to control the epidemic. The largest cost items were the work of the relevant public health services and the hospitalisation of seriously ill patients.
These facts are included in State of Infectious Diseases in
the Netherlands, 2014, an annual report that provides insight into trends in infectious diseases in the Dutch population. In addition, each year, developments in the field of infectious diseases in foreign countries that are relevant to the Netherlands are described. This annual publication provides information to policy makers at the Ministry of Health, Welfare and Sport (VWS). This year’s theme is the cost of the treatment, prevention and control of infectious diseases.
To provide relevant insight, these costs were
calculated for the measles epidemic and the outbreak of Salmonella Thompson in smoked salmon in 2012. These two major events were selected because they caused illness across the country. The costs of the
Salmonella Thompson outbreak, whose 1,149 cases were identified using laboratory diagnostics,
amounted to €1.7 million. The largest cost items were the work of the Dutch Food Safety Authority (NVWA) in tracing the source of the contamination and the hospitalisation of seriously ill patients.
The study also describes how the cost and health outcomes of different interventions can be compared. Cost-effectiveness studies can be used to determine the most effective use of health care budgets. In this report, the most common methods of measuring outcomes and cost-effectiveness are explained. Keywords: State of infectious diseases, infectious disease, economic evaluation, cost-effectiveness study, notifiable infectious disease
Contents
Publiekssamenvatting 5 Synopsis 5 1. Introduction 9 2. State of infectious diseases in the Netherlands, 2014 11
2.1 Introduction 11
2.2 Group A-diseases 11
2.3 Group B1-diseases 16
2.4 Group B2-diseases 16
2.5 Group C-diseases 16
2.6 Other relevant events related to non-notifiable infectious diseases 17
2.7 Literature 18
3. Economic perspectives on infectious diseases in the Netherlands 19
3.1 Introduction 19
3.2 Costs of treatment, prevention and control of infectious diseases in the Netherlands 20 3.3 Costs of national outbreaks: measles and Salmonella Thompson 22 3.4 Cost-effectiveness of interventions to prevent and control infectious diseases 25 3.5 Cost-effectiveness analysis performed at RIVM 28
3.6 Concluding remarks 30
3.7 Literature 31
1
Introduction
This is the tenth edition of the report on the State of Infectious Diseases in the Netherlands. This annual publication is written to inform policy makers at the Ministry of Health, Welfare and Sports (VWS) and at the Centre of Infectious Diseases at RIVM.
This State of Infectious Diseases in the Netherlands starts with a chapter on the main national and inter national infectious disease events that occurred in the Netherlands in 2014. This chapter includes the table with annual numbers of notified diseases in the Netherlands.
One particular topic is highlighted each year. This year the focus is being placed on the economic perspectives connected to infectious disease in the Netherlands. In the Netherlands, as in many countries, considerable effort is put into under-standing and prioritizing the demands placed on health care resources in order to help control growing health care costs. The economic burden of health problems on the population is assessed through cost-of-illness studies.
To respond to the growing interest in and demand for the economics of health care, we provide an overview in this year’s ‘State of Infectious Diseases’ (with examples) of economic analyses of interven-tions that target infectious diseases.
In this chapter, an overview of a RIVM cost-of-illness study is presented which is used to assess the costs of infectious diseases and prevention in the Netherlands. Next, in the assessment of costs, the recent national outbreaks of measles and Salmonella Thompson are summarized. Finally, there is a discussion of the different methodology used for economic evaluations of interventions conducted for the control and prevention of infectious diseases.
2.1 Introduction
In this chapter, we provide an overview of key infectious disease events in 2014 previously reported in the weekly reports written by the Dutch early warning committee (http://signaleringsoverleg. infectieziekten.eu/). These include both national and international events. Table 2.1 shows the number of notifications of all notifiable infectious diseases in the Netherlands by year of disease onset in the period 2007-2014. In Sections 2.2 to 2.6, we describe the most important events concerning mandatory notifiable diseases under the Dutch Public Health Act (1). Section 2.6 deals with notable occurrences of non-notifiable infectious diseases for the Netherlands. We have included information from the year 2015 in cases in which an outbreak or unusual event started in 2014 and continued into 2015. We have not included information about outbreaks or events that started in 2015.
2.2 Group A-diseases
Polio
In 2014, 359 patients with poliomyelitis were reported to the World Health Organization (WHO) globally (www.polioeradication.org). Of these, 340 (95%) were reported from the three countries where poliomyelitis is endemic: Pakistan (306), Afghanistan (28) and Nigeria (6). The other 19 patients were reported from Somalia (5), Equatorial Guinea (5), Cameroon (5), Iraq (2), Syrian Arab Republic (1) and Ethiopia (1). In 1988, the World Health Assembly committed to eradicating the disease. Since then, the number has considerably decreased from 350,000 cases in 1988, to 650 in 2011, 223 in 2012 and 416 in 2013. Of the three types of wild polioviruses, type 2 is considered to be eradicated since the last case was reported in 1999 and the last case of type 3 was reported in November 2012. The number of endemic countries decreased from over 125 in 1988 to just three by the beginning of 2012. On 27 March 2014, the WHO-SEAR (South East Asia Region) region was declared polio-free, as no wild poliovirus had been detected for the last three years.
2
The state of
Infectious Diseases
in the Netherlands,
2014
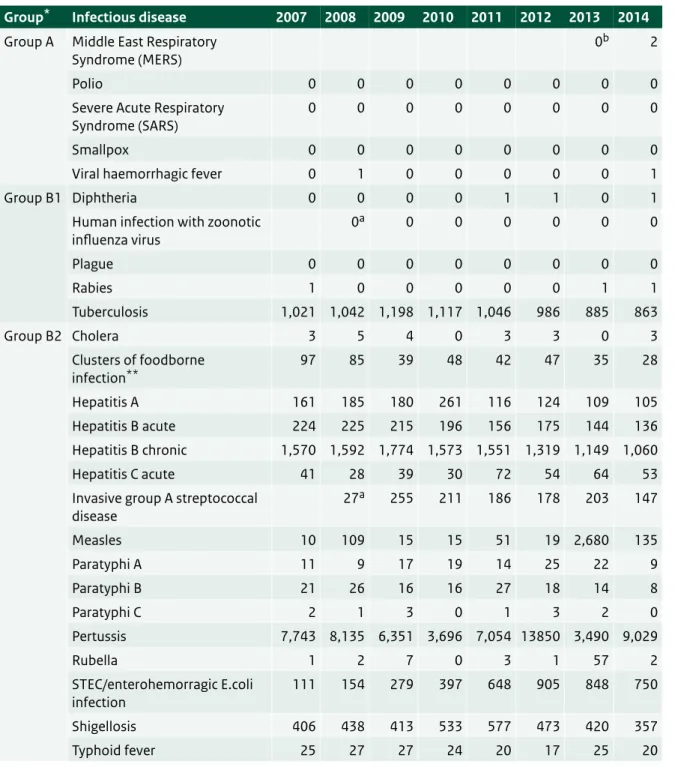
Table 2.1 Number of notifications of notifiable infectious diseases in the Netherlands by year of disease onset, 2007-20141.
Group* Infectious disease 2007 2008 2009 2010 2011 2012 2013 2014
Group A Middle East Respiratory
Syndrome (MERS) 0
b 2
Polio 0 0 0 0 0 0 0 0
Severe Acute Respiratory
Syndrome (SARS) 0 0 0 0 0 0 0 0
Smallpox 0 0 0 0 0 0 0 0
Viral haemorrhagic fever 0 1 0 0 0 0 0 1
Group B1 Diphtheria 0 0 0 0 1 1 0 1
Human infection with zoonotic
influenza virus 0 a 0 0 0 0 0 0 Plague 0 0 0 0 0 0 0 0 Rabies 1 0 0 0 0 0 1 1 Tuberculosis 1,021 1,042 1,198 1,117 1,046 986 885 863 Group B2 Cholera 3 5 4 0 3 3 0 3 Clusters of foodborne infection** 97 85 39 48 42 47 35 28 Hepatitis A 161 185 180 261 116 124 109 105 Hepatitis B acute 224 225 215 196 156 175 144 136 Hepatitis B chronic 1,570 1,592 1,774 1,573 1,551 1,319 1,149 1,060 Hepatitis C acute 41 28 39 30 72 54 64 53
Invasive group A streptococcal
disease 27 a 255 211 186 178 203 147 Measles 10 109 15 15 51 19 2,680 135 Paratyphi A 11 9 17 19 14 25 22 9 Paratyphi B 21 26 16 16 27 18 14 8 Paratyphi C 2 1 3 0 1 3 2 0 Pertussis 7,743 8,135 6,351 3,696 7,054 13850 3,490 9,029 Rubella 1 2 7 0 3 1 57 2 STEC/enterohemorragic E.coli infection 111 154 279 397 648 905 848 750 Shigellosis 406 438 413 533 577 473 420 357 Typhoid fever 25 27 27 24 20 17 25 20
Table 2.1 (continued) Number of notifications of notifiable infectious diseases in the Netherlands by year of disease onset, 2007-20141.
Group* Infectious disease 2007 2008 2009 2010 2011 2012 2013 2014
Group C Anthrax 0 0 0 0 0 0 0 0 Botulism 1 7 0 0 0 2 0 0 Brucellosis 6 5 3 6 1 3 6 1 Creutzfeldt-Jakob disease 15 15 20 27 27 30 29 22 Creutzfeldt-Jakob disease - Variant 0 1 0 0 0 0 0 0 Hantavirus infection 2a 7 19 7 23 4 36
Invasive Haemophilus influenzae
type b infection 0
a 16 31 20 22 18 19
Invasive pneumococcal disease
(in children 5 years or younger) 5
a 42 57 48 43 28 39 Legionellosis 325 339 256 473 315 308 310 369 Leptospirosis 42 29 22 29 29 44 27 102 Listeriosis 8a 56 69 87 70 74 92 MRSA-infection (clusters outside hospitals) 4 a 16 13 6 2 11 3 Malaria 229 221 235 244 242 199 166 282 Meningococcal disease 184 155 158 143 99 106 109 81 Mumps 25a 80 563 609 397 205 40 Psittacosis 53 79 81 73 70 45 53 41 Q fever 195 1,003 2,424 411 77 63 20 26 Tetanus 0a 1 2 5 2 1 0 Trichinosis 0 1 1 0 1 0 0 0
West Nile virus infection 0a 0 1 1 0 0 0
Yellow fever 0 0 0 0 0 0 0 0
1 Up until the year 2012, the allocation of a case to a specific year was based on the date of notification to the public health authorities. From 2012 onwards, the allocation of a case to a specific year has been based on the date of disease onset or, if unknown, the date of diagnosis or, if unknown, the date of notification. As a result, the numbers presented in this table differ from the numbers presented for the same years in tables from previous ‘State of Infectious Disease’ reports. The table was sourced from the Dutch notifiable infectious diseases database ‘Osiris’ on 04 June 2015. The number of reported cases is subject to change, as cases may be entered at a later date or retracted upon further investigation. The longer the time between the period of interest and the date this table was sourced, the more likely it is that the data are complete and the less likely they are to change.
* Notifiable infectious diseases in the Netherlands are grouped depending on the legal measures that may be imposed. ** Number of clusters, not number of cases.
a Not notifiable until 1 December 2008, so the number for 2008 is for one month only. b Not notifiable until 3 July 2013.
Despite these successes, the WHO decided in May 2014 that polio constituted a Public Health Emergency of International Concern (PHEIC) as there was a high spread of polio in a few countries during the low transmission season (i.e. January to April) in 2014, which was in stark contrast with the near-cessation of the international spread of polio in 2012 and 2013. Since 2012, the virus has re-emerged in Equatorial Guinea and Iraq, countries that were previously polio-free. Pakistan, Cameroon,
Equatorial Guinea and the Syrian Arab Republic were classified as wild poliovirus exporting countries. During 2014, wild poliovirus transmission in Pakistan escalated, having more reported cases than at any time in the past 14 years. The WHO determined that a coordinated international response was essential to prevent an exacerbation of the situation during the high-transmission season.
The declaration of a PHEIC by WHO did not change the Dutch policy regarding polio. Those travelling to endemic and epidemic countries are advised to get vaccinated. The vaccination status of refugees and asylum seekers coming to the Netherlands is checked and if necessary vaccinations are provided. In the Netherlands, the last poliomyelitis epidemic occurred in 1992-1993 and affected 71 patients who were all, but one, unvaccinated for religious reasons (2).
MERS-CoV
In September 2012, a new coronavirus was identified post-mortem in a patient suffering from acute pneumonia and subsequent renal failure in the Kingdom of Saudi Arabia (3). Internationally, this novel virus has since been named Middle East Respiratory Syndrome-coronavirus (MERS-CoV).
As of 4 June 2015, WHO has been notified of 1,202 laboratory-confirmed cases of infection with MERS-CoV, including 487 related deaths since the beginning of the outbreak (http://www.who.int/csr/ don/archive/disease/coronavirus_infections/en/). All cases have been directly or indirectly linked, through travel or residency, to four countries in the Middle East: Saudi Arabia, Qatar, Jordan, and the United Arab Emirates. The majority of cases (>85%) have been reported from Saudi Arabia.
In April and May 2014, a sharp rise in cases was observed, especially in Saudi Arabia and the United Arab Emirates, where several large health-care‐ associated outbreaks occurred. However, the upsurge in cases decreased from June on as
significant efforts were made to strengthen infection prevention and control measures (4).
There has been person-to-person transmission among people who had close contact with cases, such as by sharing a household or work place, or by caring for a patient in a health care setting. Several studies have found antibodies against MERS-CoV in dromedary camels, but not in other animals surveyed (5). Dromedary camels appear to get infected during their first year after birth (6). The large peak of cases in the spring of 2014 coincided with the weaning period of camel calves and the seasonal peaks in calf diarrhoea episodes. This has led to hypotheses around potential transmission routes, such as excretion in milk or faecal contami-nation of milk (7).
In May 2014, two Dutch patients were diagnosed with MERS-CoV infection. Both had visited Saudi Arabia and recovered after their return to the Netherlands (8, 9). 140 120 100 80 60 40 20 0 Week of onset Number of cases 53 51 49 47 45 43 41 39 37 35 33 31 29 27 25 23 21 19 17 15 13 11 9 7 5 3 1 2012 2013 2014 2015
Ebola
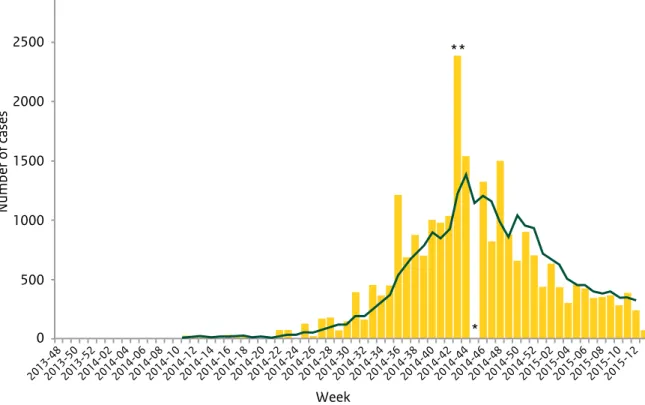
In mid-March 2014, the Ministry of Health in Guinea notified WHO about an outbreak of Ebola viral disease (EVD). By May 2014, the disease had spread to Sierra Leone and Liberia, and then subsequently spread to Nigeria, Senegal and Mali. The outbreak rapidly evolved and by August the WHO declared the Ebola outbreak in West Africa to be a Public Health Event of International Concern. Liberia was declared Ebola-free on 9 May 2015 after 42 days (two incubation periods) had passed since the last Ebola patient was buried. The total case count in Liberia since the start of the outbreak was 10,666, including 4,806 deaths. On 3 June 2015, two countries were still affected (Guinea and Sierra Leone). A total of 27,145 confirmed, probable and suspected cases of EVD were reported to the WHO, including 11,147 deaths, in the (previously) affected
countries. The number of infections among health care workers reported by the WHO in the three
most-affected countries since the start of the outbreak was 869, including 507 deaths. According to the latest WHO Situation Report, case numbers are declining in Guinea and Sierra Leone, but this drop in cases can only continue if control efforts are maintained.
A concurrent Ebola outbreak was declared on 26 August 2014 in the Democratic Republic of Congo (DRC). The outbreak resulted in a total of 66 cases and 49 deaths. On 21 November 2014, the DRC was considered to be Ebola-free. The two outbreaks were not connected.
In 2014, there was one medical evacuation of a confirmed Ebola-infected patient and two persons exposed to Ebola who then tested negative were repatriated to the Netherlands. Ebola viruses are highly transmissible by direct contact with infected blood, secretions, tissues, organs and other bodily fluids from dead or living infected persons (10). The principal mode of transmission in human outbreaks is
person-to-2013-482013-502013-522014-022014-042014-062014-082014-102014-122014-142014-162014-182014-202014-222014-242014-262014-282014-302014-322014-342014-362014-382014-402014-422014-442014-462014-482014-502014-522015-022015-042015-062015-082015-102015-12 3000 2500 2000 1500 1000 500 0 Week Number of cases
Figure 2.2 Distribution of confirmed cases of EVD by the week of reporting in Guinea, Sierra Leone, Liberia, Nigeria, Mali and Senegal, weeks 48/2013 to 13/2015 (Source: ECDC)
person transmission through direct contact with a symptomatic or dead EVD case. The incubation period is 2 to 21 days. Humans are not infectious until they develop symptoms. The first symptoms are the sudden onset of fever, fatigue, muscle pain, headache and sore throat. This is followed by vomiting, diarrhoea, rash, symptoms of impaired kidney and liver function and, in some cases, both internal and external bleeding. The current outbreak in West Africa is caused by Zaïre ebolavirus. Currently, three candidate vaccines in advanced stages of development are being studied in clinical trials (11).
2.3 Group B1-diseases
Rabies
In 2014, a Dutch citizen died of rabies. She had been bitten in her left hand by a stray dog in Chennai, India. The next day, she sought medical attention and received four anti-rabies vaccinations, yet it is unclear which vaccine and vaccination schedule was used. She did not receive human anti rabies immunoglobulins. Approximately eight weeks after the bite she developed pain in her left hand that progressed to her left arm and neck. Subsequently she developed hydrophobia, aerophobia and anxious behaviour. She was admitted to the hospital and the presence of rabies virus genotype 1 was confirmed in skin biopsies of the neck, cerebrospinal fluid and saliva. In the Netherlands, five people have been notified as having this disease in: 1962, 1996, 2008, 2013 and 2014.
2.4 Group B2-diseases
Measles
In 2013-2014, a large measles outbreak occurred in the Dutch orthodox Protestant community in the Netherlands. The outbreak started in May 2013 and continued until March 2014. In total, there were 2,700 reported cases, including 181 hospitalizations and 1 child died from complications of measles. Most cases involved orthodox Protestants (80%) and unvaccinated people (94%). Children aged 6 months with an increased risk of being infected with measles were provided early vaccination against measles. This was targeted at children who lived in communities with low vaccine coverage (<90%), and orthodox Protestant children in areas with a higher vaccine coverage. The case with the earliest date of onset of the rash during this outbreak had not travelled abroad and the initial source of infection remains unknown. In March 2014, a measles outbreak
occurred in British Columbia, Canada among the Netherlands Reformed Congregation with an estimated total of 375 cases. The genotype D8 found in the Canadian outbreak was associated, and there was an epidemiological link, with the outbreak in the Dutch Bible Belt. From Canada, the epidemic spread to the US.
Some clusters of measles cases were reported in 2014 in the Netherlands that were not associated with the epidemic in the Bible Belt and in which a different measles virus strain was found. Fourteen adults were infected who were linked to Schiphol Airport and travelling abroad. Three additional clusters occurred in The Hague. Seven cases were linked to a day care centre and eight cases to a children’s matinee. The third cluster occurred in a hospital with eleven cases: eight employees and three patients. Six of the employees were fully vaccinated.
A single dose of monovalent measles vaccine was included in the Dutch national immunization programme in 1976 for children aged 14 months. Since 1987, vaccination against measles, mumps and rubella in a two-dose schedule has been available to children at 14 months and nine years of age. Vaccination coverage is generally high in the Netherlands. In 2014, the MMR coverage was 96% for the first dose (birth cohort 2011) and 92% for the second dose (birth cohort 2003) (12). However, vaccination uptake is low in some specific groups for religious reasons (orthodox Protestantism), anthroposophical reasons, and in those with a critical attitude towards vaccination. While the latter two groups are scattered across the Netherlands, orthodox Protestants are a close-knit community consisting of about 250,000 persons, mostly living in an area that stretches from the south-west to the north-east of the country, the so-called Bible Belt. MMR vaccination coverage among orthodox Protestants was assessed in 2006-2008 and found to be about 60% (13).
2.5 Group C-diseases
Leptospirosis
In 2014, an increase in leptospirosis cases was observed. There was a marked increase in autocht-honous cases of leptospirosis, particularly during the second half of the year – from June until November – with a total of 60 cases. This represents a 4.6-fold increase in autochthonous cases compared with 2010-2013. This marked increase in humans coincided with an increase of leptospirosis in dogs. The majority of the autochthonous cases were linked to
recreational exposure, such as during swimming and fishing. A possible explanation for this increase is the preceding mild winter of
2013-2014, followed by the warmest year in three centuries, possibly enabling rodents and Leptospira to survive more easily. In addition, a slight increase of imported leptospirosis was observed in Dutch tourists, who mostly acquired the infection in Thailand.
An increase in leptospirosis cases was also observed in France, where the total number of reported cases doubled compared with 2013. Germany also noted a similar increase in autoch-thonous cases in 2014, which they likewise attributed to humid and warm weather.
The bacteria that cause leptospirosis are spread through the urine of infected animals, which can get into water or soil and can survive for weeks or months. Animals that carry the bacterium are cattle, pigs, horses, dogs, rodents and wild animals. In humans, leptospirosis can cause a wide range of symptoms, such as high fever, headache, chills, vomiting and diarrhoea, and can therefore be easily mistaken for other diseases.
Dengue
Dengue infections occur in more than 100 countries in the Asia-Pacific region, the Americas, the Middle East and Africa. Dengue incidence and prevalence are rising in endemic areas of tropical and subtropical regions. According to the Pan American Health Organization (PAHO), the number of dengue cases in the Americas, including the Caribbean, increased five-fold between 2003 and 2013. In 2014, a total of 1,173,248 suspected cases were reported in the Americas to the PAHO. Since July 2014, dengue has been a notifiable disease for Bonaire, Sint Eustatius and Saba (BES-islands). In 2014, no cases were reported on any of these islands, which partly had to do with the fact that the local reporting system was not yet fully operational. Dengue is a mosquito-borne disease, with Aedes
aegypti and Aedes albopictus as the primary mosquito vector. The clinical spectrum of the disease includes asymptomatic infection, mild dengue fever (DF), dengue haemorrhagic fever (DHF), or dengue shock syndrome (14).
Chikungunya
On 6 December 2013, the first documented
autochthone cases of chikungunya were reported by Sint Eustatius and Bonaire. Saba is the only country within the Dutch Caribbean that solely reported imported cases. Since the beginning of the outbreak and 27 March 2015, the Americas reported 1,310,925 suspected cases to PAHO, 24,542 of which were in the Non-Latin Caribbean (15). Since September 2014, chikungunya has been a notifiable disease for the BES-islands.
Chikungunya is a mosquito-borne viral disease caused by an alphavirus from the Togaviridae family. The virus is transmitted by the bite of
Aedes mosquitoes, primarily Aedes aegypti and
Aedes albopictus. The typical clinical signs of the disease are fever and severe arthralgia, which may persist for weeks, months or years after the acute phase of the infection. General complications include myocarditis, hepatitis, ocular and neuro-logical disorders (16). The detection and diagnosis of the disease can be challenging, especially in settings where dengue is endemic, because the diseases have similar symptoms.
Malaria
In 2014, an increase in malaria cases was reported in the Netherlands, after a steady decline in cases for the past 4 years. Of the 276 cases, most infections were acquired in Eritrea (65), Nigeria (27) and Ghana (26). Approximately 45% of the cases were immigrants and refugees visiting family in their home country. Other population groups that accounted for a large part of the malaria cases included tourists, immigrants and refugees, as well as foreigners who were temporarily or permanently living in the Netherlands. Exactly 4.4% of the malaria-cases used prophylaxis according to LCR guidelines.
2.6 Other relevant events related to
non-notifiable infectious diseases
Rotavirus infection
An unexpected drop in rotavirus detections was observed in the Netherlands in 2014, in the absence of rotavirus-vaccination. The estimated decrease in rotavirus detections and gastro-enteritis consultations in children under five in January-April 2014, compared with the same months in previous years, was 72% and 36%, respectively. Potential contributing mechanisms
tion programmes in the neighbouring countries (17). There is a risk of a compensatory hyperepidemic rotavirus season in the coming year(s) as more children under the age of two could be susceptible to rotavirus.
Rotavirus spreads by the faecal-oral route and therefore it mainly affects infants and young children. Children who are infected may have severe watery diarrhoea, often combined with vomiting, fever and abdominal pain.
2.7 Literature
1. van Vliet JA, Haringhuizen GB, Timen A, Bijkerk P. Changes in the duty of notification of infectious diseases via the Dutch Public Health Act. Nederlands tijdschrift voor geneeskunde. 2009;153.
2. Oostvogel PM, van Wijngaarden JK, van der Avoort HG, Mulders MN, Conyn-van Spaendonck MA, Rumke HC, et al. Poliomyelitis outbreak in an unvaccinated community in the Netherlands, 1992-93. Lancet. 1994;344(8923):665-70. 3. Zaki AM, van Boheemen S, Bestebroer TM,
Osterhaus ADME, Fouchier RAM. Isolation of a Novel Coronavirus from a Man with Pneumonia in Saudi Arabia. New England Journal of Medicine. 2012;367(19):1814-20.
4. WHO. WHO statement on the Sixth Meeting of the IHR Emergency Committee concerning MERS-CoV: World Health Organization; 2014 [updated 17 June 2014]. Available from:
http://www.who.int/mediacentre/news/ statements/2014/ihr-emergency-committee-merscov/en/.
5. ECDC. Factsheet for health professionals 2014 [updated August 20 2014; cited 2015 March 4]. Available from: http://www.ecdc.europa.eu/ en/healthtopics/coronavirus-infections/mers-factsheet/Pages/default.aspx.
6. Hemida MG, Perera RA, Wang P, Alhammadi MA, Siu LY, Li M, et al. Middle East Respiratory Syndrome (MERS) coronavirus seroprevalence in domestic livestock in Saudi Arabia, 2010 to 2013. Euro surveillance : bulletin Europeen sur les maladies transmissibles = European communi-cable disease bulletin. 2013;18(50):20659.
7. Gossner C, Danielson N, Gervelmeyer A, Berthe F, Faye B, Kaasik Aaslav K, et al. Human-Dromedary Camel Interactions and the Risk of Acquiring Zoonotic Middle East Respiratory Syndrome Coronavirus Infection. Zoonoses and public health. 2014.
8. Kraaij-Dirkzwager M, Timen A, Dirksen K, Gelinck L, Leyten E, Groeneveld P, et al. Middle East respiratory syndrome coronavirus (MERS-CoV) infections in two returning travellers in the Netherlands, May 2014. Euro surveillance : bulletin Europeen sur les maladies transmissibles = European Communicable Disease Bulletin. 2014;19(21).
9. Fanoy EB, van der Sande MA, Kraaij-Dirkzwager M, Dirksen K, Jonges M, van der Hoek W, et al. Travel-related MERS-CoV cases: an assessment of exposures and risk factors in a group of Dutch travellers returning from the Kingdom of Saudi Arabia, May 2014. Emerging Themes in Epidemiology. 2014;11(16).
10. Bausch DG, Towner JS, Dowell SF, Kaducu F, Lukwiya M, Sanchez A, et al. Assessment of the Risk of Ebola Virus Transmission from Bodily Fluids and Fomites. Journal of Infectious Diseases. 2007;196(Supplement 2):142-7.
11. ECDC. Rapid Risk Assessment - Outbreak of Ebola virus disease in West Africa. Stockholm:
European Centre for Disease Prevention and Control, 2015 30 January 2015. Report No.: Ninth update.
12. van Lier EA, Oomen PJ, Giesbers H, Conyn-van Spaendonck MAE, Drijfhout IH, Zonnenberg-Hoff IF, et al. Vaccinatiegraad
Rijksvaccinatieprogramma Nederland: Verslagjaar 2014. Bilthoven, the Netherlands: RIVM, 2014.
13. Ruijs WLM, Hautvast JLA, van Ansem WJC, Akkermans RP, van’t Spijker K, Hulscher MEJL, et al. Measuring vaccination coverage in a hard-to-reach minority. 2012;22(3):359-64. 14. San Martin JL, Brathwaite O, Zambrano B,
Solorzano JO, Bouckenooghe A, Dayan GH, et al. The epidemiology of dengue in the Americas over the last three decades: a worrisome reality. The American Journal of Tropical Medicine and Hygiene. 2010;82(1):128-35.
15. PAHO. Cases of Chikungunya Fever in the Americas, 2013-2015. 2015.
16. De Valk H, Leparc-Goffart I, Paty M-C, Reusken C, van den Kerkhof H, Braks M. Autochthonous cases of chikungunya fever on the Caribbean island of Saint Martin. 2013.
17. Hahne S, Hooiveld M, Vennema H, van Ginkel A, de Melker H, Wallinga J, et al. Exceptionally low rotavirus incidence in the Netherlands in 2013/14 in the absence of rotavirus vaccination. Euro surveillance: European Communicable Disease Bulletin. 2014;19(43).
3
Economic
perspectives on
infectious diseases
in the Netherlands
3.1 Introduction
In the Netherlands, as in many countries, conside-rable effort is put into understanding and prioritizing the demands on health care resources to help control growing health care costs. Total health expenditures have risen from €47 billion in year 2000 to €90 billion in 2011 (1). The economic burden of health problems on the population is assessed through cost-of-illness studies. This type of calculation provides insight into which diseases and in which health care sectors resources are being spent. At the same time, it is important that the health care provided and prevention measures taken are of high quality and are sufficiently efficient in order to improve both individual and public health. Economic evaluations in general and cost-effective-ness analyses specifically are prominent tools to evaluate the impact of a specific intervention against a specific disease on the associated costs and effects.
Ultimately, the purpose of cost-effectiveness analyses is to give advice on how to spend the available resources efficiently, which means that health outcomes can be maximized relative to the costs of the intervention.
To respond to the growing interest in and demand for the economics of health care, we provide an overview in this year’s ‘State of Infectious Diseases’ (with examples) of economic analyses of interven-tions that target infectious diseases.
We start by presenting an overview of a RIVM cost-of-illness study used to assess the costs of infectious diseases and prevention in the Netherlands (Paragraph 3.2). Secondly, the
assessments of the costs of two national outbreaks that occurred in recent years are summarized (Paragraph 3.3). The subsequent paragraphs deal with economic evaluations of interventions for the control and prevention of infectious diseases by discussing methodology and providing some
3.2 Costs of treatment, prevention
and control of infectious
diseases in the Netherlands
In this paragraph, the cost estimates from the Dutch cost-of-illness study are summarized. They are derived from a project assigning expenditures within the health care sector to different diseases and dimensions. The project was organized by the RIVM (www.costofillness.nl). The original study in 2003 was updated in 2005, 2007 and 2011. All costs related to the prevention and treatment of disease are included in these calculations. The assignment of costs to specific diseases is done by means of the International Classification of Diseases (ICD) of the World Health Organization (WHO). A limitation of this classification is the fact that underlying factors are not taken into account, such as infection or co-morbidity. The methods used and data selection for this study are complex and are described elsewhere (3).
3.2.1 Disease-specific overview of costs
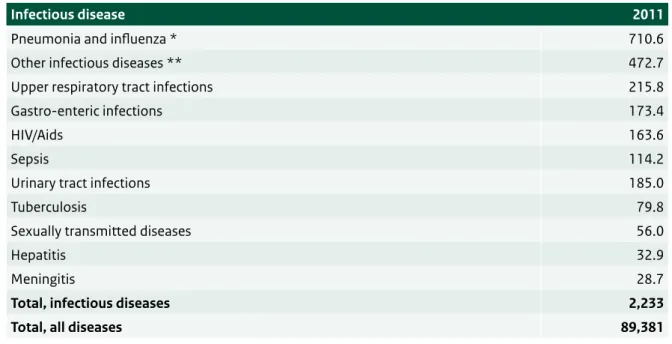
The total costs of health care in the Netherlands in 2011 were estimated at €89.4 billion. The expenditures on prevention and treatment of infectious diseases in the Netherlands were estimated at €2.2 billion, accounting for 2.5% of the total costs of health care (see Table 3.1).
Of all infectious diseases, pneumonia and influenza incurred the highest costs, the latter including the costs of the annual influenza vaccination programme. Within the resources spent on infectious diseases, most are spent on acute upper respiratory tract infections and gastro-enteric infections.
3.2.2 Domain-specific overview of costs
In this cost-of-illness study, disease-specific costs are also assigned to the various domains of health care: prevention, cure and care (see Table 3.2). When considering different health care sectors, there is a wide diversity in the percentage of costs attributable to infectious diseases. In the sector ‘public health and prevention’, 24.4% is attributable to infectious diseases, which is higher than in all other sectors. In sectors such as disability care, mental health care and welfare services, no costs were attributable to infectious diseases.
3.2.3 Costs of infectious diseases per capita
The calculation of average costs per capita in 2011 by age and gender provides another perspective on the costs of illness (see Figure 3.1). The expenditures for controlling infectious diseases are high (> €1,400 per
Table 3.1 Costs of infectious diseases, in million euros, in 2011. Source: www.costofillness.nl
Infectious disease 2011
Pneumonia and influenza * 710.6
Other infectious diseases ** 472.7
Upper respiratory tract infections 215.8
Gastro-enteric infections 173.4
HIV/Aids 163.6
Sepsis 114.2
Urinary tract infections 185.0
Tuberculosis 79.8
Sexually transmitted diseases 56.0
Hepatitis 32.9
Meningitis 28.7
Total, infectious diseases 2,233
Total, all diseases 89,381
* including costs of the national influenza vaccination programme
Table 3.2 Costs of infectious diseases per health care sector, in million euros, in 2011. Source: www.costofillness.nl
Health care sector All diseases Infectious
diseases Percentage (%)
Public health and prevention 1,068 261 24.4
Administration 3,195 251 7.9
Pharmaceuticals and medical devices 9,040 359 4.0
Primary health care 8,537 319 3.7
Hospital care 24,077 815 3.4
Nursing home care 16,396 208 1.3
Other health care providers 2,959 19 0.6
Ambulance services 506 2 0.4
Disability care 7,585 0 0
Mental health care 5,665 0 0
Welfare services 10,352 0 0 Total costs 89,381 2,233 2.5 0 200 400 600 800 1000 1200 1400 1600 1800 0-4 5-9 10-14 15-19 20-24 25-29 30-34 35-39 40-44 45-49 50-54 55-59 60-64 65-69 70-74 75-79 80-84 85-89 90-94 95+ Male Female Euros Age
Figure 3.1 Per capita costs of infectious diseases in 2011 in euros for men and women by age. Source: www.costofillness.nl
capita) for young infants (0-4 years), limited for people aged from 4 up to 60, and rise sharply in older age. This pattern reflects that of the average costs for all diseases. The respective backgrounds to the high cost for the youngest and the oldest people are very different. The highest costs are made before the age of 1 year and, in this group, the costs of vaccinations comprise more than 60% of the total costs. In the elderly, the high costs can be, for a large part, explained by hospitalizations for pneumonia and influenza. It is also evident that the costs for elderly men are higher than the costs for elderly women. This is because elderly men are more likely to be hospitalized for severe pneumonia than elderly women. These costs for infectious diseases must also be seen from the perspective of the overall costs of care. On average, the total costs were nearly €30,000 per person aged 85 years and older, €1,000 of which could be assigned directly to infectious diseases.
Cost-of-illness studies can, in this way, provide insight into the economic burden of different diseases. For infectious diseases, this information needs to be complemented with more detailed data on pathogen-specific disease burden and resource use in order to enable more efficient prevention and better treatment of infections and outbreak control.
3.3 Costs of national outbreaks:
measles and Salmonella Thompson
Understanding the costs of illness helps in planning and prioritizing long-term control activities. At the same time, infectious diseases are often characte-rized by poorly predictable outbreaks, in the face of which additional control efforts are launched to contain transmission. It is therefore important to calculate the specific costs related to outbreaks. Apart from estimates as illustrated in Paragraph 3.2, this needs to include the response activities of public health authorities. Such estimates of the total costs of controlling outbreaks can help in planning for future outbreaks and optimizing the allocation of public resources. This paragraph presents the estimated total costs of two important outbreaks that took place in recent years: a measles outbreak among orthodox Protestants in 2013 and the
nationwide outbreak of Salmonella Thompson caused by the consumption of contaminated smoked salmon in 2012. In these costing studies of outbreak control, costs were assessed at the individual and national levels through the quantification of measurable individual and public health costs.
Individual costs include health care costs and productivity losses, when adult patients are unable to work and/or when parents are absent from work while taking care of a sick child. The national institute is responsible for outbreak control, surveillance of the outbreak and communication at the national level. The PHSs hold consultation hours for vaccination and offer advice to local authorities, professionals and the general population.
3.3.1 The economic burden of the measles
outbreak
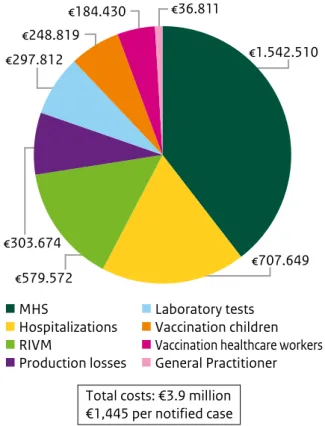
From May 2013 to March 2014, the Netherlands was affected by a large measles outbreak (4). The outbreak began in an orthodox Protestant community in the centre of the country and spread to regions with low vaccination coverage, since these communities opt out from childhood vaccination programmes on religious grounds (5). During the 2013 epidemic, 2,700 measles cases were reported; mostly involving children aged 5 to 14 years. 329 Patients developed complications including otitis media, pneumonia and encephalitis. One patient died from measles complications and 181 patients were hospitalized. Seven patients received treatment in an ICU. After treatment in an ICU, one patient with encephalitis stayed for eight months in a rehabilitation clinic. The main cost driver of health care costs was hospitaliza-tions, followed by the costs of laboratory tests. The costs for consulting the general practitioner and for treatment were much lower. An estimated €184,864 was attributed to production losses of men with symptomatic measles infections who were unable to go to work. Since a large proportion of women in these communities did not have paid work, it was assumed that productivity losses for women were due to the loss of informal care. These losses were calculated at €118,810. Furthermore, the costs of targeted vaccination campaigns were assessed. In 2013, 86% of hospitals in the Netherlands offered a serological test to employees to ensure they were sufficiently protected against measles. Employees identified as being at risk of measles infection were offered an MMR vaccination. On average, 80 serological tests led to 63 vaccinations per hospital. In total, 6,652 infants living in communities with vaccination coverage below 90% received a comple-mentary MMR vaccination. Among children aged 18 months-19 years, 6,948 received a catch-up MMR vaccination between July 2013 and March 2014. The costs of outbreak response coordination at the national and regional levels were evaluated (see Figure 3.2). Activities during this outbreak included the coordination of outbreak control at a national
level, enhanced surveillance and investigation of the outbreak, advice on targeted vaccination campaigns, and dealing with media attention. Total costs were estimated at €579,572. Response activities at the regional level concerned the registration and processing of measles cases, vaccination activities, advising and informing local authorities and profes-sionals and the general population. The total cost for all MHS was estimated to be €1,542,510.
Total costs: €3.9 million €1,445 per notified case
€707.649 €1.542.510 €579.572 €303.674 €248.819 €184.430 €36.811 MHS Hospitalizations RIVM Production losses Laboratory tests Vaccination children
Vaccination healthcare workers
General Practitioner €297.812
Figure 3.2 The costs of the measles outbreak per category in the Netherlands, 2013-2014.
In conclusion, the recent measles outbreak in the Netherlands was associated with substantial costs, summing up to approximately €3.9 million (with 2,700 notified cases €1,445 per notified case). The costs of outbreak response coordination were the most important cost driver at the local and national levels. This is probably due to the demands placed on professionals for information and advice from the public, and the registration of notified cases. Medical costs predominantly concerned costs for hospitalizations yet, as a percentage of total outbreak costs, were relatively low since only a
case were relatively low (6-8). Some other published international outbreaks with higher estimated costs per notified case, however, included a much more extensive contact tracing, which might explain part of the difference.
Furthermore, our assessed outbreak costs are an underestimation. First of all, data limitations did not allow for the estimation of the costs of normal human immunoglobulin, the vaccinations for adults and the vaccination of health care workers not working in a hospital. Subsequently, the Dutch measles outbreak also spread to Canada, the US and Belgium, resulting in public health response activities and costs in those countries. Finally, the underreporting of measles cases affects the estimated economic burden of the outbreak (9, 10). Regarding a previous measles outbreak in the Netherlands, the estimated true number of measles cases was approximately ten times higher than the cases notified in the surveillance system. Moreover, only 47% of all hospitalized cases in the previous outbreak were notified. If the underreporting of GP visits and hospitalizations was applied to the results presented here, the estimated total outbreak costs would be at least €0.8 million higher.
3.3.2 The economic burden of the
Salmonella
Thompson outbreak
In 2012, the Netherlands experienced the largest outbreak of salmonellosis ever recorded. The cause of the outbreak was smoked salmon processed at a single Greek production site of a Dutch fish producer. In total, 1,149 Salmonella cases due to Salmonella Thompson were identified and
laboratory-confirmed (11). Two hundred and thirty patients were hospitalized and four elderly patients were reported to have died due to the infection. In addition to the disease burden, acute gastroenteritis incurs conside-rable costs (12). The S. Thompson outbreak required a series of response activities from the RIVM and the Netherlands Food and Consumer Product Safety Authority (NVWA). Furthermore, it created intense attention in the media and among politicians. After noticing an increase in the number of S. Thompson cases in the Dutch laboratory surveillance network, the RIVM started an outbreak investigation to identify the source of infection. Additionally, during this outbreak, Dutch diagnostic laboratories outside the surveillance network were encouraged to submit
study. Where possible, supermarkets and patients were contacted and food samples were taken. Other outbreak response activities concerned the microbi-ological investigations both at the RIVM and at regional public health laboratories, advising the public and the administration of a questionnaire among cases by municipal health services, as well as activities related to extensive media attention. The most important cost category was hospitaliza-tion, caused by the severity and complications due to the infection (see Figure 3.3). Risk assessment, inspections and tracing back food products conducted by the NVWA were time consuming and also led to substantial costs. Production losses and laboratory investigations, likewise, led to significant costs. Costs for GP consultations and hospitaliza-tions were estimated to be €56,108 and €457,881, respectively. Test costs, entailing PCR, culture and susceptibility assessment, were estimated at €147,081, whereas productivity losses were approxi-mately €371,462. Outbreak investigation and outbreak management costs were the largest for NVWA (€398,733) for trace-back and risk assessments, followed by RIVM (€176,992), split more or less equally between laboratory costs and investigation
and communication costs. The MHS costs (€77,839) were spent on gathering information on cases and giving advice to local authorities and the public. Based on laboratory-confirmed cases only, the total cost of the outbreak was estimated at €1.7 million (with 1,149 laboratory cases; €1,467 per case). Also in this study, the measured outbreak costs are an underestimation. Data restrictions did not allow for the estimation of the long-term health care compli-cations of the S. Thompson infection. The cost analysis also did not include productivity losses for the Dutch fish company and supermarket chains after placing the production on hold and recalling contaminated smoked salmon from supermarkets. In the months after the outbreak, supermarket chains reported a revenue decrease, valued at €10 million, as consumers bought less salmon (personal communication M. Suurmeyer, Nielsen Research Company). In this figure, salmon sales at fish shops, at food markets and in restaurants are excluded. Furthermore, the costs of a nationwide evaluation of the S. Thompson outbreak performed by the Dutch Safety Board were not included in this study, nor were the continuing costs incurred by the NVWA after the acute outbreak phase. In addition, costs incurred by the Hellenic Food Authority, EFET, which was responsible for the inspections at the Greek production site, were not taken into account, nor were the costs incurred by other Food Safety Authorities involved in the international recall of the product.
A number of reasons for underestimating the incidence of the S. Thompson outbreak are plausible. Firstly, salmonellosis is not a notifiable disease in the Netherlands; clinicians are not legally obliged to report a case with salmonellosis.
Secondly, many persons experiencing the symptoms of gastroenteritis would not go to the doctor and, if they did, a laboratory test would not be performed in all circumstances. To estimate the incidence of such foodborne diseases, cases notified by the laboratories within the Dutch laboratory surveillance network were corrected with estimates from Dutch population studies (12, 13). Correcting for the difference between cases notified by the laborato-ries and estimates of infections among the population, an estimated 22,000 persons would
have had acute gastroenteritis with S. Thompson, which is about 20 times higher than the number of laboratory-confirmed cases. Adjusting the cost estimates for this underestimation, the total costs would be substantially higher (€11 million in total). In this figure, long-term complications are included. €457.881 €398.733 €371.462 €176.992 €147.081 €77.839 €56.108 Hospitalizations NVWA Production losses RIVM Laboratory tests MHS General Practitioner Total costs: €1.7 million €1,467 per notified case
Figure 3.3 The costs of the Salmonella Thompson outbreak per category in the Netherlands, 2012.
3.4 Cost-effectiveness of
interventions to prevent and
control infectious diseases
This paragraph starts with introducing the basic concepts of cost-effectiveness and summarizes some important aspects for interpreting results from cost-effectiveness analyses. Some characte-ristics of infectious diseases that strongly influence the results of a cost-effectiveness analysis are highlighted. The focus lies on recent cost-effectiveness analyses of the transmission and treatment of infectious diseases performed at RIVM. We refer to all possible preventive treatments (screenings and vaccinations) as “interventions”.
Before an intervention is implemented, it is essential to explore the full spectrum of the costs and the benefits (14-18). Within the Netherlands, The National Health Care Institute (Zorginstituut Nederland) publishes guidelines for health economic evaluations. These guidelines originate from pharmaco-economic analyses of
pharmaceuticals to be included in the Dutch reimbursement system (19). These guidelines are also relevant for the evaluation of infectious diseases, but there are some aspects that are specific to the evaluation of vaccines and vaccination programmes.
3.4.1 Basic concepts and the interpreta-
tion of a cost-effectiveness analysis
In a cost-effectiveness analysis, the costs and health outcomes of two interventions against one disease are compared. Frequently, a new inter-vention is compared with the currently used one. Since a new invention often comes with higher costs, the aim of the evaluation is to determine how much more health benefit the new interven-tion will generate, relative to the difference in the costs. The ratio that results from dividing the difference in costs between two interventions by the difference in health outcomes is called the incremental cost-effectiveness ratio (ICER). A lower ICER is more attractive than a higher ICER. Different methodologies to express and value the health outcome have resulted in different analysis techniques. Commonly, in a cost-effectiveness analysis the effect of the intervention on the health outcome is expressed in life-years gained
kind of analysis is less frequently implemented, mainly due to a reluctance to value life in monetary terms and the inherent difficulty of doing so. Over the years, the interpretation of the term cost-effectiveness analysis has widened to include cost-utility analysis. Here we will use the term cost-effectiveness in this broader sense. The QALY incorporates both the duration of remaining life as well as the health-related quality of life during those years. A QALY is calculated by assigning a health-related quality weight (value) to a specific health state, often between 0 and 1. The weight 1 is equivalent to perfect health, whereas 0 is assigned to death. The value for the health state is multiplied by the time spent in that health state to attain the QALYs. A major advantage of the QALY is that the effect of an intervention is expressed as a single number, making interventions against different types of health problems comparable. Due to the large variation in methodologies used to estimate the quality of life, caution still needs to be taken when comparing studies.
Comparing a new intervention with the current strategy can result in four different situations: (i) higher costs and a better health outcome; (ii) lower costs and a better health outcome; (iii) lower costs and a worse health outcome; and (iv) higher costs and a worse health outcome. These four situations correspond to the four quadrants in a cost-effectiveness plane (see Figure 3.4). The new intervention is attractive when it results in lower costs and in better health outcome (situation ii). The new intervention is not attractive when it results in higher costs and worse health outcome (situation iv). When the new intervention results in cost savings but also in a loss of health, it is not obvious what to do – the question then arises as to whether the cost savings would outweigh the health loss. When the new intervention results in higher costs and a better health outcome (situation i), the actual magnitude of the ICER for this new intervention is of interest. When the ICER falls below a threshold value for cost-effectiveness, we consider the intervention to be cost-effective. This threshold value reflects the societal willingness-to-pay for health outcomes.
-30 -20 -10 0 10 20 30 -120 -100 -80 -60 -40 -20 0 20 40 60 80 100 120 (iv) Higher cost QALY loss (iii) Lower cost QALY loss (i) Higher cost QALY gain (ii) Lower cost QALY gain Cost difference (million Euros) QALY difference
Figure 3.4 Hypothetical example of cost-effectiveness plane with a probabilistic sensitivity analysis
(green points) and a threshold value, here € 20,000 per QALY gained (red line). points is the result of drawing values at random
from the relevant distributions of the costs and the effects for the two alternatives, calculating the difference in costs and effects for each draw, and plotting the corresponding differences in the plane for each of these random draws. The threshold value can be illustrated as a line in the cost-effectiveness plane with a slope that is determined by its value. In Figure 3.4, the red line corresponds to a value of €20,000 per QALY gained and, in this case, approxi-mately 30% of the points fall below the red line. Since the threshold value determines whether an intervention is cost-effective or not, the proportion of the ICERs resulting from the random draws that fall below a certain value is useful in decision-making. The cost-effectiveness acceptability curve (CEAC) illustrates how the probability that an intervention is cost-effective increases as the threshold value is set higher (see Figure 3.5) (15, 20). The form of this curve is determined by the distribution of the points in the cost-effectiveness plane. In the CEAC illustrated here, it can be seen that there is a 75% probability for a new intervention to be cost-effective at a threshold value of €20,000 per QALY.
Another way of examining the uncertainty of the assumptions made is to compare the influence of specific variables in scenario analyses. Calculating the ICERs using alternative values for some chosen variables, for instance ‘other incidence of infection’ or a ‘reduced vaccine price’, can also be depicted in diagrams (Figure 3.6).
0%
20,000
Value of threshold (€ per QALY gained) 100% 50% 25% 75% Probability cost-e ffective 30,000 10,000 0
Figure 3.5 Hypothetical example of a cost-effective-ness acceptability curve (not related to Figure 3.4). The horizontal line shows a threshold value of €20,000 per QALY, indicating that in this case there is about 75% probability that the intervention would be cost-effective at this threshold value.
- 20.000 40.000 60.000 80.000 100.000 120.000 140.000 Lower vaccine price
Higher disease burden Higher incidence of disease Base case
Cost per QALY gained
Scenario
Figure 3.6 Hypothetical example of scenario analyses.
3.4.2 Features of cost-effectiveness
analyses
Herd immunity
A prominent feature in infectious disease control activities is the concept of herd immunity effects. This means not only that individuals are
protected, but also that transmission is reduced. Individuals that are not targeted themselves, therefore, have a lower risk of being infected. Dynamic transmission models are well-suited for estimating the spread of an infection or disease. Such models can also be used to estimate the effects of interventions against transmission and disease, although the strength of a model depends on the precision of the assumptions needed to build a model. When the economic part of the cost-effectiveness analysis is combined with a transmission model, the integrated model will enhance its usefulness in public health policy (21). The positive effect of herd immunity is not the only effect an intervention programme has on population level. Negative effects, e.g. replacement of subtypes of pathogens against which people are vaccinated, may also occur (16). Furthermore, an age shift in infections may occur in unvaccinated individuals of a higher age due to the vaccination of a cohort of infants. When an infection causes more severe disease in
adolescence or adulthood than in childhood, an intervention (such as vaccination) might even result in health losses at the population level if protection is insufficient to control transmission in these age groups.
Societal perspective
A cost-effectiveness analysis can be performed for different purposes. In general,
cost-effective-consequence, for whom the results are relevant. In the so-called societal perspective, all costs and effects must be included, regardless of who incurs the costs and who receives the benefits. This means not only that directly related costs such as medication and doctor visits count, but also that costs related to absenteeism from work
(production losses) due to illness and death should be included. Costs paid by the patient for non-prescription drugs and costs associated with travelling to receive treatment are also included. For infectious diseases, indirect costs in terms of production losses can be large, especially in cases involving childhood diseases which force working parents to be absent from work in order to care for small children. These productivity losses are important drivers of cost-effectiveness in many cost-effectiveness studies of infectious disease interventions. Other common perspectives are from the health care provider or from the health care financier (insurance perspective). In these cases, the costs for individual patients (e.g. medication paid by the patient) and for society (production losses) are not included.
Time horizon
Another important feature of economic evaluation is the application of a suitable time horizon. Sometimes even a lifetime time horizon might not be long enough to reveal intergenerational effects. If vaccination of one generation has implications for a next generation, these positive and negative effects also have to be included.
Discounting
Discounting is a well-established economic concept that is used to project the future costs and benefits of investments into a present value.
future costs are discounted at an annual rate of 4% and future health benefits at an annual rate of 1.5% (19). The implication of applying a lower discount rate for the benefits than the one used for the costs is that the ICER becomes more favourable. It is good practice to include a sensitivity analysis that
examines the sensitivity of the resulting ICER to the discount rates. For some vaccinations against diseases whose effect on health appears years after the vaccination is given, such as vaccination against hepatitis B and Human Papilloma virus to prevent development of cancers later in life, we can expect that the ICER is sensitive to discount rates. For other vaccinations that protect against more immediate illnesses, e.g. measles or rotavirus, discounting would have a smaller impact on the ICER.
3.5 Cost-effectiveness analyses
performed at RIVM
In this paragraph, the main results of four economic analyses of interventions against infectious diseases recently performed by RIVM are summarized. These studies have been initiated to inform policy decisions. The first three studies (pertussis vaccination strategies, Chlamydia screening, varicella vaccination) presented here are actually cost-utility studies presenting ICERs based on the QALY gain of intervention. The first estimation of the cost-effectiveness of pertussis vaccination is based on the reported incidence of pertussis in infants and adults. The next two examples, estimating the cost-effectiveness of Chlamydia screening and varicella vaccination were economic studies combined with transmission models that estimate the incidence of infections. The final study (Efficient testing policy at STI clinics) was somewhat different. Here, cost savings due to targeted screening rather than universal screening for sexually transmitted infections (STI) were estimated in terms of savings per missed infections due to a changed test policy at the STI clinics. Together, these studies illustrate the variation in possible approaches in cost-effectiveness studies of infectious diseases.
Pertussis vaccination strategies
Pertussis (whooping cough) is a highly contagious infectious disease of the respiratory tract. It may affect all ages, but in unvaccinated or incompletely vaccinated infants less than 6 months old, especially, the disease may take a severe course. In the
Netherlands, children are vaccinated at 2, 3, 4 and
11 months and 4 years of age. In the past decades, infant vaccination has been highly successful to reduce the burden of disease and, in particular, to protect newborns. Until 1999, children were vaccinated at the age of 3, 4, 5 and 11 months. After 1999, this schedule was adapted by decreasing the age for the vaccination to 2, 3, 4 and 11 months. Because of the rising incidence of the disease in 5-9 year olds, an acellular booster vaccination for four-year-olds was introduced in the NIP in November 2001. Following concerns of side effects and effectiveness, the Dutch whole-cell vaccine was replaced by an acellular vaccine in 2005.
Although the vaccination programme has very much reduced the incidence of pertussis between the age of 3 months and 8 years compared with pre-vaccination times, the disease is still endemic in the Netherlands. The persistent high incidence of pertussis, particularly among those too young to be vaccinated, underlines the need for further measures to protect at least the most vulnerable. Infants are most likely infected by household contact. A household transmission study conducted in the Netherlands explored the effectiveness of a cocooning vaccination strategy within the family (22). That study concluded that vaccinating mothers could be an effective strategy to prevent infection in infants. With prevention of pertussis among very young infants as the focus, different additional vaccination strategies can be considered: neonatal, parental cocooning and maternal vaccination. In a recent study, the cost-effectiveness of these three strategies was investigated (23). The costs for health care utilization and productivity losses, as well as impact on quality of life, were calculated for a 10-year vaccination programme, assuming that vaccine-induced immunity lasts 5 years. It was concluded that none of these strategies would be cost-effective when judged by thresholds for the cost-effectiveness of preventive health interventions in the Netherlands (€ 20,000-€ 50,000/QALY). Of the three vaccination strategies, cocooning had the most attractive ICER (€ 89,000/QALY). The maternal vaccination strategies had an ICER of € 126,000/ QALY; the neonatal vaccination strategy would be the least cost-effective strategy, with an ICER of € 318,000/QALY. The difference in cost-effectiveness between cocooning and the maternal vaccination is mainly due to differences in the number of vaccina-tions. The larger difference between these two and the neonatal strategy was predominantly because there is no QALY gain in mothers in the neonatal strategy.