Institut du développement durable
et des relations internationales
27, rue Saint-Guillaume
75337 Paris cedex 07 France
Understanding the Transformation
Induced by INDCs
A Report of the MILES Project Consortium
www
.iddri.org
THE MILES PROJECT
The “Modelling and Informing Low-Emission Strategies” (MILES) project is an international research project bringing together 16 leading research teams in order to build capacity and knowledge on low-emissions devel-opment strategies. The objective of this report is to understand the impli-cations of INDCs of the 5 countries and 1 region covered by the project (US, China, Japan, EU, Brazil and India), both at a national and global level, by investigating the concrete implications of INDCs for the low-carbon transformation by and beyond 2030, from energy systems, build-ings to transport and industry.
THE INDCs IMPLY AN ACCELERATION AND CONSOLIDATION OF ACTION AGAINST CLIMATE CHANGE IN MAJOR ECONOMIES AND AROUND THE WORLD
A significant transition appears in the electricity sector, where INDCs will further drive the transition towards renewables and other low-emissions forms of electricity production. In the six major economies assessed indi-vidually, carbon dioxide emissions per unit of electricity production falls by about 40% between 2010 and 2030 and renewable electricity becomes the dominant source of electricity production at about 36% of the elec-tricity mix.
THE INDCs IMPLY UNEVEN PROGRESS AMONG THE DRIVERS OF DECARBONISATION
Some crucial low-carbon solutions, like CCS, electric vehicles, advanced biofuels, sustainable urban planning, appear unlikely to be developed under the INDCs at the scale and speed required for a 2°C scenario. Like-wise, the report highlights that INDCs would leave too much inefficient and unabated fossil fuel capacity online in 2030 to be coherent with a 2 degrees scenario. This highlights the risks of lock-in into a high carbon trajectory if action is not strengthened quickly. Post-Paris policy efforts need to stim-ulate technology innovation, deployment and diffusion in order to drive down costs in such sectors where insufficient progress is being seen. THE INDCs ARE AN ENTRY POINT TO PUT THE WORLD
ON A TRAJECTORY TOWARDS 2°C
The INDCs imply a significant acceleration of climate action but as currently submitted may not be enough to keep the below 2°C goal in reach. The Paris Agreement should establish a clear mechanism to allow the regular, predict-able and timely revision of national contributions and the global framework. New contributions should be based on a vision for the deep decarbonisation of national energy systems. The Paris agreement should foster the develop-ment of national deep decarbonisation pathways around 2018.
Disclaimer. This report was written by a group of independent experts who have not been nominated by their
governments. The contents of this publication are the sole responsibility of IDDRI and can in no way be taken to reflect the views of the European Union or any government and organisation.
Thomas Spencer Roberta Pierfederici Henri Waisman Michel Colombier
Institut du développement durable et des relations internationales (IDDRI), France
Coordinating lead authors
Christoph Bertram Elmar Kriegler Gunnar Luderer Florian Humpenöder Alexander Popp Ottmar Edenhofer Potsdam-Institut für Klimafolgenforschung (PIK), Germany Chapter 4
Michel Den Elzen Detlef van Vuuren Heleen van Soest
Netherlands Environmental Assessment Agency (PBL), Netherlands Chapter 4 Leonidas Paroussos Panagiotis Fragkos
Energy - Economy - Environment Modelling Laboratory (E3M Lab), Greece
Chapter 2.2 Case study 1
Mikiko Kainuma Toshihiko Masui Ken Oshiro (MHIR).
National Institute for Environmental Studies (NIES), Japan
Chapter 2.3 Case study 6 Keigo Akimoto, Bianka Shoai Tehrani, Fuminori Sano, Junichiro Oda
Research Institute of Innovative Technology for the Earth (RITE), Japan Chapter 2.3 Case Study 2 Leon Clarke Gokul Iyer Jae Edmonds
Pacific Northwest National Laboratory (PNNL), United States
Chapter 2.4
TENG Fei
Tsinghua University, China
Chapter 2.5
FU Sha
Renmin University and National Centre for Climate Change Strategy and International Cooperation, China
Chapter 2.5 Case Study 5
Jiang Kejun
Energy Research Institute of NRDC (ERI) Chapter 2.5 Alexandre C. Köberle, Alexandre Szklo, André F. P. Lucena, Joana Portugal-Pereira, Pedro Rochedo and Roberto Schaeffer
Energy Planning Program, Center for Energy and Environmental Economics, Graduated School of Engineering,
Universidade Federal do Rio de Janeiro,
(COPPE/UFRJ), Brazil
Chapter 2.6 Case Study 3
Aayushi Awasthy Manish Kumar Shrivastava Ritu Mathur
The Energy and Resources Institute (TERI), India
Chapter 2.7 Case study 7 Case study 8 Joeri Rogelj Jessica Jewell Keywan Riahi
International Institute for Applied Systems Analysis (IIASA), Austria
Chapter 3
Amit Garg
Indian Institute of Management Ahmedabad (IIMA), India
Case study 9
Contributing authors, Institution and role
Beyond the Numbers: Understanding the
Transformation Induced by INDCs
Copyright © 2015 IDDRI
As a foundation of public utility, IDDRI encour-ages reproduction and communication of its copy-righted materials to the public, with proper credit (bibliographical reference and/or corresponding URL), for personal, corporate or public policy research, or educational purposes. However, IDDRI’s copyrighted materials are not for commer-cial use or dissemination (print or electronic). Unless expressly stated otherwise, the findings, interpretations, and conclusions expressed in the materials are those of the various authors and are not necessarily those of IDDRI’s board.
Spencer, T., Pierfederici, R. et al. (2015). Beyond the numbers: understanding the transformation induced by INDCs, Study N°05/15, IDDRI - MILES Project Consortium, Paris, France, 80 p.
◖◖◖
The authors would like to thank Pierre Barthé-lemy, Alain Chevallier, Delphine Donger, Ivan Pharabod, and Léna Spinazzé for their careful reading and suggestions. The authors also thank Ariane Labat and Miles Perry for their guidance in implementing the MILES project.
◖◖◖
This research was funded by the French Govern-ment as part of the “InvestisseGovern-ments d’avenir” programme under the reference ANR-10-LABX-01.
◖◖◖
For more information about this document, please contact:
Thomas Spencer - thomas.spencer@iddri.org
LIST OF FIGURES AND CASE STUDIES 6
EXECUTIVE SUMMARY 7
1. INTRODUCTION 13
2. UNDERSTANDING THE EFFECTS OF INDCs AT THE NATIONAL LEVEL 15
2.1. Introduction and Methodology 15
2.2. The European Union 16
2.3. Japan 21
2.4. United States 26
2.5. China 30
2.6. Brazil 34
2.7. India 45
3. CO-BENEFITS AND TRADE OFFS OF INDCs 51
4. BUILDING THE BRIDGE FROM INDCs TO 2 DEGREES: IMPLICATIONS FOR
THE PARIS AGREEMENT 59
4.1. Introduction 59
4.2. Methodology 59
4.3. Aggregate Impact of the INDCs 61
4.4. Impacts of an Early Strengthening and Extension of INDCs 64
5. CONCLUSION AND OUTLOOK 67
This report concludes with three main findings: 67
REFERENCES 69
ANNEX 75
immediate-2°C scenarios, 2030 and 2050 8 Figure C. Risks of lock-in through the deployment of unabated fossil fuels in the
INDC scenario 9
Figure D. Greenhouse gas emissions in the scenarios of this study (solid lines), compared with trajectories from bottom-up analysis of INDCs of PBL 10 Figure E. Assessment of local air pollution co-benefits of INDCs 11 FIGURES IN TEXT
Figure 1. Primary energy, European Union 18 Figure 2. High-level drivers of emissions changes, EU 18 Figure 3. Energy intensity of GDP, European Union 19 Figure 4. Carbon intensity of electricity production, EU 19 Figure 5. Electrification of final energy demand, EU 19 Figure 6. Electricity supply, European Union 19 Figure 7. Energy and carbon intensity in the transport sector, European Union 20 Figure 8. Energy and carbon intensity in the buildings sector, European Union 20
Figure 9. Primary energy, Japan 22
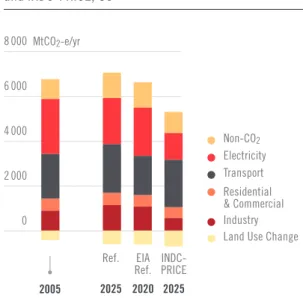
Figure 10. High-level drivers of emissions changes, JP 22 Figure 11. Energy intensity of GDP, Japan 23 Figure 12. Carbon intensity of electricity production, Japan* 23 Figure 13. Electrification of final energy demand, Japan 23 Figure 14. Electricity supply, Japan 24 Figure 15. Energy and carbon intensity in the transport sector, Japan 24 Figure 16. Energy and carbon intensity in the buildings sector, Japan 24 Figure 17. Emissions by sector, Reference and INDC-PRICE, US 27 Figure 18. High-level drivers of emissions changes, INDC-PRICE scenario, US 27 Figure 19. Sources of emissions reductions between Reference
and INDC-PRICE scenarios, US 28
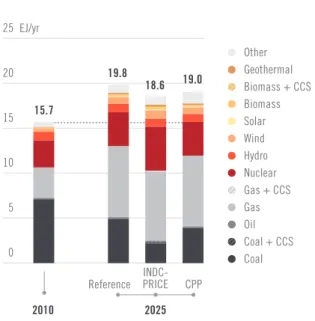
Figure 20. Changes in electricity generation compared to 2010 in Reference,
INDC-PRICE and CPP scenarios 28
Figure 21. Emissions reductions relative to 2005, from the CPP
and other actions and the residual in 2025, US 29 Figure 22. Projected energy related emissions, China 31 Figure 23. High-level drivers of emissions changes, China 31 Figure 24. Energy intensity of GDP, China 31 Figure 25. Carbon intensity of electricity production, China 31 Figure 26. Electrification of final energy demand, China 31 Figure 27. Electricity generation mix, China 32 Figure 28. Energy mix in building sectors, China 32 Figure 29. Energy mix in transport sectors, China 33 Figure 30. Energy mix in industry sectors, China 33 Figure 31. Carbon capture in low-carbon scenarios as a function
of different CO2 prices 39
Figure 32. Annual energy system emissions in baseline and low-carbon
COPPE INDC scenarios 40
Figure 33. Greenhouse Gas Emissions 41
Figure 34. Primary Energy Consumption 41 Figure 35. Primary Energy Consumption Baseline and COPPE INDC 42 Figure 36. Cumulative emissions mitigation potential through 2030
plotted against carbon price, Brazil 42 Figure 36. Electricity Generation in Baseline and COPPE INDC 42 Figure 37. Carbon intensity of the Brazilian economy, from energy related GHG
emissions in the Baseline and COPPE INDC scenarios 43 Figure 38. Cost differential between Baseline and COPPE INDC scenarios, from
2010 and 2050 45
Figure 39. Electricity generation capacity, India 47 Figure 40. Primary energy supply, India 47 Figure 41. Estimates of the reduction in national emissions of black carbon (soot)
and SO2 in 2030 as a result of implementing the respective INDCs. 52
compared with trajectories from bottom-up analysis of INDCs of PBL 61 Figure 44. Annual rate of change in GHG emissions 62 Figure 45. Low-carbon share of electricity generation (incl. renewables,
nuclear and power generation with CCS) 62 Figure 46. Carbon intensity of transport fuels, including indirect emissions
from electricity and hydrogen generation, INDC-scenario and 2°C scenario,
2030 and 2050 62
Figure 47. Primary energy deployment of different low-carbon technologies in 2030 63 Figure 48. Deployment of unabated fossil energy 64 Figure 49. Average annual investment into power generation capacity
for the periods 2020-30 and 2030-50. The left panel shows investment in low-carbon electricity technologies (Renewables, Nuclear, Fossils with CCS) and the right panel investments into freely emitting fossil fuel power plants. 65 FIGURES IN CASE STUDIES
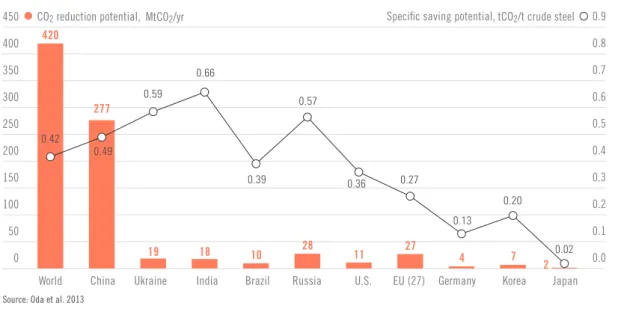
Figure a. Energy system investments, European Union 17 Figure b. CO2 reduction potential for crude steel (2010) 25 Figure c. The challenge of post 2030 electric mobility in the EU 49 Figure d. The challenge of CCS deployment in China post-2030 deep
decarbonisation scenarios 49
Figure e. Illustration of the energy related CO2 impacts
of structural change in China 53
Figure f. Import dependency and bills of fossil fuels in Japan for the scenarios
developed by NIES 54
Figure. Short-term emissions reductions from improved efficiency in coal power generation x Figure A.1. CO2 prices in the INDC, INDC-2°C, and 2°C scenarios. 77
LIST OF CASE STUDIES
Case Study 1: Shift in investment requirements for INDC implementation
in the EU 16
Case Study 2: Challenges and opportunities for emissions reductions in the
industrial sectors 25
Case study 3: INDC implementation and improving productivity in agriculture 36 Case Study 4: The Challenges of Long-term Transformations
in the Light of INDCs 49
Case study 5: Structural change, macroeconomic strategy
and climate mitigation in China 53
Case study 6: Energy security and import dependency in Japan 54 Case study 7: international technology learning, renewables deployment
and energy access in India 55
Case study 8: The Indian perspective on energy security and climate change 56 Case study 9: perspectives for coal, implications for the transition pathway,
EXECUTIVE SUMMARY
What is Innovative
and Complementary
About this Report?
As part of the negotiations towards a new climate agreement to be sealed in Paris in December 2015, countries have been requested to submit new ‘intended nationally determined contributions’ (INDCs), in particular new greenhouse gas (GHG) emissions targets for the period beyond 2020. As of October 19, the 123 INDCs, covering 150 countries, submitted to the UNFCCC represent ca. 85.8% of global GHG emissions in 2012.1
At the Lima Conference of the Parties (COP20) in 2014, the Secretariat of the UNFCCC was tasked with producing a synthesis report on the “agggate effect” of INDCs. This UNFCCC synthesis re-port will analyse the impact of INDCs on global emissions, in the light of the goal of limiting warm-ing to 2°C or 1.5°C. Other analysis, in particular the annual UNEP Gap Report, will perform similar assessments. These reports represent the cutting edge in terms of understanding the aggregate ef-fect of INDCs on global emissions, in the light of the below 2°C goal.
This report aims to do something different and complementary. It is the outcome of an
in-ternational research project involving 14 leading research teams from 10 countries (see authors’ list). In 2015, the objective of the project has been to produce a detailed analysis of INDCs in terms of three innovative aspects:
m Understanding the transformation of the
energy sector that would result from
1. Source: WRI, CAIT Climate Data Explorer, Paris Con-tributions Map. Available online at: http://cait.wri. org/indc/.
implementing the INDCs, in particular at the national level for major economies but also at the global level. The focus here has
been on the implications of INDCs to 2025 and 2030, while taking into account the importance of embedding this understanding in the long-term perspective of the transformation requi-red to 2050. The project has developed detailed analysis on what it would take to implement the INDCs, in terms of the roll-out of renewable energy, improvement of energy efficiency, and the deployment of other low-carbon solutions. The project is based on the participation of lea-ding national experts, who have each analysed their country’s INDC, as well as on leading glo-bal modelling teams who have assessed INDCs in aggregate.
m Understanding options to stay on track with
2°C at the global level, in the light of the level
of transformation in the global energy system implied by INDCs by 2030.
m Understanding the co-benefits and trade-offs of INDCs, in particular related to local air-pol-lution, energy-security, investment require-ments, and risks of lock-in into high emitting infrastructure.
In order to perform this analysis, the report has adopted an innovative methodology:
m Detailed, sector-specific, national-level INDC scenarios are developed, which show concre-tely what would be required to reach INDCs (national INDC scenarios). These national INDC scenarios have been produced by the respective research teams for five countries and one re-gion: the USA, China, Brazil, Japan, India2 and the EU. Together these represent 60% of global
2. The India assessment is based on the previously pub-lished TERI study “Energy Security Outlook” (2015), adjusted for the headline targets of the Indian INDC.
emissions from fossil fuel combustion, and 74% of global GDP in 2012. These countries are very
different, and the transitions that will be in-duced by INDCs will vary between countries.
Nonetheless, it is possible to see some common trends or patterns.
m In order to assess the global implications of INDCs, a global-level INDC scenario was deve-loped integrating the headline emissions or policy targets of INDCs published by October 2 within a global modelling framework. This de-tails transformations in the global energy sector implied by INDCs. Secondly, a global INDC-2°C scenario was developed, which implements IN-DCs until 2030, and then shifts to a 2°C scenario from 2030. This scenario is used to explore the implications of INDCs for the below 2°C objec-tive. Thirdly, a 2°C- bridge scenario was deve-loped, allowing for a more continuous transition from the INDCs to 2°C. In this scenario, policies and targets are strengthened by 2020 for 2030 and beyond, and investors respond early to this strengthened policy commitment.
INDCs Significantly Accelerate
the Energy Transition
in Major Economies
Energy resource endowments, energy supply systems and the economic drivers and the struc-ture of energy demand differ markedly between
major economies. However some robust features of the impact of INDCs on national energy trans-formations in Brazil, China, the European Union, India, Japan and USA, as well at the global level, can be identified.
m Key finding: the INDCs will accelerate and consolidate a significant transition in the
electricity sector and in energy efficiency in the next 15 years, driving innovation and re-duced costs.
The INDCs imply a significant transition in the electricity sector. In aggregate from 2010 to
2030 the carbon intensity of electricity production declines by 40% in the five countries and one re-gion assessed (Figure A). In these national INDC scenarios, renewable energy becomes the domi-nant source of electricity, reaching 36% in the electricity mix. At the global level, the deployment of low-carbon electricity production under the global INDC scenario is 41% in 2030, an increase of roughly 10 percentage points from 2012 levels, but still below what is seen in 2030 in 2°C scenarios (Figure B). Global investments in low-carbon elec-tricity account for 78% of cumulative investment from 2020-2030 in electricity supply in the global INDC scenario, up from 67% in 2012.
Similar positive trends are seen regarding en-ergy efficiency in the end-use sectors: transport, buildings and industry. Transport in particular
2012 tCO2/TJ 0 20 40 60 80 100 120 140 160
Figure A. Aggregate reduction in carbon intensity
of electricity in USA, EU, China, India, Brazil and Japan Figure B. Low-emissions electricity share at the global level
Source: MILES project analysis (see country chapters in this report)
Note to Figure B: INDC-2°C assumes INDC implementation to 2030, and then a shift to a 2°C trajectory; Bridge-2°C assumes stronger policy action from 2020 towards a 2°C trajectory ; Immediate-2°C assumes an immediate global implementation of a 2°C goal after 2015
Source: REMIND model calculations and IPCC scenario database (box plots)
2030 2010 -40% 0% 10% 20% 30% 40% 50% 60% 70% 80% 90% 100%
INDC−2°C Bridge−2°C Immediate−2°C
2030 2050 2030 2050 2030 2050
+47% +42%
would see significant improvements in energy in-tensity, falling in aggregate by 30% between 2010 and 2030 in the five countries and one region as-sessed individually. In Japan and the European Union for example, the energy intensity of GDP drops a further 33% and 34% between 2010 and 2030, while it drops 48% in China over the same time period. In the USA, energy intensity of GDP drops 26% between 2010 and 2025.
m Key finding: some crucial low-carbon
solu-tions, like CCS, electric vehicles, advanced biofuels, sustainable urban planning, appear unlikely to be developed under the INDCs at the scale and speed required for a 2°C scena-rio, given the implied lock-in of carbon-inten-sive infrastructure in 2030 under the INDC scenario. Post-Paris policy efforts also need to focus on stimulating technology innova-tion, deployment and diffusion in order to drive down costs in such sectors where insuf-ficient progress is being seen. This highlights also the importance of developing short-term targets in the light of long-short-term climate constraints, building on the development of national deep decarbonisation pathways to 2050. The Paris agreement should foster the development of national deep decarbonisa-tion pathways by 2018.
The INDC scenarios demonstrate little penetra-tion of alternative technologies in the transport sector by 2030 (with the exception of Brazil and biofuels). However, 2°C scenarios suggest that alternative transport technologies, in particular
electric vehicles in many scenarios, will need to be rolled out massively from 2030, with the share of electricity in transport energy consumption reach-ing a significant share of global transport energy demand by 2050 (about one sixth to one fifth). To
achieve this level in 2050, innovation in and de-ployment of alternative vehicles must start ear-ly, with a growth rate of the alternative passenger
vehicle industry of around 35-40%/year already between 2015 and 2030. It seems unlikely that INDC scenarios would support this rate of technol-ogy deployment. The national and global INDC scenarios likewise demonstrate little deployment of CCS, with a share of CCS in electricity genera-tion of about 3% in 2030 for the USA, China, Japan and the EU, although given the scale of fossil fuel
infrastructure in 2030 under the INDC scenario it seems that CCS will need to be a crucial tech-nology for mitigation post-2030. The level of
penetration of CCS seen in INDC scenarios raises questions of whether the technology would be de-ployable at scale from 2030.
The report also investigates the risk of lock-in
into high-carbon infrastructure. In the global
INDC scenario, deployment of unabated fossil fuel is significantly higher than what would be seen in a 2°C scenario. By 2030, unabated coal deploy-ment is more than twice as high in the global INDC scenario developed for this paper than in the im-mediate 2°C scenario (Figure C). At the same time, as noted above, the CCS technology that could render this unabated fossil fuel capacity coherent with a 2°C scenario does not seem to be developed sufficiently under the INDCs. The INDC scenario thus implies a significant bet on CCS after 2030,
EJ/yr 0 50 100 150 200 250
Figure C. Risks of lock-in through the deployment of unabated fossil fuels in 2030
Source : REMIND model calculations and IEA
Immediate Bridge
INDC INDC Bridge Immediate
Immediate Bridge
INDC
Oil without CCS Gas without CCS
Coal without CCS
without providing assurances that research, de-velopment and deployment of the CCS technology would be sufficient to rapidly assure its commer-cial availability.
It seems like there is insufficient policy focus to disincentivize fossil fuel use in the INDCs, in particular via carbon pricing and emissions per-formance standards. Without such policies, low-carbon support policies face an uphill battle to re-place fossil fuel infrastructure.
Building the Bridge
from INDCs to 2°C
The number of INDCs submitted and their level of ambition constitute a significant improvement over previous policy commitments. They have initiated a broad and interlinked policy process at national and international level, giving an entry point to put the world on track to 2°C. However, by themselves INDCs as currently submitted are not yet in line with 2°C. Therefore, the report develops a ‘bridge scenario’, in which action is strengthened and accelerated by 2020.
m Key finding: INDCs imply an acceleration
of climate action and a deviation from pre-vious trends and policy commitments. Howe-ver, they would necessitate very stringent and
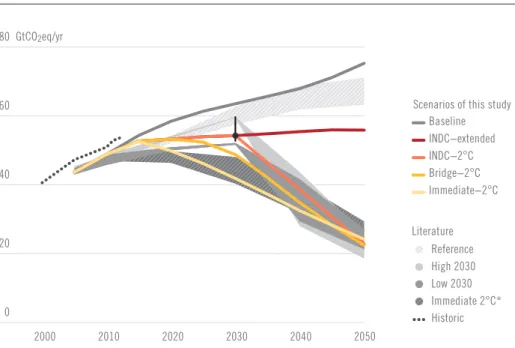
rapid mitigation measures post-2030 if the 2°C target is to be met. This would imply at the global level significantly higher costs and risks to feasibility compared to a scenario of earlier, stronger action. A dynamic approach to climate policy-making under the Paris agreement, with further rounds of strengthe-ned policy commitments, is critical to keep the 2°C target in reach. This policy strengthening would need to happen rapidly after 2015. INDCs lead to a significant reduction of emissions compared to projections based on existing policies and commitments (Figure D). Nonetheless the glob-al INDC scenario in this report showing emissions of 54 GtCO2eq3 in 2030 is above the emissions range
of cost-effective scenarios consistent with the below 2°C goal as estimated by the IPCC’s Fifth Assessment Report (30-50 Gt CO2e in 2030). With this level of
emissions in 2030, emissions reductions would need to be extremely rapid, more than 4% per year, if the below 2°C objective is to be met.
The bridge scenario represents a situation in which by 2020 targets and policies for 2030 are strengthened, and ideally new ambitious targets are proposed for the period after 2030. Due to this
3. Source: REMIND model and PBL INDC Tool.
GtCO2eq/yr 0 20 40 60 80
* with action starting after 2010 Figure D. Greenhouse gas emissions in the scenarios of this study, compared with literature
Immediate−2°C Bridge−2°C INDC−2°C INDC−extended
Greenhouse gas emissions in the scenarios of this study (solid lines), compared with the 2030 range and best estimate from the country-level analysis of conditional INDCs of PBL (www.pbl.nl/indc, vertical black line and dot), and the inter-quartile ranges of the FullTech-450-OPT (Immediate 2°C*), FullTech-450-LST (Low 2030) and FullTech-450-HST (High 2030) scenarios of the AMPERE study, as well as the reference policy scenarios of the AMPERE and LIMITS studies.
While section 4.3 discusses the INDC-2°C scenario, section 4.4 explores the possible effect of an early announcement of 2°C compatible policies (Bridge-2°C). Total greenhouse gas emissions were calculated based on global warming potentials from IPCC's second assessment report (SAR).
Historic Baseline Immediate 2°C* Low 2030 High 2030 Reference
Source: REMIND model calculations, EDGAR (JRC/PBL, historical emissions),
PBL INDC Tool calculations (www.pbl.nl/indc INDC range and best estimate) and IPCC AR5 scenario database
Scenarios of this study
Literature 2050 2040 2030 2020 2010 2000
strengthening of policy commitments by 2020, en-ergy sector and other actors perceive the long-term commitment to attain the below 2°C goal as cred-ible, and therefore restructure their investments in the energy sector early on and reduce emis-sions below the level of what would be required by current INDCs in order to avoid abrupt and rapid reductions after 2030. The report shows that this can lower global emissions in 2030 substantially to around 49 GtCO2eq/yr, close to the upper bound
of the range of cost-effective 2°C scenarios in AR5, amounting to an overachievement of current IN-DCs by about 5 GtCO2eq/yr in 2030. In the bridge
scenario, cumulative low-carbon electricity invest-ment exceeds that in the INDC scenario by roughly half between 2020-2030, while reducing invest-ments into new freely emitting fossil-fuel power capacity by a third compared to today’s level and the INDC scenario. The bridge scenario can play a major role in avoiding a carbon investment bubble and stranded assets in the energy sector.
If the provisions for such continuous strength-ening of policy commitments in the Paris Agree-ment are perceived credible and backed up by strengthening national policies, it can have an
immediate and amplifying effect on the
trans-formation process by shifting expectation of businesses and altering investment decisions. Addressing the pre-2020 ambition gap through stronger national policies and international co-operative initiatives is also crucial. This
analy-sis shows the crucial importance of a system of dynamic revision and a credible long-term goal in the Paris agreement.
Sustainable development
co-benefits of INDCs can be a
driver for their implementation
Governments inevitably have multiple objectives: reducing environmental damage, promoting growth and jobs, innovation and competitiveness, energy security, etc. They must assess the interac-tion between these objectives in defining climate policy. In this report, we have considered co-bene-fits and trade-offs through a quantified assessment of national model results and country case-studies.
m Key finding: INDCs can lead to significant
co-benefits from climate mitigation in the countries studied, in terms of percentage reductions in energy import dependency and local air pollution. Such co-benefits can be a significant driver to develop ambitious natio-nal climate policies.
For energy importers, INDCs can lead to signifi-cant improvements in energy security. The report estimates reductions in energy imports in the order of 2-12% in China, 9-17% in Japan and up to 9% in the EU in 2030, compared to a reference scenario with existing policies but no further climate ac-tion. In the Japan case study, import dependency is reduced from 94% today to 75% under the INDC scenario in 2030 (taking nuclear electricity as a domestic energy source), reducing import bills by 23% from 283 billion USD to 219 billion USD.
Implementing INDCs also implies significant co-benefits in terms of reducing local air pollution. In China, the report estimates a reduction of black carbon and sulphur dioxide in the order of 5-10%
Figure E. Assessment of local air pollution co-benefits of INDCs
Each dot represents the estimate based on a different model SO2 Black Carbon -40% -30% -20% -10% 0% 10% -40% -30% -20% -10% 0% 10%
Source: IIASA calculations
Change in 2030 of BC emissions relative to reference Change in 2030 of SO2 emissions relative to reference
m There appears to be uneven progress on ad-dressing the drivers of GHG emissions, when we consider what actions are projected to underpin the implementation of INDCs. Future climate cooperation and national policy must consider how to address specific barriers to certain cru-cial solutions, such as accelerating innovation and deployment of post-2030 mitigation options and limiting carbon lock-in.
m The INDCs are an entry point to put the world on a trajectory towards 2°C but as currently sub-mitted may not be enough to keep the below 2°C goal in reach. Post-2030, the required rate of transformation is very high and potentially cost-ly. In order to address this, the Paris Agreement should establish a clear mechanism to allow the regular, predictable and timely revision of na-tional contributions and the global framework. New contributions should be based on a vision for the deep decarbonisation of national energy systems. The Paris agreement should foster
the development of national deep
decarboni-sation pathways by 2018. ❚
and about 10% respectively (mid-range of the esti-mates) in 2030, compared to a Reference Scenario of existing policies and no further climate action (Figure E).
Key Conclusions and
Recommendations
This report has assessed the aggregate and real-economy effect of INDCs. Doing so can provide a more detailed national and sectoral picture of progress being made, and areas where further policy efforts are required. There are three key conclusions from the analysis:
m In the analysis of this report, INDCs accelerate
and consolidate action on climate change in
key major economies and at the global level. A significant transition appears in the electricity sector, with the dynamic of technology deploy-ment approaching what is required for 2°C. The whole process towards the Paris negotiations has established a dynamic on which future poli-cy and business strategies can build.
1. INTRODUCTION
Countries have committed to signing a new global agreement on climate change in Paris by the end of 2015. The bricks of this agreement are the so-called ‘intended nationally determined contributions’ (INDCs), which contain countries’ proposed undertakings on mitigation and, for some, adapta-tion. Regarding mitigation, these INDCs contain a range of different emissions targets, expressed in different forms and against different years. They are often accompanied by descriptions of more precise aspirations regarding aspects of the tran-sition to a low-carbon economy, such as goals for renewable energy, non-fossil fuel energy, or specific regulatory policies.
Given this diversity, understanding the implica-tions of INDCs for the transition to a low-carbon economy in line with the 2°C or 1.5°C objective is challenging. It is also challenging for another rea-son. More than the precise emissions level in a given year, the potential of INDCs to limit warm-ing to 2°C is determined by their capacity to un-leash concrete transformations, particularly in the global energy sector, which would allow the deep decarbonisation of the global economy by 2050. These transformations are technological, infra-structural, economic and financial, and social and political. Multiple transition pathways are pos-sible, but only some are coherent with long-term deep decarbonisation. Moreover, the transition pathway developed towards a certain year, such as 2030, conditions profoundly both what can and what must be done thereafter in order to reach long-term climate goals.
The objective of this report is to analyse the en-ergy sector transformations that would be required to reach INDCs, and understand what these trans-formations imply for the goal of limiting warming to 2°C. This report is the result of an international research project encompassing 15 leading research
teams from 11 countries (see authors’ list, page 2). It is structured as follows:
m Section 2 provides a national level assessment of INDCs for five countries and one region – the EU, the US, China, India, Brazil and Japan – which together account for 60% of global emis-sions from fossil fuel combustion, and 74% of global GDP in 2012. This analysis focuses on the years 2025 and 2030, while taking into account the need for a long-term trajectory to 2050. m Section 3 provides analysis of the co-benefits
and trade-offs of INDCs, with a particular focus on their implication in major economies for local air pollution and energy security, notably energy import dependency.
m Section 4 provides a global assessment of the im-pacts of INDCs in the energy sector, in the light of the below 2°C goal. It explores the post-2030 energy sector transformations and emissions trajectory that would be required to hold war-ming to below 2°C, given the implementation of INDCs. It also develops a ‘bridge’ scenario, in which policy action is strengthened by 2020 in order to smooth the transition from INDCs to a 2°C trajectory.
Throughout this paper, a number of case stud-ies deepen the analysis presented in the main body of the report. These are not essential to the understanding of the report as a whole, but con-tain in themselves a wealth of interesting analysis. Readers are invited to browse them or focus on the main report as they prefer.
2. UNDERSTANDING THE EFFECTS
OF INDCS AT THE NATIONAL LEVEL
2.1. Introduction and
Methodology
The objective of this chapter is to build a better understanding of the implications of INDCs at the national level, in terms of the transformations that they imply in the real economy. The analysis of this chapter focuses on the 6 countries/regions with research teams contributing to the MILES project – the United States, the European Union, Japan, China, India and Brazil. Together, these countries made up 60% of global GHG emis-sions excluding land-use in 2012, or 56% of global GHGs including land-use. Countries represented in the MILES project made up 74% of global GDP at market exchange rates in 2012. The analysis in this chapter focuses particularly on the energy sector. GHG emissions from the energy sector represent 80% of emissions in the countries represented in the MILES project in 2012.4
The methodology in this chapter gives a de-tailed vision for the potential transformation in-duced by the INDC in the energy sectors of the countries assessed. There are several reasons for trying to understand the potential transforma-tions induced by the INDCs with this high level of granularity:
m It can help to increase the national and inter-national credibility of the INDCs, by understan-ding what transformations and policies would be required to implement them.
m It can provide useful information to the public and private sectors at the national and inter-national level, in terms of the strategies being
4. All data from this paragraph based on CAIT. Available at: http://cait.wri.org/
pursued, the potential future growth of low-car-bon technologies, energy markets, and so on. m It can provide further understanding of the
op-portunities, barriers and level of ambition for the INDCs.
m It can provide complementary analysis to at-tempts to aggregate the effects of INDCs rela-tive to 2°C, for example by comparing techno-logy deployment in the INDC scenarios and 2°C scenarios.
The assessments in this chapter are provided on a country by country basis, as the focus is on the implications of the INDCs at the national level. The objective is not to compare across countries: signif-icant differences in the development and resource endowments of each country render cross-country comparison difficult. Rather the objective is to provide as detailed an understanding as possible of the INDC at the national level.
In order to understand the methodology of the analysis here, it is important to provide the distinc-tion between INDCs and INDC scenarios. INDCs provide the headline target(s) for emissions and in some cases other related targets such as a non-fossil fuel share in the energy mix. INDC scenarios involve the development of detailed, internally co-herent scenarios which explore the INDCs’ impli-cations for the energy sector. In order to develop these INDC scenarios, each national research team has used the modelling and analytic tools avail-able to them. Each country research team has also benefited from its proximity to the policy process and public debate in their country. The INDC sce-narios therefore include both the headline targets of INDCs, but also the underlying policy vision to achieve the INDC, to the extent of each country re-search team’s knowledge.
The results have been presented using a con-sistent data template, ensuring the usability and transparency of results. In addition to the data
submissions, each country research team has de-veloped or is developing under the MILES project a detailed report on the implications of their coun-try’s INDC.
INDC scenarios should therefore not be taken as predictions, still less as government policy, but rather as credible, detailed and internally coher-ent explorations of pathways towards achieving the headline ambitions announced in the INDCs.
The following subsections present the analysis for each country represented in the MILES project. An effort has been made to present similar infor-mation in each subsection, although this needs to be balanced with flexibility to present the unique circumstances of each country.
2.2. The European Union
Analysis of effect of the INDC scenario in the energy sector
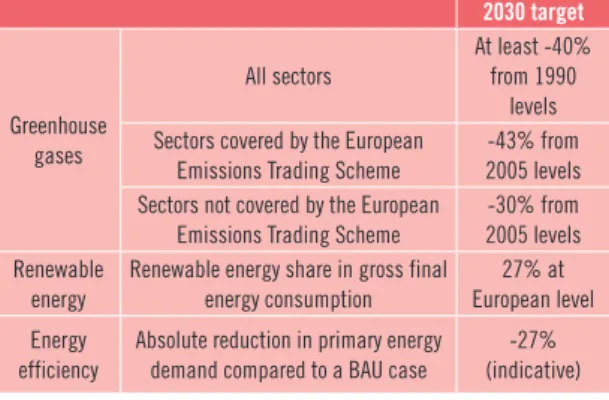
The European Union (EU) submitted its INDC on the 6th of March 2015.5 Under its INDC, the Euro-pean Union and its Member States are committed to a binding target of an at least 40% domestic reduction in greenhouse gas emissions by 2030 compared to 1990. This covers the following green-house gases (GHGs): CO2, CH4, N2O, HFCs, PFCs,
SF6, and NF3. All emitting sectors are covered, and
international credits will not be used. The EU had also previously adopted an objective to reduce emissions by 80-95% by 2050 compared to 1990, based on the reductions assessed to be consistent with the 2oC target by the IPCC AR4 report for developed countries as a group.6 The EU’s INDC is therefore intended by European policy makers to be a credible mid-term milestone towards this 2050 objective. The EU’s INDC is based on the policy targets and orientations adopted by the European Council of heads of state in October 2014, under the so-called EU 2030 Climate and Energy Frame-work.7 These are presented in Table 1.
5. Submission by Latvia and the European Commission on behalf ff the European Union and its member states, Riga 6 March 2015. Available at: http://www4.unfccc. int/submissions/INDC/Published%20Documents/ Latvia/1/LV-03-06-EU%20INDC.pdf
6. Council of the European Union (2009), “Presidency Conclusions”. Available at http://www4.unfccc.int/ submissions/INDC/Published%20Documents/Lat-via/1/LV-03-06-EU%20INDC.pdf
7. European Council, 23 and 24th of October 2014, Con-clusions. Available online at: http://www.consilium. europa.eu/uedocs/cms_data/docs/pressdata/en/ ec/145397.pdf
Case Study 1.
Shift in investment requirements
for INDC implementation in the EU
The implementation of the European INDC (that envisages at least 40% reduction in domestic GHG emissions in the period 1990-2030) implies significant changes in investment requirements for the EU energy system both in demand and supply sectors. Investment expenditures1 for the energy system increase already
in the Reference scenario from 638 bn. €’ 10 in 2010 to 826 bn. € in 2020 and to 873 bn. € in 2030, i.e. a growth of 37% during 2010-2030. The main reasons for the increase are: m Replacement of ageing energy infrastructure (power plants,
passenger cars, electricity grids, gas pipelines, petroleum refineries)
m Extension and enhancement of network infrastructures m Additional investments in the framework of already agreed
pol-icies as part of the 2020 Energy and Climate Package (mainly directed towards energy efficiency improvements in energy demand sectors and accelerated deployment of renewables) The EU INDC implies a further increase in energy related upfront investments by 10% from Reference levels in 2030, while the benefits of these investments in terms of reduced fuel spend-ing are more tangible in the longer term. Capital expenditures increase following the accelerated penetration of renewable energy sources, advanced energy efficient technologies, equip-ment and infrastructure (e.g. insulation investequip-ments to improve thermal integrity of the European building stock, RES for power generation, advanced efficient appliances, improvement in grids, hybrid vehicles).
The 2030 Energy and Climate policy framework and the European INDC can facilitate effective market coordination between differ-ent energy/economy system actors in the decarbonisation pro-cess (technology providers, individual consumers, infrastructure developers, policy-makers). Investments in energy efficiency and low/zero carbon technologies can be triggered by specific policy instruments like the ETS (clear price signal), while specific energy efficiency and renewable policies can provide further incentives for extensive restructuring of the EU energy system. Even with ETS reform, a tightening of the ETS cap and increased carbon prices, it is unlikely that carbon pricing alone can trigger sufficient invest-ments in the energy system towards carbon abatement especially in the buildings and transport sectors. Complementary policies are required in order to overcome market and non-market barriers and to achieve the required investments for the cost-effective imple-mentation of the EU INDC, especially in the period after 2020. 1. Annualized and discounted
in transport-related investments is relatively modest, while the share of transport in overall energy system investments declines from 84% in the Reference to 77% in the ICCS INDC scenario in 2030.
In order to understand the investment challenges at macro-economic level, we must compare energy investment figures with overall EU GDP. In 2010, total energy system investments accounted for 5.2% of European GDP. The Reference scenario implies a stabilisation of energy investments as a percentage of GDP for the period 2010-2030. On the other hand, the EU ICCS INDC scenario leads to an increase of overall energy investment expenditures which in 2030 represent 5.7% of the EU GDP. Trans-port investments account for the bulk of overall energy invest-ments and represent 4.4% of EU GDP in 2030 (in both scenarios). The implementation of the EU INDC leads to particularly high investment challenges for the residential/commercial sector, as investment expenditure have to increase by about 2.5 times (from 0.2% of EU GDP in Reference to 0.5% in the EU ICCS INDC sce-nario). Investment in the energy supply sector (including power plants) increase from 0.5% of the EU GDP in Reference to 0.6% in EU ICCS INDC scenario in 2030, as a result of accelerated deployment of capital-intensive low-carbon technologies and additional investments for grid expansion and enhancement in order to complement massive penetration of variable renewables (storage, back-up capacity, intelligent grids, flexible generation).
Sectoral investment trends:
In 2010, the transport sector accounted for about 85% of the overall energy system investments due to high expenditure requirements for vehicles purchases (especially for passenger cars), vessels and railways. The Reference scenario shows an increase in investments in all energy sectors by 2030, with trans-port and power supply accounting for about 90% of the overall increase between 2010 and 2030.
Based on PRIMES results (see figure above), the implementation of the EU INDC requires higher investments relative to the Ref-erence scenario especially in the residential/commercial and in the energy supply (power generation) sectors, which account for 65% (54 bn. €) and 19% (16 bn. €) respectively of the overall increase in 2030. In the INDC context, the most important policy challenges that the EU faces are the large-scale deployment of intermittent Renewable technologies for electricity production (which must be complemented with additional investments for grid enhancement, storage, balance and flexible generation) and massive energy efficiency investments in buildings (ret-rofits, deep renovation of households, investments for energy using equipment and direct energy efficiency investment for improving thermal integrity of households). On the other hand, electrification of the transport sector which is considered as a critical ingredient of the transition to a low-carbon economy will mainly take place in the period after 2030 and thus the increase
Supply side
Residential & Tertiary
Industry Transport Energy supply Transport equipment and infrastructure Residential & Tertiary Industry 2020 2010 INDC ICCS Reference 2030 INDC ICCS Reference Bn. € 2010 0 100 200 300 400 500 600 700 800 900 1 000
Figure a. Energy system investments, European Union
Source: ICCS, PRIMES model
Total investment costs for the entire energy system include capital costs for energy installations such as power plants and energy infrastructure, energy using equipment, appliances and vehicles, and direct efficiency investment costs, the latter being also expenditures of capital nature. Direct efficiency investment costs include costs for house insulation, double/triple glazing, control systems, energy management and for efficiency enhancing changes in production processes.
67 96 97 84 100 538 625 626 729 734 26 88 89 36 89 8 17 19 24 32
Table 1. Targets and policy orientations adopted under the
EU 2030 Climate and Energy Framework
2030 target Greenhouse gases All sectors At least -40% from 1990 levels Sectors covered by the European
Emissions Trading Scheme
-43% from 2005 levels Sectors not covered by the European
Emissions Trading Scheme
-30% from 2005 levels Renewable
energy
Renewable energy share in gross final energy consumption
27% at European level Energy
efficiency
Absolute reduction in primary energy demand compared to a BAU case
-27% (indicative)
Source: Authors
The analysis in this section is based on the sce-narios developed by Energy-Economy-Environ-ment Modelling Laboratory (E3MLab) at the Na-tional Technical University of Athens, using the PRIMES energy system model and the GEM-E38 macroeconomic model. These models are often used by the European Commission for Impact As-sessments and related analysis of EU energy and climate policies. The ICCS INDC scenario pre-sented here assumes a 40% reduction in EU GHGs emissions by 2030 compared to 1990, while in the long term it assumes the achievement of an 80% GHG emissions reduction by 2050 (in line with the “Roadmap for moving to a competitive low-carbon economy in 2050”). The headline macroeconomic drivers in the ICCS INDC scenario are reproduced in Table 2.
8. www.gem-e3.net
Table 2. Headline drivers in the EU ICCS INDC scenario
2010 2020 2030 GDP (billion US$2005) 13901 16098 18834 Population (million) 504 517 525
Source: ICCS, PRIMES and GEM-E3 models
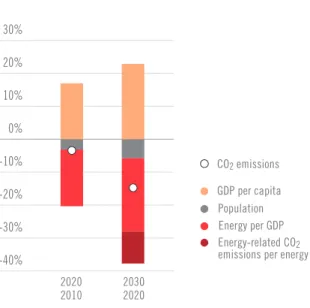
Figure 1 presents the evolution of EU primary energy demand9 by energy source between 2010 and 2030 in the ICCS INDC scenario. A 13% reduc-tion of primary energy demand is achieved, with demand falling to 64.3 EJ in 2030. The largest reduction is in coal demand, which falls by 45%. Primary energy from renewables and biomass, on the other hand, grows by 80%. Figure 2 represents the high-level drivers of decarbonisation in the EU in terms of the so-called Kaya identity, which de-scribes changes in CO2 energy-related emissions as
the product of four factors: m 1. Change in population m 2. Change in GDP/capita
m 3. Change in final energy consumption / GDP (energy intensity)
m 4. Change in carbon emissions / unit of final energy (carbon intensity)
Compared to the period 2010-2020, the decar-bonisation of European energy system acceler-ates dramatically in the decade 2020-2030, as
9. Defined as total primary energy consumption (PRIMES results are consistent with the EUROSTAT and IEA con-ventions that use the physical energy content method for calculating primary energy equivalent of alterna-tive energy forms and fuels).
2030 2010 Coal w/o CCS Oil Gas w/o CCS Nuclear
Renewable and biomass
2030 2020 2020 2010 Population GDP per capita CO2 emissions Energy per GDP Energy-related CO2 emissions per energy EJ/yr 0 10 20 30 40 50 60 70 80 -40% -30% -20% -10% 0% 10% 20% 30%
Figure 1. Primary energy, European Union Figure 2. High-level drivers of emissions changes, EU
a result of further renewables growth to substi-tute for fossil fuels in both electricity generation (mainly wind turbines and solar PV) and in fi-nal energy consumption (biofuels in transport, biomass and solar thermal heating in buildings), and a slight increase of nuclear electricity. Im-provements in energy intensity provide the bulk of emissions reductions, underscoring the im-portance of strong energy efficiency policies in all energy demand and supply sectors, including more ambitious standards, regulations for heat-ing and electrical appliances, higher renovation rates in buildings, stringent implementation of the Efficiency-related directives, purchase of more efficient energy equipment and vehicles by energy consumers. This improvement in energy efficiency represents a major challenge of imple-menting the EU INDC.
Figures 3-5 present the so-called three pillars of decarbonisation: improvements in energy inten-sity, decarbonisation of electricity, and the shift from fossil fuels to electricity in final energy (for example, the shift from internal combustion en-gine to plug-in hybrid and full electric vehicles).10 In the INDC scenario the EU’s energy intensity improves by 33% between 2010 and 2030 (Figure 3), or 2.1% per year compared to 1.5% over the last 10 years. An even more significant improve-ment is required in the carbon intensity of elec-tricity supply, which reduces by 56% between
10. The concept of the three pillars of decarbonisation is further developed in the report of the Deep Decar-bonization Project. Cf. IDDRI and SDSN, “Pathways to Deep Decarbonization – 2014 Report”. Available online at: www.unsdsn.org/wp-content/uploads/2014/09/ DDPP_Digit.pdf
2010 and 2030, reaching 50.9 tCO2/TJ and
en-tailing very significant changes in the EU’s elec-tricity generation mix.
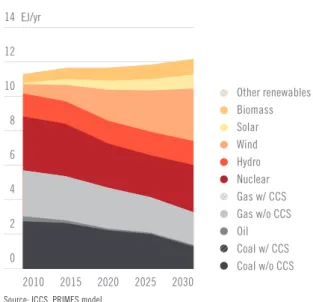
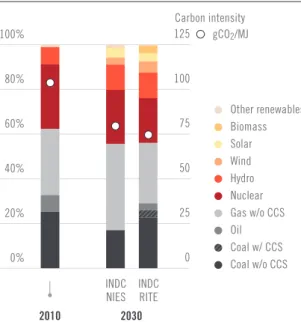
Figure 6 presents this changing electricity mix between 2010 and 2030 under the ICCS INDC scenario. As can be seen, the share of renewables grows very significantly, making up 50.7% of the EU electricity mix by 2030. This entails a com-pound annual growth rate for wind of 9.1% and 12% for solar in the period 2010 to 2030. The share of nuclear falls by 5 percentage points between 2010 and 2030; by 2030 a small amount of CCS is modelled to be coming online.
Figure 7 and Figure 8 present the major drivers of decarbonisation in two significant end-use sectors:
2030
2010 2020 2010 2020 2030 2010 2020 2030
Figure 3. Energy intensity of GDP,
European Union Figure 4. Carbon intensity of electricity production, EU Figure 5. Electrification of final energy demand, EU
MJ/$ 0.0 0.5 1.0 1.5 2.0 2.5 3.0 3.5 4.0 gCO2/MJ 0 25 50 75 100 125 150 0% 5% 10% 15% 20% 25% 30%
Source: ICCS, PRIMES model Source: ICCS, PRIMES model Source: ICCS, PRIMES model
0 3 6 9 12 15 Other renewables Biomass Solar Wind Hydro Nuclear Gas w/CCS Gas w/o CCS 2030 2025 2020 2015 2010 Gas w/ CCS Gas w/o CCS Nuclear Hydro Wind Solar Biomass Other renewables Oil Coal w/ CCS Coal w/o CCS EJ/yr 0 2 4 6 8 10 12 14
Figure 6. Electricity supply, European Union
transport and buildings.11 It can be seen that the carbon intensity improvement of energy consump-tion in the transport sector is slight, and indeed slows down in the decade from 2020-30, compared to 2010-20. This is because of slower penetration of biofuels due to concerns regarding the life-cycle emissions impacts of biofuels, the displacement of food production, as well as the lack of an explicit target for biofuels deployment after 2020. In-creased electrification of transport through modal switch and growing deployment of plug-in hybrid and electric vehicles is not able to fully compensate this slow-down in the penetration of biofuels. Elec-tricity contributes 3% to final energy consumption in transport in 2030, and biofuels 8%; oil falls from 95% in 2010 to 88% of final energy consumption in transport in 2030. Further, important improve-ments in energy intensity are observed (Figure 7). These offset significant increases in the demand for transport services as economic activity, trade and standards of living increase: passenger kilo-metres per capita are projected to grow by 18% be-tween 2010 and 2030, and tonne kilometres grow by 37%. Overall, transport emissions are reduced by 11% between 2010 and 2030 mainly as a result of significant improvements in energy efficiency.
The buildings sector, on the other hand, reduces emissions by 36% between 2010 and 2030. The
11. The carbon intensity is measured in terms of direct emissions from transport and building, excluding indi-rect emissions from electricity generation.
2020/2010
Energy intensity in passenger and freight transport is calculated as TJ/pkm and
TJ/tkm respectively. Energy intensity of buildings is calculated as TJ/capita.
2030/2020 2020/2010 2030/2020 Energy intensity passenger transport Energy intensity freight transport Carbon intensity of energy
in transport Energy intensity of buildings Carbon intensity of energyin buildings
Figure 7. Energy and carbon intensity
in the transport sector, European Union Figure 8. Energy and carbon intensityin the buildings sector, European Union
-20.0% -17.5% -15.0% -12.5% -10.0% -7.5% -5.0% -2.5% 0.0% -20.0% -17.5% -15.0% -12.5% -10.0% -7.5% -5.0% -2.5% 0.0%
Source: ICCS, PRIMES model Source: ICCS, PRIMES model
-0.20 -0.15 -0.10 -0.05 0.00 -0.12 -0.10 -0.08 -0.06 -0.04 -0.02 0.00 -0.15 -0.12 -0.09 -0.06 -0.03 0.00
drivers of this are shown in Figure 8. Significant improvements in energy intensity drive an 18% reduction in total buildings final energy demand between 2010 and 2030. In order to achieve this, large-scale deep retrofits of the buildings stock are required. Energy supply in the buildings sector also decarbonizes, as electricity displaces fossil fu-els and specific electricity consumption increases (i.e. new uses for electricity such as information technology). Electricity’s share in final energy de-mand in the buildings sector increases from 33% in 2010 to 43% in 2030.
Emissions Outcomes and Conclusions
The section above presented the main energy sector transformations induced by the EU ICCS INDC scenario. Table 3 shows the results in the emissions reductions for the energy sector. It should be noted that scenario results for all GHGs and emitter sectors were not reported for the EU under the MILES project, due to the focus on the energy sector.
The analysis above shows the importance of the decarbonisation of electricity supply in Europe, through notably the massive penetration of re-newables. This poses a policy challenge in terms of appropriate incentive schemes (such as feed-in-tariffs and subsidies), appropriate electricity mar-ket design, provision of the required storage and flexible generation to balance and support a rapid-ly growing share of variable renewables, and grid enhancement, reinforcement and interconnection
see case study 1. Two other challenges can be high-lighted related to the improvement of energy effi-ciency in the buildings and transport sectors, both of which must significantly contribute to the re-duction of energy-related GHG emissions. Vehicle performance standards, currently in place to 2020, will need to be extended to the freight transport sector and tightened for the period after 2020. Am-bitious retrofit programs of the building stock will need to be developed and financed.
Table 3. Emissions reductions achieved in the EU ICCS
INDC scenario (Mt CO2 from fossil fuel combustion and
industry) 2010 2030 Electricity 1295 621 Buildings 647 416 Industry 756 676 Transport 1051 936 Other 266 187 Total 4015 2836
Source: ICCS, PRIMES model
The analysis suggests that the EU’s INDC repre-sents a significant acceleration of the decarboni-sation of the EU economy, notably in the elec-tricity supply, transport and buildings sectors. It also points to some of the challenges beyond 2030. Electrification of road transport, although at a low level in 2030, would have to be scaled up dramatically (in combination with provi-sion of the required recharging infrastructure) thereafter to reduce transport-related emissions. Likewise, CCS which is a very small in the ICCS INDC scenario in 2030, will have to be deployed at scale to further reduce both power generation emissions and start to make a dent on industrial emissions.
2.3. Japan
Analysis of effect of the INDC scenario in the energy sector
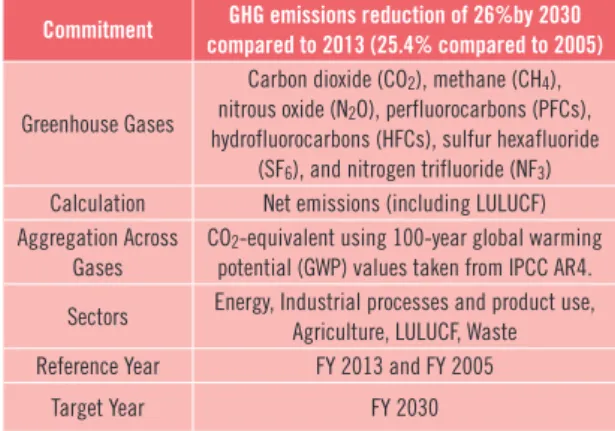
Japan presented its INDC to the UNFCCC on the 17th of July 2015.12 Japan’s INDC is to reduce GHG emissions by 26% by 2030 compared to 2013 levels, equivalent to a 25.4% reduction against 2005 levels. This would equate to emissions levels of about 1.042 Gt CO2eq in 2030. All sectors and all
GHGs (CO2, CH4, N2O, HFCs, PFCs, SF6, and NF3)
12. Government of Japan (2015), Submission of Ja-pan’s Intended Nationally Determined Contribution (INDC). Available online at: http://www4.unfccc. int/submissions/INDC/Published%20Documents/Ja-pan/1/20150717_Japan’s%20INDC.pdf
are covered by Japan’s INDC (Table 4). A detailed estimation of sectoral reductions is given along-side the INDC (Table 5), as well as an estimation of the level of final energy consumption in 2030 and electricity generation mix in 2030. In this regard, the Japanese INDC provides a high level of trans-parency regarding the strategy required to achieve its INDC.
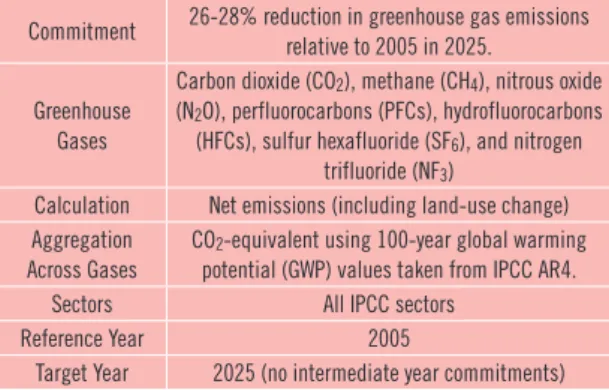
Table 4. Description of the Japanese INDC
Commitment compared to 2013 (25.4% compared to 2005)GHG emissions reduction of 26%by 2030
Greenhouse Gases
Carbon dioxide (CO2), methane (CH4), nitrous oxide (N2O), perfluorocarbons (PFCs), hydrofluorocarbons (HFCs), sulfur hexafluoride
(SF6), and nitrogen trifluoride (NF3) Calculation Net emissions (including LULUCF) Aggregation Across
Gases
CO2-equivalent using 100-year global warming potential (GWP) values taken from IPCC AR4. Sectors Energy, Industrial processes and product use,
Agriculture, LULUCF, Waste Reference Year FY 2013 and FY 2005
Target Year FY 2030
Source: http://www4.unfccc.int/submissions/INDC/Published%20Documents/Japan/ 1/20150717_Japan’s%20INDC.pdf
Table 5. Estimated emissions of energy-originated CO2 in each sector in the Japanese INDC (Mt CO2)
Estimated emissions of
each sector in FY 2030 FY 2013 Energy originated CO2 927 1235
Industry 401 429
Commercial and other 168 279
Residential 122 201
Transport 163 225
Energy conversion 73 101
Source: http://www4.unfccc.int/submissions/INDC/Published%20Documents/Japan/ 1/20150717_Japan’s%20INDC.pdf
After the nuclear accident at the Tokyo Electric Power Company’s Fukushima Dai-ichi Nuclear Power Station, the Japanese nuclear fleet was en-tirely stopped for safety reasons. The share of nu-clear in gross electricity generation fell from 25.8% in 2010 to 1.3% in 2013. After the Fukushima ac-cident, in July 2015 the Japanese Government fi-nalized a «Long-term Energy Supply and Demand Outlook”, which formed the basis of the Japanese INDC.
Within the context of the MILES project, two re-search teams from Japan provided INDC scenarios: the Research Institute of Innovative Technology for the Earth (RITE) and the National Institute for Environmental Studies (NIES). These scenarios are broadly speaking comparable, and both achieve the INDC target of a reduction of 26% against 2013 levels, or 25.4% against 2005 levels. Unless otherwise
indicated, in this subsection the figures are taken from the INDC scenario provided by NIES, while the discussion in the text builds on both scenarios and points to interesting differences between the two. The headline macroeconomic drivers in the two INDC scenarios are reproduced in Table 6.
Table 6. Headline drivers in the NIES and RITE Japanese
INDC scenarios
2010 2020 2030 GDP (billion US$2005) NIES
GDP (billion US$2005) RITE
4619 4648 5322 5343 6406 6429 Population (million)
NIES and RITE 128 124 117
Source: NIES AIM/Enduse[Japan] model and RITE DNE21+ model
The cornerstone of the NIES INDC scenario is a significant improvement in energy intensity13, which poses a big challenge in a country that is already as efficient as Japan. Figure 9 provides an overview of primary energy supply between 2010 and 2030, which falls by 12.4% reaching 19.3 EJ/yr in 2030. The sectoral division of these improvements and the challenge that this entails is discussed further below. Figure 10 shows the four high-level drivers of decarbonisation in the NIES INDC scenario. Im-provements to energy intensity provide the bulk of emissions reductions in the decades 2010 to 2020 and 2020 to 2030. In the first decade, decarboni-sation of the Japanese energy supply is marginal, due to the 2 percentage point drop in nuclear as a share of primary energy and the time-lag required to ramp up renewable energy. By contrast, in the
13. Energy intensity is defined as final energy consumption/GDP.
decade 2020 to 2030 the decarbonisation of the Japanese energy supply accelerates, as renewables ramp up and nuclear reaches its pre-Fukushima level in Japanese primary energy supply (11%). A similar pattern is seen in the RITE INDC scenario for Japan, in which decarbonisation of the energy supply contributes just 1% to the decline of Japa-nese emissions in the decade 2010-2020, before jumping to 11% in the decade 2020-2030.
Figures 11-13 display the impacts of the NIES INDC scenario across the three pillars of decarbonisation. It was noted above that a reduction in energy de-mand provides a crucial driver of emissions reduc-tions in the INDC scenario. Energy intensity of the GDP falls by 34% between 2010 and 2030, leading to an intensity level of 2.2 MJ/M$ GDP. Final en-ergy consumption falls by 8.4% between 2010 and 2030 in absolute terms, to a level of 13.7 EJ in 2030. This is close to the level projected by the Japanese government in the information accompanying its INDC submission, namely a reduction of 9.7% in absolute terms between 2013 and 2030. In the elec-tricity sector, after rising slightly between 2010-2020 due to Fukushima, the carbon intensity of the Japanese electricity mix decreases by 28% reaching 79.4 tCO2/TJ in 2030. A similar level is reached in
the RITE INDC scenario, namely 74.6 tCO2/TJ.
Elec-trification of final energy demand also climbs signif-icantly, reaching just under 26% of total final energy consumption in the NIES INDC scenario and 27.45% of final energy demand in the RITE INDC scenario.
Figure 14 displays the electricity mix for Japan in 2010, and in 2030 in the NIES and RITE INDC scenarios respectively. The NIES INDC scenario sees a slight absolute decline in electricity demand between 2010 and 2030, in the order of -3.7%;
Other
Renewable and biomass Nuclear
Gas w/o CCS Oil Coal w/o CCS
Energy-related CO2 emissions per energy Energy per GDP GDP per capita Population 2030 2020 2020 2010 2030 2010 CO2 emissions
Figure 10. High-level drivers of emissions changes, JP Figure 9. Primary energy, Japan
-40% -30% -20% -10% 0% 10% 30% 20% EJ/yr 0 5 10 15 20 30 25