This study has been performed within the framework of the Netherlands Research Programme on Climate Change (NRP-CC), subprogramme Scientific Assessment and Policy Analysis, project
‘Options for (post-2012) Climate Policies and International Agreement’
SCIENTIFIC ASSESSMENT AND POLICY ANALYSIS
Assessment of the interaction between
economic and physical growth
EPIST
Report
Editor
E.H. LysenAuthors
H.J.M. de Vries K. Blok M.K. Patel M. Weiss S. Joosen E. de Visser J. Sijm H. de Wilde October 2006This study has been performed within the framework of the Netherlands Research Programme on Scientific Assessment and Policy Analysis (WAB) Climate Change
Wetenschappelijke Assessment en Beleidsanalyse (WAB) Klimaatverandering
Het programma Wetenschappelijke Assessment en Beleidsanalyse Klimaatverandering in opdracht van het ministerie van VROM heeft tot doel:
• Het bijeenbrengen en evalueren van relevante wetenschappelijke informatie ten behoeve van beleidsontwikkeling en besluitvorming op het terrein van klimaatverandering;
• Het analyseren van voornemens en besluiten in het kader van de internationale klimaatonderhandelingen op hun consequenties.
De analyses en assessments beogen een gebalanceerde beoordeling te geven van de stand van de kennis ten behoeve van de onderbouwing van beleidsmatige keuzes. De activiteiten hebben een looptijd van enkele maanden tot maximaal ca. een jaar, afhankelijk van de complexiteit en de urgentie van de beleidsvraag. Per onderwerp wordt een assessment team samengesteld bestaande uit de beste Nederlandse en zonodig buitenlandse experts. Het gaat om incidenteel en additioneel gefinancierde werkzaamheden, te onderscheiden van de reguliere, structureel gefinancierde activiteiten van de deelnemers van het consortium op het gebied van klimaatonderzoek. Er dient steeds te worden uitgegaan van de actuele stand der wetenschap. Doelgroep zijn met name de NMP-departementen, met VROM in een coördinerende rol, maar tevens maatschappelijke groeperingen die een belangrijke rol spelen bij de besluitvorming over en uitvoering van het klimaatbeleid.
De verantwoordelijkheid voor de uitvoering berust bij een consortium bestaande uit MNP, KNMI, CCB Wageningen-UR, ECN, Vrije Universiteit/CCVUA, UM/ICIS en UU/Copernicus Instituut. Het MNP is hoofdaannemer en fungeert als voorzitter van de Stuurgroep.
Scientific Assessment and Policy Analysis (WAB) for Climate Change
The Netherlands Programme on Scientific Assessment and Policy Analysis Climate Change has the following objectives:
• Collection and evaluation of relevant scientific information for policy development and decision–making in the field of climate change;
• Analysis of resolutions and decisions in the framework of international climate negotiations and their implications.
We are concerned here with analyses and assessments intended for a balanced evaluation of the state of the art for underpinning policy choices. These analyses and assessment activities are carried out in periods of several months to a maximum of one year, depending on the complexity and the urgency of the policy issue. Assessment teams organised to handle the various topics consist of the best Dutch experts in their fields. Teams work on incidental and additionally financed activities, as opposed to the regular, structurally financed activities of the climate research consortium. The work should reflect the current state of science on the relevant topic. The main commissioning bodies are the National Environmental Policy Plan departments, with the Ministry of Housing, Spatial Planning and the Environment assuming a coordinating role. Work is also commissioned by organisations in society playing an important role in the decision-making process concerned with and the implementation of the climate policy. A consortium consisting of the Netherlands Environmental Assessment Agency, the Royal Dutch Meteorological Institute, the Climate Change and Biosphere Research Centre (CCB) of the Wageningen University and Research Centre (WUR), the Netherlands Energy Research Foundation (ECN), the Netherlands Research Programme on Climate Change Centre of the Vrije Universiteit in Amsterdam (CCVUA), the International Centre for Integrative Studies of the University of Maastricht (UM/ICIS) and the Copernicus Institute of the Utrecht University (UU) is responsible for the implementation. The Netherlands Environmental Assessment Agency as main contracting body is chairing the steering committee.
For further information:
Netherlands Environmental Assessment Agency, WAB secretariate (ipc 90), P.O. Box 303, 3720 AH Bilthoven, tel. +31 30 274 3728 or email: wab-info@mnp.nl.
Preface
The initiative for this project was taken by prof. K. Blok and prof. H.J.M. de Vries, and builds upon the expertise available at Utrecht University, MNP, Ecofys, and ECN in the area of sustainable development, economic modelling and scenario analysis. The essay by prof. de Vries on “Matter and Money” formed the starting point of the study, deepening the thinking process on the relationship between economic and physical growth. During the final workshop the partners have also benefited from the contribution by Dr. S. Bringezu of Wuppertal Institute (Wuppertal, Germany) and by the constructive remarks on the sector studies by prof. J. van den Bergh of VU Amsterdam, and his questioning of the importance of GDP.
The report has been produced by:
E.H. Lysen (editor), Utrecht Centre for Energy Research (UCE), University Utrecht, Utrecht H.J.M. de Vries, Environmental Assessment Agency (MNP), Bilthoven
K. Blok, UCE University Utrecht & Ecofys Utrecht
M.K. Patel, Department of Science, Technology and Society, Utrecht University, Utrecht M. Weiss, Department of Science, Technology and Society, Utrecht University, Utrecht S. Joosen, Ecofys, Utrecht
E. de Visser, Ecofys, Utrecht
J. Sijm, Energy Research Centre, ECN, Petten H. de Wilde, Energy Research Centre, ECN, Petten
Name, address of corresponding author
Erik H. Lysen, managing director
Utrecht University, Utrecht Centre for Energy research (UCE) Heidelberglaan 2, 3584 CS Utrecht, The Netherlands
Tel: +31-30-2537614 Fax: +31-30-2537601 E-mail: e.h.lysen@chem.uu.nl
Internet: www.uce-uu.nl
Copyright © 2006, Netherlands Environmental Assessment Agency (MNP), Bilthoven
All rights reserved. No part of this publication may be reproduced, stored in a retrieval system or transmitted in any form or by any means, electronic, mechanical, photocopying, recording or otherwise without the prior written permission of the copyright holder.
Abstract
Computer model results of possible future greenhouse gas (GHG) emissions represent an important starting point for climate policy. This is especially true for medium and long term emission scenarios such as those published by the Intergovernmental Panel on Climate Change (IPCC). In such scenarios, economic growth is a crucial input parameter because even moderate growth rates - if sustained over several decades – typically lead to high GDP values. For the discussion about future GHG emissions key questions are therefore whether the economic projections are realistic at all and, if so, whether they will show similar dynamics as observed in the past and also lead to an increase of activity in physical terms.
The central question for this project therefore was: To what extent does increased economic activity lead to increased activity in physical terms? The so-called “saturation hypothesis” assumes that with increasing GDP, human activity in physical terms will initially grow on a per capita basis, and then level off to a constant level per capita. The project focused on three main sectors: industry, transport and households.
One of the main findings of the project is that the saturation hypothesis holds in specific sectors, but in general does not hold. We found a levelling-off for some types of human activity, e.g. for steel consumption, cement consumption, and household living area. But in other cases, we rather found a development where the level of human activity continues to grow with GDP growth, e.g. for freight transport, and for the consumption of plastics and paper. It should be mentioned, though, that in most cases we have studied time series of 30 to 40 years in the past, and that saturation still may occur in the future.
Given these results two different ways forward are proposed. The first approach is to deepen the current analysis by gathering more data for more countries and for more categories, and to find a theoretical basis for the developments observed. The second and more extended approach would take into account the intersectoral interactions, because it is clear that the three sectors studies are interrelated.
Contents
Conclusions of the project 13
Executive Summary 15
1 Introduction 19
2 Setting the Stage: Matter and Money, long-term prospects for world
development 21
2.1 Introduction 21
2.2 The IPCC-SRES scenarios: economic growth and energy use 22
2.2.1 ‘Stylized fact’ assumptons in SRES 22
2.2.2 Other assumptions in SRES 26
2.3 Development of agricultural populations: past and present 29
2.3.1 Agricultural development 29
2.3.2 Energy for agriculture 33
2.4 Economic growth: the process of adding value 37
2.4.1 Economic growth and the role of matter and energy 37
2.5 Forces of economic growth 40
2.5.1 Manufacturing and dematerialization 43
2.5.2 Services and dematerialization 47
2.6 Economic output and well-being 49
2.7 Conclusions 52
3 Sector Study: Industry 53
3.1 Introduction 53
3.2 The Industry Sector in Perspective 53
3.3 Research Hypotheses 59
3.4 Empirical Results 61
3.4.1 Cross-sectoral Value Added Analysis 62
1.1 62
3.4.2 Intensity of Use and Per Capita Materials 64
3.4.3 Comparative analysis of value added and physical production 78
3.4.4 In-depth Analyses 93
3.5 Conclusions – Analyses Industrial Sector 108
4 Sector Study: Transport 111
4.1 Summary 111
4.2 Introduction 112
4.2.1 Objectives and approach 113
4.2.2 Boundaries of this analysis 113
4.3 Passenger transport 113
4.3.1 Key trends in passenger transport (Physical indicators) 113
4.3.2 Modal split and public transport 114
4.3.3 Relationship passenger transport with economic growth 116 4.3.4 Underlying mechanisms driving passenger transport 118
4.3.5 Socio-economic factors 125
4.3.6 Passenger load factor/vehicle occupancy rates 125
4.3.7 Energy use resulting from passenger travel 126
4.3.8 Main findings passenger transport 128
4.4 Freight transport 128
4.4.1 Key trends in freight transport (physical indicators) 129 4.4.2 Relationship freight transport with economic growth 130 4.4.3 Underlying mechanisms driving freight transport 133
5 Sector Study: Households and Services 141
5.1 Introduction 141
5.2 Used methods 143
5.2.1 Time series on energy use 143
5.2.2 Physical activities 143
5.2.3 Decomposition method 144
5.3 Households 145
5.3.1 Time series energy use and GDP 145
5.3.2 Underlying mechanisms 147
5.3.3 New energy functions in households 156
5.4 Services 157
5.4.1 Time series energy use 157
5.4.2 Underlying mechanisms 158
5.4.3 Decomposition analysis 163
5.4.4 Summary of main findings 164
5.5 Interaction with other sectors 164
5.5.1 Inventory of influences 164
5.5.2 Input output table 170
5.5.3 Summary of main findings 171
5.6 Conclusions and recommendations 172
6 Discussion and Conclusions 175
6.1 Relationships between physical and monetary growth of the economy 175 6.2 Assessing the Plausibility of the Economic Projections 178
6.3 Future research trajectories 181
References 185
APPENDICES CHAPTER 2 195
APPENDICES CHAPTER 3: SECTOR STUDY INDUSTRY 205
List of Tables
3.1. Specific non-renewable energy use, GHG emissions, price, and value added for
bulk materials in Germany 54
3.2. Environmental impacts of selected economic sectors in the UK, data normalized
by the value added of the respective sector 55
3.3. Contribution to the overall GDP by the various economic sectors in 19 OECD countries 62
3.4. General trends of per capita bulk materials production and consumption for 32
industrialized countries in the period of 1970-1990 77
3.5. Physical output and value added of selected products in the Netherlands for the
period of 1990-1997 79
3.6. Overview of the development of physical output and value added in selected
industries in the period of 1979-2000 85
3.7. Specific primary energy consumption for the production of selected materials 88 3.8. Development of turnover and physical production in the German chemical
industry in the period of 1990-2001 108
4.1. Top five freight sectors by value and ton-miles in the US, 1993, 1997 135 5.1 Characteristic Energy intensities of various commodities in developed countries 166 5.2. Climate change impact during building life cycle phase 169 5.3. Qualitative Physical Input-Output Table by Sectors and Goods. 170
5.4. Monetary Input-Output Table by Sectors and Goods. 171
6.1. Stylized trends for developments in selected economic sectors 177 6.2. Projected physical growth for three scenarios for Western Europe in the period
List of Figures
2.1. Relationship between population growth and income for 6 countries
1975-2002 22
2.2. Relationship between GDP growth rate and income for 6 countries 1975-2002 23 2.3. Growth accounting: contribution of various factors to GDP-growth in 7 regions
in the B1-scenario 24
2.4. Fraction of agriculture in employment (left) and Value Added (right) as function
of income 24
2.5. Fraction of service sectors in Value Added and Employment as function of
income 25
2.6. The resource curse: mechanisms, which tend to obstruct democratic
governance in resource-wealthy countries 27
2.7. The world population (%) divided according to energy use (kW/cap) classes;
the white bars are with inclusion of traditional biomass use 32 2.8. The world population (%) divided according to income (GDP/cap/yr) classes;
the white bars are valid when purchasing power parity (ppp) factors are
applied 32
2.9. Normalized inputs of labour and capital in agriculture, Belgium and USA
1885-1995 35
2.10. Inputs of labour and energy per unit of food in various farming systems 35 2.11. The economic process within the larger confines of the global ecosystem and
as a chain of value adding and eroding processes 38
2.12. Some long-term trends in the Netherlands 40
2.13. The population pyramid in The Netherlands, 1950-2050 41
2.14. Elements in the dynamics of economic growth 44
2.15. Dematerialization: decoupling of the indicator of economic activities: GDP, and
some indicator of Environmental Pressure (EP) 45
2.16. The possible dynamics of value added as a function of goods and services
output 46
2.17. Enertgy-intensity trends in China in 1990-2000 and a possible course in
2000-2030 48
2.18. Some proposed adjustments of GDP time-series, for The Netherlands and
India 49
2.19. The GDP/cap in 1990 prices and the ISEW for The Netherlands 51 3.1. Share of the industry on the total final energy consumption in European OECD
countries 2001 54
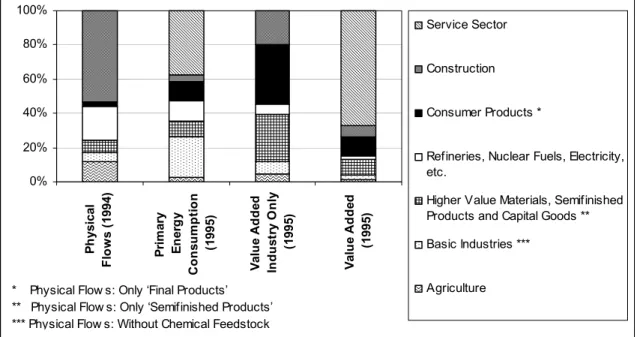
3.2. Relationship between physical and monetary values at the sectoral level 55 3.3. Sectoral shares of value added, direct material input, and primary energy
consumption in Finland, 1999 56
3.4. Factors determining the relation between physical and monetary activity in the
industry 57
3.5. Energy use and solid waste generation along the supply chain for mobile
telephones 58
3.6. Composition of value added in industrial and developing countries in the
mid/end 1990s 59
3.7. Cycle of economic growth 60
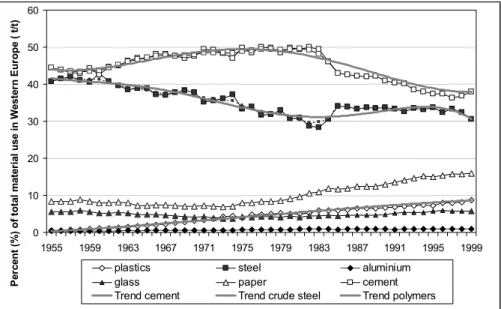
3.8. Bell-shaped curves representing the shares of bulk materials used in the EU 60 3.9. Relative shares of value added generated by the 10 largest sectors in the 19
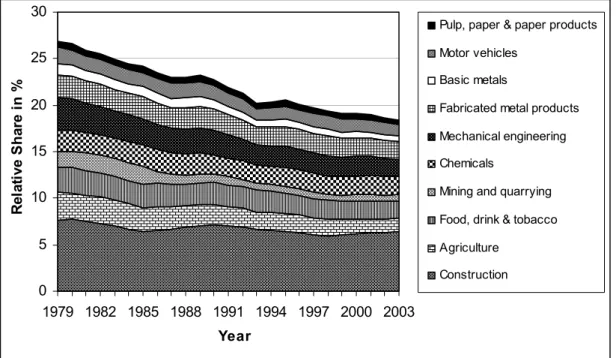
OECD countries producing physical goods and commodities 63
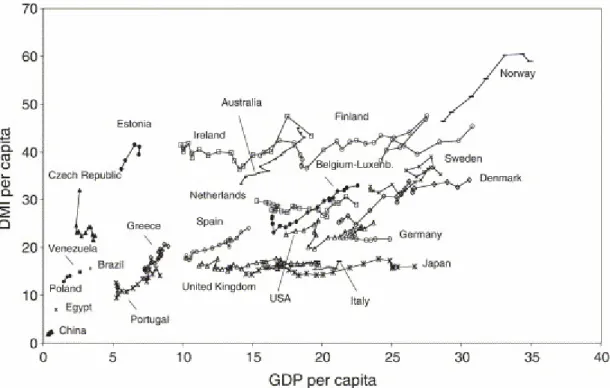
3.10. Development of per capita DMI and per capita GDP 66
3.11. Development of per capita TMR and per capita GDP 66
3.12. Intensity of use of crude steel as a function of per capita GDP 67 3.13. Intensity of use for aluminium as a function of per capita income 68
3.14. Wood - Intensity of use curve 69
3.15. Paper and paper board - Intensity of use curve 69
3.16. Polymers - Intensity of use curve 70
3.17. Cement - Intensity of use curve 70
3.19. Ammonia - Intensity of use curve 71
3.20. Steel - Intensity of use curve 72
3.21. Aluminium - Intensity of use curve 72
3.22. Wood - Per capita consumption 73
3.23. Paper and paper board - Per capita consumption 73
3.24. Polymers - Per capita consumption 74
3.25. Cement - Per capita consumption 74
3.26. Bricks - Per capita consumption 75
3.27. Ammonia - Per capita consumption 75
3.28. Steel - Per capita consumption 76
3.29. Aluminium - Per capita consumption 76
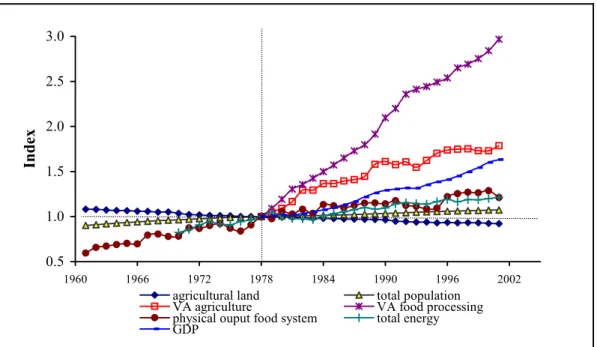
3.30. Development of physical and monetary indicators in the food supply chain of
Western Europe 79
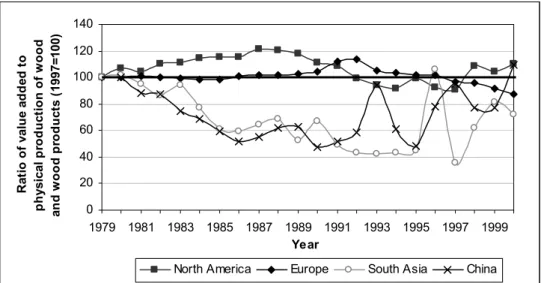
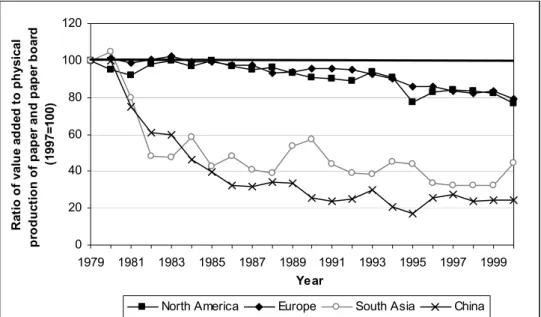
3.31. Value added and physical production in the wood and wood products industry 80 3.32. Value added and physical production in the pulp, paper, and paper products
industry 81
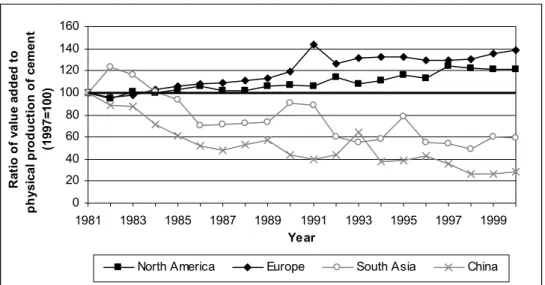
3.33. Value added of the bulk chemical industry compared to physical feedstock use 81 3.34. Value added and physical production of cement in the non-metallic minerals
Industry 82
3.35. Value added and physical production of bricks in the non-metallic minerals
Industry 82
3.36. Value added of the iron and steel industry compared to physical production of
crude steel 83
3.37. Value added of the non-ferrous metals industry compared to physical
production of aluminium 83
3.38. Development of the cumulative value added to physical output ratios 86 3.39. Value added generated in the selected industrial sectors of four regions 87 3.40. Physical output generated in the selected industrial sectors of four regions 87 3.41. Ratio of value added to physical output for selected industries 88 3.42. Physical production indicator (PPI) for bulk materials production 89 3.43. Development of the ratios of total value added and physical output in the
analyzed industrial sectors 89
3.45. Sector specific energy productivity (ratio of value added and PPI) by sector
and region 91
3.46. Ratio of value added to physical feedstock use (i) for the total chemical
industry (ISIC rev 2 Code 35) and (ii) for the producers of bulk chemicals 91 3.49. Shipments of steel from German producers to the various domestic and
international consumers 97
3.50. Delivery of iron and steel products to the UK manufacturing and fabrication 97 3.51. Deliveries of finished steel products in the United Kingdom 98 3.53. Monetary deliveries of the Iron and Steel Industry in Germany 100 3.54. Comparison of monetary and physical deliveries of the US iron and steel
industry 101
3.55. Turnover, value added and physical production of crude steel in the iron and
steel 102
3.56. Development of turnover, value added and physical production of crude steel
in the iron and steel industry of Germany in the period of 1982-2001 102 3.57. Price development of selected steel products in Germany 103
3.58 Development of steel prices in Germany 104
3.59. Shares of high value and low value steel products manufactured in Germany 105 3.60. Share of steel products covered by our analysis on the total turnover of the
German iron and steel industry 106
3.61. Turnover in the chemical industry of Germany in the period of 1978-2001 106 3.62. Consumption of plastics in Western Europe (EU-15) in the period of
1992-2003 107
4.1. Schematic view of the objectives 113
4.2. Passenger Travel per Capita, by all Modes in IEA countries 114
4.4. Passenger transport trends by mode in the US Source 115 4.5. World Air Travel and Gross World Product, 1950-2001 115
4.6. Passenger transport trends by mode in Japan 116
4.7. Trends of GDP and Transport Activity in the EU, 1970-2000 117 4.8. Air transportation growth (passenger and freight) and economic growth (GWP
= Gross World Product), 1950-2001 117
4.9 Global public transport trends as a function of income 118
4.10. World fleet of motor vehicles (MV), 1940-2002 119
4.11. Car Ownership per capita and personal consumption expenditures, 1970-2000 119
4.12. Vehicle use indicators, world, 1950-2002 120
4.13. Motorization level and wealth in OECD regions 1970-2000 120 4.14. Trends in retail gasoline prices in real terms, including taxes 121 4.15. Passenger car travel per capita (left panel) and car fuel intensity right panel)
versus average fuel price, 1998 121
4.16. Travel-time budget 122
4.17. Travel money expenditures, expressed as% of total expenditures 122 4.18. Higher incomes result in a shift to faster transport modes 123 4.19. Energy efficiency by transportation mode expressed as energy costs vs.
speed in m/s 123
4.20. Transportation network density (in km per 100 km2) in 2000 124
4.21. Passenger transport by mode, Japan, 1950-1999. 125
4.22. Development of hight speed train traffic, Europe and Japan, 1965-2000 125 4.23. World petroleum product consumption in 2002: 3.5 Gtoe 127
4.24. Energy use in passenger transport by mode 127
4.25. Energy per passenger-kilometre by mode, IEA-11 128
4.26. Truck freight tonne-kilometres per GDP 129
4.27. Trends in numbers of goods vehicles UK 129
4.28. Modal split in the EU, United States and Japan, 2000 130 4.29. Ton-miles of transported freight, United States, 1960-2003 (millions) 130
4.30. Growth in word trade and GDP 131
4.31. Links of transport and the economy 131
4.32. Road freight intensity and wealth 1970-2000 132
4.33. Trends of GDP and transport activity in the EU, 1970-2000; the vertical axis
shows relative growth in GDP, normalized to 100 in 1970 132 4.34. The effect of changes in supply chain control; shift from ‘push’ to ‘pull’ supply
chains 133
4.35. The non-defined borders in express goods transport 134 4.36. Value per ton of U.S. freight shipments by transportation Mode, 2002 134
4.37. EU national freight transport, share of goods 136
4.38. Freight transport intensities in the EU; transport intensity is a measure of the
amount of transport in relation to the size of the economy 137
4.39. Energy use in freight transport by Mode, IEA-11 138
4.40. Energy consumption breakdown for the transport sector 138 4.41. Opposite trends in transport energy use per capita 139
4.42. Demand for passenger transportation 140
4.43. Demand for freight transportation 140
5.1 Per-capita energy consumption by sectoral end use in (A) the developing
world and (B) the developed world (in gigajoules) 141
5.2. Comparison of U.S. Energy Projections: A Difference in Technology
Assumptions 142 5.3. Overview driving forces of the energy requirement in the household and
services sector (buildings) and their physical activities 143 5.4. Developments in energy use, population and GDP in OECD-countries 145 5.5. Developments in energy use, population and GDP in non-OECD countries 146 5.6. Final residential energy demand in OECD countries 146 5.7. Trends in average dwelling area in OECD countries, 1970-2000 148 5.9. Trends in living area per person with GDP per capita in OECD countries,
5.10. Patterns of floor areas for countries, whose GDP/capita are higher than 5000
US$2002, calibrated 150
5.11. Ownership of electric appliances in urban China, 1974-2004 151 5.12. Ownership of electric appliances in the Netherlands, 1987-2000 151 5.13. Physical activity indicator index for appliances in the Netherlands 152 5.14. Results of decomposition of residential energy use in Australia, 1974-1999 153 5.15. Trends in energy use for space heating, 1970-2000 153 5.16. Trends in electricity use for home electric appliances, 1970-2000 154 5.17. Results of decomposition of residential energy use in Australia, 1974-1999 154 5.18. Decomposition of residential energy use in the Netherlands, 1970-2000 155 5.19. Development of service sector energy use over the period 1971-2003 157 5.20. Service sector per capita energy use as a function of service sector value
added per capita 1970-1999 158
5.21. Number of employees in the service sector as a function of value added per
capita 159
5.22. Floor area per employee in OECD-countries, 1970-2000 160 5.23. Time series of floor area per value added in OECD-countries, 1970-2000 160 5.24. Time series of energy use per value added in IEA countries, 1970-2000 161 5.25. Floor area per capita as a function of value added per capita in the service
sector, 1970-1999 161
5.26. Number of computers per thousand employees in commercial buildings in
USA 162
5.27. Decomposition of energy use in the Australian service sector, 1983-1995 163 5.28. Decomposition of energy use in the Finnish service sector, 1983-1995 164 5.29. Energy requirements (GJ/household/yr) breakdown over various commodities 165 5.30. Expenditures (USdollar/household/yr) breakdown over various commodities 166 5.31. International comparison of household energy breakdowns 167 5.32. Monetary input from service sectors to all sectors, in Germany 1995 168 5.33. Monetary input from service sectors to all sectors, in the USA 1997 168 5.34. Monetary input received by other intermediate and final demand sectors from
Conclusions of the project
One of the main findings is that the saturation hypothesis holds in specific sectors, but in general does not hold. The saturation hypothesis assumes that with increasing GDP, human activity in physical terms will initially grow on a per capita basis, and then level off to a constant level per capita. We found a levelling-off for some types of human activity, e.g. for steel consumption, cement consumption, and household living area. But in other cases, we rather found a development where the level of human activity continues to grow with GDP growth, e.g. for freight transport, and for the consumption of plastics and paper. It should be mentioned, though, that in most cases we have studied time series of the past 30 to 40 years, and that saturation may occur in the future. This also because there are obvious limitations, such as maximum per capita car ownership or minimum number of persons per household, that in the end will affect the future development of the related activity levels.
For the total of 19 OECD countries, we found the share of industry on the total GDP to decrease from roughly 27% in 1979 to 18% in 2002. This indicates that industrialized countries develop towards service economies with both the service and transport sector growing faster than GDP per capita. However, this finding does not mean that the absolute value added of the industry declines. Rather the opposite is true, as value added of the industrial sector continues to increase but at slower rates than the total economic growth.
Our analysis of the industrial sector revealed a trend towards re-coupling between physical output and value added for paper and paperboard production and for cement production in South Asia and China. We furthermore identified a trend towards decoupling (i) between cement production and value added of the non-metallic minerals industries of North America and Europe and (ii) for aluminium production in the non-ferrous metals industry of China. For all other bulk material industries analyzed (i.e. wood production, feedstock use in the chemical industry, production of bricks, iron and steel, and aluminium production in the non-ferrous metals industry of North America, Europe, and South Asia) we were not able to identify robust trends towards either decoupling or re-coupling between monetary and physical activity. Based on this semi-qualitative data analysis, we find therefore no indication for a general trend towards decoupling between physical and economic growth in industry.
Unlike the industrial sector, both passenger and freight transport have been growing faster than GDP over the past decades. With rising income levels we observe (i) a trend towards faster passenger transport modes and (ii) a trend to specialized high-speed logistic freight chains (just- in-time delivery), along with reduced load factors, compared to traditional bulk oriented logistics. Although the energy efficiency of all transport modes for passenger and freight transport has increased over the past decades (partly as a consequence of energy conservation policies), the transport volumes have been growing substantially faster, resulting in an overall increase of energy use and CO2 emissions.
For the total transport sector, we conclude that decoupling between passenger and freight transport and per capita GDP cannot be observed and is unlikely to occur in the near future as saturation in both passenger and freight transport is not yet occurring. The energy use of the transport sector will continue to increase. It is therefore likely that the transport sector becomes the major CO2 emitter of all economic sectors in the next decades.
Next to the increasing demand for transportation also the need for other services increased markedly. The increasing complexity of modern economies stimulates activities in the service sector, i.e. health, education, finances, government. Linking the monetary growth of the service sector to physical activities is, however, complicated by the fact that data about physical activities in the service sector are scarce. In absolute terms, the number of employees in the service sector as a whole rose in all studied IEA-countries in the period of 1970-2000, while the amount of office space per employee (in m2) appears to be relatively stable over time.
Regarding the amount of office space per employee versus value added of the service sector no clear trend could be identified. The use of office equipment has increased significantly in the last ten to fifteen years. Based on limited available information, it is expected that the amount of
office equipment did not reach saturation yet. Demand for more comfort (indoor climate, electronic devices) and developments in the area of communication technology might further increase the amount of office equipments and as a consequence the energy demand of the service sector.
The data of developed countries indicate a trend towards re-coupling between the number of employees and the use of office equipment with the value added generated in the service sector. No general trends are observed regarding the development of floor area per employee and increasing value added in the service sector.
Households account for almost one third of the total worldwide final energy consumption. Next
to economic and demographic growth, the average dwelling area, number of persons per dwelling, average living area per capita and appliances per capita are the main drivers for energy consumption in households. In our analysis, we found evidence that total energy demand will level off at higher living standards, and that a decoupling of economic growth and total energy consumption in households is occurring. However, we could not find a uniform trend towards decreasing per capita total energy use in households.
For most countries the space heating energy intensity declines rapidly, and has a major impact on the total energy use. Declining energy use for space heating is caused by increased energy efficiency (e.g. insulation, energy efficient heating systems). As of 1970 the continued growth in absolute dwelling area with increasing GDP per capita is striking, despite large differences between individual countries regarding per capita dwelling area. However, as the average dwelling area per capita grows slower than per capita GDP, we observe a trend towards weak decoupling between growth of absolute dwelling area and GDP. We furthermore identified a general trend towards increasing living area per person as household occupancy decreases with increasing per capita GDP. The current trend in dwelling area development shows that although average dwelling size per capita is still growing, the growth is slowing or even stabilising in several developed countries. With potentially slowing or even declining population a stabilisation of total living area can be expected in the future. In most developed countries the increase of energy consumption in households over the last decades is due to the increased electricity consumption of new appliances (even when some of it is offset by increased efficiency of major energy consuming appliances). The physical indicator ownership of electric appliances shows a re-coupling trend with GDP per capita.
Given the above results two different ways forward are proposed. The first approach is to deepen the current analysis by gathering more data for more countries and for more categories, and to find a theoretical basis for the developments observed. The second and more extended approach would take into account the intersectoral interactions, because it is clear that the three sectors studies are interrelated.The ongoing discussion about the role of GDP as a proper (or improper) indicator for well-being, should be included in further research in the area of the relationship between physical and economic growth.
Final remarks: The main objective of the essay “Matter and Money”, which was written at the
start of the project, was to enrich the ways in which we think about our future, the future of the human race and of the earth. Models can help in this thinking process but they have to be improved to deal better with real-world complexity. They can be used in telling richer and more varied stories. In this way, also our perspective on what sustainable development pathways can and should be will be broadened, for instance vis-à-vis the matter-and-money issue. A few roads seem particularly promising for further research. First, obtaining a better understanding of the functioning of subsistence economies and the conditions for development, using both earth science and social science theories and tools. Next, the analysis of what drives economic growth and which forces influence the (de)coupling of monetary growth from materials flows has to be strengthened. The role of services, including the ICT-sector, deserves more attention, as part of this analysis. Finally, the link between economic growth - and in particular GDP-growth - and the experience of well-being has to be investigated and debated much more thoroughly if we are serious about the quest for sustainable development.
Executive Summary
Decoupling between physical and monetary growth of the economy has been identified as one of the key strategies towards sustainable development. The extent to which economic and physical activity are decoupled from each other has important implications for long-term energy and emissions scenario modelling. This is especially true for greenhouse gas (GHG) emission scenarios such as those published by the Intergovernmental Panel on Climate Change (IPCC, 2000). In such scenarios, economic growth (expressed in monetary terms) is a crucial input parameter. Even moderate growth rates - if sustained over two or more decades – typically lead to high to very high GDP values, indicating that also energy consumption and hence CO2
emissions might reach tremendous levels.
This assessment project aims therefore at analyzing the relationship between physical activity and economic growth in three economic key sectors, i.e., (i) industry, (ii) transport, and (iii) households and services. Our research activities are mainly based on a literature review and were complemented by own data analyses. The report sets out with an overview chapter, providing the conceptual background for three sector studies (Chapter 2), which are presented in the subsequent three chapters (Chapter 3–5). In the final Chapter 6, we provide a summary and conclusions and we identify future research needs.
In order to assess the consequences of different trajectories of economic, technological and societal developments on energy use and greenhouse gas emissions, computer-based scenario analyses are being performed. Depending on the storyline, these make use of various ‘stylized relationships’, which are sometimes discussed explicitly, while they often remain implicit. As discussed in Chapter 2, more in-depth analysis is needed, adding bio-geographical, techno-economic and institutional heterogeneity. This would also allow broaden our perspective of what sustainable development pathways can be. Few directions, which seem particularly promising for research, are (see Chapter 2):
(i) to gain a better understanding of the functioning of subsistence economies and the conditions for development, using both earth science and social science theories and tools, (ii) to analyze the drivers of economic growth and the forces that influence the (de)coupling of
monetary growth from materials flows
(iii) to pay special attention to information and communication technologies (ICT) and
(iv) to investigate thoroughly the link between economic growth - and in particular GDP-growth - and the experience of well-being and to debate this issue much more.
This report, which is primarily related to point (ii), studies the relationship between physical and monetary flows for the industry sector (Chapter 3), transport (Chapter 4) and households and services (Chapter 5).
The industry sector’s share of the total GDP decreased for the total of 19 OECD countries from roughly 27% in 1979 to 18% in 2002. This result indicates that industrialized countries develop towards service economies with both, the total service sector and the transport sector growing faster than per capita GDP. However, this finding does not mean that the absolute value added of the industry declines. Rather the opposite is true, as the value added of the industrial sector continues to increase but at slower rates than the total economy.
This development is also reflected by the consumption of various bulk materials: While we find a general trend towards declining intensity of use with increasing per capita GDP, we also identify a trend towards increasing absolute per capita materials consumption. These results show that the shift towards the service economy can lead to weak decoupling between physical and monetary growth but not to absolute dematerialization, i.e. an absolute decline of materials consumption.
Based on the analysis of physical production and value added data of selected bulk material industries we find no indication for a general trend towards decoupling between physical and economic growth. For scenario projections, this means that each percentage growth of value
added in the bulk material sectors can roughly be expected to lead to at least a comparable growth in physical output.
Unlike the industrial sector, both passenger and freight transport have experienced high growth rates over the past decades. With rising income levels we observe (i) a trend towards faster and long-disctance passenger transport modes and (ii) a trend to specialized high-speed logistic freight chains (just in time delivery), along with reduced load factors and longer transport distances as compared to traditional bulk oriented logistics. This development has overcompensated the energy efficiency gains and ultimately results in an overall increase of energy use and CO2 emissions. We would therefore conclude that decoupling between
passenger and freight transport and per capita GDP cannot be observed and is unlikely to occur in the near future as saturation in both passenger and freight transport is not yet occurring. Next to the increasing demand for transportation also the need for other services increased markedly. In absolute terms, the number of employees in the service sector as a whole rose in all studied IEA countries in the period of 1970-2000, while the amount of office space per employee (in m2) appears to be relatively stable over time. Regarding the amount of office space per employee versus value added of the service sector no clear trend could be identified. The use of office equipment has increased significantly in last ten to fifteen years. Based on limited available information, it is expected that the amount of office equipment did not reach saturation yet. As a consequence energy demand of the service sector will continue to increase. In our analysis of households, we found evidence that total energy demand will level off at higher living standards, and that a decoupling of economic growth and total energy consumption in households is occurring. However, we could not find a uniform trend towards decreasing per capita total energy use in households, ascountries that start at a relatively high (historical) level of energy use per capita tend to reduce their per capita energy demand with increasing per capita GDP (e.g. Denmark and Germany) while countries that have a relatively low residential energy use per capita at low GDP level like Japan, Finland and Norway continue to increase their energy use per capita. While developed countries show very large differences in per capita energy use, a convergence towards similar levels of residential per capita energy use is hence observed.
For most countries, the space heating energy intensity declines rapidly and has a major impact on the total energy use. As of 1970 the continued growth in absolute dwelling area with increasing GDP per capita is striking, despite large differences between individual countries regarding per capita dwelling area. However, as the average dwelling area per capita grows slower than per capita GDP, we observe a trend towards weak decoupling between growth of absolute dwelling area and GDP. We furthermore identified a general trend towards increasing living area per person as household occupancy decreases with increasing per capita GDP. Our findings for the three sectors are, however, subject to uncertainties, partly due to dubious data quality. The identified trends have not been subject to a sound quantitative statistical testing. To that end, a more rigorous statistical hypothesis testing via regression analysis should be applied.
Combining these empirical findings with GDP projections for Western Europe (see Chapter 6.2), we conclude that in the high scenario (scenario IPCC-A1) and the medium growth scenario (scenario ‘Strong Europe’) the physical flows of bulk materials are likely to increase by a factor of around 2.0 to 2.5 in the period 2000 to 2020. For transport (commercial transport only), the physical flows (ton kilometres and passenger km) may increase by a factor of approximately 2 to 3 between 2000 and 2020, while, in contrast, the changes expected for the service sector (without transportation) are rather moderate, with mean estimates for absolute floor space growth between 1.2 and 1.5.
These results seem implausibly high for bulk materials, while they seem rather acceptable for transportation and services. This leads to the following interesting new insights for these two scenarios:
(i) The results indicate that the economic projections for industry tend to be too high, while the economic projections for transport and for services seem to be in the right range.
(ii) Only weak decoupling between physical and monetary growth seems in sight, while the physical flows in absolute terms are expected to increase very substantially and absolute decoupling seems unlikely.
The report concludes by summarizing the remaining information gaps and by providing recommendations for further research, for which numerous opportunities exist (Chapter 6.3).
1 Introduction
Decoupling between physical and monetary growth of the economy has been identified as one of the key strategies towards sustainable development (Schmidt-Bleek, 1994, von Weizsäcker et al., 1997, de Bruyn, 1999). For more than 15 years, the sustainability discussions have been dealing with the unresolved controversy, to which extent increasing economic wealth translates into enhanced consumption of resources, materials, and energy. According to several authors (e.g., Cleveland and Ruth, 1999, Bringezu et al., 2004) there is still no compelling empirical evidence that economic development has decoupled from material and energy consumption for the economy as a whole. At the same time, according to numerous qualitative and quantitative studies, material and energy intensity in industrialized countries could be reduced by a factor of 4 to 10, leading to absolute decoupling between physical and monetary growth in the future (Schmidt-Bleek, 1994, von Weizsäcker et al., 1997).
This controversy has important implications for long-term energy and emission models, the results of which represent one of the starting points for energy policy and environmental policy. This is especially true for greenhouse gas (GHG) emission scenarios such as those published by the Intergovernmental Panel on Climate Change (IPCC, 2000). In such scenarios, economic growth is a crucial input parameter. Hence, even moderate growth rates - if sustained over two or more decades – typically lead to high to very high GDP values. In spite of a growing world population (rising from over 6 billion nowadays to nearly 9 - 10 billion by 2050) economic growth scenarios result in a substantial increase of per-capita-income (e.g., from around 4,000 US$/cap nowadays to values in excess of 45.000 US$/cap by 2050). Key questions are therefore: • whether such economic projections are at all realistic or whether they might be overoptimistic
by (wrongly) assuming that similar dynamics as observed in the past will also be experienced in the future (especially in developing countries) and that environmental feedbacks will not interfere (as was the assumption in the IPCC-scenarios), and
• to which extent the increased economic wealth will translate into physical growth, energy use and emissions, and whether feedbacks from the resource supply system have to be accounted for.
A deeper insight into the latter question (especially concerning the relationship between economic and physical growth) could be key for answering the first question. Improving the understanding of the relationships and dynamics regarding economic growth and physical activity may subsequently allow bringing in new arguments into the controversial discussions around the IPCC emission scenarios in the recent past (e.g. Nakicenovic et al., 2003). Ultimately, this could offer a first basis for a renewed discussion about the extremely wide ranges of scenario results and their plausibility.
The relationship between monetary growth and GHG emissions can be broken down into two factors, i.e., the relationship between
• monetary and physical growth (or: flows) and between
• physical flows on the one hand and energy use and GHG emissions on the other.
The latter relationship is subject to technology choices (e.g. standard versus highly efficient technology) and to the fuel mix (overall carbon content of fuel). The analysis of these aspects is not the primary aim of this study, although they cannot be completely neglected when reviewing existing work. Instead, it is the primary goal of this assessment study to compile and interpret all available analyses on the relationship between monetary and physical growth. While being set up in this fashion, it became clear during the collection of the relevant literature that the amount of work addressing this specific question is very limited, even if implicit coverage is included. It was therefore decided to conduct, within the means of this project, own data analyses with readily available data in order to firstly obtain a better understanding of the relationships and secondly to explore possibilities of conducting more thorough investigations. The extent to which this has been possible differs across the various sectors covered by this report.
Following this introduction, the study is composed of three parts: the first part, represented by Chapter 2, provides an overview of generally accepted versus unclear relationships (‘stylized facts’) which are implemented in large energy-economy-emission models such as the used for IPCC scenario projections; furthermore missing elements and links are identified. The second part consists of three chapters, which discuss the relationships between physical and monetary flows in the three sectors industry (Chapter 3), transport (Chapter 4) and households (Chapter 5). Finally, in Chapter 6, we summarize our findings and draw conclusions about the current understanding and possible future developments regarding physical and monetary growth. We finally identify possible steps to be taken by further research.
2
Setting the Stage: Matter and Money, long-term prospects for world
development
Bert de Vries, MNP/Utrecht University
2.1 Introduction
In exploring the causes of human-induced climate change and the options of mitigation and adaptation, it is necessary to analyse the forces behind societal development. The climate change debate is thus intricately interwoven with the aspiration for a decent life for the larger part of the human population, that is: with development. It also signals, with other signs of environmental deterioration, the need to develop within the constraints posed by the natural environment, that is: the need for sustainable development. Four global analyses of the last decade bring these threads together:
• The Special Report on Emissions Scenarios (SRES) presented to the IPCC in 2000, which explored possible greenhousegas emission trajectories (Nakicenovic et al., 2000);
• The Millennium Development Goals (MDG) as formulated by the UNDP and accorded by the UN in 2000 (www.undp.org/mdg); which expresses the political intention to increase quality of life for the millions of people living in destitute circumstances 1;
• The Global Environment Outlook (GEO) of UNEP (http://www.unep.org/geo) which is published since 1997 on a bi-annual basis and addresses the major regional and global environment problems, both current and emerging, and explores possible and desirable directions towards sustainable development; and
• The Millennium Ecosystem Assessment (MA) which evaluated the role and future of ecosystem services and the consequences of their misuse and options for sustainable management (www.millenniumassessment.org).
From these reports one may conclude that, in this first decade of the 21st century, humanity has the relevant knowledge and the good intentions for global sustainable development. Yet, the path towards it looks bumpy and full of possible sidetracks, some of them outright catastrophic. In this essay I will try to shed
light on some controversies surrounding the interpretation of our predicament and on strategies for a more sustainable development path.
I call it an essay because it will be a mixture of personal valuations and scientific observations. The focus is on the interface between the earth/life sciences with their physical orientation and the social sciences with their monetary as well as socio-cultural orientation. I use the shorthand title Matter and Money. The dominant context is climate change as analysed in the SRES analysis, reflecting my own involvement (De Vries, 2006). The essay is meant to provide constructive criticism in order to improve the next round of long-term global change forecasts, for the IPCC and other organizations.
First, I give a brief description of some of the assumptions on economic growth and energy use in the SRES and discuss briefly their validity. In paragraph 3, the process of agricultural development in the low-income regions is explored, with an emphasis on energy use. In paragraph 4, the forces behind economic growth as a process of adding value are investigated, with some suggestions how to get more insight into the dynamics of dematerialization. Next, some reflections on the service sector are given, after which I finalize with a discussion of the relationship between economic growth and happiness.
1 It is worth noting that energy is not mentioned explicitly in the MDGs.
Statement: The rationale for the IPCC-SRES
economic growth – energy demand scenarios
is scientifically weak
2.2 The IPCC-SRES scenarios: economic growth and energy use
2.2.1 ‘Stylized fact’ assumptons in SRES
De Mooij and Van den Bergh (2002) conclude that 'it is difficult, if not impossible, to draw general conclusions about the reconciliation of environmental preservation and growth' and suggest to think in terms of different perspectives (or worldviews). This has also been the approach in the construction of greenhousegas emission scenarios (SRES) and advocated more in general in investigating complex socio-ecological systems (De Vries, 2001). In this essay I will use the notion of generic relationship - or metamodel, hypothetical law, 'stylized facts', or 'logic' - to refer to rather general, abstract correlations which often represent such perspectives and suggest causal mechanisms within confined domains of validity. Indeed, different (scientific) perspectives upon the growth-environment nexus and the associated storylines or narratives can be understood quite well in terms of such generic relationships. The rationale for the IPCC-SRES population and economic activity scenarios was predominantly based on a few stylized facts (Nakicenovic et al., 2000, De Vries et al., 2000): 1. Population growth will decline with rising income (GDP/cap) and economic growth will be
bell-shaped as a function of income (GDP/cap);
2. Economic growth (cq. its driving force: factor productivity growth) will correlate positively with globalization = ‘free’ trade, and globalization = ‘free’ trade will speed up income convergence between rich and poor countries/regions; for both, technological developments are crucial;
3. Economic activity related indicators (Value Added VA and employment) will follow structural change, i.e. the dominant share will change from agriculture to manufacturing/industry and then to services;
4. With rising income, resource intensity declines (‘dematerialization’ - Appendix B) and environmental stress decreases (‘environmental Kuznets curve’ - Appendix C).
These metamodels have not all been introduced explicitly; some entered the scenario construction via the relationships used in the models and/or via the criteria used for model result evaluation. All of these metamodels are contingent upon underlying assumptions about choice of countries, periods, concepts and aggregation levels. Most of them conceal such underlying uncertainty and diversity in explanatory mechanisms that they should only be used in the context of a qualitative storyline or narrative - as the IPCC-SRES team did. In this way they are not so much a scientific truth as a mental model dominating the actions in a particular world future. Let us briefly look at the evidence for these 'stylized facts' assumptions.
Population growth and income (6 countries 1975-2002)(WDI 2004) -1 0 1 2 3 0 8 16 24 32 Thousands 1995 PPP $/cap % /ye ar Netherlands Ireland Thailand Chile Italy South Africa
Figure 2.2. Relationship between GDP growth rate and income for 6 countries 1975-2002
Population and economy. There has been a consistent fall in nearly all countries in the world in
the population growth rate since the second half of the 20th century, as part of the demographic transition (Rotmans and De Vries 1997; Figure 2.1). In the same period, income measured as GDP/capita has risen - so on the average the relationship appears to hold. But significant exceptions have been observed. For instance, fertility rates in low-income regions drop faster than had been expected only a decade ago – an acceleration. In some regions and periods, such as Russia, an (expectation of) lower income or political instability has caused a decrease in fertility - a reversal. South Africa has experienced a period of large socio-political change and the rise of HIV-AIDS. Saudi Arabia's population and income growth reflect its culture as well as its oil wealth. The reproductive behaviour of the Irish population has not kept pace with the fast rise in income.
As to the relationship between economic (GDP) growth vs. income (GDP/cap), the relationship is spurious: for a total of 60 countries between 1985 and 2000, no meaningful aggregate relationship is found (Figure 2.2). Possible explanations of lower growth rates in the high-income (OECD-) regions are saturation, ageing, a lower savings rate and a labour-leisure trade-off. However, for low-income countries there is a wide variety in GDP-growth rates and other explanatory variables than income have to be identified. Most macro-economic models tend to capture such factors by linking GDP-growth to the labour force and the capital stock (growth). The slowdown in productivity growth with income growth is then imputed by a declining total factor productivity (tfp) growth. In this way the WorldScan model has been used for the forward extrapolation of regional economic growth paths (Figure 2.3; De Vries et al., 2000).
Trade. The causal mechanisms between economic (GDP) and (global) trade are in the
aggregate more a matter of belief and hope than of historical evidence. I have not carefully searched the economic literature but the issue is notoriously difficult to measure and controversial. Trade is assumed to be beneficial as the comparative advantages in cheap labour and resources are realized by globally orchestrated capital flows - but transaction costs are not considered and the cheap transport costs of the last decades are an explicit condition. Here, too, macro-economic models reproduce the benefits of trade in an 'open world' as an outcome of input assumptions. In combination with a faster growth in labour productivity through education and in total factor productivity (tfp), the simulations generate income convergence - in the 'open world' scenarios more than in the 'closed world' ones2. As a result,
2 The income convergence in the SRES has been introduced explicitly in the two globalizing scenarios as
something which would occur as a side-effect of open market dynamics (A1) or as a globally formulated and supported objective (B1). It has led to the still inconclusive debate about the use of mer or ppp in comparing income across regions (Nakicenovic et al., 2003). Income convergence is less in the non-globalizing futures, but it may be thought to be compensated for by more pluralism in cultural identity and socio-political organization and hence acceptance.
GDP growth vs. Income (60 countries, 1930 mln persons in 2000) -8 -4 0 4 8 12 0 5000 10000 15000 20000 25000 30000 Income (GDP 1995 I$/cap/yr) G D P a nnua l g rowt h r ate (% /y r) 2000 1995 1990 1985 Poly. (1995) Poly. (2000) Poly. (1990) Poly. (1985)
models such as the WorldScan model generate high GDP-growth in the low-income regions, which is for over 80% accounted for by capital accumulation and technological innovations (Figure 2.3; cf. De Vries et al. 2000).
-1 0 1 2 3 4
EU USA EE FSU CHI ASEAN+1 INDIA
annual % growth
empl. high empl. low extra empl. high extra empl. low cap. acc. tfp
Figure 2.3. Growth accounting: contribution of various factors to GDP-growth in 7 regions in the B1-scenario (De Vries et al., 2000); the black parts indicate growth from increase in total factor productivity (ftp), the striped ones from capital accumulation; rising capital-labour ratios and the other from increase in labour force size and skill level
Figure 2.4. Fraction of agriculture in employment (left) and Value Added (right) as function of income
Structural change. The cross-country and time-series data confirm the consistent decline of the
share of agriculture in total Value Added (VA) with rising income (GDP/cap) - but for the share in total employment the situation is less clear (Figure 2.4). Apparently, the growth in the non-agricultural sectors is not always and/or rapidly absorbing the rural unemployed. The data also seem to confirm the initial rise of the fraction of manufacturing in total VA, followed by a decline with a concomitant rise in the service sector fraction. Yet, as with so many intercountry comparisons, there are large variations in the trend (Figure 2.5). For instance, Thailand has a disproportionately large fraction of the population working in the (formal) services sector - which highlights its role as tourist place. The Czech Republic has a rather high service sector employment in view of its pre-1989 socialist industry-orientation - there are still large uncertainties about the direction the Eastern European economies will go.
Employment fraction of agriculture vs. Income (60 countries, 1930 million persons in 2000)
0 20 40 60 80 100 120 0 5000 10000 15000 20000 25000 30000 Income (1995 I$/cap/yr) F ract ion of agri cul tu re in e m pl oy m ent (% 2000 1995 1990 1985 Poly. (2000) Poly. (1990) Poly. (1995)
Fraction of Value Added in GDP from agriculture vs. Income (60 countries, 1930 mln persons in 2000)
0 10 20 30 40 50 60 0 5000 10000 15000 20000 25000 30000 Income (1995 I$/cap/yr) Fr ac ti on o f V A in G D P f ro m A gr icu lt u re ( % 2000 1995 1990 1985 Poly. (1990) Poly. (1995) Poly. (2000) Poly. (1985)
Several hypotheses for structural economic change have been advanced as an explanation. Yet, even the empirical evidence is less solid than it seems. A recent reconstruction indicates that the private and public services sector (excluding transport and communication) in Sweden 1800-1990 has not increased its share in VA in real terms - it remained at roughly 30% (Kander, 2005). It also shows the notorious problem of measuring service sector output and VA adequately.
Share Service sector in employment (6 countries 1975-2002)(WDI 2004) 0 20 40 60 80 0 8 16 24 32 Thousands 1995 PPP $/cap %/ ye ar Netherlands Turkey Thailand Chile Italy Czech Republic
Figure 2.5. Fraction of service sectors in Value Added and Employment as function of income
Economy, resources and environment. Will economic and physical flows decouple upon further
economic growth and alleviate the problems of resource scarcity and environmental deterioration? Does a theory of dematerialization, i.e. a reduction in (raw) material intensity of economic activities, hold (Appendix B)? A first question: Did dematerialization cq., decoupling happen? The conventional economic indicators show that the energy (and material) intensity measured as commercial energy per unit GDP have declined. Why? The major factor has been the continuous drive to reduce production costs and hence energy costs cq., use - a drive which was accelerated by the oil price hikes in the 1970s and early 1980s and the subsequent wave of innovations. Another explanation has been the transition to a service economy, because the service sectors tend to be less energy-intensive. This explanation may be overstated in the aggregate for two reasons:
An analysis of Danish economic trends suggests that private and public services should be separated, as the former is linked to manufacturing and has an energy productivity significantly higher than for the latter - reflecting the role of transport and the higher labour productivity in the private service sector (Jespersen, 1997);
The share of the service sector may in real terms not have increased (see above - Kander 2005). Instead, a more convincing hypothesis might be that ICT/microelectronics have led to a dematerialization of the industrial production and of consumption activities (cf. paragraph 4). In other words, the decrease in industrial energy-intensity at the margin mattered more than the switch to service sector activities 3.
Unfortunately, the issue is confused by ambiguities about the concept and measurement of service sector output and its relation to other economic activities, in particular for the non-market public sector. Hence, several other explanations for the decoupling of physical and monetary growth have been put forward - and the debate continues.
New ways of investigating the activities in what is called 'the service sector' are needed. For instance, the final demand for services tends to grow faster with rising income - an observation
3 The effect may have slowed down somewhat due to reduced economic growth as a response to rising oil
which asks for a conceptual redefinition of services as an activity which adds value to commodities when these are used by individuals and organizations as agents of knowledge and information (Parrinello 2004). It may then be argued, for instance, that dematerialization happens because consumers substitute services for commodities - and not because of, for instance, environmental behavioural change. Evidently, an adequate evaluation would have to include the accumulation of human capital - its omission underestimates the VA of the (public) service sector - and to consider the role of time use and time constraints in consumption activities (Cogoy, 2004, Jalas, 2002).
More generally: is there any evidence that environmental stress will recede automatically when income rises? The so-called Environmental Kuznets Curve (EKC; Appendix C) has been formulated to express the observation that the emission-intensity of certain pollutants (such as SO2 and NOx) has a bell-shaped form as a function of income across a large group of countries
and over time. One explanation is that, particularly at high population and economic and hence emission density, a rising middle-income class starts to appreciate increasingly a clean and healthy environment as part of their quality of life - and hence emission reduction measures are taken. In combination with technological developments - the cost to reduce one unit of emission has declined significantly for many pollutants - this has led to the bell-shaped curve. However, the EKC has to be refuted as an aggregate phenomenon because it may not occur for more persistent and essential substances (such as CO2) and it may hide the shift from the more
visible and easy-to-reduce substances to more insidious ones with difficult-to-prove and long-term effects.
Despite these caveats, most economy-energy-environment models use the above stylized facts in one form or another to generate (carbon) emission scenarios, using a variety of mechanisms to simulate energy demand. Among these are demand saturation, autonomous and price-induced innovations, technology transfer, resource depletion and substitution to new energy carriers and technologies. The resulting energy use implies in almost any scenario a reduced energy-intensity measured in GJ/$. It is also assumed that higher income leads to more severe environmental policies - and as a result emissions of for instance SO2 decrease in almost any
scenario and the fastest in the high-growth ones 4.
2.2.2 Other assumptions in SRES
Evidently, quite a few assumptions entered the storylines and modeling without any explicit consideration or argumentation. I suggest the following:
1. The emergence of a welfare state with democratic rights, social security arrangements and taxation goes along with the population and economic growth pathways;
2. Collective goods and services needed for a well-functioning health, educational and transport system (infrastructure) will be provided by some mixture of public and private activities;
3. Importantly in the present context: environmental feedbacks can be accommodated throughout the scenario period without major (voluntary or forced) changes in the extent and nature of economic growth 5.
Behind each of these assumptions, various metamodels - or even social science schools – do exist to justify them in terms of an underlying logic. I will briefly discuss each.
The welfare state. It is a key question - and uncertainty - whether governments in low-income
countries can get and maintain the legitimacy and develop the required effectiveness needed for the transition to a welfare state, with extensive collective arrangements in the form of infrastructure (health, education, transport) and social security arrangements (unemployment,
4 A recent comparison of SRES with historical data indicates an underestimation of the reduction rate of
sulphur dioxide emissions (Van Vuuren and O'Neill, 2006).
pensions) 6. Proven concepts of public and private arrangements as in the European welfare state are no longer self-evident, with globalizing capital and goods and services markets and at the same time increasing pressure to constrain migration. The build-up of 'human capital' is a necessity for economic growth - but how large a fraction of the population is going to participate in it? Will people in Africa, Asia and South-America be confronted with highly labour-productive manufacturing and services, with large parts of the population becoming the servants of those who succeed? Is there hope that novel, community-based pathways are found to decent prosperity for these large populations? In SRES these issues have been dealt with in the form of narratives, assuming that in the globalizing futures (A1 and B1) the forces of ‘modernity’ would prevail and enable some kind of ‘welfare world’. If these forces fail, this utilitarian utopia will not emerge, or later.
Legitimacy of governments. It is evident that the legitimacy of government is in quite a few
countries either absent or under threat. In some places this is part of the longer term transition from tribal oriented governance to the more ‘modern’ forms of the nation-state and the welfare state. Inevitably, this is a slow process with all kinds of conflicts and possibly novel outcomes. The colonial past, cultural traditions, growing populations and rising expectations – excited by the fast dissemination of images and information across the world - make governance in many countries a very difficult task. Some elites simply stick to authoritarian rule, using their resource wealth to suppress their populations or buy their consent. This is the so-called resource curse: a state's reliance on either oil or mineral exports tend to make it less democratic (Ross, 2002; Figure 2.6). In other countries the emergence of ‘westernized’ elites leads to a variety of conflicts with the more traditionally oriented parts of the population – as is splendidly described by Castells (1997) in his book The Power of Identity.
Based on: Ross 2001
Fuel/mineral resources
military expenses
[spending on] internal security (guards, police etc.)
Repression effect
State revenues from fuel/mineral resources
Opportunity for oligopoly
[pressure for] democratic governance
[spending] on patronage
formation of social capital
[need for] taxation Rentier effect
[investment in] education
Modernization effect
advancing ‘modernization’(specialization, urbanization, communication etc.)
Resource abundance and [lack of] democracy
Figure 2.6. The resource curse: mechanisms, which tend to obstruct democratic governance in resource-wealthy countries
In the present context, the issue really is whether governments can gain legitimacy by their ability to guide the process of economic development and provide basic goods and services, as
6 See for instance the recent report India Infrastructure Report 2006 / Urban Infrastructure, Oxford