Greenhouse gas mitigation scenarios
for major emitting countries
Analysis of current climate policies and mitigation commitments:
2019 update
Authors:
Takeshi Kuramochi, Leonardo Nascimento, Maria Jose de Villafranca Casas,
Hanna Fekete, Gustavo de Vivero, Swithin Lui, Marie Kurdziel, Mia Moisio, Paola
Tanguy, Louise Jeffery, Tessa Schiefer, Masahiro Suzuki, Niklas Höhne
(NewClimate Institute) Heleen van Soest, Michel den Elzen, Kendall Esmeijer,
Mark Roelfsema (PBL Netherlands Environmental Assessment Agency) Nicklas
Forsell, Mykola Gusti (International Institute for Applied Systems Analysis)
Greenhouse gas mitigation
scenarios for major emitting
countries
Analysis of current climate policies and mitigation
commitments: 2019 update
Project number 317041 © NewClimate Institute 2019 AuthorsTakeshi Kuramochi, Leonardo Nascimento, Maria Jose de Villafranca Casas, Hanna Fekete, Gustavo de Vivero, Swithin Lui, Marie Kurdziel, Mia Moisio, Paola Tanguy, Louise Jeffery, Tessa Schiefer, Masahiro Suzuki, Niklas Höhne (NewClimate Institute)
Heleen van Soest, Michel den Elzen, Kendall Esmeijer, Mark Roelfsema (PBL Netherlands Environmental Assessment Agency)
Nicklas Forsell, Mykola Gusti (International Institute for Applied Systems Analysis)
This update report builds on Kuramochi et al. (2018). This report has been prepared by
PBL/NewClimate Institute/IIASA under contract to European Commission, DG CLIMA (EC service contract N° 340201/2017/764007/SER/CLIMA.C1), started in December 2017.
Disclaimer
The views and assumptions expressed in this report represent the views of the authors and not necessarily those of the client.
Download the report
Table of Contents
Table of Contents... i Acronyms... iii Acknowledgements ... v 1 Introduction ...1 1.1 Background ...1 1.2 Objectives ...1 1.3 Summary of methods ...21.4 Limitations of this report ...4
2 Key findings ...6
2.1 National total GHG emissions ...6
2.2 Changes in emissions projections since pre-Paris ...9
2.3 Other key indicators (for G20 members)...14
2.4 Uncertainty on the emissions projections ...18
3 Results per country ...19
3.1 Argentina ...20 3.2 Australia ...24 3.3 Brazil ...28 3.4 Canada...32 3.5 Chile ...36 3.6 China...40 3.7 Colombia ...45
3.8 Democratic Republic of the Congo (DRC) ...50
3.9 Ethiopia ...53 3.10 European Union...57 3.11 India ...61 3.12 Indonesia ...65 3.13 Japan ...69 3.14 Kazakhstan...73 3.15 Mexico ...77 3.16 Morocco ...82 3.17 Philippines ...86 3.18 Republic of Korea ...90 3.19 Russian Federation...93 3.20 Saudi Arabia ...97 3.21 South Africa ... 101 3.22 Thailand ... 105 3.23 Turkey ... 109 3.24 Ukraine ... 112
3.25 United States of America ... 116
Appendix ... I A1: Harmonisation of GHG emissions projections under current policies to the historical emissions data ... I A2: Quantification of 2020 pledges and (I)NDC emission levels ...II A3: NewClimate Institute projections (based on the Climate Action Tracker analysis) ... V A4: The IMAGE model ... VIII A5: The GLOBIOM and G4M models ... X
Acronyms
AFOLU agriculture, forestry and other land use
AR4 Fourth Assessment Report of the IPCC
AR5 Fifth Assessment Report of the IPCC
BAU business-as-usual
CAFE Corporate Average Fuel Economy Standards
CAT Climate Action Tracker
CCS Carbon capture and storage
CH4 Methane
CNG compressed natural gas
CO2 carbon dioxide
CO2e carbon dioxide equivalent
COP21 UNFCCC Conference of the Parties 21st session (Paris)
CPP United States of America’s Clean Power Plan
CSP concentrated solar power
DESA UN Department of Economic and Social Affairs
DRC Democratic Republic of the Congo
EDGAR Emissions Database for Global Atmospheric Research
EEA European Energy Agency
EPA United States Environmental Protection Agency
ERF Emissions Reduction Fund
ETS emissions trading system
FAIR PBL’s Framework to Assess International Regimes for differentiation of commitments
NF3 nitrogen trifluoride
F-gas fluorinated gas
G4M IIASA’s Global Forest Model
GCF Green Climate Fund
GDP gross domestic product
GHG greenhouse gas
GLOBIOM IIASA's Global Biosphere Management Model
Gt gigatonne (billion tonnes)
GW gigawatt (billion watts)
GWP Global Warming Potential
H2 hydrogen
Ha Hectare
HWP harvested wood products
HEPS High Energy Performance Standards
HFC hydrofluorocarbon
ICCT International Council on Clean Transportation
IEA International Energy Agency
IIASA International Institute for Applied Systems Analysis
IMAGE PBL’s Integrated Model to Assess the Global Environment
INDC intended nationally determined contribution
IPCC Intergovernmental Panel on Climate Change
IPPU Industrial Processes and Product Use
km/l kilometre per litre
kWh kilowatt-hour (thousand watts-hour)
LPG liquefied petroleum gas
LULUCF land use, land-use change, and forestry
MEPS Minimum Energy Performance Standards
MJ megajoule (million joules)
Mm3 mega cubic metres (million cubic metres)
mpg miles per gallon
Mt megatonne (million tonnes)
Mtoe million tonnes of oil equivalent
MW megawatt (million watts)
N2O nitrous oxide
NAMA Nationally Appropriate Mitigation Actions
NC6 Sixth National Communication
NRE New and renewable energy
NCRE Non-Conventional Renewable Energy
NDC nationally determined contribution
NOX nitrogen oxides
NRE New and Renewable Energies
OECD Organisation for Economic Co-operation and Development
PBL PBL Netherlands Environmental Assessment Agency
PES Payments for Ecosystem Services
PFC perfluorocarbon
PIK Potsdam institute for climate impact and research
Pkm passenger-kilometre
PPP Purchasing Power Parity
PV photovoltaic
RE renewable energy
REC Renewable Energy Certificate
REDD+ Reducing Emissions from Deforestation and Forest Degradation and the role of conservation, sustainable management of forests and enhancement of forest carbon stocks in developing countries
REDD-PAC REDD+ Policy Assessment Centre RPS renewable portfolio standards
SF6 sulphur hexafluoride
SSP2 Shared Socio-economic Pathways “middle of the road” scenario
t tonne (thousand kilograms)
tce tonne coal equivalent (29.288 GJ)
toe tonne of oil equivalent (41.868 GJ)
TIMER PBL’s Targets IMage Energy Regional Model
Tkm tonne-kilometre
TPES total primary energy supply
TWh terawatt-hour
Acknowledgements
The project was financed by the European Commission, Directorate General Climate Action (DG CLIMA). The report and the calculations have benefited from comments by Tom van Ierland, Miles Perry and Olivia Gippner (DG CLIMA). We also thank all colleagues involved, in particular Pieter Boot, Detlef van Vuuren, Mathijs Harmsen and Harmen Sytze de Boer (PBL), Nico Fux, Victoria Fischdick and Marie Weishaupt (NewClimate Institute), with special thanks to Marian Abels (PBL) for the graphic design work.
This update builds on the project’s 2018 update report (Kuramochi et al., 2018) as well as on its policy development update document published in June 2019 (NewClimate Institute et al., 2019b). The calculations by NewClimate Institute are largely based on its analyses for, and informed by, the Climate Action Tracker project jointly carried out with Climate Analytics, while those by PBL are based on scenario development for the CD-LINKS project.
This report has been prepared by PBL/NewClimate Institute/IIASA under contract to European Commission, DG CLIMA (EC service contract N° 340201/2017/64007/SER/CLIMA.C1) started in December 2017.
1 Introduction
1.1 Background
The 21st session of the Conference of the Parties (COP21) to the United Nations Framework Convention on Climate Change (UNFCCC) held in 2015, adopted the Paris Agreement as the new international climate policy agreement for the post-2020 period (UNFCCC, 2015a). In the lead-up to COP21, governments were asked to put forward offers on how – and by how much – they were willing to reduce their greenhouse gas (GHG) emissions after 2020; these are so-called “intended nationally determined contributions” (INDCs). Nearly 200 countries submitted their INDCs before the COP21 (UNFCCC, 2015b), which became “nationally determined contributions” (NDCs) following the ratification of the agreement.
The urgency for enhanced action to achieve the long-term goal of the Paris Agreement is more evident than ever—the recently published 1.5 °C special report by the Intergovernmental Panel on Climate Change (IPCC) shows that global CO2 emissions need to reach net zero by around 2050 to limit warming to 1.5 °C with no or limited overshoot (IPCC, 2018). It is, therefore, crucial to continually track countries’ progress on climate change mitigation and inform policymakers with up-to-date knowledge to ensure effective implementation of the ratcheting mechanism under the Paris Agreement.
1.2 Objectives
This report, prepared by NewClimate Institute, PBL Netherlands Environmental Assessment Agency and IIASA, presents an up-to-date assessment of progress by 25 countries toward the achievement of the mitigation components of the 2025/2030 targets (NDCs and INDCs) presented in the context of the Paris Agreement as well as their progress towards their 2020 pledges under the UNFCCC Cancún Agreements. More specifically, the report provides an overview of projected GHG emissions up to 2030, taking into account existing, and in some cases planned, climate and energy policies, and compares them with the targeted emissions under NDCs and INDCs.
The 25 countries assessed in this report are: Argentina, Australia, Brazil, Canada, Chile, China, Colombia, Democratic Republic of the Congo (DRC), Ethiopia, the European Union (EU), India, Indonesia, Japan, Kazakhstan, Mexico, Morocco, the Philippines, Republic of Korea, the Russian Federation, South Africa, Saudi Arabia, Thailand, Turkey, Ukraine, and the United States of America (USA). These 25 countries cover all of the G20 countries (excluding the four individual EU member states) and accounted for about 77% of total global GHG emissions in 2018 (Olivier and Peters, 2018, FAOSTAT, 2018).
Hereafter, we will use the term NDC throughout the report, given that all but one (Turkey) of the 25 countries assessed in this report have ratified the Paris Agreement.
In this report, the current policies scenario assumes that no additional mitigation action is taken beyond currently implemented climate policies as of a cut-off date. Whenever possible, current policy trajectories reflect all adopted and implemented policies, which are defined here as legislative decisions, executive orders, or their equivalent. This excludes publicly announced plans or strategies, while policy instruments to implement such plans or strategies would qualify. Thus, we do not automatically assume that policy targets will be achieved even when they are enshrined in the form of a law or a strategy document. Ultimately, however, these definitions could be interpreted differently and involve some
1.3 Summary of methods
NewClimate Institute, IIASA and PBL have estimated the impact of the most effective current policies on future GHG emissions. The main updates and methodological changes made in this report from our 2018 report (Kuramochi et al., 2018) include the following:
• Policy developments since the 2018 report have been taken into account in the emissions projections (cut-off date: 1 July 2019, with a few exceptions), based on our June policy update document (NewClimate Institute et al., 2019b) and the periodical updates under the European CD-LINKS project (CD-LINKS, 2018).
• Country-level current policies packages for quantification in GHG emissions scenarios were reviewed by in-country experts involved in the CD-LINKS project (CD-LINKS, 2018) to identify policies, not limited to those focused on energy and climate, expected to deliver significant impact.
• Historical GHG emissions data was updated according to latest inventories submitted to the UNFCCC (cut-off date: 1 July 2019; see Appendix A.1 for details).
• GHG emissions projections under current policies were harmonised to the latest historical emissions data described above, i.e. adding the absolute emissions difference in the harmonisation year between the inventory data and the model data to the model projections.1 The harmonisation year was updated to 2017 for Annex I countries (previously 2016) and the latest data year for non-Annex I countries (See Appendix A.1 for details).
• In addition to national total GHG emissions and GHG emissions per capita, this report presents the 2010 historical data and 2030 projections for several additional indicators whenever available:
• GHG emissions per GDP (in USD at 2010 Purchasing Power Parities (PPP)) • Share of renewables in total primary energy supply (TPES)
• Share of renewables in total electricity generation • TPES per capita
• TPES per GDP (in USD at 2010 Purchasing Power Parities (PPP))
GHG emissions values are provided in terms of global warming potentials (GWPs) specified in respective NDC documents, if in agreement with GWPs used in historical data. This allows for a direct comparison of current policies scenario projections to the official target emission levels reported by the national governments. For some countries, the GWPs used in the most recent GHG inventories and those specified in NDCs were different. In such cases, the GWPs used in the historical data were also used for the projections (which are harmonised to historical data), and a note highlighting the inconsistency with the GWP used in the NDCs was added.
To calculate per capita and per GDP indicators, we used the population projections from the UN World Population Prospects 2019 (UN DESA, 2019) and GDP projections from the OECD long-term forecast (OECD, 2018), supplemented with the projections underlying the Climate Action Tracker analysis (Climate Action Tracker, 2019) for a few countries (no projections available for DRC and Ethiopia). On energy-related indicators, primary energy values are based on the physical energy content method and on lower heating values in consistency with the IEA statistics (2019a), unless otherwise noted.
1 A harmonisation step is applied to reconcile the common historical emissions data used for this report (i.e. from
latest national GHG inventories) and the estimates of historical emissions used in the tools that generate this report’s emissions projections. The use of a more recent inventory data year for harmonisation allows for better accounting for the GHG emissions trends in recent years.
The information on pre-2020 pledges, NDC targets and official emissions projections under current policies or equivalent are collected mainly from the government documents submitted to the UNFCCC (Table 1).
Table 1: Sources for the official estimates of emissions in 2020 and 2030 under pledge and NDC case and current policies scenarios for the 25 countries. N/A: not available.
Country 2020 pledge case NDC case 1) Current policies scenario
Argentina No pledge NDC Ministry of the Environment and Sustainable Development (Government of Argentina, 2016)
Australia Australian Government (2018) (Australian Government,
2018) Australian Government (2018) 2)
Brazil Government of Brazil (2010) NDC N/A
Canada Government of Canada (2016) NDC; Government of Canada (2017a)
Environment and Climate Change Canada (2018) 2)
China N/A N/A N/A
Chile No pledge N/A N/A
Colombia No pledge NDC N/A
D.R. Congo No pledge NDC N/A
Ethiopia No pledge NDC N/A
EU28 EEA (2018) 3) NDC (European Commission, 2018c, EEA, 2019a) 2)
India Planning Commission Government of India
(2011, 2014) N/A N/A
Indonesia Second Biennial Report 4) NDC N/A
Japan Third Biennial Report (UNFCCC, 2019f) NDC N/A 2)
Kazakhstan Third Biennial Report NDC N/A 2)
Mexico NCCS (2013) NDC N/A
Morocco No pledge NDC N/A
The
Philippines No pledge N/A N/A Republic of
Korea Republic of Korea (2016) NDC N/A Russian
Federation Third Biennial Report NDC UNFCCC (2019g) 2) Saudi
Arabia No pledge N/A N/A South
Africa
Department of Environmental Affairs
(2011a, 2011b) NDC N/A
1) INDC and NDC documents were taken from UNFCCC (2015b, 2018). We considered that the official estimates
of an NDC target is available in absolute terms when it is provided in: (i) absolute terms, (ii) provided as a base year target with the base year GHG emissions reported in the national GHG inventory reports submitted to the UNFCCC, or (iii) BAU target with the BAU emission levels reported in the (I)NDC document, with description of the accounting of land use, land use change, and forestry (LULUCF) emissions.
2) On Annex I countries, for Australia, Russian Federation and Turkey we refer to the “With measures” scenario
projections reported in the Third Biennial Reports (BR3) submitted to the UNFCCC (2019f). For Japan, Kazakhstan and Ukraine, we did not find any scenario projections comparable definition-wise to our current policies scenario projections. For the EU and Canada, we refer to more recent, annual official publications using national GHG inventories.
3) Target value from EEA (2018) includes emissions from international aviation and thus not used for the analysis. 4) Official estimates not used due to potential inconsistency with other data provided in the document.
The calculations by NewClimate Institute are largely based on its analyses for, and informed by, the
Climate Action Tracker project jointly carried out with Climate Analytics (Climate Action Tracker, 2019) and use existing scenarios from national and international studies (e.g. IEA's World Energy Outlook 2019) as well as their own calculations of the impact of individual policies in different subsectors.
PBL has updated their calculations of the impact of individual policies in different subsectors using the
IMAGE integrated assessment modelling framework (Stehfest et al., 2014), including a global climate policy model (FAIR), a detailed energy-system model (TIMER), and a land-use model (IMAGE land) (www.pbl.nl/ndc). The starting point for the calculations of the impact of climate policies is the latest SSP2 (no climate policy) baseline as implemented in the IMAGE model (van Vuuren et al., 2017). Current climate and energy policies in G20 countries, as identified in the CD-LINKS project (CD-LINKS, 2018, NewClimate Institute, 2016) and the June update (NewClimate Institute et al., 2019b), were added to that baseline (Roelfsema et al., 2018). For countries that are part of a larger IMAGE region (Australia, Kazakhstan, Republic of Korea, Russian Federation, and Ukraine), emissions projections were downscaled using the country’s share in the region’s 2015 emissions as a constant scaling factor. Both NewClimate Institute and PBL scenario calculations were supplemented with those on land-use and agricultural policies using IIASA's global land-use model GLOBIOM (www.iiasa.ac.at/GLOBIOM) and global forest model G4M (www.iiasa.ac.at/G4M). For PBL, IIASA’s LULUCF CO2 projections were added to the IMAGE GHG emissions projections excluding LULUCF CO2. Although only emissions projections excluding LULUCF CO2 were used, the IMAGE framework was applied fully, including the IMAGE land model, to ensure consistency of results (e.g. feedback between bioenergy demand and land use). LULUCF non-CO2 emissions were taken from the IMAGE model for the PBL projections. For the NewClimate projections, the LULUCF non-CO2 emissions from the last reported year were held constant throughout the entire projection period. For Annex I countries this last reported year is 2016. For non-Annex I countries the last reported year can be found in A1 of the Appendix.
In this report, GHG emission values are expressed in terms of global warming potentials (GWPs) as stated in a country’s NDC, unless otherwise noted.
1.4 Limitations of this report
It should be noted that a country that is likely to meet its NDC does not necessarily undertake more
stringent action on mitigation than a country that is not on track (den Elzen et al., 2019):
• The targets differ in their ambition levels across countries. A country not on track to meet its NDC target may have set itself a very ambitious target or a country on track to meet its NDC target may have set a relatively unambitious target. This study does not assess the level of ambition and fairness of the NDC targets; there are a number of recent studies available that assessed them in the light of equity principles (Höhne et al., 2018, Pan et al., 2017, Robiou du Pont et al., 2016,
Climate Action Tracker, 2019). NDCs are also nationally determined and heterogeneous by nature, so a fair comparison of progress across countries is not always straightforward.
• Countries have different policy-making approaches. Some countries use their pledges or targets as a device to drive more ambitious policies, while others use them merely to formalise the expected effect of existing measures.
• Gaps between the mitigation targets and current policies scenario projections may close in the years to come as countries adopt implementation measures. For this reason, it is essential that this report and similar efforts are periodically updated in the years to come.
There are a number of methodological limitations related to the current assessment, which are largely attributable to the differences in the nature and characteristics of NDCs and climate policies across countries.
• First, this report considers a wide range of effective national climate and energy policies but does not provide a complete assessment of all policies. This has the risk of underestimating or overestimating the total impact of a country’s policies on GHG emissions.
• Second, existing policies may change and/or be abandoned for a variety of reasons, and new policies may be implemented. This implies that all numbers are subject to change; this study reflects the current state.
• Third, countries are implementing policies in various areas to a varying degree. For example, many countries have set renewable energy targets, which are to be achieved by national support policies; for some countries, in particular the non-OECD countries, there is not enough information about the implementation status. Even for countries with evidence of concrete support policies in place, it is often difficult to assess whether the targets would be fully achieved; some countries have implementation barriers (e.g. fossil fuel subsidies) alongside renewable energy support policies. • Fourth, for bottom-up calculations performed by NewClimate Institute using external emissions
scenarios from various sources, it is not always fully clear how the impacts of existing policy measures were quantified by those sources.
• Fifth, the choice of data harmonisation year can have considerable impact on GHG emissions projections. This is particularly the case for the LULUCF sector emissions, which could fluctuate from year to year due to peat fires or natural disturbances.
The main findings of this study are presented in the next section and in fact sheets below, followed by an Appendix with a brief description of the datasets used in this study as well as an overview table of GHG emissions under NDCs and current policies.
2 Key findings
2.1 National total GHG emissions
Countries are making progress toward their 2020 pledges and NDC targets to varying degrees (Table 2). For 2020 pledges, not all major emitting countries are expected to meet their pledges:
• Eleven countries or regions (Brazil, Chile, China, EU28, India, Japan, Mexico, Russian Federation, South Africa, Thailand, Ukraine) are projected to meet their 2020 pledges with implemented policies. • Six countries (Australia, Canada, Indonesia, Kazakhstan, Republic of Korea, USA) are projected to
miss their 2020 pledges.
The assessment results remained the same as in the 2017 report for all countries except for South Africa. Of the remaining countries, seven (Argentina, Colombia, D.R. Congo, Ethiopia, Morocco, Philippines, Saudi Arabia) did not submit 2020 pledges while Turkey was not obligated to submit its Cancun pledge (UNFCCC, 2010).
For NDCs, the degree to which countries/regions are likely to achieve their targets under current policies
was found to vary (Table 2, also in Figure 1):
• 12 countries or regions expected to achieve, or even overachieve, their self-determined, unconditional NDC targets with implemented policies are: Argentina, Chile, China, Colombia, EU28, India, Japan, Russian Federation, Saudi Arabia, South Africa, Turkey, and Ukraine.
• 12 countries that require additional action to achieve their 2030 targets are: Australia, Brazil, Canada, D.R. Congo, Ethiopia, Indonesia, Kazakhstan, Morocco, Republic of Korea, Thailand (close), the Philippines, and the USA.
• For Mexico, it is uncertain if it is on track to meet its NDC target. NewClimate Institute projections were higher than the NDC emission levels whereas the PBL projections were lower than the NDC target emission levels.
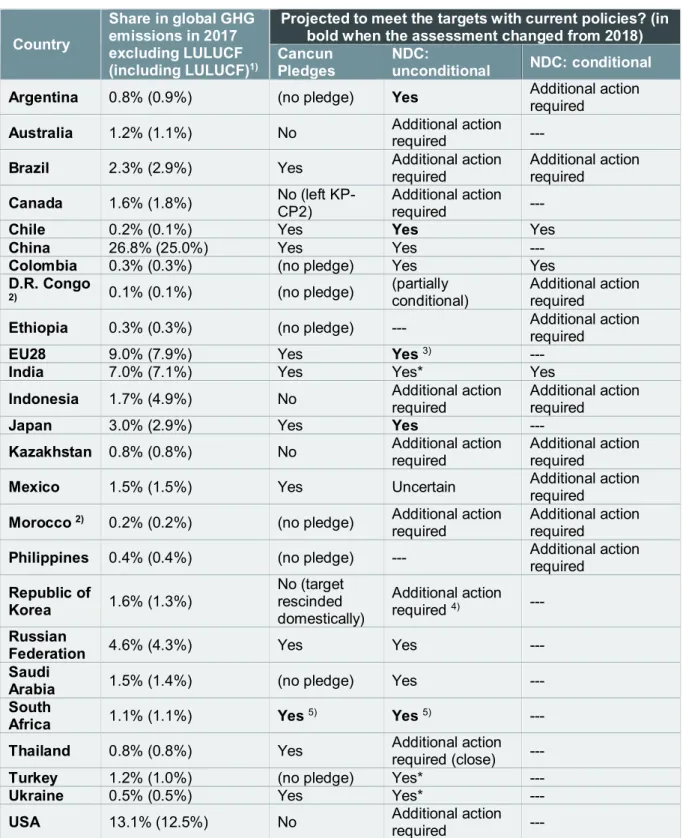
Table 2: Progress of countries and regions toward meeting their 2020 pledges and NDC targets. Asterisks (*) denote that a country’s current policies scenario projection is more than 15% below the NDC emission levels. Please note that a country that is likely to meet its NDC does not necessarily undertake more stringent action on mitigation than a country that is not on track.
Country
Share in global GHG emissions in 2017 excluding LULUCF (including LULUCF)1)
Projected to meet the targets with current policies? (in bold when the assessment changed from 2018) Cancun
Pledges NDC: unconditional NDC: conditional
Argentina 0.8% (0.9%) (no pledge) Yes Additional action required Australia 1.2% (1.1%) No Additional action required ---
Brazil 2.3% (2.9%) Yes Additional action required Additional action required
Canada 1.6% (1.8%) No (left KP-CP2) Additional action required ---
Chile 0.2% (0.1%) Yes Yes Yes
China 26.8% (25.0%) Yes Yes ---
Colombia 0.3% (0.3%) (no pledge) Yes Yes
D.R. Congo
2) 0.1% (0.1%) (no pledge) (partially conditional) Additional action required
Ethiopia 0.3% (0.3%) (no pledge) --- Additional action required
EU28 9.0% (7.9%) Yes Yes 3) ---
India 7.0% (7.1%) Yes Yes* Yes
Indonesia 1.7% (4.9%) No Additional action required Additional action required
Japan 3.0% (2.9%) Yes Yes ---
Kazakhstan 0.8% (0.8%) No Additional action required Additional action required
Mexico 1.5% (1.5%) Yes Uncertain Additional action required
Morocco 2) 0.2% (0.2%) (no pledge) Additional action
required Additional action required
Philippines 0.4% (0.4%) (no pledge) --- Additional action required
Republic of Korea 1.6% (1.3%) No (target rescinded domestically) Additional action required 4) --- Russian
Federation 4.6% (4.3%) Yes Yes --- Saudi
Arabia 1.5% (1.4%) (no pledge) Yes --- South
Africa 1.1% (1.1%) Yes 5) Yes 5) --- Thailand 0.8% (0.8%) Yes Additional action required (close) ---
Turkey 1.2% (1.0%) (no pledge) Yes* ---
Ukraine 0.5% (0.5%) Yes Yes* ---
USA 13.1% (12.5%) No Additional action required ---
1) Olivier et al. (Olivier and Peters, 2018), excluding LULUCF/including LULUCF. LULUCF emissions based on FAO
The assessment results for 2030 have changed for the following countries compared to the 2018 report: • From “uncertain” to “projected to meet the target”: EU28. This report considered a full
implementation of directives, regulations and legislation adopted in 2018 and 2019 that comprise the Clean Planet for all Europeans policy package. If the status of policy implementation on an EU member state-level is considered, studies indicate that additional action is required for the EU to meet its NDC target (EEA, 2019b).
• From “not on track” to “projected to meet the target”: Argentina, Chile, Japan and South Africa. • Argentina: Projections were revised downward mainly due to the lower economic growth
projections for the energy and industry sectors, and the downward revision of the LULUCF emissions projections.
• Chile: Projections have gone down as potential emissions reductions from Chile’s Electromobility Strategy and the first stage of its coal-phase out plan are now included. • Japan: Our projections have been revised downward mainly due to the higher share of
renewables in the electricity mix. Our current policies scenario projections for Japan have been close to the NDC target for the last few years.
• South Africa: Our projections have been revised significantly downward mainly due to the consideration of the recently updated Integrated Resource Plan (IRP 2019) as well as the most recent national GHG inventory report that revised the historical emissions data downward.
Other key findings on 2030 emissions projections include the following:
• For three countries (India, Turkey and Ukraine), current policies scenario projections for 2030 were found to be more than 15% lower than the unconditional NDC target levels (comparison on the basis of average values). These countries could revise their NDCs with more ambitious targets by 2020 under the Paris Agreement’s ratcheting mechanism.
• For Indonesia, there is large uncertainty in LULUCF sector GHG emissions due to peat fires, the emissions of which are included in the business-as-usual (BAU) emissions underlying the NDC target. The GHG emissions resulting from peat fires can be as large as 500 MtCO2e/year. • For Kazakhstan and Russian Federation, there were substantial changes in historical GHG emissions reported in the most recent inventory used in this report compared to the older inventory used in the 2018 report. In particular for Russian Federation, the lower historical emissions (maximum about 500 MtCO2e/year) led to a downward revision of current policies scenario projections and the NDC target estimates.
• For the USA, the Trump administration continues to roll back climate policies. The GHG emissions projections, however, remained similar to the previous projections because, among different factors, the decline of coal-fired power is happening at a faster rate than previous projected.
• Currently implemented policies do not prevent emissions (sector coverage consistent with the NDC targets) from increasing from 2010 levels by 2030, not only in non-OECD countries (Argentina, Brazil, China, DRC, Ethiopia, India, Indonesia, Kazakhstan, Morocco, the Philippines, Russian Federation, Saudi Arabia, South Africa, and Thailand) but also in OECD countries (Chile, Mexico, Republic of Korea, and Turkey). The 2030 GHG emissions in Canada and Ukraine are projected to be roughly at 2010 levels (although for Canada with a large projection range), while they are projected to remain below 2010 levels under current policies for Australia, Colombia Japan, the EU28, and the USA.
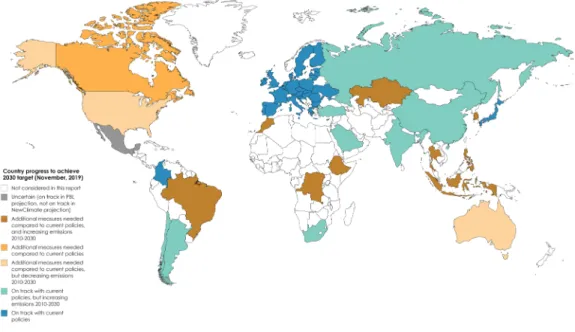
Figure 1: Progress of countries toward achieving their self-chosen 2030 targets under current policies. Note: current policies do not include implementation measures that are under development at the time of publication.
2.2 Changes in emissions projections since pre-Paris
We also assessed how countries’ current policies scenario projections for 2030 have changed since before Paris. Table 3 presents the findings from the comparison with our 2015 update report (den Elzen et al. 2015). We compared the emissions relative to 2010 levels reported in the two reports; we did not directly compare the emissions in absolute terms due to the differences in GWPs and the historical emissions dataset used in the two studies. The findings are as follows:
• Seven out of 13 countries (Australia, Canada, China, EU28, Japan, Turkey, and the USA) have lower current policies scenario projections compared to the 2015 report. For a few countries or regions (Australia, EU28), the growth rates of historical emissions up to 2016 were considerably lower than those projected in the 2015 report.
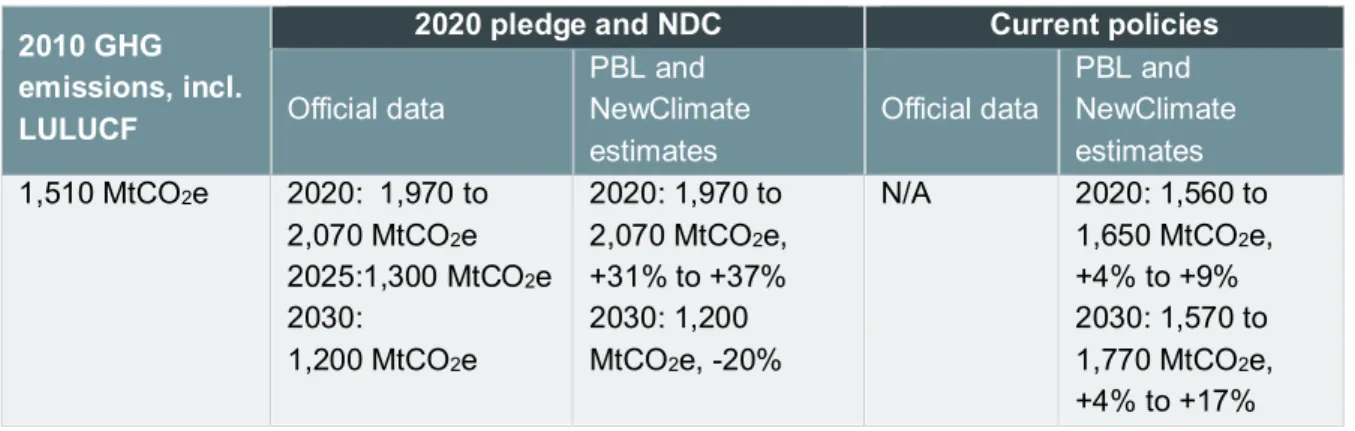
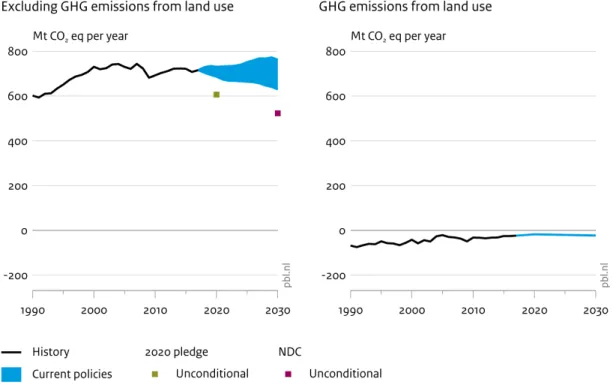
• For Brazil, India, Mexico, and the Russian Federation, the emissions projection ranges for 2030 in this report were either similar to, or have widened compared to, those in the 2015 report. • For Brazil, the updated GHG inventory data, especially in the LULUCF sector, had a
significant impact—the updated inventory shows an increasing trend of GHG emissions since 2010 with over 1,500 MtCO2e/year for 2017 and reaching about 4% to 17% above 2010 levels by 2030, while the 2015 report projected a decreasing emission trend since 2010, with about 1,500 MtCO2e/year for 2017, and reaching 10% below 2010 levels by 2030.
• For Mexico, the updated inventory and, to a greater extent, methodological changes to reflect uncertainties in the development of the energy sector, have resulted in a larger range for current policies scenario projections.
• For Indonesia, the emissions trajectories have been changing substantially annually, in part due to the revision of national GHG inventory reports. While the emissions projections for 2030 are roughly similar between 2015 and 2019 reports, the historical emissions for 2010 are significantly lower in the latest GHG inventory report used in this 2019 update.
Table 3: Changes in current policies scenario projections since pre-Paris. Please note that a country or region that is likely to meet its NDC does not necessarily undertake more stringent action on mitigation than a country that is not on track.
Country (incl. LULUCF unless otherwise stated)
2030 projections Possible explanations for the changes in projections
Policies implemented since 2015 vs. 2010: this report Change since 2015 report (based on the comparison of relative emission levels vs. 2010) 1) Projected to meet the NDC with current policies? (unconditional) Australia -12%
to -7% Lower Additional action required • Projected emissions revised downwards due to lower 2010-2016 emissions
• Revised / additional renewable energy targets
• Domestic implementation of Kigali Amendment to reduce HFCs • Climate Solutions Fund
Brazil 2) +4% to
+17% Higher Uncertain • Revised emission inventory (in particular LULUCF)
• 10-Year National Energy Expansion Plan (PDE)
• RenovaBIO to improve carbon intensity of biofuels 2)
Canada
(excl. LULUCF) -9% to +10% Lower Additional action required • Projected emissions revised downwards due to lower 2010-2016 emissions
• Updated CO2 standard for power plants (coal phase-out)
• Greenhouse gas pollution pricing act 3) • Regulations to address methane in the oil
and gas sector • Regulation of HFCs
Country (incl. LULUCF unless otherwise stated)
2030 projections Possible explanations for the changes in projections
Policies implemented since 2015 vs. 2010: this report Change since 2015 report (based on the comparison of relative emission levels vs. 2010) 1) Projected to meet the NDC with current policies? (unconditional) China +23% to
+40% Lower Yes • Lower future GDP growth assumptions vs. 2015 projections • Higher renewable
technology forecasts • Lower future growth
assumptions of non-CO2 gases
• 13th Five Year Plan
• Green Industry Development Plan • Emissions trading program
• Made in China 2025 (standards for auto-industry)
EU28
(excl. LULUCF) -38% to -33% Lower Yes • Projected emissions revised downwards due to lower 2010-2016 emissions
• Quantification of various adopted policies under the Clean Energy for all Europeans package
• Various directives, regulations and legislation under the Clean Energy for all Europeans package
• Emissions standards for new cars, vans, and heavy-duty vehicles
India +107% to
+126% Similar Yes • Upward revision of renewable electricity generation projections
• National Electricity Plan
• Upward revision of RE capacity targets • FAME subsidy scheme for hybrid and
electric vehicles under the National Electric Mobility Mission
Country (incl. LULUCF unless otherwise stated)
2030 projections Possible explanations for the changes in projections
Policies implemented since 2015 vs. 2010: this report Change since 2015 report (based on the comparison of relative emission levels vs. 2010) 1) Projected to meet the NDC with current policies? (unconditional) Indonesia 4) +91% to
+96% Higher Additional action required • LULUCF: revised emission inventory, with significantly lower emissions for 2010, but higher emission growth projection
• National Electricity Plan (target update); • Electricity Supply Business Plan (capacity
targets update)
Japan
(excl. LULUCF) -22% to -16% Lower Yes • Lower energy demand growth projection • Higher renewable
electricity generation projections
• 2018 Basic Energy Plan
• Long-term energy demand and supply outlook
• Updated vehicle fuel efficiency standards • Legislation to accelerate onshore wind
power projects
• Increasing F-gas recovery rates
Mexico +3% to
+24% Similar (with larger range) Uncertain • Revised emission inventory • Change in
methodology
• Energy Transition Law and its National Transition Strategy to promote the use of clean fuels and technologies;
• REDD+ National Strategy
• National Emissions Trading Scheme 3)
Republic of Korea
(excl. LULUCF) +9% to +19% Higher Additional action required • Higher emissions growth between 2010– 2014
• Change in methodology
• Change of government
• Domestically rescinded the 2020 target • New Plan for Electricity Supply and Demand
3)
Country (incl. LULUCF unless otherwise stated)
2030 projections Possible explanations for the changes in projections
Policies implemented since 2015 vs. 2010: this report Change since 2015 report (based on the comparison of relative emission levels vs. 2010) 1) Projected to meet the NDC with current policies? (unconditional) Russian Federation
(excl. LULUCF) +12% to +21% Similar Yes • Different GWP values used (AR4 vs. SAR) • Russian State Programme’s targets for energy efficiency and renewable electricity generation
Turkey
(excl. LULUCF) +56% to +118% Lower Yes • Lower historical emissions growth 2010 to 2016 than projected • Change in
methodology
• Energy Efficiency Action Plan 3)
United States of
America (2025) -16% to -8% Lower Additional action required
• Revised historical emission inventory • Higher technology
forecasts than projected in 2015 report (renewables and gas)
• Started official withdrawal process from the Paris Agreement
• Replacement of the Clean Power Plan; • Freezing light-duty vehicle standards; • Rescinded appliance standards;
• Weakened methane standards from oil and gas production
• HFC regulations not enforced
1) We evaluated as “lower” / “higher” when both upper and lower bounds of the updated emission range was lower / higher than in those in the 2015 report. “Similar” was applied
when the updated emission range was within that in the 2015 report. When the updated emission range contained the entire 2015 emission range, which was the case for Mexico, the evaluation was based on the central estimate, i.e. average of the upper and lower bound values. Mexico’s central estimate was only 1% higher than that in the 2015 report and thus rated as “similar”. 2) Assessment based on the high-LULUCF emissions case. 3) Not quantified in our assessment. 4) Excludes emissions from peat fires.
2.3 Other key indicators (for G20 members)
The high-level decarbonisation indicators presented in this section and country sections include some of the IPAT2 and Kaya identity indicators (Ehrlich and Holdren, 1971, Blanco et al., 2014). For each indicator, we also present national targets when they are available. With these indicators, we aim to provide additional insights into the countries’ current effort levels and the mitigation contributions under the Paris Agreement. This section focuses on the G20 members (excluding EU Member States). Figure 1 (left panel) shows the 2010 historical data and 2030 projections of GHG emissions per capita (2025 projections for the USA). The consideration of LULUCF emissions differs across members, depending on the sector coverage defined in their respective NDCs. On the one hand, there are a few OECD countries, such as the EU and Mexico, with projected emissions around 5 to 6 tCO2e/capita by 2030, which is a little lower than the 2015 global average (excluding LULUCF) of 6.7 tCO2e/capita (Crippa et al., 2019). The EU’s per capita emissions are projected to continue declining, while Mexico’s per capita emissions are projected to stabilise. On the other hand, there are many countries, such as China, with projections for 2030 close to or above 10 tCO2e/capita. In particular, six G20 members (Australia, Canada, Republic of Korea, Russian Federation, Saudi Arabia, and the USA) are projected to emit more than 15 tCO2e/capita by 2030. India has the lowest per capita emissions due to its comparatively lower GDP.
Figure 1 (right panel) shows the 2010 historical data and 2030 projections and targets of GHG emissions intensity per GDP (2025 projections for the USA), expressing the extent to which current policies are projected to lead to a decoupling of economic growth and emissions. GHG emission intensity is expected to decrease for most G20 members to a varying degree, typically ranging between 30% and 50% compared to 2010 levels. The exceptions are Russian Federation and Saudi Arabia, two major fossil fuel producers, for which the emission intensity projections for 2030 are expected to remain at, or be higher than, the 2010 levels. The findings here are consistent with those in den Elzen et al. (2019) (which used 2015 as reference year), except for South Africa. This report projects significantly lower 2030 emissions for South Africa than estimated in den Elzen et al. (2019), due to the new Integrated Resource Plan and revised historical GHG emissions data considered here.
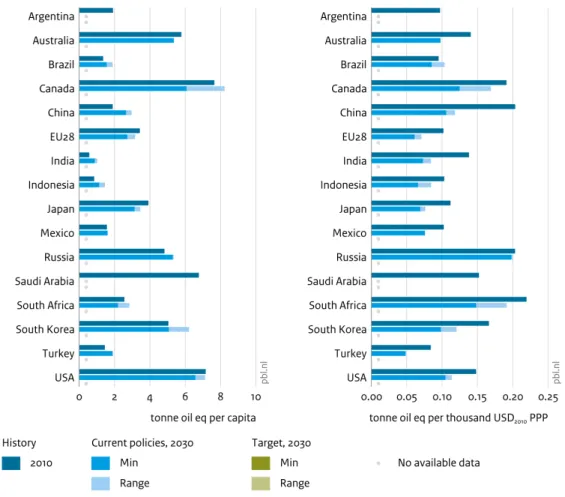
Figure 2 shows the 2010 historical data and 2030 projections of total primary energy supply (TPES) per capita (left panel) and per GDP (right panel). Overall trends projected up to 2030 are similar to those observed for GHG intensity per GDP and per capita, including countries with large LULUCF emissions. However, the relative values compared to 2010 levels are generally higher for TPES intensity than for GHG intensity because the latter also account for the expected reduction of carbon intensity in primary energy use.
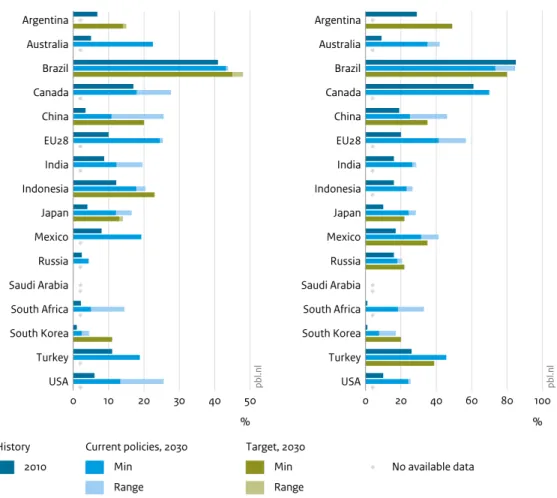
Figure 3 shows the 2010 historical data and 2030 projections and targets of renewable energy shares (excluding traditional biomass in final consumption) in total primary energy supply (TPES, left panel) and in total electricity generation (right panel). The global average renewable energy share in 2010 was 6.6% in TPES and 12% in electricity generation (IEA, 2019b). G20 members with high renewable energy shares in their energy mix are typically those with relatively large hydropower capacity (e.g. Brazil, Canada, Chile, and Turkey) and biofuels in final consumption (Brazil), with an exception of the EU. For renewable electricity share, most G20 members fall short of the 2030 levels required, according to scenarios assessed by the IPCC, for limiting global warming to 1.5 °C with no or limited overshoot (interquartile range: 47% to 65%) (IPCC, 2018).
2 The IPAT identity, proposed by Ehrlich and Holdren (1971) is described as: Impact = Population * Affluence *
Technology. The Kaya identity is a special case of the IPAT identity and deals with the subset of GHG emissions, i.e. energy-related CO2 emissions (Blanco et al., 2014).
Figure 2: 2010 historical data and 2030 projections (2025 for the USA) of greenhouse gas (GHG) emissions per capita (left panel) and per GDP (right panel). The coverage of GHG emissions are consistent with that defined in respective NDCs. Source: this study for projections and targets, IEA (2019) for historical data.
Figure 3: 2010 historical data and 2030 projections of total primary energy supply (TPES) per GDP (left panel) and per capita (right panel). Source: this study for projections and targets, IEA (2019) for historical data.
Notes: Target values are not presented here because they are not provided in absolute terms for most countries. USA: results are based on higher heating values. For Australia, Mexico and Turkey, the current policies scenario projections presented are based only on PBL projections.
Figure 4: 2010 historical data and 2030 projections of renewable energy shares in total primary energy supply (TPES) excluding traditional biomass use (left panel) and in total electricity generation (right panel). Source: this study for projections and targets, IEA (2019) for historical data.
Notes on the left panel. Brazil: target for 2029. China: the target includes nuclear. EU: target only available as share in final energy consumption. Indonesia: target for 2025. USA: results based on higher heating values. For Australia, Mexico and Turkey, the current policies scenario projections presented are based only on PBL projections.
Notes on the right panel: Argentina: the target excludes hydro, the share of which is assumed here to follow current trends. Australia: target only available for 2020 (not shown here). Brazil: the target excludes hydro, the share of which is assumed constant at 2017 level (IEA, 2019b) up to 2030. EU: target only available as share in final energy consumption. India: only capacity target available (not shown here). Mexico: the target year is 2024 and the target includes efficient gas-fired cogeneration. Philippines: only capacity target available (not shown here). Russian Federation: the target year is 2024 and the target excludes hydro, the share of which is assumed constant at 2017 level (IEA, 2019b) up to 2030. For Australia, Canada, Mexico and Turkey, the current policies scenario projections presented are based only on PBL projections.
2.4 Uncertainty on the emissions projections
For several countries there is large uncertainty on the GHG emissions projections related to political and economic circumstances as well as on specific sectors:
• In the USA, the Trump administration started the official withdrawal from the Paris Agreement and ceased implementation of the NDC (United States of America, 2019). It has also rolled back or proposed to weaken a number of key Obama administration climate policies, including the Clean Power Plan, light-duty vehicle standards, and HFC regulations. At the same time, several sub-national and non-state initiatives have emerged, including the “America’s Pledge” launched by California Governor Jerry Brown and Former Mayor of New York Michael Bloomberg to move forward with the “country’s commitments under the Paris Agreement — with or without Washington” (America’s Pledge Initiative on Climate, 2017). The potential mitigation impact of these actions was not quantified in this study, but other studies have estimated that quantifiable non-state and subnational targets reported to international databases and networks, if fully implemented, could result in emissions that are 21% to 24% below 2005 levels by 2025 (incl. LULUCF) (NewClimate Institute et al., 2019a, America’s Pledge Initiative on Climate, 2018). • Canada is currently expected to apply the net-net accounting rule for the LULUCF sector, but
there is still some uncertainty on its treatment and it is possible that a different accounting approach for the LULUCF sector will be applied.
• In Japan, the uncertainties around the future role of nuclear power continue to affect the emissions projections for the power sector.
• In the Republic of Korea, it remains to be seen if the policy direction to reduce reliance on nuclear and coal power while increasing renewables in the electricity sector laid out in the new energy-related plans published between 2017 and 2019 will be fully implemented.
• China and India have pledges indexed to economic growth, implying that the absolute emissions levels under their targets are highly uncertain.
• Emissions projections for Turkey and other developing countries are subject to considerable uncertainty related to economic growth.
• In Argentina, Colombia, DRC, Ethiopia, Indonesia and the Philippines, emissions from land use, land-use change, and forestry (LULUCF), which are very uncertain, strongly influence total emissions projections.
3 Results per country
This section summarises the results per country for current policies, 2020 pledges, and 2030 targets (NDCs). For each country section, the following are presented:
• Description of 2020 pledge and NDC, including the latest inventory data year used for harmonisation;
• Overview of key climate change mitigation policies;
• Projected impact of climate policies on greenhouse gas emissions (absolute, relative to 2010 levels); updated in December 2019 for all countries.
• Projected impact of climate policies on the selected indicators in comparison with NDC or domestic targets
• GHG emissions per GDP
• Share of renewables (excluding traditional biomass) in total primary energy supply (TPES) • Share of renewables in total electricity generation
• TPES per capita (current policies scenario projections only) • TPES per GDP (current policies scenario projections only)
All projections presented in this report are compared to 2010 historical levels.
Each country section presents emissions projection figures. The left-panel presents emissions for sectors consistent with those covered by the NDC, while other panels are presented for additional information.
Regarding LULUCF emissions, the GHG emissions under current policies are presented including or excluding LULUCF, depending on the sector coverage of the NDCs. The term “land use” used in the figures refers to LULUCF emissions and removals.
For the calculation of per capita emissions, population projections (median variant) were taken from the UN population statistics (UN DESA, 2019).
The Appendix provides explanations on historical GHG emissions data sources and the harmonisation of GHG emissions projections to the historical data (A1), quantification of 2020 pledge and NDC emissions levels (A2), general description of calculation methods used by NewClimate Institute, PBL and IIASA to quantify emissions projections under current policies (A3 to A5).
3.1 Argentina
Key policies implemented since 2015: Argentina is one of the few countries that have updated their
NDCs. Main policies implemented after 2015 related to GHG emissions reductions in Argentina include the Biofuels Law, Renewable Energy Law (RenovAr), and afforestation programmes. The renewable energy share achieved through the current instruments, mainly RenovAr auctions, is far below the target under the Renewable Energy Law of 20% (excluding hydropower) by 2025. Other implemented policies, the impacts of which are not quantified in this report, include the carbon tax scheme introduced in 2017 (US$10/tCO2) and the Law 27.424 on the distributed generation of renewable energy sources under net metering, which is expected to enhance renewable energy deployment.
Recent developments (including proposed policies): Recently, the Secretariat of Energy has been
promoting the exploitation of non-conventional fossil fuels from the Vaca Muerta reservoir, which could cancel the estimated emissions reductions resulting from the renewable energy plan (Iguacel, 2018). The initial exploration and future exploitation of offshore oil and natural gas is already taking place (Baruj and Drucaroff, 2018, Boletín Oficial de la República Argentina, 2019). Government entities have been preparing national climate change adaptation and mitigation action plans for all sectors. These action plans present sectoral strategies for the implementation of mitigation and adaptation measures that seek to strengthen Argentina’s climate change commitments (Argentina National Climate Change Cabinet, 2019). It is unclear how the change of government, with recently elected President Alberto Fernández, will affect climate policy in Argentina.
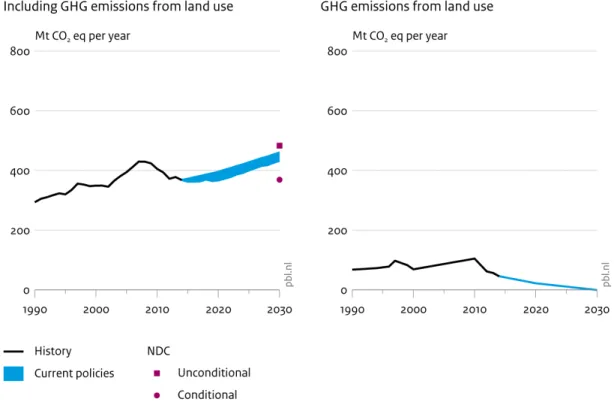
Projections: It is projected that Argentina will likely meet its unconditional NDC target with existing
policies. Our current policies scenario projections this year are lower than our 2018 projections, mainly due to the lower economic growth projections for the energy and industry sector emissions, and the downward revision of the LULUCF emissions projections.
Figure 5: Impact of climate policies on greenhouse gas emissions in Argentina (including land use, i.e. LULUCF). Emission values are based on SAR GWP-100.
Table 4: Description of Argentina’s NDC. N/A: not available.
Indicator NDC
Target: unconditional Limit GHG emissions to 483 MtCO2e in 2030
Target: conditional Limit GHG emissions to 369 MtCO2e in 2030, subject to international financing, support for transfer, innovation and technology development, and capacity building
Sectoral coverage Energy, agriculture, waste, industrial processes, LULUCF
General Accounting method IPCC 2006 guidelines; 100-year GWPs from the 2nd Assessment Report
GHGs covered CO2, CH4, N2O, HFCs, PFCs and SF6
Consideration of LULUCF Land-use sector is included in the target
Accounting approaches and methodologies are not specified
Other sector-level targets N/A
Use of bilateral, regional and
international credits N/A
Note: Argentina has not set its 2020 pledge.
Table 5: Overview of key climate change mitigation policies in Argentina (Ministry of Environment and Sustainable Development of Argentina, 2015, Ministry of Justice and Human Rights of Argentina, 2017, Ministry of Energy and Mining of Argentina, 2016, LSE Grantham Research Institute on Climate Change and the Environment, 2018, Pensamiento Civil, 2019, Ministry of Environment and Sustainable Development of Argentina, 2018, Fratantoni, 2018)
Sector Policies (marked with “(+)” when mentioned in
the NDC document) Description
Energy
supply Renewable Energy Law 27.191 setting renewable targets (2016) 1), National Development Scheme for the Use of Renewable Energy Sources (RenovAr)
Total individual electric consumption to be substituted with renewable sources (excl. hydro larger than 50MW) given the following schedule: 8% by 2017, 18% by 2023 and 20% by 2025. Four rounds of renewable auctions until November 2018. The cumulative capacity contracted was 4,725 MW.
Carbon tax on energy
(2017) 1) Starting at $10/tCO
2 (adjusted every trimester). Targeting emissions from transport fuels and coal. The carbon tax excludes natural gas consumption and shale gas production (FARN, 2019).
Promotion of large-scale expansion of natural gas reserves (“Vaca Muerta”) 2)
Subsidies allocated to the exploration and exploitation of non-conventional gas. Long-term energy plan projects doubling the production of oil and gas in 5 years.
Transport Biofuels Law (updated
2016) 3) Blending mandate of 10% for biodiesel and 12% for ethanol in the gasoline from 2016.
Buildings Law 27.424 on net-metering for distributed generation (2017) 1)
Enable renewable generation at distribution level. Excess power can be sold under a net metering mechanism.
Forestry
Sector Policies (marked with “(+)” when mentioned in
the NDC document) Description
Forestry and
Agriculture
Extension and amendment of Law 25.080 related to the investments for cultivated forests (2018)
The law aims to increase the investments, area, and enhancement of the sustainable management of cultivated forests within the country. The law grants among other benefits, an annual non-refundable Economic Contribution to some 3,000 small and medium forest producers.
Minimum Budgets for Envi-ronmental Protection of Na-tive Forest (Presupuestos Minimos de Proteccion) (2007) (+) 4)
Regulatory frame to control the reduction of native forest surface and achieve lasting surface over time.
National Forest Manage-ment Plan with Integrated Livestock (Plan Nacional de Manejo de Bosques con Ganadería Integrada) (2015) 4)
To improve and maintain ecological and cultural processes in native forest and promote activities for a sustainable management of native forest. Contributes to sustainable use of native forests through incorporating livestock activities in native forest area in a sustainable manner.
Investments for Cultivated forests (Inversiones Para Bosques Cultivados) (2008)
Development of afforestation projects on a total of 500,000 hectares of land based on economic incentives.
1) Not quantified in the NewClimate Institute projections. 2) Not quantified in PBL TIMER projections. 3) No information
available on implementation status. For the current analysis, we have assumed full implementation. 3) Not quantified
in IIASA model projections.
Table 6: Impact of climate policies on greenhouse gas emissions (including LULUCF) in Argentina. Absolute emission levels and changes in emission levels relative to 2010 levels are presented. References for official emissions data are provided in Table 1 and Appendix (A1). Emission values are based on IPCC Second Assessment Report (SAR)’s 100-year Global Warming Potential (GWP) values. N/A: not available.
2010 GHG emissions, incl. LULUCF
2020 pledge and NDC Current policies Official data [conditional] NewClimate estimates [conditional] Official
data NewClimate estimates
405 MtCO2e 2030: 483 MtCO2e [369 MtCO2e, -9%] 2020: N/A 2030: 483 MtCO2e, +19% [369 MtCO2e, -9%] N/A 2020: 367 to 396 MtCO2e, -10% to -2% 2030: 433 to 460 MtCO2e, +7% to +14%
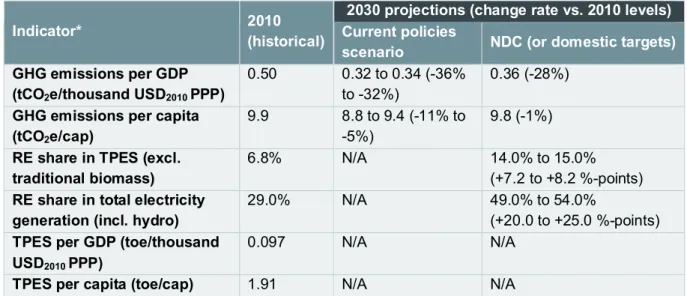
Table 7: 2010 historical data and 2030 projections of key GHG and energy indicators for Argentina. Absolute emission levels and changes in emission levels relative to 2010 levels are presented. The sector coverage for GHG emission indicators are consistent with the NDC targets and our assumptions on them. Emission values are based on SAR GWP-100. N/A: not available.
Indicator* 2010 (historical) Current policies 2030 projections (change rate vs. 2010 levels) scenario NDC (or domestic targets)
GHG emissions per GDP (tCO2e/thousand USD2010 PPP)
0.50 0.32 to 0.34 (-36%
to -32%) 0.36 (-28%)
GHG emissions per capita (tCO2e/cap)
9.9 8.8 to 9.4 (-11% to
-5%) 9.8 (-1%)
RE share in TPES (excl.
traditional biomass) 6.8% N/A 14.0% to 15.0% (+7.2 to +8.2 %-points)
RE share in total electricity
generation (incl. hydro) 29.0% N/A 49.0% to 54.0% (+20.0 to +25.0 %-points)
TPES per GDP (toe/thousand USD2010 PPP)
0.097 N/A N/A
TPES per capita (toe/cap) 1.91 N/A N/A
* Projections based on NewClimate Institute projections. Note: the renewable energy target in electricity generation excludes hydro, the share of which is assumed here to follow current trends.
3.2 Australia
Key policies implemented since 2015: The Emissions Reduction Fund (ERF), established in 2014
and renamed in 2019 as the Climate Solutions Fund, is at the core of Australia’s climate change policies. The Climate Solutions Fund (impact not quantified) is a reverse auction mechanism that aims to “reduce emissions at lowest cost over the period to 2020” (Australian Government, 2014)—and has a linked safeguard mechanism. The current government decided earlier in 2019 to provide an additional 2 billion Australian dollars to the Climate Solutions Fund (initially proposed to last 10 years, but according to the latest budget, 15 years); the Australian Government estimates that these measures will contribute to 100 MtCO2e of additional emissions reductions by 2030. The safeguard mechanism began operations in July 2016 and aims to ensure that the emissions reductions purchased through the ERF would not be displaced by emissions increases elsewhere, in particular large-scale industrial emission sources.
Recent developments (including proposed policies): The Climate Solutions Package from 2019
includes the Climate Solutions Fund, the Battery of the Nation project (impact not quantified) that aims to boost pumped storage potential between Tasmania and the mainland, and the development of a National Electric Vehicle Strategy (which has no quantified targets as of November 2019; impact not quantified). The proposed National Energy Guarantee, which aimed to secure sufficient supply of reliable power while lowering CO2 emissions (targeting 26% power sector emissions reduction by 2030, below 2005 levels), never materialised and the government decided not to raise the Renewable Energy Target between 2020 and 2030 (see also Table 11). The federal government seeks to introduce policies aimed at maintaining the competitiveness of coal-based electricity generation (Murphy, 2018). However, all states and territories (except Western Australia) now have renewable energy targets and/or zero emissions targets in place (Climate Council, 2017).
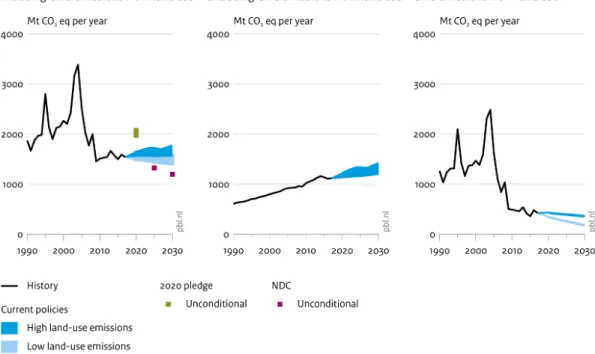
Projections: It is projected that Australia will likely miss its NDC target with existing policies. Our current
policies scenario projections this year are similar to our 2018 projections.
Figure 6: Impact of climate policies on greenhouse gas emissions in Australia (left panel: all gases and sectors, middle panel: excluding land use (i.e. LULUCF) and right panel: only land use). The LULUCF projections exclude removals from non-anthropogenic natural disturbances in line with Australia’s 2019 GHG Inventory Submission to the UNFCCC. Emission values are based on AR4 GWP-100.
Table 8: Description of Australia’s 2020 pledge and NDC. N/A: not available.
Indicator 2020 pledge NDC
Target:
unconditional 5% GHG reduction by 2020 from 2000 level Kyoto target: 108% of 1990 levels 2013-2020 26 to 28% GHG reduction by 2030 from 2005 level
Target:
conditional 15% and 25% GHG reduction by 2020 from 2000 level Not specified
Sectoral
coverage All GHG emissions, including emissions from afforestation, reforestation and deforestation Economy wide
General Accounting method
IPCC guidelines; 100-year GWPs from the Fourth
Assessment Report IPCC guidelines; 100-year GWPs from the Fourth Assessment Report
GHGs covered CO2, CH4, N2O, HFCs, PFCs, SF6 and NF3 CO2, CH4, N2O, HFCs, PFCs, SF6 and NF3
Consideration
of LULUCF Land-use sector is included Accounting approach is specified as Kyoto Protocol accounting rules (Article 3.7)1)
Land use credits: 27 MtCO2e by 2020
Land-use sector is included in the target
Net-net approach will be used for emission account-ing Use of bilat-eral, regional and interna-tional credits N/A N/A
Table 9: Overview of key climate change mitigation policies in Australia (Australian Government, 2015, Australian Department of the Environment and Energy, 2019, Australian Government, 2017a, Australian Government, 2017b). Sector Policies (marked with “(+)” when mentioned in the NDC document) Description
Economy-wide Climate Solutions Package (2019) 1) A policy package including, among others, the Climate So-lutions Fund, the Battery of the Nation Project in Tasmania, and the development of a National Electric Vehicle Strat-egy.
Emissions Reduction Fund (ERF) (2014) (+) 2) – relabelled Climate
Solutions Fund in 2019
Auctions are set up to purchase emissions reductions at the lowest available cost, thereby contracting successful bidders.
Energy
supply Renewable Energy Target (2010) (+) Targets
3) 33 TWh from large-scale generators (23.5% of total electricity generation) by 2020.
Transport Fuel tax (2006, last
amendment in 2019)4) Fuel tax for diesel and gasoline is set at AUD 0.418 per litre.
Forestry & Agricul-ture, Waste Emissions Reduction Fund (2014): Vegeta-tion & Agriculture
Include protecting native forests by reducing land clearing, planting trees to grow carbon stocks, regenerating native forest on previously cleared land.
Encourages sustainable farming, adaptation, and uptake of techniques for reducing emissions such as dietary sup-plements or efficient cattle herd management, capturing methane from effluent waste at piggeries, and enhancing soil carbon levels through adaptive farming practices. In total, 6.1 MtCO2e/year reductions of LULUCF emissions from 2010 levels expected by 2020.
20 Million Trees
Pro-gramme (2014) Plant 20 million trees by 2020 (20,000 ha) to re-establish green corridors and urban forests. Emissions Reduction
Fund (2014): Agricul-ture 5)
Ensures that advances in land management technologies and techniques for emissions reduction and adaptation will lead to enhanced productivity and sustainable land use under a changing climate.
Other Hydrofluorocarbon (HFC) emissions re-duction under the Montreal Protocol (2017)
Reduce HFC emissions by 55% by 2030, relative to 2010 (85% by 2036).
1) Not quantified separately in NewClimate Institute and PBL TIMER projections. 2) Not quantified in PBL TIMER
model projections. 3) The target was reduced in 2015 from its original 41 TWh (Scott, 2015). 4) OECD (2013). Policy
instrument not quantified separately in NewClimate Institute and PBL TIMER projections. 5) Not quantified in IIASA
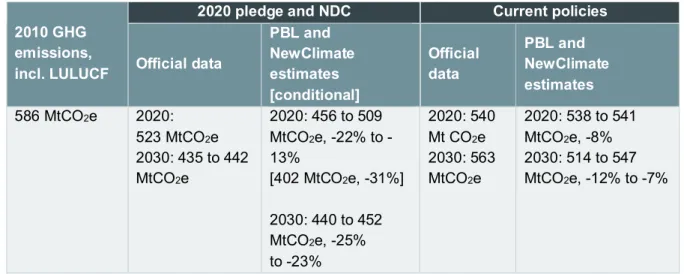
Table 10: Impact of climate policies on greenhouse gas emissions (including LULUCF) in Australia. Absolute emission levels and changes in emission levels relative to 2010 levels are presented. References for official emissions data are provided in Table 1 and Appendix (A1). Emission values are based on IPCC Fourth Assessment Report (AR4) GWP-100. N/A: not available.
Table 11: 2010 historical data and 2030 projections of key GHG and energy indicators for Australia. Absolute emission levels and changes in emission levels relative to 2010 levels are presented. The sector coverage for GHG emission indicators are consistent with the NDC targets and our assumptions on them. Emission values are based on AR4 GWP-100. N/A: not available.
Indicator* 2010 (historical)
2030 projections (change rate vs. 2010 levels)
Current policies
scenario NDC (or domestic targets)
GHG emissions per GDP (tCO2e/thousand USD2010 PPP)
0.65 0.33 to 0.35 (-48%
to -45%) 0.28 to 0.29 (-56% to -55%)
GHG emissions per capita (tCO2e/cap)
26.4 18.2 to 19.4 (-31%
to -27%) 15.6 to 16 (-41% to -39%)
RE share in TPES (excl. traditional
biomass) 5.0% 22.5% (+17.5 %-points) N/A
RE share in total electricity
generation (incl. hydro) 9.0% 35.0% to 41.9% (+26.0 to +32.9 %-points)
N/A (target only available for 2020)
TPES per GDP (toe/thousand USD2010 PPP)
0.140 0.102
(-27%) N/A
TPES per capita (toe/cap) 5.78 5.61
(-3%) N/A
* Projections for RE share in TPES, RE share in total electricity generation, TPES per GDP and TPES per capita based on PBL TIMER model projections.
2010 GHG emissions, incl. LULUCF
2020 pledge and NDC Current policies Official data PBL and NewClimate estimates [conditional] Official data PBL and NewClimate estimates 586 MtCO2e 2020: 523 MtCO2e 2030: 435 to 442 MtCO2e 2020: 456 to 509 MtCO2e, 22% to -13% [402 MtCO2e, -31%] 2030: 440 to 452 MtCO2e, -25% to -23% 2020: 540 Mt CO2e 2030: 563 MtCO2e 2020: 538 to 541 MtCO2e, -8% 2030: 514 to 547 MtCO2e, -12% to -7%