EXPERIMENTAL VALIDATION OF AN
UPGRADED COMMERCIAL IN-VIVO
EPID-BASED
DOSIMETRY
SYSTEM
FOR
RADIOTHERAPY OF LUNG TUMOURS
Manon Van Haute
Student number: 01506664
Supervisor: Prof. Dr. Ir. Carlos De Wagter
Co-supervisor: Frederik Vanhoutte
A dissertation submitted to Ghent University in partial fulfilment of the requirements for the degree of Master of Science in the Biomedical Sciences
PREFACE
In front of you rests the dissertation “Experimental validation of an upgraded commercial in-vivo EPID-based dosimetry system for radiotherapy of lung tumours”. On the verge of completing five beautiful academic years, this is my final work to accomplish the degree of Master of Science in Biomedical Sciences at Ghent University.
I would like to thank my promotor, Prof. Dr. Ir. De Wagter, providing me with the opportunity to explore this challenging topic and for believing in my (still growing) capabilities. Thank you for sharing your knowledge and for your continuous objective remarks, which encouraged me to critically reflect in-depth on my work. Your enthusiasm on this research, despite your busy working schedule and the unprecedented situation considering the COVID-19 pandemic, give me great ambition to successfully complete this master thesis.
Thank you, Frederik Vanhoutte, for the guidance when conducting experiments at the radiation therapy facility. Especially given the setbacks, due to several reasons, I received enormous support from you while finalizing this research, which contributed substantially to the final result.
Willeke Danckaert, you have taught me the past years to master the techniques of film dosimetry, through trial and error, for which I am thankful.
In addition, I would like to thank the staff members of the radiation therapy department at the Ghent University Hospital, who allowed me to observe the whole radiation therapy chain, from CT-simulation to treatment planning sessions till patient treatment.
Special thanks go to my family and friends, for their unconditional support and understanding throughout these sometimes-stressful years. To Kim Cannoot, who usually literally, stood by my side during this entire process, and for her always supporting words when I most needed them.
My ‘first steps’ in the field of radiation sciences were with all of you. I am yet excited and curious about what the future holds. Thank you all for your unwavering support.
IMPACT COVID-19
The initial aim of this thesis was to compare the capability of dose reconstruction by the collapsed cone (CC) and the pencil beam (PB) algorithm for lung tumours. To accomplish this,
an EPID-based system called DosimetryCheckTM was used to compare the reconstructed and
Raystation® TPS planned dose distributions. Moreover, these computed doses would be verified to the actual delivered dose to the phantom using Gafchromic EBT3 film measurements.
Due to the COVID-19 pandemic, several measurements that were needed to accomplish this, could not be successfully be executed. For reasons of uncertainty, all measurements with film would be performed twice to detect possible inaccuracies. However, due to COVID-19, we were unable to fulfill repeated measurements with film in the thorax phantom. Furthermore, although we were able to deliver the IMRT plan to the inhomogeneous phantom, some mistakes were made during the treatment, rendering the film useless for further investigation. Given the circumstances, there was no possibility to repeat this experiment with the correct setup.
Additionally, all analyses of the film experiments were performed using FilmQA Pro software, solely available at the University Hospital in Ghent. Evidently, not all examinations of the films were completed at the start of the corona outbreak. In order to cope with this issue, a personal license was requested to obtain a 30-days free trial of the FilmQA Pro program, so that the software could be downloaded at home to complete the examinations.
Besides the complications encountered during film dosimetry, more importantly for this thesis, the EPID measurements did not go as outlined beforehand. A major technical issue in the DC system, rendered the EPID-measurements collected over the year untraceable and therefore destroyed. After a time span of December till the end of March where the system was inoperable, DC became functional again through the efforts of the companies Elektra and Cablon. Since DC started working yet when the pandemic was already happening, I was not able to travel to the University Hospital in Ghent to resume these experiments. This of course affected the study in profound ways. In addition, it proved not possible to provide remote access to the UZ Gent server on which the DC software runs. Fortunately, I could count on my co-supervisor, who was willing to perform several experiments and run the DC analyses on my behalf. In order to manage the analyses of these measurements that would otherwise be proceeded at the UZ Ghent, again a trial of the PTW-VeriSoft software was downloaded on my personal computer.
Working from home on this master thesis has been challenging, as I believe this is a very complex topic, requiring time-from-time comprehensive discussing with the people who have best knowledge and experience in the field. The coronavirus has kept us from this, as meeting together was obviously not recommended. However, given the situation, my supervisors were open to call more often or engage in a zoom meeting to answer my questions. Owing to the COVID-19 crisis, I was not able to conduct the research the way I wanted to, still, my (co-) promotors have given me the tools to finish this master thesis, wherefore I am grateful.
TABLE OF CONTENTS PREFACE ... 2 IMPACT COVID-19 ... 3 LIST OF ABBREVIATIONS ... 6 SUMMARY ... 1 1. INTRODUCTION ... 2
1.1RADIATION THERAPY IN CANCER TREATMENT ... 2
1.2CURRENT ADVANCES IN RADIATION THERAPY ... 2
1.3DOSE CALCULATION ... 3
1.3.1 Dose calculation algorithms ... 4
1.3.2 Accounting for tissue inhomogeneities ... 6
1.3.3 Treatment planning considerations ... 7
1.4DOSE VERIFICATION ... 8
1.4.1 Radiochromic film dosimetry ... 8
1.4.1.1 Precautions for radiochromic film dosimetry ... 8
1.4.1.1.1 Post-irradiation colorisation ... 8
1.4.1.1.2 Film orientation ... 9
1.4.1.1.3 Lateral response artefact ... 9
1.4.2 EPID systems for radiotherapy dosimetry ... 9
1.4.2.1 Challenges specific for a-Si EPIDs ... 10
1.4.2.2 Portal dosimetry software: DosimetryCheckTM ... 10
1.5RESEARCH OBJECTIVES ... 11
2. MATERIALS AND METHODS ... 12
2.1CT SIMULATION ... 12
2.1.1 Homogeneous CarPet phantom ... 13
2.1.2 Inhomogeneous thorax phantom ... 13
2.2TPSRAYSTATION®: DETERMINATION OF THE PLANNED DOSE ... 13
2.3FILM DOSIMETRY: EXPERIMENTAL DETERMINATION OF THE DOSE ... 14
2.3.1 EBT-3 Gafchromic® film model ... 14
2.3.2 Film calibration ... 15
2.3.3 Film irradiation ... 15
2.3.4 Image aquisition ... 16
2.3.5 Analysis software: FilmQA Pro ... 16
2.4EPID DOSIMETRY: DETERMINATION OF THE RECONSTRUCTED DOSE ... 17
2.4.1 The EPID panel ... 17
2.4.2 Dose distribution comparison ... 18
3. RESULTS ... 20
3.1INTRODUCTION OF A CORRECTION FACTOR ... 20
3.2FLUENCE MAPS OF THE TRANSIT MEASUREMENTS ... 20
3.3RELIABILITY OF THE DOSE RECONSTRUCTION MEASUREMENTS. ... 22
3.4COMPARISON BETWEEN PRE- AND TRANSIT MEASUREMENTS ... 22
3.4.1 CarPet ... 23
3.4.2 Thorax ... 23
3.5COMPARISON BETWEEN THE RECONSTRUCTED – PLANNED DOSE ... 25
3.5.2 Gamma analysis CarPet ... 27
3.5.2.1 10X10 3D-CRT, CarPet ... 27
3.5.2.2 2X2 3D-CRT, CarPet ... 28
3.5.2.3 5X5 3D-CRT, CarPet ... 29
3.5.2.4 IMRT, CarPet ... 29
3.5.3 Evaluation of the system in a more patient-like geometry: Thorax phantom ... 29
3.5.4 Gamma analysis Thorax ... 29
3.5.4.1 10X10 3D-CRT, Thorax ... 30
3.5.4.2 2X2 3D-CRT, Thorax ... 30
3.5.4.3 5X5 3D-CRT, Thorax ... 31
3.5.5 Evaluation of the system in a representative clinical setting: Thorax phantom ... 31
3.6COMPARISON BETWEEN THE RECONSTRUCTED –2D MEASURED DOSE ... 33
3.6.1 Calibration curves ... 33
3.6.2 CarPet ... 33
3.6.3 Thorax ... 36
3.7EPID’S CAPABILITY OF DETECTING INACCURACIES ... 37
4. DISCUSSION ... 38
4.1INTRODUCTION OF THE CORRECTION FACOR AND RELIABILITY OF THE MEASUREMENTS ... 38
4.2FLUENCE MAPS ... 38
4.3COMPARISON BETWEEN PRE- AND TRANSIT MEASUREMENTS ... 39
4.4COMPARISON BETWEEN THE RECONSTRUCTED – PLANNED DOSE ... 40
4.5COMPARISON BETWEEN THE RECONSTRUCTED –2D MEASURED DOSE ... 43
4.6EPID’S CAPABILITY OF DETECTING INACCURACIES ... 43
5. CONCLUSION ... 44 REFERENCES ... 45 POSTER ... 47 ADDENDUM I ... 48 ADDENDUM II ... 49 ADDENDUM III ... 53 ADDENDUM IV ... 54
LIST OF ABBREVIATIONS
RT EBRT SBRT
Radiation Therapy
External Beam Radiation Therapy Stereotactic Body Radiotherapy
TCP Tumour Control Probability
NTCP Normal Tissue Complication Probability
CT Computed Tomography
3C-CRT 3D – Conformal Radiation Therapy
OAR Organs At Risk
IMRT Intensity Modulated Radiation Therapy
MLC MV Multileaf Collimator Megavoltage TPS ICRU CPE PB SC CC(C) Monte Carlo
Treatment Planning System
International Commission of Radiation Units and measurements Charged Particle Equilibrium
Pencil Beam
Superposition – Convolution Collapsed Cone Convolution Monte Carlo
GTV Gross Tumour Volume
PTV Planned Target Volume
CTV Clinical Target Volume
ITV Internal Target Volume
TERMA Total Energy Released Per Unit Mass
QA QC OD ROI LRA EPID Quality Assurance Quality Control Optical Density Region Of Interest
Lateral Response Artefact Electronic Portal Imaging Device
A-Si Amorphous Silicon
TFT Thin Film Transistor
SDD Source - Detector Distance
SSD Source - Skin Distance
IVD DD DTA PR In-Vivo Dosimetry Dose Difference Distance – To – Agreement Passing Rate
SUMMARY
Background High accuracy in 3D dose verifications is vital during radiation therapy to conduct
proper quality assurance (QA). A variety of devices have been widely reported for dose verification. An electronic portal imaging device (EPID)-based system called
DosimetryCheckTM (DC), allows to perform pre-treatment and transit measurements. This work
aims to study the difference between the pencil beam (PB) and the superposition-convolution (SC) algorithm used by DC for patient-specific QA in lung.
Materials and Methods DC was used along with an Elektra Synergy® linac equipped with an
EPID iViewGT portal imager. Different treatment plans were generated using RayStation® TPS over a homogenous phantom (CarPet) and a heterogeneous thorax phantom. Comparison of the DC reconstructed – 2D film measured – Raystation® planned dose distributions are accomplished by gamma-evaluation.
Results In general, the accuracy of CC was equivalent to PB for the homogenous phantom
and better than PB for the thorax phantom. The highest discrepancies between both algorithms were at small field sizes, due to loss of charged particle equilibrium (CPE). The measured dose by EBT3 film in CarPet disclosed high correspondence between the PB and CC reconstructions. The film measured doses in thorax remains inconclusive since we were unable to resume our measurements due to the COVID-19 pandemic.
Conclusion The data suggests that the CC algorithm’s performance used by DC is better than
PB for patient-specific QA in lung due to it superiority in particle transport modeling. However, DC dose reconstruction, even with CC, remains intricate for small field sizes and requires further investigation.
1. INTRODUCTION
1.1 RADIATION THERAPY IN CANCER TREATMENT
Cancer remains a major healthcare problem globally, responsible for over 18.1 million new
cases and 9.6 million deaths1. Cancer is a multigenetic and multifactorial disease that can arise
from any cell type. The hallmarks of cancer comprise six biological capabilities acquired during the multistep development of neoplastic diseases. These are: 1) unlimited proliferative potential, 2) evading growth suppressors, 3) angiogenesis, 4) resisting apoptosis, 5) enabling replicative immortality and 6) invasion and metastasis to different parts of the body.
Worldwide, lung cancer is the most commonly diagnosed cancer and the leading cause of
cancer mortality, accounting for over 1.6 million deaths annually2. In Belgium, lung cancer
constitutes 11.8% of all invasive cancers in both sexes, which makes it the second most frequent cancer in our country, succeeding breast cancer (14.8%). As a result of its poor prognosis, lung cancer is responsible for the largest number of deaths in both men and women.
Survival rates for lung cancer remain abysmal, with a 5-year overall survival of 10-15%3.
Depending on the type and the staging, lung tumours can be treated with chemotherapy, radiation therapy, surgical procedures, or a combination of these. Radiation therapy (RT) is a critical modality used in cancer treatment, as well for the curative and palliative treatment of this disease. Approximately 50% of the patients will require radiation therapy during their course of illness. There are two approaches to deliver radiation to the location of the tumour: external beam radiation therapy (EBRT) or brachytherapy. The latter delivers the radiation dose from inside the body by radioactive sources like seeds that are targeted in proximity to the tumour site. For lung cancer, external beam radiation is the most common approach in a
clinical setting4,5.
1.2 CURRENT ADVANCES IN RADIATION THERAPY
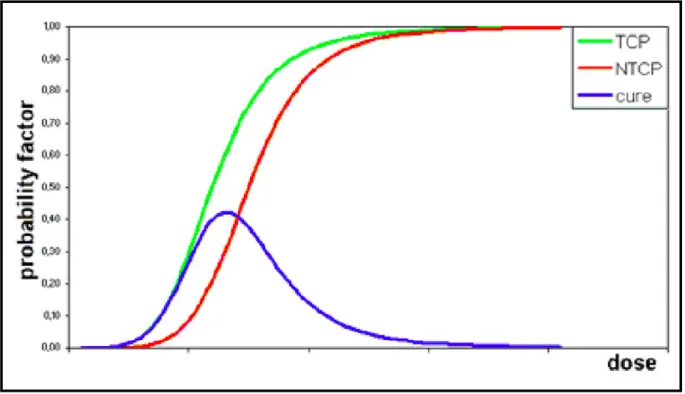
The main objective in RT is to maximize the dose delivered to abnormal cancer cells whilst sparing healthy tissue. However, when administering the radiation dose to the patient, healthy tissues will inevitably be affected as well. The dose-response relationship in both tumour and normal tissue can be described by a sigmoid curve, as shown in Figure 1. The cure probability (=TCP – NTCP) depends on the difference between tumour control probability (TCP) and the normal tissue complication probability (NTCP). The radiation dose that can maximize the therapeutic window represents the optimal dose for the patient. In practice, expanding the therapeutic window can be accomplished by better sparing of more normal tissue, i.e. shifting the NTCP curve to the higher dose area. This can be accomplished, for example, by including
better target imaging, improved patient immobilization, or enhancing the dose conformity5,6.
However, the thorax remains a challenging anatomical site for RT delivery. Irradiation of the target volume is complicated for three reasons: the low electron densities and tissue inhomogeneities; tumour displacement by respiratory and cardiac movement; and the
proximity of critical structures such as the esophagus, heart, and spinal cord7.
Several innovations in RT have been introduced over the past two decades that may be advantageous to meet these challenges. In early radiotherapy, the irradiation field, or “portal”, was defined two-dimensionally using rectangular fields on planar transmission x-ray imaging. The introduction of computed tomography (CT) in radiation oncology enabled 3D - conformal radiation therapy (3D-CRT) by providing us with tissue densities and accurate anatomical positioning of the tumour and organs at risk (OAR) during treatment planning.
The concept of conventional 3D-CRT rests on ‘forward’ planning, in which the dose distributions are calculated from the given beam parameters including energy, direction, size
and intensities. Conformal RT generates open fields with a uniform intensity, conform with the geometrical shape of the tumour. However, OAR positioned in close vicinity of rounded target volumes cannot be guarded against the target dose.
By contrast, intensity-modulated radiation therapy (IMRT) makes use of ‘inverse’ planning software, in combination with computed-controlled intensity modulation of multiple radiation beams during treatment. For this revolutionary concept objectives and constraints concerning the dose distributions are given first, and optimization of the beam intensities is calculated afterwards. IMRT plans generate non-uniform intensity fields in addition to geometric shaping. As a result, intensities of the rays that cross the OAR are reduced and the dose to the target is maximized. Optimal intensity modulation in IMRT is accomplished by the usage of a multileaf
collimator (MLC), creating various irregular field sizes over multiple beam angles5,8.
With the addition of changing gantry rotation speeds, dynamically regulating dose rates, and MLC, volumetric-modulated arc therapy (VMAT) was introduced. VMAT can significantly improve delivery efficiency due to the development of highly conformal dose distributions. Nevertheless, the primary advantage of VMAT in the clinic is its ability to shorten treatment
times which makes it possible to increase the patient throughput8. At the UZ Ghent
Radiotherapy centre, most treatment plans for lung cases are for now established with 3D and IMRT techniques for lung cases. VMAT is often not the preferred technique for treatment of lung tumors, as they smear out the dose over the whole lung, possible affecting critical organs or the healthy, contralateral lung. However, in case of oligometastases or SBRT’s (stereotactic body radiotherapy), the small volume involved enable the use of VMAT.
Figure 1. Typical TCN (green) and NTCP (red) curves. The cure probability (= TCP-NTCP) becomes
greatest with the optimal dose. The maximum probability for tumor control without normal tissue complications (blue line) is reached at the optimum dose9.
1.3 DOSE CALCULATION
their energy by the creation of ion-pairs. The energy deposited in the tissue, per unit of mass, is called the absorbed dose. Note that for RT beams (generally 6 MV - 20 MV), the maximum of the absorbed dose is not at the surface but lies subcutaneously at a depth approximately equal to the range of the secondary charged particles. This region is called the dose build-up
region. The build-up depth heavily depends on the used energy; higher energies create larger
build-up regions as the range of the secondary charged particles become extended (e.g. 6 MV≈13 mm vs. 18 MV ≈ 30 mm). For low and medium energy x-rays (<1 MeV), the build-up is neglectable.
Another important concept is denoted as “charged particle equilibrium” (CPE). In radiological physics, CPE exists for a volume v if the number of charged particles of a given type and energy leaving v is equal to the number of charged particles entering v, with the same energy (ratio equals 1). Strictly speaking, when using high photon energies, complete CPE never exists because the primary beam is attenuated over the range of the secondary charged particles. In this case, a “transient CPE” is defined. For transient CPE, a fixed ratio exists between the amount of incoming- and outgoing- charged particles (ratio > 1.0). Loss of CPE exists, for example, in the build-up region mentioned previously, at the edges of the beams, or more importantly, at the presence of heterogeneity interfaces. Under conditions of loss of CPE,
prediction of the dose becomes intricate and may be limited in accuracy10.
1.3.1 DOSE CALCULATION ALGORITHMS
Accurate calculation of the 3D dose distribution within the patient is crucial in radiation oncology, therefore it must rely on a trustworthy dose algorithm. Dose computation algorithms are critical elements in treatment planning, delivery and dose reconstruction. The International Commission of Radiation Units (ICRU) introduced a recommended dose accuracy within 5%. As a consequence, it is essential to use a dose calculation algorithm that can compute the dose distribution within 3% accuracy to meet the ICRU criteria, considering additional uncertainties derived from patient setup, machine calibration and dose calculation from
treatment planning systems11,12.
In radiotherapy of lung lesions, variations in computed dose distributions due to dose algorithm selection will affect TCP predictions. Inaccurate dosimetry can mislead clinical decision making and potentially affect patients’ outcomes. A 5% dose error may result in a 10% to 20% change in tumour control probability (TCP), and an even greater impact on the normal tissue
complication probabilities (NTCP)7.
In clinical practice, finding a tradeoff between two mutually conflicting goals, i.e. “high speed” and “high accuracy”, remains one of the most crucial challenges for the development of meaningful modern dose calculation algorithms. Firstly, fast calculation times are desired so that plan optimization during the treatment planning process can be achieved within clinically acceptable time frames. Plan optimization is an iterative process. The dose distributions are analysed and compared, until they meet the specific individual constraints. Secondly, calculation of the absorbed dose within a patient needs to be sufficiently accurate so that reliable correlations between the treatment parameters and the clinical outcomes can be made13,14.
Originally, early algorithms were developed by an empirical method starting from the ultimate ‘homogeneous’ patient, i.e. a water tank. Dose distributions experimentally measured in the water tank were subsequently modified by inhomogeneity correction factors (ICF). Algorithms that use this 2-step process are called “correction-based”. These methods account for the change in attenuation of the primary dose, however, changes in electron transport is not considered. Consequently, they overestimate the dose when the electron density is lower than
anticipated and underestimate the dose when the electron density is greater than anticipated
because they overlook changes in scatter conditions12,14.
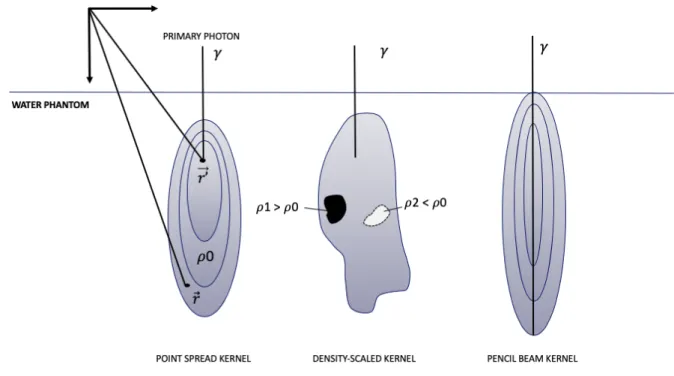
Later, “model-based” algorithms were developed to set up a model that first calculates the photon fluence emerging from the accelerator head. In the next step, the particles’ interaction with matter of an MV photon beam needs to be considered. This can be accomplished by the introduction of dose kernels. Kernels represent the energy deposited about a primary photon
interaction site14. A more detailed description of dose kernels is given in Figure 2.
Figure 2. Left: The most elementary kernel k(!⃗,!’$$⃗, E), is the so-called spread kernel” or “point-spread function”, indicating the distribution of the absorbed dose in water at the coordinate !⃗ which is created by interactions of primary photons of energy E at the coordinate !′$$⃗. Middle: Density scaled kernel. Deformation of the kernel exists in the presence of inhomogeneities. In areas of higher densities (e.g. bone) the kernel will collapse and become smaller, while in areas with lower densities (e.g. lung) the kernel stretches which leads to a more spread out dose distribution14. Right: pencil beam kernel.
Image source: personal collection.
Monte Carlo (MC) methods can be used to statistically model particle interaction for a large
number of photons and electrons, taking into account the scatter components. Each photon and electron history is explicitly traced and the final dose distribution is given by the summation of the individual dose distributions along the particle trajectories. In summary, MC methods are considered the most accurate technique for dose calculation, however, they require long
computation times which makes them often impractical for application in a clinical setting12,15.
Pencil-Beam (PB) is an algorithm by which the radiation beam is divided into various, infinitely
narrow pencil beams. The kernels are pre-calculated with MC and represent the dose distribution along a very narrow beam entering a water phantom.
Calculation of the absorbed dose can eventually be accomplished by the convolution of the total energy released per unit mass (TERMA) and the point dose kernel. The TERMA describes the energy absorption of the medium resulting from the interaction of primary photons.
PB algorithms have proven their efficiency in homogeneous regions of the body and require very little calculation times. However, when considering regions of inhomogeneities, the PB method only accounts for inhomogeneity correction along the longitudinal direction of the pencil beams and ignores changes in lateral scatter. This condition may cause inaccuracies for dose calculation in the lung because the PB kernel is not scaled in the width, whereas in
reality the dose is smeared out because of the low-density12,14.
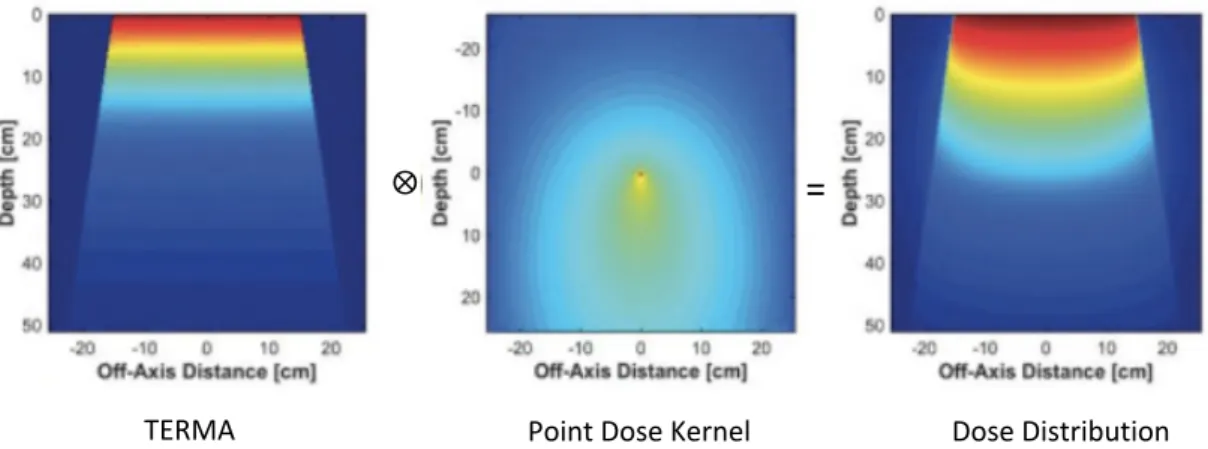
Other algorithms that are widely used during RT treatment planning and dose verification methods rely on superposition convolution (SC) methods. They achieve accuracies closer to the results of MC while taking less processing time. SC algorithms account for lateral scatter effects by density scaling of point-spread kernels. This implies that, in order to account for heterogeneities in a patient, the kernel is scaled by use of the material densities defined by CT images. Computation of the absorbed dose is completed by convolution of the photon fluence with the kernel (Figure 3). Several implementations of the superposition- convolution algorithms exist today, such as the collapsed cone (convolution) (CCC). In the collapsed cone approximation, the energy release from the interaction point in a point spread kernel is considered by subdividing the space into several cones. The dose is then calculated by evaluating the kernel along the cone axes (“collapsed cone”) instead of considering the whole
solid angle11,12,14.
Figure 3. Convolution dose calculation. The dose distribution was obtained by the convolution integral
of TERMA with the point dose kernel.15
1.3.2 ACCOUNTING FOR TISSUE INHOMOGENEITIES
Dose calculation algorithms encounter difficulties in heterogeneous media. The average
density of soft tissues, and consequently tumours is about 1 g/cm3, whereas the average
density of lung is only one-third of that in normal tissue (+- 0.35 g/cm3)16. In thoracic tumours
surrounded by low-density lung tissue, conditions of loss of CPE occur. This is generally the case whenever there exists inhomogeneity of atomic composition within the volume v (see 1.3, CPE). In low-density, lung-equivalent tissues the decrease of the dose in lung due to electron scattering and the “re-buildup” of the dose at the lung-tumour boundaries, can produce a “ring” of substantial underdosage at the tumour interface region. Because conventional dose algorithms do not explicitly account for secondary electron transport, the prediction of the dose for complex lung cases, involving small lung tumors, entirely enclosed by lung tissue (i.e. “island-like” lesions) is complicated. Disturbances in electronic equilibrium are exacerbated at higher beam energies and smaller field sizes because the lateral ranges of the secondary electrons become further elongated. Consequently, dose calculation of radiation field sizes below 3.5 cm are potentially less accurate, and beam energies above 10 MV should be confined, according to the RTOG 0236 Protocol. More sophisticated algorithms including
⨂
TERMA Point Dose Kernel Dose Distribution
three-dimensional (3D) scatter integration, i.e. superposition- convolution, or Monte-Carlo methods are crucial to provide an improved description of the absorbed dose for complex geometries, e.g. lung cases, as they explicitly account for electron transport within tissue heterogeneities. Tissue inhomogeneity can be accounted for in the TERMA by ray tracing the
pathway of a photon to its interaction point 7,14.
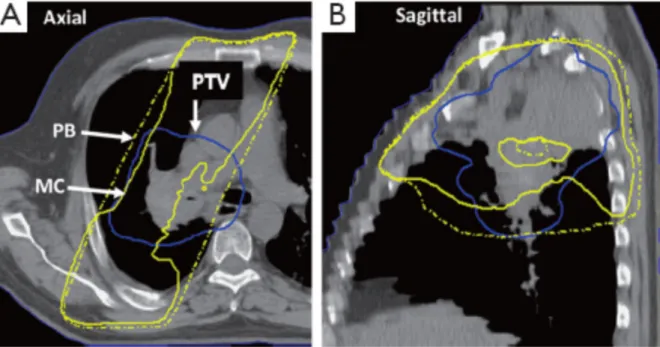
Figure 4. A treatment plan for a patient with locally advanced stage non-small cell lung cancer, shown
in axial (A) and sagittal (B) view. Comparison of the 100% isodose line when dose calculation is performed using pencil beam (dashed yellow line) and Monte Carlo method (solid yellow line). Important underdosage of the PTV (solid blue line) can be noticed when using MC based on the fact that the range of the secondary electrons is larger than the radius of the target volume; scilicet, the PTV region is not sufficient to absorb the total number of secondary electrons and the remaining electrons are simply scattered into the low-density lung. This figure illustrates that PB-based algorithms are indifferent to the presence of low-density lung tissue and do not account for electron scattering effects7.
1.3.3 TREATMENT PLANNING CONSIDERATIONS
Definition of tumour and target volumes for radiotherapy treatment planning are essential for its successful implementation. There are three main volumes to be mentioned which are internationally defined by the ICRU: the gross- (GTV), clinical- (CTV) and planned- (PTV) target volume. The gross tumour volume is the clinically “visible” volume delineated on imaging. The clinical target volume contains the GTV but extends it with a margin for subclinical disease spread that cannot be fully imaged. The third volume is called the planned target volume, which accounts for uncertainties in the CTV due to day-to-day variations in anatomy and patient
setup6,17.
Sometimes the concept of the “internal margin” is mentioned as well, which incorporates uncertainties arising from internal movement of the tumour, for example, by respiratory movement. When this internal margin is combined with the CTV, the internal target volume (ITV) is formed. Because lung tumours might vary with breathing, and breathing motion itself
is variable, there is ambiguity in defining its volumes7.
As mentioned in the introduction, treatment plans should be designed to minimize dose to the surrounding healthy tissue and thereby limit the risk of treatment toxicity. This implies sharp gradients in the dose fall-off outside the target. Beam arrangements for treatment planning of
intensity-modulated beams. However, some important difficulties need to be considered when designing a treatment plan for lung cancer treatments. For example, AP/PA fields can be adopted when the aim in such a case is to create a homogenous dose distribution across the treated volume to encompass the extent of the disease. Nevertheless, AP/PA fields can only be used for cumulative PTV doses in the range of 45-50Gy due to spinal cord tolerance. Nowadays, AP/PA plans are mostly outdated, but can be used in case of palliative treatments. In addition, dose parameters must be closely noticed to avoid radiation pneumonitis and limit
normal tissue toxicities such as skin erythema7.
1.4 DOSE VERIFICATION
Because of the advances in EBRT over the past decade, by the introduction of complex IMRT and VMAT treatments, the demand for patient-specific verification has increased. Quality control (QC) procedures can ensure a high level of accuracy for treatments needed to provide optimal patient safety. A variety of devices such as point detectors, films, and gel have been widely reported for dose verification.
1.4.1 RADIOCHROMIC FILM DOSIMETRY
Two-dimensional radiochromic film dosimetry is a widely used technique for treatment dose verifications. Gafchromic® EBT3 films (Ashland ISP Advanced Materials, Wayne, NJ, USA) assure truthful measurements of the absorbed dose, in analogy with dosimeters, due to their high spatial resolution, near-tissue-equivalent density and relatively small energy dependence. Moreover, unlike the old silver-halide based radiographic films, radiochromic films alter its color upon irradiation through a polymerization process, without the need for further wet chemical processing. The response of the radiochromic film to ionizing radiation can be described in terms of transmittance (T) - or more commonly used optical density (OD) - as a quantity of choice, which can be calculated by the following formulas:
& =(!"#$% (&
)* = − -./'&& = 0. 2. 3
where I0 denotes the incident light intensity (=216) and I
t is the transmitted light intensity through
the film18. # = absorption coefficient, $ = molar concentration of the absorbing matter, % =
thickness of the material)
1.4.1.1 PRECAUTIONS FOR RADIOCHROMIC FILM DOSIMETRY
Aside from its favorable characteristics, many factors of uncertainty are involved in film dosimetry which may have an impact on the signal detected by the measuring device. As a result, great caution should be taken when manipulating, irradiating and scanning the films. 1.4.1.1.1 POST-IRRADIATION COLORISATION
First, post-exposure changes should be considered. Post-exposure changes refer to changes in OD depending on the time interval between the exposure and densitometry. This effect can be attributed to the fact that after exposure to ionizing radiation, the film starts a solid-state polymerization process of crystals in the active layer. Generally, it can be said that, the rate of polymerization decreases with time, and that the film darkening is as a function linear with the log(post-irradiation time). In order to mitigate this effect, our films are repeatedly read-out only
(1)
24h post-exposure. This ensures further changes in OD are limited, since the response values
asymptote to almost constant values when the polymerization process is completed19.
1.4.1.1.2 FILM ORIENTATION
Film digitalization is by far the most crucial step when it comes to uncertainties. Therefore, special attention should be given to film scanning. The film orientation on the scanner bed, for example, should be kept constant under all circumstances. The polymerization process instigates the formation of needle-like crystals, that grow in one direction, therefore inducing anisotropic light scattering in the radiochromic film. For that reason, rotation of the application film with respect to the calibration film pieces, especially over 90° (portrait vs. landscape) will cause deviations in measured response values over the same region of interest (ROI). Using the FilmQA pro software package (Ashland ISP Advanced Materials, Wayne, NJ, USA), gives the opportunity to indicate such mismatches between the patient film and the calibration data, demonstrated in the so-called “consistency maps”. Note that, “portrait” orientation is referred to the film when its long axis is parallel to the scan direction. The positioning of the film
perpendicular to the portrait orientation can be denoted as “landscape” orientation18,20,25.
1.4.1.1.3 LATERAL RESPONSE ARTEFACT
Another important issue with respect to the accuracy of radiochromic film dosimetry is the lateral response artefact (LRA), which is induced due to non-uniform response of a flatbed scanner in the direction perpendicular to the scan direction. As the lateral distance from the scan-axis increases, the angle and the path length of incidence rays increases. Hence, by the Beer-Lambert law represented in equation (2), this causes the transmission, and consequently the measured signal to the CCD detector, to diminish towards the side of the scanner. During this study, the films are positioned at the centre of the scanning window to minimize the
influence of the LRA21,25.
1.4.2 EPID SYSTEMS FOR RADIOTHERAPY DOSIMETRY
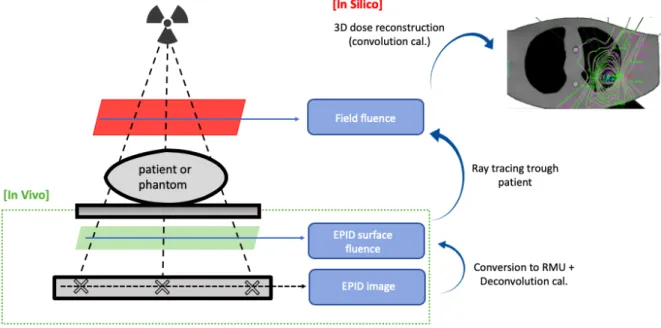
Recently, electronic portal imaging devices (EPIDs) have been an attractive tool for verification procedures because of their favorable characteristics such as fast image acquisition, high resolution, digital format, and the potential to conduct in-vivo (3D) measurements. Originally, EPIDs were developed to assist the patient set-up by generating MV-radiographs of the patient during treatment. Now, the current generation of amorphous-silicon (a-Si) EPIDs or flat-panel imagers are commercially available for dosimetric applications. There are various ways to employ EPIDs as patient dosimeters. Verification procedures can be categorized into i) pre-treatment verification (i.e. measurements outside of pre-treatment time, without the patient) and ii) treatment verification (i.e. measurements during treatment time, with a patient). Dosimetry methods can be classified according to whether or not the beam has passed an attenuating medium; non-transmission (non-transit or portal) dosimetry vs. transmission (transit or exit) dosimetry. Application of an a-Si EPID portal imager for three dimensional (3D) in-vivo dosimetry (IVD) will be the focus here. For this application, dose determination within the
Figure 5. Potential setups for EPID dosimetry, with the possibility to verify the dose distribution at the
level of the EPID panel (portal dosimetry) or at the patient/phantom level (in silico). Illustration adapted from van Elmpt, W. et al.22
1.4.2.1 CHALLENGES SPECIFIC FOR A-SI EPIDS
EPID dosimetry can play an important role in the total chain of verification procedures as it provides a safety net for advanced treatments, allowing adaptation of the treatment plan when necessary. Nevertheless, there are still several challenges when applying EPIDs in clinical practice. First, the “ghosting” effect needs to be considered. Ghosting exits when a trapped charge within the photodiode layer of the portal imager alters the electric field strength of the bulk and surface layers, thereby affecting subsequent images. An additional issue is called “image lack”, which results in an offset of the EPID signal due to incomplete charge transfer from the pixel capacitor. Furthermore, a-Si EPIDs have been reported to show over-sensitivity to low photon energies (<0,5 MeV) due to increased photoelectric effect in the copper (Cu)/phosphor screen. The extend of these effects generally depends on the specific EPID
application, a variety of approaches have been suggested to alleviate these challenges22,23.
1.4.2.2 PORTAL DOSIMETRY SOFTWARE: DOSIMETRYCHECKTM
Dosimetry CheckTM (DC) (Math Resolutions, Columbia, MD, USA) is a commercial EPID-based
dosimetry software, allowing to perform pre-treatment and transit dosimetry. Besides EPID, a diode or ion chamber can also be used to perform verification measurements. For pre-verification or transit dosimetry purposes, the images acquired with the EPID are exported in DICOM format to DC. DC operation begins with the import of patient information such as CT images obtained during simulation and plan parameters. Computation of the absorbed dose (cGy) from EPID transit images consists of different steps:
i) First, each pixel of the image is mapped to relative monitor unit (RMU). This number
can be defined as the number of MU that produces the same pixel grey levels as a well-controlled calibration condition. This is conventionally on the central axis of a
10x10 cm2 reference field used to define the output of the linear accelerator.
ii) The fluence map derived from the previous step is run through a deconvolution
kernel which removes the scatter component caused by the housing surrounding the portal imager.
iii) In the case of transit measurements, the attenuation of the beam by the patient has
path from the radiation source to the exit image. That step requires ray tracing through the CT scan set and should include a model of the treatment couch. A point spread that is a function of both radius and water equivalent thickness of what is in the beam is used to convert to in air fluence (in RMU) stream-up from the patient.
iv) The true in air fluence can then be used as an input for the DC dose calculation
engine. DC can use a PB algorithm or CC algorithm to calculate the absolute dose
on the patient26,27.
In a final step, DC uses treatment planning parameters, the CT images and the dose file to conduct a quantitative evaluation of the difference between the TPS and the measured analysis. DC gives the possibility to deliver AutoReports, automatically generated as pdf. Here, the reconstructed doses, 2D isodoses, gamma-volume-analysis and passing rates, gamma volume histograms (GVH), and dose-volume histograms are given based on a predefined set of input parameters. Eventually, DC thus allows to make a direct comparison between the reconstructed dose with the dose computed by the TPS to establish an accuracy level of the system (Figure 6).
Figure 6. Schematic diagram of EPID-based 3D in-vivo dose reconstruction. Image source: personal
collection.
1.5 RESEARCH OBJECTIVES
DosimetryCheckTM is a commercial EPID-based dosimetry software used at the Department
of Radiotherapy at the Ghent University Hospital. It allows to perform pre-treatment and transit (or exit) dosimetry. Despite DC demonstrated its capability in homogeneous regions of the body using a Pencil Beam (PB) dose algorithm, its performance remains poor in and around lung tumours. As result of a major upgrade in the system, the PB algorithm was replaced by the more sophisticated superposition-convolution (SC). More specifically, the collapsed cone convolution (CC) algorithm was implemented by MathResolutions in DC, which should provide a more realistic description of the absorbed dose. The purpose of this thesis is to investigate the accuracy and the performance of this upgraded EPID-based dosimetry system for patient-specific QA for complex lung cases.
2. MATERIALS AND METHODS
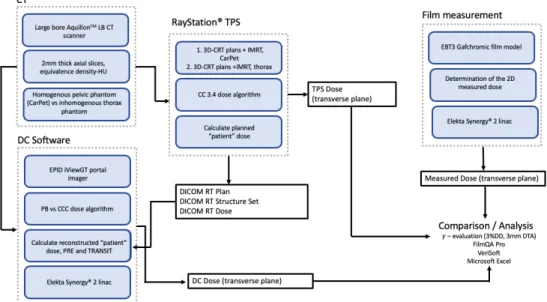
Figure 7. Schematic of the study design. Image source: personal collection.
2.1 CT SIMULATION
In analogy with the clinical process during radiation therapy, the phantoms are simulated using
a large bore AquilionTM LB Computed Tomography (CT) scanner (Canon Medical Systems,
Tustin, USA) at the UZ Ghent University Hospital. During this study, phantoms will be used to ensure a fixed patient anatomy throughout the experiments. This rules out any dose deviations that could be attributed to patient-dependent factors. The phantoms are oriented in “headfirst - supine” position while obtaining axial slices with 2mm slice thickness. The equivalence density-HU, characteristic of the CT, serves as necessary input for the TPS and the quality control system DC. Further, the CT simulation allows to obtain the correct data for appropriate positioning of the phantom on the treatment couch during irradiation. Based on the area where the target volume is located, the isocentre (centre of the isovolume) is established using XYZ-coordinates. In clinical settings, the centre of the irradiation field would be marked on the skin with fuchsine, an ink containing silver nitrate. For these experiments, external marks on the phantoms are drawn using adhesive tape and a pen. CT simulation images are eventually transferred to RayStation® TPS via DICOM.
Figure 8. CT simulation of the inhomogeneous thorax phantom (left) and the homogeneous CarPet
phantom (right). The green laser lines indicate the position of the isocenter chosen. Image source: personal collection.
2.1.1 HOMOGENEOUS CARPET PHANTOM
During the first phase of the experiment, a solid homogeneous pelvic phantom (denoted as CarPet) is used to conduct the calculations in well controlled reference conditions. The phantom with dimensions 37cmx 20cmx 16cm is constructed out of 16 sections, each 1cm thick, that are held together by two central supporting bars. The phantom is made out of
polystyrene material (& = 1,029 ./$0!) which can therefore be considered as nearly water
equivalent. In addition to the physical density, polystyrene approximates the attenuation (linear attenuation coefficient) and scattering properties as water, and consequently tissue. From the CT-images a Setup Reference Point was defined with coordinates x = 0 cm, y = 0 cm, z = 0 cm. For this phantom, simple three-beam plans and an IMRT plan are generated in RayStation® TPS.
2.1.2 INHOMOGENEOUS THORAX PHANTOM
During the second phase of the experiment, a custom-made anthropomorphic thorax phantom is used to verify the system in the presence of heterogeneities. The phantom represents a male human with dimensions corresponding to the human anatomy. It is sliced into 2 mm sections, for convenience every five sections are fused, and the sections are repeatedly held together by two supporting bars. Here, a Setup Reference Point was chosen in the embedded “tumour” location, x = 7.5 cm, y = 4.7 cm, z = -4.2 cm. Like the homogeneous phantom, this phantom is made out of polystyrene, therefore faithfully mimicking human tissue. It also contains lung-equivalent material, type Gammex 455, wherein a tumour-like cylindrical structure is embedded in the left lung. For this phantom, simple three-beam plans as well as a complex IMRT plan is generated in RayStation® TPS.
2.2 TPS RAYSTATION®: DETERMINATION OF THE PLANNED DOSE
Raystation® 6 (Raysearch Laboratories, Stockholm, Sweden) is the current treatment planning system of the Elektra Synergy® linac used at the UZ Ghent University Hospital. Once the CT-image datasets are loaded into the system, a state-of-the-art RT treatment plan is developed in consultation with the RT dose planners, who are experts in the field. Initially, the GVT (cylindrical tumour) and the PTV are delineated. After defining the dose constraints, the system optimizes the plan to find optimum agreement with respect to target coverage and normal tissue sparing. Based on the prescribed dose levels and the phantom geometry, the software also computes the expected dose distributing for the phantom, using the CC 3.4 photon dose calculation engine. The different treatment plans are summarized here below.
(1). Three-beam 3D-CRT plans on CarPet with specifications: 6 MV, gantry angles
0°-90°-180°, and 2X2 cm2, 5X5 cm2, 10X10 cm2, and 20X20 cm2 field sizes.
(2). IMRT plan on CarPet, identical to the IMRT plan designed for the thorax phantom.
(3). Three-beam 3D-CRT plans on the thorax phantom with specifications: 6 MV, gantry angles
0°-90°-180°, and 2X2 cm2, 5X5 cm2, 10X10 cm2, and 20X20 cm2 field sizes.
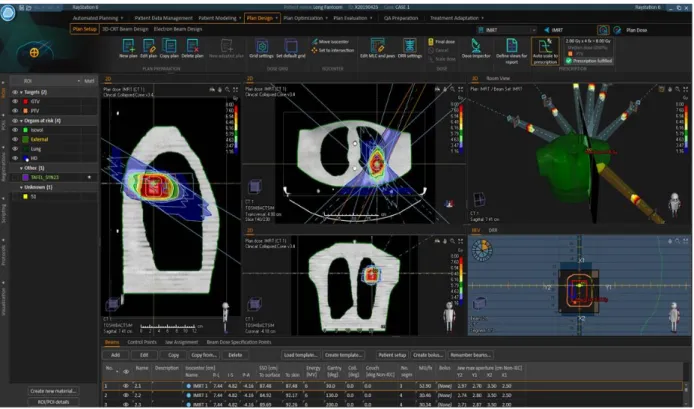
(4). A typical lung patient IMRT treatment plan, with the cylindrical structure that represents the tumour as target, located in thorax phantom’s left lung (Figure 9).
Figure 9. Overview of the plan design in RayStation® TPS of an IMRT dose plan for the thorax phantom.
Image source: personal collection.
2.3 FILM DOSIMETRY: EXPERIMENTAL DETERMINATION OF THE DOSE
The experiments are performed using Gafchromic® EBT-3 films with sheet dimensions 8”x10” (batch 03311402 and 05161905) for specific QA measurements. Delivery of the designed treatment plans from RayStation® is performed with an Electra Synergy® 2 linac (Elektra, Crawley, UK) using a beam quality of 6 MV. The exposed films are digitized using an Epson Expression 10000XL flatbed scanner (Seiko Epson Corp., Suwa, Japan). Further analysis is performed with software package FilmQA Pro, which enables to use the signal from all three-color channels (red, green, blue). The results are examined in terms of “gamma passing rates red” using a 3% dose difference (DD) criterion and 3mm distance-to-agreement (DTA) criterion on the red channel of the optical transmission signal. The films should be continuously handled with great care. Therefore, gloves are always used, the area where the evaluation will be performed is generally not touched and the films are stored at room temperature in a dark envelope to minimize the exposure to room lightning.
2.3.1 EBT-3 GAFCHROMIC® FILM MODEL
Throughout this study EBT-3 Gafchromic® films will be used as particular film model to capture the absorbed dose by the phantoms. The film contains a 28 µm active layer, consisting of monomers lithium pentacosa-10,12-diyonate (LiPCDA) in crystal form, sandwiched between two outer protective polyester layers. The single active layer incorporates a yellow dye that enables multi-channel dosimetry. While the chemical composition and the thickness of the active layer remains unchanged with respect to its predecessor (EBT2), the EBT3 film structure is symmetric. This feature eliminates the concern to which film side must face the scanner glass. Additionally, the manufacturer embedded microscopic silica particles within the protective layer to prevent the formation of Newton rings. The EBT3 films recommended dose
2.3.2 FILM CALIBRATION
The radiochromic film dosimetry and calibration procedure will be implemented according to the protocol “Efficient Protocols for Accurate Radiochromic Film Calibrationand Dosimetry”, which provides a detailed description of all instructions needed to define a reliable calibration
curve for a specific lot of radiochromic films19.
Eight rectangular pieces of film with dimensions 3 cmx 12 cm where cut out of a single sheet using a guillotine cutter. The films are pre-cut one day prior to irradiation, to allow for disorders around the edges to mechanically relax. In order to keep track of the film’s orientation, all pieces are permanently marked at one corner. The film pieces are exposed to increasing dose levels (i.e. 0 MU, 0 MU, 104
MU, 174 MU, 174 MU, 294 MU, 501 MU, 501 MU) using the linear accelerator under reference conditions (field size
10 x 10 cm2, SSD= 90 cm).
The calibration film strip is located on the phantom, at the centre of the exposure field and perpendicular to the beam axis. Ten polystyrene plates of 1 cm thickness are used as build-up material.
Figure 10. Measurement set up
for radiochromic film calibration
under reference conditions (10x10 cm2 field size, SSD=90 cm, we assume at the isocenter 1 MU=1
cGy). 1. EBT3 calibration film strip at the centre of the field, 2. Ten polystyrene plates which serve as build-up material, 3. Phantom to provide adequate backscatter. Image source: personal collection.
2.3.3 FILM IRRADIATION
Film irradiation is performed with an Elektra Synergy® 2 linear accelerator equipped with an iMLC 80-leaf multileaf collimator. Different irradiation setups for both phantoms are investigated and are described here below. For all cases, delivery of the treatment is done through 6 MV photon beams exclusively, at a source-skin distance (SSD) of 90 cm. The application films are located 1cm offset (caudal) from the isocenter in a transverse section between the polystyrene slabs.
For both phantoms:
1. Delivery of the three-beam 10X10 3D-CRT treatment plan, normalized to the median
dose to the PTV = 2 Gy1.
2. Delivery of four times the former plan, in order that the dose to the PTV = 8 Gy. For Thorax:
3. Delivery of the IMRT treatment plan, so that the median dose to the PTV = 2 Gy2.
The rationale behind this delivery of four times the treatment plan (2) is that even though at the target volume the films will be over-exposed, we want to examine the dose measured in the low dose area. Accordingly, the exposure to OAR can be evaluated. This method thus ensures sufficient dose is absorbed in less sensitive part of the film. For reasons of verification, each measurement is conducted two times. However, it should be noticed that the accuracy of treatment delivery to the low dose area is not the main focus of this study. For a more detailed description, I refer to the work “Accuracy study of a commercial radiotherapy dose planning system with respect to the dose distribution in and around lung tumours”, of Kim Cannoot. Regarding post-irradiation polymerization, we use a time period of 24h±2h between film irradiation and the consecutive film scanning.
2.3.4 IMAGE AQUISITION
The EBT3 Gafchromic® films are scanned using an Epson Expression 10000XL flatbed scanner as optical densometer equipped with a transparency unit. This commercially available flatbed scanner contains a xenon gas cold cathode fluorescent lamp as line-shaped light source. The light recording unit of this flatbed scanner consists out of a series of mirrors and
a lens that guides the transmitted light from the film to the CCD detector array24. After
positioning the film pieces on the scanner bed, a glass compression plate is used to ensure that the film is flat on the scanner window. Especially for large film pieces, as used during this
study, this step is necessary. Paelinck L et al.25 recommends to take five successive preview
scans, prior to each scanning session, in order to stabilize the color temperature of the light source of the scanner and, therefore improving the signal-to-noise ratio. The scanning procedure is conducted in transmission mode using a 150dpi resolution. Film images are acquired in 48 bit red-green-blue (RGB) mode (16 bits per color channel). Data is saved in tagged image format (tif).
2.3.5 ANALYSIS SOFTWARE: FILMQA PRO
Further film assessment is performed with the FilmQA Pro software package that allows quantitative “multi-channel evaluation”, or “triple channel evaluation”. This evaluation method provides the capability to compare dose values from three color channels (RGB), establishing the consistency of these dose measurement results. In EBT 3 films, each of the three-color channels have independent dose response curves. Because we are considering dose ranges between 0 Gy – 2 Gy however, only the red channel was selected for further evaluation considering its superior sensitivity in the low dose range (the polymers have the highest absorption in the red part of the optical spectrum, centered at the wavelength of 633nm). In this range, an equal increment in dose will provide the greatest difference in optical density compared to the blue and/or green channel.
Establishing a calibration curve is essential to convert the measured signal from an application film piece to get the unknown dose. The areas of interest are marked at the centre of each calibration strip. Subsequently, the dose values are entered into the calibration table and the “calibration tool” can then be used to automatically display both the fitted function and calibration data.
FilmQA Pro offers a multitude of analysis tools to examine the film images. First, the correct calibration curve is loaded into the software in order that the images can be converted into
dose maps. For this work, absolute dose measurements are compared to DosimetryCheckTM
calculations, which uses the PB or CC algorithm. This is accomplished by adopting the “dose-to-plan comparison” panel, for which first the appropriate slice from DC needs to be imported as a DICOM file into the software. The “isomap” tab is selected in order to find the dose map position that fits best with the imported treatment plan. Our results are reported in terms of “gamma passing rates red” with 3% DD/3mm DTA criterion. The film measured dose is typically
used as a reference. The optimization tool can be used to find optimal agreement between treatment plan and dose measurement in order to maximize the passing rates. The ROI at which the gamma analysis is performed is manually confined to an area encompassing the apparent exposure-induced coloration zone but positioned from the film edges. By usage of the “film evaluation” panel, path profiles are drawn to display the dose measured by the film through the PTV region and in the lower dose areas. FilmQA Pro can generate clear reports in which the final results are demonstrated.
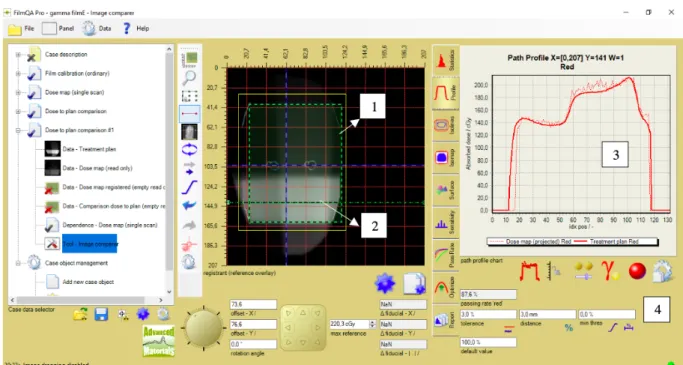
Figure 11. Illustration of a dose-to-plan comparison in FilmQA Pro for the 10X10 3D-CRT plan delivered
to the thorax phantom. 1. ROI, 2. Horizontal profile traversing the high dose region, 3. Comparison of the reconstructed dose from DC (thick line) vs. the dose measured by the film (thin line), along the dawn horizontal profile, 4. Passing rates and DD/DTA criteria. Image source: personal collection.
2.4 EPID DOSIMETRY: DETERMINATION OF THE RECONSTRUCTED DOSE
DC software is used along with linear accelerator equipped with an EPID iViewGT (Elektra,
Crawley, United Kingdom) portal imager. The DC evaluation is based on PB and CC algorithms. The treatment planning system was RayStation® 6 containing CC 3.4 algorithm. All three-beam 3D-CRT treatment plans as well as the complex IMRT plan are generated over the homogeneous pelvic phantom and heterogenous thorax phantom.
2.4.1 THE EPID PANEL
During these experiments, an Elekta iViewGT amorphous silicon portal imager will be used to capture the transit dose (or exit dose) through the patient. This modern a-Si EPID is based on thin film semiconductor technology. The panel consists of different elements:
1) A 1 mm metal layer, made of copper, which serves as build-up material and absorbs scattered photons from the patient. This sheet helps to improve the detector efficiency. 2) An x-ray converter, which creates optical photons that can be detected by the photodiodes. Here a scintillating phosphor screen, made of gadolinium oxysulfide
doped with terbium (Gd2O2S: Tb), with a thickness of 0.54 mm is used.
4) An electronic acquisition system for amplifying the received signal, and further processing of the resulting digital image.
The Elekta iViewGT EPID panel has an active field 41x 41 cm2, corresponding with a resolution
of 1024x 1024 pixels (detectors). The flat panel imaging device is mounted on a robotic arm
which allows it to be positioned at a fixed source-detector-distance (SDD) of 160 cm22.
Figure 12. Experimental setup for transit dosimetry measurements. 1. a-Si flat panel detector of the
XVI, 2. kV x-ray source of the XVI, 3. iViewGT EPID panel, 4. Homogeneous CarPet phantom with film. Image source: personal collection.
2.4.2 DOSE DISTRIBUTION COMPARISON
During this part of the study, EPID images are collected for in-vivo dosimetry (transit mode) and pre-verification (pre-verification mode) with the primary intent to assess all clinically relevant differences between the planned, the 2D measured, and the reconstructed dose. For transit-dosimetry purposes, the polystyrene phantoms are placed on the treatment couch (iBeam Evo treatment couch, Elektra), between the source and the EPID panel, while for pre-verification no phantom was used. The EPID images are then converted to fluence maps, which are projected in silico on the phantom to perform dose reconstruction while adopting the PB or CC algorithm.
Every time a measurement session was started, a reference calibration image was taken. This image, a 10 cmx 10 cm open field, in pre verification mode, has a known dose, 1 cGy per delivered monitor unit at the reference depth, 10 cm, and reference SSD, 90cm, in water. Before calculating dose in DC, the calibration image of that day is loaded and its centre pixel grey value is taken as the reference value for 1 RMU. The calibration procedure is necessary to remove daily fluctuations in accelerator output, and deterioration of the imager, both effects we want to eliminate in the course of this work.
The evaluations of DC’s results and their comparisons to the Raystation® TPS computations were based on gamma evaluations with acceptance criteria set to 3% dose difference, relative to a fixed value of 200 cGy, and 3 mm DTA with 10% low-dose threshold, meaning that dose points with dose lower than 20 cGy are not taken into account.
Gamma evaluation associates a gamma-index with each measurement point. A gamma-index of 0 means that the measurement point matches the reference dose exactly. A gamma-index
of 1 means that the dose is within 3% of the expected value or matches a dose point in the reference at a distance of 3 mm or fits any combination on the sphere defined by the two criteria. A particular point will pass the gamma evaluation if its gamma-index value is lower or equal to 1 (! ≤ 1). In contrast, gamma-index values greater than 1 fail the gamma evaluation (! > 1), indicating that both DD and DTA criteria are exceeded. When 95% of all points in a particular volume exceeds the gamma criteria, the 3D-gamma evaluation is rated positive. This acceptance level is established in several studies as well as in clinical routine.
The main focus is to evaluate the agreement reconstructed vs. planned dose at the isocentre, the PVT, GVT and lung structure. Furthermore, the dose files from the TPS and DC were assessed with an additional comparison tool for dose distributions, called VeriSoft (PTW, Freiburg, Germany) (Figure 13).
Figure 13. Overview of the TPS planned (1) and DC reconstructed (2) dose distributions for a 10X10
three-beam 3D-CRT plan in CarPet (grayscale and isodoses). The profiles (3) and gamma map between TPS and DC PB show good agreement. Image source: personal collection
1
2
3
3. RESULTS
3.1 INTRODUCTION OF A CORRECTION FACTOR
The initial deviation found between the planned dose by Raystation® TPS and the
reconstructed dose by DosimetryCheckTM, adopting the collapsed cone algorithm equals 4.2%
at the isocentre. This value was experimentally determined by a previous master student, using an opponent beam IMRT treatment plan (gantry angles 90°, 270°), delivered to the CarPet
phantom, from which I follow his recommendations27. As a result, a correction factor for transit
measurements was introduced to compensate for this systematic error, which equals 0.96 (1 / 1.042). In DC, the reconstructed doses calculated with PB and CC were adjusted with this correction factor by setting the “number of fractions/normalization factor” to 0.96, accounting for this difference of 4.2%. For pre-treatment verification measurements no correction factor was needed (CF=1).
3.2 FLUENCE MAPS OF THE TRANSIT MEASUREMENTS
Dose reconstruction within the patient starts from calculating the fluence. DC has no source model, which is in contrast to the planning system. This means the fluence is calculated from the EPID image by deconvolution of that image and correction of the attenuation. The transit (or “exit”) fluence maps in CarPet for different field sizes are given in Figure14.
Figure14. Transit fluence maps CarPet, using different field sizes (0°,90°,180°). Top left: 10X10
3D-CRT; top right: 20X20 3D-3D-CRT; below left: 2X2 3D-3D-CRT; below right: IMRT, same beams as for the Thorax phantom.
Transit fluence images under highly controlled reference conditions (simple 3 beam 3D CRT plan, 10X10 field size, homogeneous CarPet phantom) are shown as expected; plain uniform
surfaces. Also, for small irradiation fields (2X2 cm2 and 5X5 cm2) the fluence maps are
according to our expectations. The plain white surfaces indicate that DC was able to remove
the influence of the CarPet phantom. When increasing the field size (20X20 cm2), the fluence
maps show white edges instead of an even surface. This can be the result of the fact that the dimensions of the CarPet phantom (approximately 37 cm x 20 cm x 16 cm) are slightly smaller than the dimensions of the fluence map, and therefore air is measured at the edges. DC might have difficulties to compensate for this huge difference in intensity. For the IMRT fluence maps, the images are slightly more blurred compared to the square fields, which can be attributed to difficulties in compensating for the scatter (deconvolution step). The transit images for the thorax phantom are given in Figure15. In parallel with the results obtained in CarPet, the fluence maps of a 10X10 field, a simple 3 beam plan show uniform white surfaces. However, for the transit image taken laterally (90°), small artefacts are incorporated in the fluence as the curved edge of the phantom can be slightly noticed. When looking carefully, the slabs of the phantom can also be noted, as well as the tumour volume and a part of the lung. These delineations become even more pronounced when examining the fluence maps for an open
field (20X20 cm2). Here, the lateral image shows again highest deviations because the path
length which needs to be traversed within the phantom is greater than images taken ventrally/dorsally. Additionally, the couch model does not fully mimic the real situation. Finally, small setup deviations in the phantom setup will also affect the results as the attenuation correction is done with the initial CT.
Figure15. Transit fluence maps thorax phantom. Top left: 10X10 3D-CRT (0°,90°,180°); top right: 20X20
3D-CRT (0°,90°,180°). Corresponding radiographs (EPID images) ventrally (below left) and laterally (below right). The isocentre is indicated by a yellow cross, approximately at 1/3th from the upper part of the tumour volume. Clear contours of the phantom external, the lung, tumour volume and phantom slabs can be seen. Systematically, a correction factor of 0.96 was used for the transit fluence images.
The results from the thorax phantom indicate that DC has some difficulties when meeting sharp heterogeneous boundaries, in part due to the sensitivity to phantom setup, and has some trouble removing the scatter components from the phantom under such circumstances. 3.3 RELIABILITY OF THE DOSE RECONSTRUCTION MEASUREMENTS.
An estimation of the reliability of the dose reconstruction by DC is evaluated by using repeated measurements using a 3D-CRT plan, 10X10 reference fields in the homogeneous CarPet phantom. The results are shown in Table1.
Table1. Repeated measurements in CarPet, 6MV beam, 3D-CRT plan with 10X10 field sizes. The
reference dose (planned dose) equals 200.3cGy. Negative values indicate a general overestimation of the reconstructed dose by DC compared to the planned dose.
Measurement Iso difference % ((!",$%&,"")('$(
('$( ) 1 -0.11 2 -0.51 3 -0.65 4 -0.55 5 -0.42 Average -0.45 1 SD 0.21
Measurements 1-3 were taken in the course of a single measurement session, about 2 hours apart. Measurement 4 was taken the next day. Measurement 5 is a reference measurement from a month earlier. All measurements were normalized to a calibration image taken on the same day as the measurement file.
The average iso difference (%) equals -0.45, meaning DC overestimates the dose on average 0.45% in comparison to the planned dose in Raystation®. A standard deviation (SD) of 0.21 is determined, therefore 0.42 (2SD) will be taken into consideration as an error margin throughout the following dose reconstructions.
3.4 COMPARISON BETWEEN PRE- AND TRANSIT MEASUREMENTS
The homogeneous CarPet phantom and the inhomogeneous thorax were subjected to different treatment plans using a 6 MV photon beam: 2X2 3D-CRT, 5X5 3D-CRT, 10X10 3D-CRT, 20X20 3D-CRT and an IMRT plan. For the 3D-CRT plans, gantry angles of 0°, 90° and 180° were used. The aim was to deliver a dose of 2 Gy at the PTV, as calculated by Raystation® TPS.
Dose reconstruction was conducted twice using DosimetryCheckTM, one with the PB, and
once with the CC algorithm. These measurements are denoted as exit (transit) measurements. In addition, all the experiments and dose calculations mentioned above were conducted a second time, without a phantom between the source and the detector. These are called the pre-verification measurements.