DECARBONISATION OPTIONS
FOR THE DUTCH BIOFUELS
INDUSTRY
Mehul Khandelwal, Ton van Dril
07 April 2020
Decarbonisation options for the Dutch biofuels industry
© PBL Netherlands Environmental Assessment Agency; © TNO The Hague, 2020
PBL publication number: 3887
TNO project nr. 060.33956 / TNO 2020 P10347
Author(s)
M. Khandelwal and A.W.N. van Dril
Acknowledgements
We would like to thank Rob Vierhout (Alco Energy Rotterdam), Rob Groeliker (Biopetrol Rotterdam BV), Petra Gerritsma (Neste Netherlands B.V.), Ayla Uslu (TNO), Wouter Wetzels (TNO) and Martin Junginger (Utrecht University) for their help and valuable input.
MIDDEN project coordination and responsibility
The MIDDEN project (Manufacturing Industry Decarbonisation Data Exchange Network) was initiated and is also coordinated and funded by PBL and ECN part of TNO (named TNO Energy Transition after 1 January 2020). The project aims to support industry, policymakers, analysts, and the energy sector in their common efforts to achieve deep decarbonisation. Correspondence regarding the project may be addressed to:
D. van Dam (PBL), Dick.vanDam@pbl.nl, K.M. Schure (PBL), Klara.Schure@pbl.nl, or A.W.N. van Dril (TNO), Ton.vanDril@tno.nl.
Production coordination:
This publication is a joint publication by PBL and TNO Energy Transition and can be
downloaded from: www.pbl.nl/en. Parts of this publication may be reproduced, providing the source is stated, in the form: M. Khandelwal and A.W.N. van Dril (2020), Decarbonisation options for the Dutch biofuels industry. PBL Netherlands Environmental Assessment Agency & TNO Energy Transition, The Hague.
PBL Netherlands Environmental Assessment Agency is the national institute for strategic policy analysis in the fields of the environment, nature and spatial planning. We contribute to improving the quality of political and administrative decision-making by conducting outlook studies, analyses and evaluations in which an integrated approach is considered paramount. Policy relevance is the prime concern in all of our studies. We conduct solicited and
unsolicited research that is both independent and scientifically sound.
TNO Energy Transition has a twofold mission: to accelerate the energy transition and to strengthen the competitive position of the Netherlands. TNO conducts independent and internationally leading research and we stand for an agenda-setting, initiating and supporting role for government, industry and NGOs.
This report has been reviewed by Alco Energy Rotterdam B.V., BioPetrol Rotterdam B.V., BioMethanol Chemie Nederland B.V. and Neste Netherlands B.V. PBL and TNO Energy Transition remain responsible for the content. The decarbonisation options and parameters are explicitly not verified by the companies.
Abbreviations
ALK Alkaline Electrolysis ATR Autothermal reforming
BECCS Bio-Energy with Carbon Capture and Storage CAPEX Capital Expenditure
CBS Centraal Bureau voor de Statistiek CCUS Carbon capture utilization and storage CHP Combined Heat and Power generation CMS Cryogenic Membrane Separation DDGS Dried Distillers’ Grain with Solubles ETBE Ethyl tert butyl ether
FAME Fatty acid methyl esters
HVO Hydrogen treated vegetable oil OPEX Operational Expenditure
ILUC Indirect land use change MDEA Methyldiethanolamine
MIDDEN Manufacturing Industry Decarbonisation Data Exchange Network
MJ Megajoule
Mtoe Million tonnes of oil equivalent MVR Mechanical vapor compression OEM Original equipment manufacturer PEM Proton Exchange Membrane
PJ Petajoule
PORTHOS Port of Rotterdam CO2 Transport Hub and Offshore Storage
POX Partial oxidation
RED Renewable Energy Directive SMR Steam methane reforming UCO Used cooking oil
Contents
Summary 5
INTRODUCTION
6
1
BIOFUEL PRODUCTION IN THE NETHERLANDS
7
1.1 Consumption and production of biofuels in the Netherlands 7
1.2 Production sites in the Netherlands 9
1.3 Overview of the main biofuel industries 14
2
BIOFUELS AND METHANOL PRODUCTION PROCESSES
15
2.1 Dry milling and fermentation process (Alco Energy Rotterdam B.V.) 15 2.2 Transesterification process (Biopetrol Rotterdam B.V.) 18
2.3 Steam Reforming (BioMCN B.V.) 20
2.4 NExBTL process (Neste Netherlands B.V.) 23
3
BIOFUEL PRODUCTS AND APPLICATIONS
28
3.1 Drivers for the Dutch biofuels industry 28
3.2 Types of biofuels 30
3.3 Fuel properties 32
3.4 Prices of biofuels 35
4
OPTIONS FOR DECARBONISATION
38
4.1 Heat generation 38
4.2 Carbon Capture, utilization or storage (CCUS) 42
4.3 Alternative feedstocks and processes 44
4.4 Summary of measures per company 44
5
DISCUSSION
52
REFERENCES
53
Appendix A Biofuel industries in the Netherlands 60
Appendix B Hydrogen production 61
FINDINGS
Summary
The biofuel production in the Netherlands amounted to 69 PJ in 2018. This report
investigates four major Dutch biofuel industries in Delfzijl and Rotterdam, which each have a production capacity of more than 350 kton. The industries which are included in the scope are:
• Alco Energy Rotterdam B.V.; • BioPetrol Rotterdam B.V.;
• BioMethanol Chemie Nederland B.V., and • Neste Netherlands B.V.
These industries produce various types of biofuels such as ethanol, biodiesel and
biomethanol, to be blended with fossil fuels for use in engines as promoted by the European policies. The current yearly greenhouse gas emissions of these industries vary from 36 kton to 353 kton CO2-eq. Most of the CO2 emissions are energy related, natural gas is used for
heat and electricity produced with either boiler or CHP.
The main opportunities for decarbonising the biofuel industries’ heat supply include
electrification (heat pumps, electric boilers) and substitution of natural gas with hydrogen or biogas. CCUS (Carbon Capture, Utilisation and Storage), mainly for concentrated biogenic CO2 is another important option. A full supply chain analysis of emissions and
decarbonisation options for biobased fuels is beyond the scope of this report.
Table 1. Overview of the main biofuel industries in the Netherlands
Characteristics Alco Energy BioPetrol BioMCN Neste Oil
Name Alco Energy
Rotterdam B.V. BioPetrol Rotterdam B.V. BioMethanol Chemie Nederland B.V. Neste Netherlands B.V. Fossil CO2 Emissions [kton CO2-eq] (2018) 340 36 217 8
Feedstock Maize Rapeseed oil and
sunflower oil
Natural gas and biogas
Animal fats and UCO
Product Bioethanol Biodiesel Biomethanol and
methanol
Biodiesel
Technology Dry milling and
fermentation
Transesterification Steam Methane Reforming
NExBTL
Production capacity (2017)
379 kton 400 kton 4501 kton 1 Mton
1 The production capacity of BioMCN has increased in 2019 with the starting of 2nd production line to 900
FULL RESULTS
Introduction
This report describes the current status of the Dutch biofuel production industry and
assesses the possible options to decarbonise them. This study is part of the MIDDEN project (Manufacturing Industry Decarbonisation Data Exchange Network). MIDDEN aims to support industry, policy makers, analysts and the energy sector in their common efforts to achieve deep decarbonisation. The MIDDEN project will update and elaborate further on options in the future, in close connection with the industry.
Scope
Production locations include:
• Alco Energy Rotterdam B.V.; • Biopetrol Rotterdam B.V.;
• BioMethanol Chemie Nederland B.V. (BioMCN); • Neste Netherlands B.V.
Processes include:
• Dry milling and fermentation; • Transesterification;
• The NExBTL process; • Steam Methane Reforming.
Products include: • Biomethanol;
• Fossil based methanol; • Bioethanol;
• Biodiesel.
The main decarbonisation options are: • Hydrogen;
• Biogas;
• Electric boilers; • Heat pumps;
• Ultra-deep geothermal energy, and
• Carbon Capture Utilisation and Storage (CCUS).
Reading guide
Chapter 1 gives a general introduction to the biofuel industry in the Netherlands. In Chapter 2 we describe the current status of biofuel production processes and in Chapter 3 we discuss the relevant products and applications. Options for decarbonisation are systematically quantified and evaluated in Chapter 4. The feasibility and requirements of those decarbonisation options are discussed in Chapter 5.
1 Biofuel production in
the Netherlands
This report discusses the production of liquid biofuels derived from biomass, which are used as an alternative to fossil fuels such as gasoline, diesel and aviation fuels (IEA, 2008). Biofuels are used for passenger cars, aviation, shipping, heavy vehicles and trains. The heavy-duty vehicles can use blends of biodiesel or ethanol (eg. B7, E10). Flex fuel car engines can use 100% blend of ethanol or biodiesel, or sometimes biogas or biomethane depending on the engine (Faaij et al., 2017). Biofuels vary in their potential to reduce greenhouse gas emissions when replacing fossil fuels. The greenhouse gas emission reductions depend on the feedstock (crop) used, and the effect of expanding cultivation of the crops on land use (Kazamia & Smith, 2014).
This chapter provides information on the consumption and production of biofuels in the Netherlands and the main biofuels production sites.
1.1 Consumption and production of biofuels in the
Netherlands
In Europe, the production of biofuels has significantly increased from 2 Mtoe (84 PJ) in 2005 to 14 Mtoe (586 PJ) in 2016 (ETIP, 2018). In 2017, The Netherlands was the third largest producer of biofuels in Europe after Germany and France (see Figure 1) with a production of 1.65 Mtoe (69 PJ) (F.O. LICHTS, 2018).
Figure 1. Biofuel production in selected countries in Europe in 2017 (in 1,000 metric tons oil equivalent) (F.O. LICHTS, 2018)
The large-scale production of biofuels in the Netherlands took off in 2009 (as seen in Table 2). Bioethanol is mainly produced from starch (wheat, tapioca) and biodiesel is mainly produced from used cooking oil (NEa 2016). The NEa provides details on the biofuels that are blended with fossil fuels. The main sources are animal fat, maize, sugar beet, sugar cane, wheat, wheat straw and used cooking oil (Nederlandse Emissieautoriteit, 2016). The largest share of the biofuels for the transport sector in 2016 came from biodiesel based on used cooking oil (61%) and animal fats (7%). The rest mainly came from ethanol produced from wheat, maize, sugarcane and sugar beets (Kwant et al., 2018).
Table 2. Production of biofuels in the Netherlands from 2006-2018 (CBS, 2019) 2006 2007 2008 2009 2010 2011 2012 2013 2014 2015 2016 2017 2018
Production
(kton) 81 200 531 1,323 1,306 2,247 2,406 2,517 2,605 2,620 2,179 2,476 2,524
The total renewable energy consumption in the Netherlands amounted to 158 PJ in 2018 (Centraal Bureau voor de Statistiek, 2019). The consumption of biofuels in the Netherlands was 23 PJ in 2018 as seen in Figure 2 (Centraal Bureau voor de Statistiek, 2019).
Figure 2. Energy consumption from biomass in the Netherlands (Centraal Bureau voor de Statistiek, 2019)
The use of biofuels for road transport in the Netherlands is expected to increase to more than 40 PJ in 2020 and to level off to 34 PJ in the long term, according to the National Energy Outlook 2017 (ECN at al., 2017). These projections exclude biofuels consumption in international aviation and marine transport, which is currently low, but may increase in future.
1.2 Production sites in the Netherlands
Figure 3 shows the locations of biorefineries in Europe in 2017 (Bio-based Industries Consortium, 2018). Out of the biorefineries within the Netherlands, the four which have a production capacity of more than 350 kton are discussed in this report. Annex A includes an overview list of biofuels production sites in the Netherlands.
Figure 4 gives an overview of the biofuel industries in the Netherlands within the scope of this project. These biorefineries are:
• Alco Energy Rotterdam B.V. located in Europoort; • BioPetrol Rotterdam B.V. located in the Botlek;
• BioMethanol Chemie Nederland B.V. (BioMCN) located in Delfzijl. • Neste Netherlands B.V. located in the Maasvlakte.
Figure 4. Overview of the biofuel companies in the scope of the project
Alco Energy Rotterdam
The bioethanol production facility of Alco Energy Rotterdam B.V. is located in Europoort in Rotterdam (see Figure 5) and was founded in 2010. Previously, the production site was owned by Abengoa Bioenergy Netherlands B.V. However, due to bankruptcy the production was shut down and then the facility was purchased by Alco group (GAVE, 2015).
The installation of Alco Energy can produce 480 million litres of bioethanol per year using the dry milling and fermentation process. The production facility uses maize as feedstock. There is also a CHP plant on-site. This production facility can produce 360 kton of DDGS (Dried Distilled Grain with Soluble) and 300 kton of biobased CO2 which can be distributed to nearby
greenhouses in the Westland (ALCO Group, 2019). According to the Dutch Emissions Authority (NEa), Alco Energy in Rotterdam emitted 340 kton CO2-eq in 2018 (NEa, 2019).
Figure 5. Alco Energy Rotterdam B.V. (Water talent, 2017)
Biopetrol Rotterdam
The biodiesel production facility of Biopetrol Rotterdam B.V. is located in the Botlek (see Figure 6) and was founded in 2006. It is owned by Glencore Agriculture, a trading company. The installation produces around 400 kton of biodiesel per year (GAVE, 2015). The
production facility uses mainly rapeseed and sunflower oil as feedstock. Biopetrol Rotterdam B.V. also produces 60 kton of glycerol which is used for pharmaceutical grade purposes (Biopetrol, Personal communication, 26 June 2019). A total of 69 employees worked at Biopetrol in 2016 (Port of Rotterdam, 2016). The total investment made at the plant is around 100 million euros (GAVE, 2015). According to the Dutch Emissions Authority (NEa), the site emitted 36 kton CO2-eq in 2018 (NEa, 2019).
BioMethanol Chemie Nederland
BioMCN B.V. is located in Delfzijl (see Figure 7). Formerly the site was known as Methanor, a joint venture founded in 1976 by Akzo and DSM to produce methanol from natural gas from the Groningen gas field (Mulder, 2017). Methanor had two production lines with a total nameplate capacity of almost 800 kton (Mulder, 2017). Due to increasing gas prices and international competition, the fossil-based production was closed down in 2006 (Mulder, 2017; Reinshagen, 2011).
Shortly after 2006, BioMCN started production in one production line based on residual glycerol flows from biodiesel production in 2006. Its ambition was to become the largest site in the world to process various biobased flows via synthesis gas to biomethanol. A plan from 2010 to build a EUR 500 mln plant for converting residual wood into methanol did not
materialise and was finally cancelled in 2017 (Mulder, 2017). OCI took over the plant in 2016 (Mulder, 2017; RTV Noord, 2015), and plans to restart methanol production in 2019 to the full capacity of almost 1 Mton even if it is fossil-based methanol (Bilfinger, 2018). Several plans for biobased production are developed.
According to the Dutch Emissions authority (NEa), the methanol factory of BioMCN emitted 217 kton of CO2-eq. in 2018 (NEa, 2019). Figure 8 gives an overview of the history of
emissions of BioMCN B.V.
Figure 8 History of emissions of BioMCN B.V. (NEa, 2019)
Neste Netherlands
Neste Netherlands B.V. is located on the Maasvlakte (see Figure 9) and was founded in 2011 with an initial investment of EUR 670 mln (Neste, 2012). Neste produces diesel using the NExBTL hydrotreated vegetable oil (HVO) production process. In addition to diesel, smaller amounts of renewable gasoline, propane and isoalkane are produced (Neste, 2016). The production capacity of the plant in the Port of Rotterdam is 1 million2 tons per year (Neste,
2012). Feedstock used for the production of the diesel includes waste fats, residues, and vegetable oils (Neste, 2016). The site is not participating in the European Union Emissions Trading Scheme (ETS).
Neste invested EUR 60 mln in 2015 to build a plant to produce and store bio-LPG (bio propane) in Rotterdam. The initial capacity of the biopropane plant is 30-40 kton per year (Hydrocarbons Technology, 2015). Neste and Ikea has partnered up to produce renewable biobased polypropylene plastic with 20% renewable content in a pilot at commercial scale in 2018 (NESTE, 2018). Neste is also looking to construct a kerosene plant for the aviation sector with an investment of EUR 100 million (WFM editor, 2019).
Figure 9. Neste Netherlands B.V. (Neste, 2012)
2 The maximum production value of Neste NExBTL process is 1.2 Mton/yr biodiesel (van Staalduinen, 2007).
In this report, figures are based on the intended production of 1 Mton biodiesel per year.
0 100 200 300 400 500 600 2005 2006 2007 2013 2014 2015 2016 2017 2018 Kt on CO 2 eq . Year
1.3 Overview of the main biofuel industries
Table 3 provides an overview of the biofuel industries in the scope of this study in the Netherlands. An overview of other industries can be found in Appendix A.
Table 3. General characteristics of the biofuel industries
Characteristics Alco Energy BioPetrol BioMCN Neste oil
Name Alco Energy
Rotterdam B.V. BioPetrol Rotterdam B.V. Biomethanol Chemie Nederland B.V. Neste Netherlands B.V.
Corporate group ALCO GLENCORE OCI NESTE
Address Merwedeweg
10
Welplaatweg 108 Oosterhorn 10 Antarctica-weg 185
Postal code 3198 LH 3197 KS 9936 HD 3199 KA
Locality Europoort,
Rotterdam
Botlek, Rotterdam Delfzijl Maasvlakte, Rotterdam Employees (Port of Rotterdam, 2016) 80 (currently 110) 69 70 110 Fossil CO2 emissions [kton CO2-eq] (2018) (NEa, 2019) 340 36 217 8 Biobased CO2 emissions [kton CO2 eq.] (2017) 300 42
Feedstock Maize Rapeseed oil and
sunflower oil
Natural gas and biogas
Animal fats and UCO
Product Bioethanol Biodiesel Biomethanol and
methanol
Biodiesel
Technology Dry milling and
fermentation
Transesterification Steam methane reforming
NExBTL
Production capacity 379 kton (2016)
380 kton 450 kton3 1 Mton
3 The current production capacity of BioMCN has increased to 900 kton with the start of 2nd production line in
2 Biofuels and methanol
production processes
This chapter describes and quantifies existing biofuels production processes. An overview of energy and materials flows per process is given in separate sections on the four companies.
2.1 Dry milling and fermentation process (Alco Energy
Rotterdam B.V.)
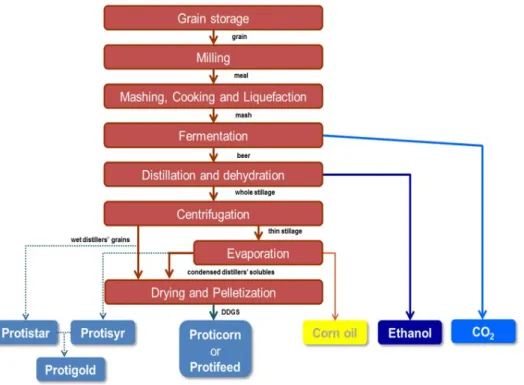
In this section the bioethanol production process based on dry milling and fermentation will be discussed which is currently used by Alco Rotterdam B.V. Figure 10 provides a schematic overview of the production process. The Alco Energy Rotterdam production process uses maize as raw material. The starch in the grains is used to produce ethanol. The protein rich parts of the grain are used as a nutritious component for animal feed (dried distillers’ grains with solubles (DDGS)) (Alco Energy 2019). The biogenic CO2 produced in this process is used
for greenhouses in the Westland area. The CO2 is transferred by Linde/OCAP with a capacity
of 42 ton/hr. The plant has a permitted capacity to produce 480 million litres (379 kton; 10 PJ) of bioethanol, 360 kton of DDGS and 300 kton of biogenic CO2. The estimated maize
input to produce these quantities amount to 1137 kton. The plant has a CHP with a capacity of 48 MW for the supply of heat and electricity (ALCO Group, 2019). With efficiency
measures, Alco can still increase the material throughput capacity with more than 25% in the current configuration.
The process can be divided into six steps: Cleaning and milling;
Cooking and liquefaction;
Saccharification and fermentation; Distillation;
Evaporation; Drying.
Figure 10. Schematic presentation of the production process of Alco Energy Rotterdam B.V. (ALCO ENERGY, 2019)
Cleaning and milling
The first step for the bioethanol production is feedstock preparation. The maize needs to be cleaned and ground into a coarse powder in a hammer mill or roller mill and then it is fed into a mashing system to be mixed with water (Schwietzke et al., 2009). There are six hammer mills in parallel, with destoner and magnetic separator incorporated in mill (ALCO ENERGY, 2019).
Cooking and liquefaction
In the next process step, the mash (mixture of meal and recuperated water at 55-60 °C) goes through a cooker where steam (>120 °C) breaks the starch granules and sterilizes the mash (ALCO ENERGY, 2019). Subsequently, an alpha amylase enzyme is added to the liquified mash further breaking down the starch into dextrin. Then the mix is cooled down from 85 °C to 35 °C (Schwietzke et al., 2009).
Saccharification and fermentation
In this process step, the cooled mash is pumped into a fermenter where simultaneous saccharification and fermentation is taking place. In addition to this, a second enzyme, gluco-amylase, and yeast is added to the mash (Schwietzke et al., 2009). The fermentation process is a sensitive batch process, which lasts around 50-60 hours at a temperature of 30 to 32 °C to produce ‘beer’ (16-18% alcohol by volume) (ALCO ENERGY, 2019). The chemical reaction involved in the process is described below (Clifford, 2018).
(Enzymes) (Enzymes)
(C
6H
10O
5)
x→ C
6H
12O
6→ 2CH
3CH
2OH + 2CO
2Distillation
The subsequent ethanol separation process occurs in a distillation column to purify the alcohol stream. The ascending vapour and descending beer liquid are in contact using disks and donuts in the distillation column (ALCO ENERGY, 2019). The alcohol vapour remains in the top of the column, while the liquid stripped of alcohol is removed at the bottom of the column. During distillation, impurities such as esters, aldehydes, higher alcohols or fusel oils are removed to produce a raw alcohol of 95 or 96% strength by volume (Clifford, 2018; Schwietzke et al., 2009).
The top flow is further dehydrated through molecular sieves, where the remaining water is removed to produce ethanol containing less than 0.3% water (95% v/v ethanol →99.8% v/v ethanol) (ALCO ENERGY, 2019).
Centrifugation and evaporation
The bottom flow (beer stripped of alcohol) is further processed involving a centrifugation step, separating the fibre fraction (wet distillers’ grains) from the clarified liquid (thin stillage) which evaporates the thin stillage to a syrup (condensed distillers solubles).
Drying
The wet distillers’ grains and condensed distillers solubles are then mixed and dried to form Dried distillers’ grains with solubles (DDGS) (ALCO ENERGY, 2019; Clifford, 2018). The process includes decanting, evaporation and drying as seen in Figure 11. Decanting is done by using eight Alfa-Laval SG2 decanters which separate 12% (solid) whole stillage into thin stillage (8% suspended solids) as well as wet cake (35% solids) (ALCO Group, 2019). A HPD (Veolia) 4 effect evaporator is used to concentrate the thin stillage (8% dm) into syrup (45% dm) using waste energy (ALCO Group, 2019). Drying is done through three swiss combi dryers with a capacity for evaporating 35 ton/hr and drying is done in absence of oxygen using an integrated thermal oxidizer (ALCO Group, 2019). Furthermore, the dried mixture is pelletized by four Stolz pellet processes (ALCO Group, 2019).
Figure 11. Process of Dry distillers grain with soluble (ALCO ENERGY, 2019) CHP plant
Alco operates a CHP plant with a capacity of 48 MW which uses natural gas to produce electricity and steam (110 ton/hr) for the above processes. The CHP plant uses a Siemens SGT-800 turbine (ALCO Group, 2019). Annually, approximately 225 GWh of electricity is sold to the grid and around 160 GWh is used for the production process. Table 4 gives an
Table 4. Energy input and output of the process at Alco Energy Rotterdam (ALCO ENERGY, 2019)
Energy Value Unit Pj Source CO2 Emissions (Fossil) 340 kton NEA
Natural Gas 190 MNm3 6.0 calculated, based on NEA
Input CHP 142 MNm3 4.5 estimated
Input boiler, drying, etc. 47 MNm3 1.5 estimated 25%
Generated process steam CHP 110 ton/hr 2.5 reported output Alco Generated electricity 392 GWh 1.5 assuming 93% load
Used electricity 166 GWh 0.6 assuming 93% load
Exported electricity 225 GWh 0.9 reported output Alco
2.2 Transesterification process (Biopetrol Rotterdam B.V.)
This section explains the transesterification process which is used by Biopetrol Rotterdam B.V. for the production of biodiesel.Figure 13 provides an overview of the production process of Biopetrol Rotterdam B.V. Currently, mostly rapeseed and sunflower oil, and minor shares of soybean oil are used as a feedstock for the production process. The production process uses sodium methylate as a catalyst. The methanol and water is used for the production of glycerol. The plant has a permitted capacity to produce approx. 380 kton (14.4 PJ) of biodiesel, 9500 kton of waste water and methanol mixture, and 36 kton of fossil CO2 emissions (Luna et al., 2013; NEa,
2019). The estimated oil input as feedstock for producing these quantities amount to 380 kton. The production process needs 6 kton of catalyst (Sodium methylate), 34 kton of Methanol and 9500 kton of water (Luna et al., 2013). The oil types are interchangeable and their use depends on supply and customer preferences. The outputs of this process are biodiesel and glycerol. The glycerol produced is used for pharmaceutical purposes (Georgogianni et al., 2009).
The Lurgi transesterification process is used for the production of biodiesel from vegetable oils. The transesterification process is used with a closed loop water wash to minimize the production of waste water (Air Liquide, 2017). The process also involves a gas boiler using natural gas producing 13 bar steam with 94% efficiency (Pim Bakker, personal
communication, 26th June, 2019). The estimated natural gas use is 20 mln NM3 for the steam
and drying purposes. More than half of the natural gas is used for generating steam and the rest is mainly used for drying purposes. The steam of 195 °C is mainly applied for separation of water from the product flow. The chemical reaction involved in the transesterification process used in at Biopetrol Rotterdam B.V. is shown in Figure 12 (Van Gerpen et al., 2004).
Figure 12. Chemical reaction of the transesterification process (Van Gerpen et al., 2004)
The Lurgi transesterification process involves thorough mixing of methanol with oil in the presence of sodium methylate (alkali catalyst), separating lighter methyl ester from heavier glycerol due to gravity (Air Liquide, 2017; Luna et al., 2013). This is a continuous process that requires a temperature of around 60 °C and atmospheric pressure (Air Liquide, 2017). Crude glycerine of more than 80% purity is produced as co-product. The process only uses sodium hydroxide or hydrogen chloride that is in the glycerine, which can be removed easily through distillation (Air Liquide, 2017).
The production process is explained in following steps: Reactor 1
Reactor 2
Water wash and transesterification.
The production process involves mixing of oil, methanol and sodium methylate catalyst in Reactor 1. There it is separated into two phases: a lighter methyl ester/oil phase and a heavier phase consisting mainly of glycerine and water.
The lighter methyl ester/oil is blended with additional methanol and catalyst in Reactor 2. There, gravity separation is used to maximize the biodiesel quality and yield (Luna et al., 2013). This mixture is further washed with water to remove glycerol, impurities or methanol dissolved in the ester phase.
The heavier phase consists mainly of glycerine and water (Air Liquide, 2017; Luna et al., 2013). The Lurgi process recycles the glycerol phase from Reactor 2 with an excess of methanol and catalyst to Reactor 1. The glycerol phase containing excess methanol is distilled in the methanol recovery column which uses water from the wash water column after leaving Reactor 1 to recover the methanol. The methanol is sent back to Reactor 1, thus all of the methanol is consumed in the production of methyl ester (Luna et al., 2013). In addition to this, the heavier fraction of the methanol recovery column is processed in the glycerine water evaporation column to retrieve the crude glycerine (60-65%) as a by-product that can be further upgraded to pharmaceutical glycerine (99.8%) by distillation, bleaching and vacuum drying (Air Liquide, 2017).
Figure 13. Schematic presentation of the transesterification process of Biopetrol Rotterdam B.V. (Luna et al., 2013)
Table 5 gives an overview of the input and output of Biopetrol Rotterdam B.V., which produces 385 kton/yr biodiesel from rapeseed oil and sunflower oil.
Table 5. Input and output for the transesterification process
Value Unit Energy
[PJ] Sources
Input Raw material
(rapeseed oil) 385 kton Calculated based on Luna et al., 2013 Electricity 12 GWh 0.04 Personal communic ation Natural gas (total) 20 mln Nm 3 0.65 Calculated , based on NEa
Output Biodiesel 380 kton 14.1 Calculated
based on Luna et al., 2013
Crude glycerol 36 kton Calculated
based on Luna et al., 2013 CO2 emissions
(fossil) 36 kton NEa, 2019
2.3 Steam Reforming (BioMCN B.V.)
This section provides an overview of the steam methane reforming process for the
production of methanol currently used by BioMCN. BioMCN has two lines of production which have a capacity of 450 kton/year per line. The lines have emission factors of 0.77 ton of CO2/ton of methanol (line 1) and 0.73 ton of CO2/ton of methanol (line 2), respectively.
On-site there is also an expander turbine which can use grey hydrogen from both lines to produce electricity. Both lines can use liquified CO2.
The chemical reaction involved in the steam reforming process is shown below (Arthur, 2010). The first two reaction refer to syngas production, the last two reactions refer to methanol synthesis.
CH4 + H2O → CO + 3H2
CO + H2O → CO2 + H2
CO + 2H2 ↔ CH3OH
CO2 + 3 H2 ↔ CH3OH + H2O
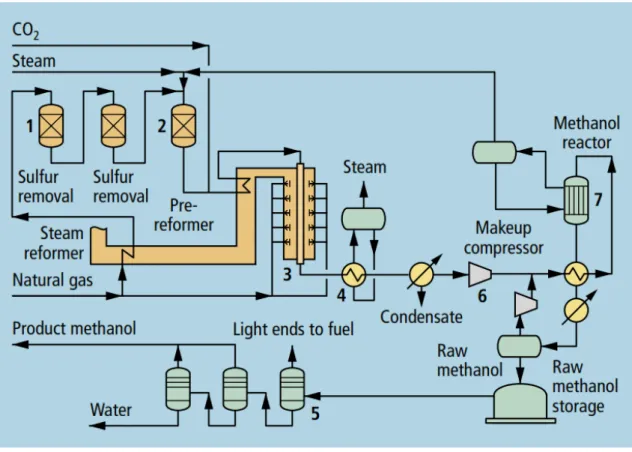
Figure 14 provides a schematic overview of the process of methanol production using steam reforming where natural gas is the feedstock (Aasberg-Petersen et al., 2008; Compagne, 2017; Haverford et al., 2010).
The production process can be sub-divided into three parts: Steam Reforming
Conversion to methanol Distillation.
Figure 14. Schematic overview of the steam reforming process (Aasberg-Petersen et al., 2008)
Steam reforming
The steam reforming takes place at 850-860 °C. In this process, steam and methane are converted catalytically and endothermically to hydrogen and carbon dioxide (Arthur, 2010).
First, desulphurization of the natural gas occurs if necessary. The desulphurized natural gas is mixed with steam (optionally CO2) and preheated to about 500 °C prior to entering the
reformer tubes (Arthur, 2010). For the endothermic reforming reaction, heat is supplied by the combustion of fuel in the reformer furnace and hot effluent gas exiting the reformer is used for the production of steam (Arthur, 2010). The synthesis gas is produced by tubular steam reforming. After that, the syngas is used in the conversion process to produce methanol and surplus hydrogen (Haverford et al., 2010). This hydrogen can be purged and used as reformer fuel. With adding liquid CO2, this hydrogen can also be used for additional
methanol production. Furthermore, the addition of liquid CO2 optimises the synthesis gas
composition for methanol production (Aasberg-Petersen et al., 2008; Haverford et al., 2010; Lücking, 2017). The addition of liquid CO2 in reforming results in a reduction in the energy
consumption of 5–10% compared to a conventional plant (Aasberg-Petersen et al., 2008; Haverford et al., 2010). The energy use for the process per metric ton of methanol is 32 GJ without CO2 addition and 29.5 GJ with CO2 addition (Haverford et al., 2010). Table 6 gives
an overview of the input and output flows of the production process of BioMCN. This reflects the situation with one production line, operating two lines would approximately double the quantities. The share of biomethanol in total methanol production is currently said to be around 15 percent (Bilfinger, 2018).
Conversion to methanol
In this process, methanol is produced using a low-pressure catalytic reaction of syngas. The low pressure (50-60 bar) and temperature range of 250-260°C provide favourable conditions for the synthesis of methanol and completely inhibit the production of by-products (Arthur, 2010). The most common catalyst used in low-pressure methanol production is a copper-zinc oxide catalyst with aluminium oxide or chromium(III) oxide (Cu – ZnO – Al2O3 /Cu – ZnO –
Cr2O3) (Lücking, 2017). The syngas produced afterwards in reaction is compressed to 80-100
bar before it is fed into the methanol reactor (Arthur, 2010).
Distillation
In this process, the water-methanol mixture is distilled to stabilize methanol, either by distillation or by deep flashing, to expunge the volatile components such as CO2. There are
three important grades4 of methanol (Arthur, 2010).
Biomethanol
According to BioMCN, the production of biomethanol is carried out in two ways. The first method is to use biogas from bio-fermentation plants. The biogas is made from, for example, cow manure and upgraded to natural gas network quality (Bilfinger, 2018). The second method is based on additional liquid CO2 injection as there is a surplus of hydrogen in the
production process. The biogenic CO2 (produced from biogas production) is purchased and
mixed with hydrogen to produce biomethanol using methanol synthesis (Vaartjes 2017). For flexibility reasons, green gas certificates are used to compensate the use of natural gas, which allows methanol to be sold as green methanol or biomethanol. A further step for more sustainable methanol would be to produce hydrogen with electrolysis using renewable electricity, combined with biogenic CO2 (Bilfinger, 2018).
Table 6 gives an overview of inputs and outputs for BioMCN. It reflects the situation before the restart of the second production line.
4 Chemical grade AAA (99.85 wt% MeOH, 0.1 wt% water, and concentrations of higher alcohols at
parts-per-million levels); fuel grade (97wt% MeOH, 1 wt% water, 1.5wt% alcohols and 0.5wt% of process oil) and, MTBE grade (97wt% MeOH, 1wt% water, 2wt% alcohols, 150ppm methyl acetate, 0.3wt% inert liquid medium).
Table 6. Input and output (mass and energy) of BioMCN production, one line in operation (Elektronisch Milieujaarverslag, 2019)
Input
Quantity
Unit
(MNm
3)
Energy (PJ)
Natural gas and biogas feedstock
370
kton
445
14.1
Liquified CO
2pm
Input (Energy Flows)
Quantity
Unit
(MNm
3)
Energy (PJ)
Natural gas
64.4
kton
77.3
2.4
hydrogen from separation
16.1
kton
194.3
2.1
methane from separation
12.0
kton
21.6
0.8
Electricity
16.6
GWh
0.06
Output
Quantity
Unit
Energy (PJ)
Methanol and bio-methanol
450
kton
9.0
Fossil based CO
2emissions
217.5
kton
2.4 NExBTL process (Neste Netherlands B.V.)
This section explains about the technology used by Neste Oil for the production of biodiesel. Neste Oil uses the NExBTL HVO (Hydrotreated Vegetable Oil) process, which uses the waste and residue fat fractions coming from food, fish and slaughterhouse industries, as well as from non-food grade vegetable oil fractions as feedstock (Neste, 2016). The NExBTL process can be subdivided into pre-treatment, hydro treatment, stripping, isomerization and
stabilization. The hydrogen used for the NExBTL process is acquired from third parties or produced on-site using membrane separation and stripping and isomerization (van
Staalduinen, 2007). The chemical reaction involved in the Neste NExBTL process is shown in Figure 15 (Neste, 2016).
Figure 16 shows an overview of the Neste NExBTL technology. In this process, the hydrogen which is used to remove oxygen from the triglyceride vegetable oil molecules thus, splitting the triglyceride into three separate chains creating hydrocarbons similar to diesel fuel components (Neste, 2016). The production process can be sub-divided into six process steps:
Pre-treatment (impurities removal)
• Hydro treatment: Hydrodeoxygenation (HDO) (oxygen removal, paraffins production, propane production)
• Stripping • Isomerization
Stabilization (removal of residual light gases)
Recycle (hydrogen recovered & recycled; water, carbon dioxide removal, light gases recovered).
Figure 16. Schematics presentation of Neste NExBTL process, adapted from: (Nikander, 2008; van Staalduinen, 2007)
Pre-treatment Process
In this process, the feedstock is waste and animal fats and vegetable oils which passes through the pre-treatment Unit (PTU) to reduce the impurities by filtration, citric acid, phosphoric acid (50-75%), bleaching earth and silica, thus to enhance long catalyst lifetime. The feedstock is heated through outgoing stream of pre-treated oil and steam, steam is purchased from Uniper. The PTU is designed for continuous processing of vegetable oils and fats which is based on a bleaching unit with temperature up to 100°C. The bleaching unit operational configuration depends on type and quality of feedstock and it can be operated independently from the rest of plants. The process involves wet bleaching and dry bleaching to pass it through a filtration process to produce pre-treated oil. This pre-treated oil is fed through heat exchangers to heat up the feedstock in the storage tank. The process generally involves addition of acid to form a salt and removing it by precipitation. The result of this process is further fed through silica and/or bleaching earth which act as an adsorbent to further reduce impurities and the levels of avid or bleaching earth used are in range of 0.003 to 0.0003 kg/kg of NExBTL renewable diesel (NESTE OIL, 2013). Approximately 1 mln tonnes of pre-treated oil is processed per year (van Staalduinen, 2007). Table 7 and Figure 17 gives an overview of the input and output of the pre-treatment process per ton of diesel.
Table 7. The input and output of pre-treatment process of NExBTL per ton of diesel (Nikander, 2008)
Input
Quantity
Unit
Raw material
1,214
Kg
Cooling water
70
Kg
Process chemicals
3
Kg
Process water
28
Kg
Steam
657
MJ
Electricity
50
MJ
Output
Quantity
Unit
Pre-treated oil
1,191
Kg
Dried solid waste
13
Kg
Waste water
111
Kg
Figure 17. Schematics of pre-treatment process for NExBTL process (Nikander, 2008)
Hydro deoxygenation (HDO)
This process involves the catalytic hydro treatment of pre-treated oil in the reactor filled with catalyst bed. This is causing vegetable oils to react with hydrogen until branched and light hydrocarbons are formed in three straight chain paraffins. Also, propane, water and carbon dioxide are formed through consecutive reactions (NESTE OIL, 2013).
The triglycerides are converted 100% in the reactor and the reaction step is referred to as hydro deoxygenation (HDO). The reaction occurs at elevated temperature and pressure where triglycerides react with hydrogen with catalyst. The reactor is heated using thermal oil. This oil is heated with natural gas. The reaction is exothermic, thus the excess heat is
removed and used for heating up the incoming feed, reducing external energy requirement. The hydrogen comes from membrane separation and recycling flows from stripping and isomerization (van Staalduinen, 2007), and from third parties. In addition, the high pressure and low pressure propane rich off gas produced during the production is fed to the recycle section when water has been condensed out for recycle and reuse (NESTE OIL, 2013).
In addition to HDO, the paraffins are isomerized to improve the cold flow properties of the final product. The liquid hydrocarbons are fed to the diesel stabilization column (NESTE OIL, 2013). Table 8 and Figure 18 give an overview of the input and output of the NExBTL process per ton of diesel.
Table 8. The input and output of NExBTL process (excluding pre-treatment) per ton of diesel (Nikander, 2008)
Input
Quantity
Unit
Pre-treated oil
1,191
kg
Hydrogen
42
kg
Cooling water
4
kg
Process water
25
kg
Steam
29
MJ
Natural gas for oil heating
8.6
MJ
Electricity
107
MJ
Output
Quantity
Unit
NExBTL
1,000
kg
Bio gasoline
25
kg
Propane
72
kg
Waste water
113
kg
Biological CO
2from process
48
kg
Stripping
In this process, the bottom stream from hydrogen treatment in a stripped of water, hydrogen sulphide, carbon dioxide and carbon monoxide using warm hydrogen. These components are removed to deactivate the catalyst in isomerization. The hydrogen comes from recycle stream from isomerization, where the hydrogen is supplemented from third parties. Further, after stripping the remained branched hydrocarbons are further processed in isomerization. The warm hydrogen is cooled in a condenser after stripping process.
Isomerization
The branched hydrocarbons from the stripper are isomerized in a reactor using a catalyst, to produce diesel under a high pressure and high temperature. Hot oil is used to heat the process. This oil is heated with natural gas. The majority of the hydrogen flow, together with the recycled hydrogen flow from the stripper is compressed. Further, a small part of
hydrogen stream is immediately recycled to isomerization reactor.
Stabilization
The products of the isomerization reactor are sent to the stabilization column to separate the light hydrocarbons by stripping low pressure steam. The low pressure steam is generated in the waste heat boiler by the condensate. Also, the hydrocarbons which are stripped are called light propane (NESTE OIL, 2013). The NExBTL formed contains water, which is removed by drying the NExBTL stream using drip catcher. The water released during this process is acidic and goes through acid gas removal and hydrogen treatment to be stripped of CO2 and H2S.
Recycle section (gas separation)
In this process, the gas mixtures from the stabilization are separated using absorber (amine unit) and methyl diethanolamine (MDEA) under high pressure into individual gas streams of hydrogen which goes to hydrodeoxygenation process for use and MDEA solution dissolved with carbon dioxide and hydrogen sulphide. The recycle section which contains wash columns and regeneration columns. The carbon dioxide and water streams are cleaned before its released to the atmosphere or waste water system.
3 Biofuel products and
applications
In this section, the main drivers behind Dutch biofuel industry, products and applications are discussed. An overview of the relevant technical standards for biofuels in Europe is also provided.
3.1 Drivers for the Dutch biofuels industry
Biofuels consumption for transport in the Netherlands is mainly driven by the European policies and their implementation at the national level (Hamelinck et al., 2019). The biofuel directive of 2003 prescribed member states to set the share of biofuels to 2% by 2005 and to 5.75% by 2010 (Directive 2003/30/EC, 2003). However, there were some questions on the sustainability of the biofuels due to rising prices of food, negative impacts on the biodiversity and GHG emissions caused by crop cultivation and land use change (Grinsven & Kampman, 2013).
In 2009 the Renewable Energy Directive (2009/28/EC, RED) came into effect which included sustainability criteria for biofuels. The RED introduced a binding target of 10% of renewable energy in transport by 2020. Next to that, the Fuel Quality Directive (2015/652) obliged a reduction of average GHG intensity of the transport fuels sold on the market by 6% by 2020 compared with 2010 (DIRECTIVE 2009/28/EC, 2009; DIRECTIVE 2009/30/EC, 2009).
The RED was implemented by the Dutch government in 2011 and obliges Dutch fuel suppliers to sell a certain share of biofuels on the market (Grinsven & Kampman, 2013). Until 2014, there were separate sub-targets for biofuels shares in petrol and diesel, but were discontinued from 2015 onwards (MINISTERIE VAN INFRASTRUCTUUR EN MILIEU, 2016; NEa, 2016). Table 9 provides the biofuel obligations until 2020 (van Grinsven & van Essen, 2015); (NEa, 2018).
Table 9. Renewable energy obligations in transport sector in 2015-2020, minimum percentage of renewables in energy for transport
(NEa, 2018)
2015 2016 2017 2018 2019 2020
Total obligation 6.25% 7% 7.75% 8.5% 12.5% 16.4%
Due to Indirect Land Use Change (ILUC) caused by food-based biofuel production, the EU approved the ILUC Directive in 2015 which amended the RED and the Fuel Quality Directive to address ILUC. The directive (2015/1513) limited the maximum contribution of food based biofuels to 7% in 2020 and also introduced a voluntary target of 0.5% advanced biofuels in road transport by 2020 (Bitnere, 2017). Furthermore, the directive introduced the double-counting mechanism, which means advanced biofuels can be counted double (on energy basis)towards the renewable energy target of 10% (ETIP Bioenergy, 2017; Hamelinck et al., 2019). Figure 19 gives an overview of the relation between different types of biofuels for realising the 10% target (van Grinsven & van Essen, 2015).
Figure 19. The target for 10% biofuel target for transport (van Grinsven & van Essen, 2015)
The revised RED II (2018/2001/EU) specifies a 14% target for renewable energy in road and railway transport by 2030. In this directive first generation biofuels are capped at max. 7% in 2030 (Bitnere, 2017; European Commission, 2018).
Figure 20 reflects RED II proposal for fuel suppliers (Bitnere, 2017; European Commission, 2019). The share of advanced biofuels has to be at least 1% in 2025 and at least 3.5% in 2030 (European Commission, 2019). Furthermore, palm oil, which results in high-ILUC has to be phased out by 2030 (Bitnere, 2017).
Figure 20. Renewable energy in transport post 2020 in Europe (European Commission, 2018)
Hence the future expansion of biofuels markets in Europe depends on the commercial deployment of advanced biofuels which utilizes waste, residues and energy crops (grown on marginal land) as feedstocks (ETIP Bioenergy, 2017).
3.2 Types of biofuels
In the EU, liquid biofuels are defined as transport fuels such as biodiesel, bioethanol, biogas/biomethane which are made from biomass. Biofuels are generally categorised as conventional/first-generation or advanced/second-generation biofuels. Conventional biofuels refer to biofuels produced from food and feed based crops. Advanced biofuels refer to biofuels and biogas produced from wastes and residues (i.e. manure, straw, forestry residues).
First-generation biofuels
First-generation biofuels include ethanol and biodiesel generated from food and feed crop based feedstocks. Ethanol is mostly produced from the fermentation of C6 sugars (mostly glucose) in sugarcane and maize. Other feedstocks to produce first-generation bioethanol include whey, barley, potato wastes, and sugar beets (Lee & Lavoie, 2013). Biodiesel is produced through a chemical process (transesterification), where the feedstocks are oily plants and seeds. The process involves extraction of oil and breaking the long chain fatty acids to glycerol, and replacing it with methanol to produce biodiesel (Lee & Lavoie, 2013).
Second-generation biofuels
Second-generation biofuels are defined as fuels produced from different non-food feedstocks, especially but not limited to lignocellulosic biomass. Feedstock used for second-generation biofuels is usually separated into three main categories: homogeneous (white wood chips), quasi-homogeneous (agricultural and forest residues) and non-homogeneous (municipal solid waste) (Lee & Lavoie, 2013). The conversion process for the production of second generation biofuels is depicted in Figure 21.
Figure 21. Schematics of the pathways for conversion of lignocellulosic biomass into biofuels (Lee & Lavoie, 2013)
Third-generation biofuels
Third generation biofuels are produced from algal biomass, which has a rapid growth yield compared to lignocellulosic biomass (Brennan & Owende, 2010). The production of biofuels from algae is dependent on the lipid content of microorganisms. The algae mainly used is chlorella due to its high lipid content (60-70%) (Liang et al., 2009) and high productivity (Chen et al., 2011). There are various technical and geographical challenges associated with algal biomass (Lee & Lavoie, 2013). Lipids from algae can be processed via
transesterification to produce biodiesel or through hydrogenolysis to produce kerosene grade alkane suitable for use as drop-in aviation fuels (Tran et al., 2010).
Feedstock for biofuels
In the EU, bioethanol is mainly produced from grains and sugar beet derivatives which include cereals (74%), sugars (15%) and ligno-cellulosic (11%) (ePURE, 2017; European Bioenergy Day, 2017). As for feedstock, wheat is mainly used in North-western Europe, whereas maize is predominantly used in Central Europe and Spain for bio-ethanol. Sugar beets are used in France, Germany and Belgium for production of bio-ethanol. Hence, the required feedstock for the 2016 production (4 million litres of bioethanol) was estimated at 8.9 million metric tons of cereals and 8.8 million metric tons of sugar beets. Thus, about 2.9% of total EU cereal production and about 7.0% of total sugar beet goes to biofuels production (European Bioenergy Day, 2017). According to European renewable ethanol association (ePURE), 5.5 million tonnes of co-products including 4 million tonnes of animal feed were produced in 2016.
The food versus fuel debate is about the potential impact of the first generation biofuels on global food supply (Tomei & Helliwell, 2016). The food versus fuel argument questions the ethics of diverting land from food to energy production, and consist of two key parts: first, the demand for biofuels has an impact on food prices, which disproportionately affects poor people in the global South (Monbiot, 2004, 2007, 2012); and second, it leads to competition with existing food production in established agricultural areas or requires expansion into new environments (Tomei & Helliwell, 2016). The UN Food and Agriculture Organisation5 and the
International Food Policy Research Institute state that biofuels and food production can also be mutually supportive. A recent analysis finds there is no evidence of biofuels impacting the local food security and there is a small impact on global prices (Faaij et al., 2017).
Technical Standards for biofuels in Europe
The EU regulations described below outline the fuel content standards for biodiesel, ethanol and methanol (TransportPolicy, 2018). Standardization helps in diminishing trade barriers, promotes safety, increases compatibility of products, systems and services, and promotes common technical understanding. These standards are developed by the European Committee for Standardization (CEN) (Rutz & Janssen, 2006).
Biodiesel
• EN 14214 which includes the basic specification for FAME (fatty acid methyl ester) fuel for diesel engines. B100 fuel which meets the standard can be used unblended in diesel engine (if engine is adapted to operate on B100) or blended with petroleum diesel fuel (Moser, 2009; Rutz & Janssen, 2006).
• EN 590 which is European diesel fuel specification applicable to biodiesel blends up to 7% of FAME (Moser, 2009; Rutz & Janssen, 2006).
5 UN Food and Agriculture Organisation Director General José Graziano da Silva speaking at the Global Forum
Ethanol
• EN 15376 provides the specification of blending of ethanol in gasoline in the EU (Rutz & Janssen, 2006).
• EN 228 is specification for European gasoline fuel applicable to ethanol blends up to 10% (Rutz & Janssen, 2006).
Methanol
• EN 228 provides the specification for low percentage methanol-gasoline blends up to 3% (ETIP Bioenergy, 2016).
HVO (Biodiesel)
• EN 15940:2016 provides the specification for paraffinic diesel fuels and also covers synthetic Fischer-Tropsch products GTL, BTL and CTL. HVO can be blended without any limit or in addition to max 7% vol FAME (Neste, 2016).
Blending of biofuels
For the biofuels market, lacking compatibility with existing vehicle designs and current fuel distribution infrastructures is a big limiting factor. Generally called the “blend wall”,
considerable obstacles arise due to differences between the biofuel molecules and the petroleum-based fuels for which current infrastructure and vehicles are designed. In the EU, the restrictions are at the 10% (by volume) level for ethanol in gasoline, and 7% (by volume for Fatty Acid Methyl Ester biodiesel) in diesel in 2020. (FuelsEurope, 2018)
One of the possible solutions is the use of products with very high levels of biofuel, such as E85, B30, or B1006. However, these grades of fuel require specially adapted vehicles,
dedicated infrastructure and large incentives for fuel providers and original equipment manufacturers (OEMs) to offer them at competitive prices (FuelsEurope, 2018).
The alternative could be to introduce higher standard grades like E20 and B107, but these
might require additional pumps at the service station. Therefore, “drop in” fuels like Hydrogenated Vegetable Oil (HVO) and butanol can play a key role in bridging the gap between blend walls and biofuel targets (FuelsEurope, 2018).
3.3 Fuel properties
The difference between the thermo-chemical properties of biofuels and fossil-based fuels is described below along with the relevant application of the products in the European market.
Ethanol [C2H5OH]
Ethanol is utilized as substitute for gasoline or can be used as blend with gasoline. Also, ethanol is used for the petrol additive ETBE (Ethyl tert-butyl-ether) (ETIP Bioenergy, 2016). A comparison of the chemical properties of ethanol and petrol (gasoline) is seen in Table 10.
6 B85: 85% Ethanol + 15% Gasoline. B30: 70% Biodiesel + 30% Diesel. B100: 100% Biodiesel 7 E15: 15% Ethanol + 85% Gasoline. B10: 10% Biodiesel + 90% Diesel.
Table 10. Comparison of Fuel properties ethanol (ETIP Bioenergy, 2016)
Property Ethanol Petrol
Density at 20°C [kg/l] (JRC, 2017)
0.79 0.74
Lower Heating Value [MJ/kg] (JRC, 2017)
26.8 43.2
Octane number* >100 92
Fuel Equivalence8* 0.65 1
GHG [g/CO2eq/MJ]** Sugar beet ethanol: 33
Farmed wood ethanol: 20 Wheat straw ethanol: 11
93.3
Note: *Median values are used for ranges ** Total for cultivation, processing and transport
Application
Low percentage ethanol-gasoline blends (E5, E10) can be used in the conventional spark-ignition engines without any technical changes. For modern flexible fuel vehicles (FFV), the blend of EtOH-gasoline mixture up to 85% can be used. The ED95 (alcohol fuel) is used for heavy duty application on a limited scale (ETIP Bioenergy, 2016).
Fatty Acid Methyl Esters/Biodiesel (FAME) [CH3(CH2)nCOOCH3]
FAME is used for substituting diesel, transportation fuel and power generation fuel (ETIP Bioenergy, 2016). Table 11 gives an overview of the difference between properties of FAME and diesel.
Table 11. Comparison of Fuel properties biodiesel (ETIP Bioenergy, 2016)
Property FAME Diesel
Density at 20°C [kg/l] (JRC, 2017) 0.89 0.83
Lower heating value [MJ/kg] (JRC, 2017)
37.2 43.1
Viscosity at 20°C [mm2/s]* 7.5 5
Cetane number* 56 50
Fuel Equivalence* 0.91 1
GHG [gCO2eq/MJ]** (JRC, 2017) Rapeseed biodiesel: 46
Waste vegetable or animal oil biodiesel: 10 Palm oil biodiesel: 54
95.1
Note:
*Median values are used for simplification **Total for cultivation, processing and transport
Application
Blends with diesel up to 5-10% or 25-30% and 100% have been tested by the motor manufacturers. The seals and piping require modification to use 100% pure biodiesel. In EU, the use of biodiesel as a low-blend component in transport fuel is up to 7% according to EN 590 (ETIP Bioenergy, 2016).
8 Equivalence ratio can be defined as the stoichiometric mixture of air and fuel capable of burning all the fuel
Methanol (CH4O)
Methanol is used as feedstock for the chemical processes as well as for blending with petrol (ETIP Bioenergy, 2016). Table 12 gives an overview of the difference of properties of methanol and petrol.
Table 12. Comparison of fuel properties methanol (ETIP Bioenergy, 2016)
Property Methanol Petrol
Density at 20°C [kg/l] 0.79 0.74
Lower heating value [MJ/kg] (JRC, 2017) 19.9 43.2 Octane number >110 92 Fuel equivalence 0.48 1 GHG [gCO2eq/MJ] (JRC, 2017)
Waste wood methanol:5 Farmed wood methanol:7
93.3
Application
The methanol blends with gasoline (up to 3%) as per EU standard EN 228 can be used in conventional spark engines without any technical changes. The use of alcohol fuels in heavy duty applications is still being investigated by motor manufactures (ETIP Bioenergy, 2016).
HVO/Neste Renewable diesel (hydrotreated vegetable oils and animal fats)[C53H94O3]
Neste Renewable diesel is used for blending with diesel and these is no limit on blending. In addition to main product diesel, small amounts of renewable gasoline components, propane and isoalkane are also formed as side products (Neste, 2016). Table 13 gives an overview of the difference between properties of Neste diesel, diesel and FAME.
Table 13. Comparison of fuel properties HVO/Neste renewable diesel (ETIP Bioenergy, 2016)
Property Neste Renewable Diesel
Diesel FAME
Density [kg/m3]
(JRC, 2017)
780 832 890 (Neste, 2016)
Lower Heating value [MJ/kg]
44.1 43.1 37.2 (Neste, 2016)
Cetane Number >70 50 56 (Neste, 2016)
Viscosity at 20°C[mm2/s]
4.0 5 7.5 (Neste, 2016)
GHG [gCO2eq/MJ]
(JRC, 2017)
Palm Oil diesel: 57.2 95.1 Rapeseed biodiesel: 46 Waste vegetable or animal oil biodiesel: 10 Palm oil biodiesel: 54
Application
Renewable gasoline components can be blended with gasoline. This provides a high
bioenergy value but has low octane numbers compared to ethanol. Biopropane can be used in cars and other applications which use LPG. It can also be used as renewable process energy at the production site to reduce the carbon footprint of products from NEXBTL process. Isoalkane can be used in a wide range of chemical applications such as paints and coatings. The NExBTL process can also be used for production of renewable jet fuel (Neste, 2016).
3.4 Prices of biofuels
Prices of liquid fuels depend largely on feedstock prices. Wholesale prices of fossil-based fuels vary with the mineral oil9 price, methanol prices vary with the natural gas price, but
currently also depend on capacity shortages (Landälv, 2017). Based on the market information in this section, biofuel prices are still on a higher levels than fossil fuel prices, compared on energy content and also supportive policies to be introduced to facilitate the technology learning and production scale-up necessary to reduce costs of biofuels (IEA, 2019d). Figure 22 gives an overview of the global prices of oil since 2005.
Note: *Prices of gasoline and automotive diesel are in 2015 US dollars. **Crude oil refers to nominal prices
Figure 22. Global fuel price changes (IEA, 2019e) Biodiesel
Figure 23 give the price indication of the biodiesel available in market in terms of USD/ton from 2013-2019 (Neste, 2019) and compared to Figure 29 automotive diesel price, the prices of biodiesel are still high.
9 Mineral oil is a colourless, odourless liquid present in various cosmetics and personal care products (U.S.
Figure 23. Biodiesel prices (SME & FAME) Source: Thomson Reuters, Starsupply, OPIS
Bioethanol
Figure 24 gives an overview of the price of bioethanol in the market with the price of the Netherlands and Brazil (Phillips et al., 2018).
Biomethanol
Figure 25 provides an overview of the historical methanol pricing in the world (MMSA, 2019). The methanol pricing is dependent on its feedstock, which is mostly natural gas
(Inetrnational Energy Agency, 2017).
Figure 25. Methanol price comparison 2016-2019 (MMSA, 2019)
Table 14 gives an overview and comparison of different biofuel properties and prices, based on the previous information.
Table 14. Overview of the prices and properties of biofuels Price (USD/ton) Density (kg/l) Heating value (MJ/kg) USD/m3 USD/GJ Biodiesel 800-1000 0.89 37.2 22-27 Ethanol 507-760 0.789 26.8 400-600 19-28 Methanol 300-500 0.792 19.9 15-25 Euro/m3 MJ/m3 Euro/GJ Natural gas 0.15 31.65 4.7
USD/barrel l/barrel MJ/kg USD/GJ
4 Options for
decarbonisation
This study investigates the decarbonization options for the biofuel industries. A general classification of options is shown in Figure 26.
Figure 26. CO2 reduction options
Most of the utility consumption in the biofuels industry is natural gas for heating. The options to decarbonise the biofuel industries include:
1. Alternatives for heat generation: Hydrogen boilers
Biogas boilers Electric boilers Heat pumps
Ultra-deep geothermal energy Other external heat supply options
2. CCUS (carbon capture, utilization and storage) 3. Alternative feedstocks
4. Alternative processes.
4.1 Heat generation
Hydrogen
Hydrogen could play an important role to reduce CO2 emissions, using it as an alternative to
gas for many industrial applications, mostly produced by steam reforming of natural gas (Gigler & Weeda, 2018). Hydrogen to be considered as renewable option should be produced from electrolysis using renewable energy (green hydrogen). Direct electric heating is
preferred if possible, as energy losses in electrolysis can be avoided. Natural gas in
combination with CCS can also mitigate CO2 emissions (blue hydrogen). Appendix B provides
more information on types of hydrogen production.
Hydrogen can be applied in some of the existing boilers and furnaces, for high and low temperature processes, by implementing technical adjustments (Gigler & Weeda, 2018). There are no insurmountable technical obstacles for large-scale introduction of hydrogen to replace natural gas (van Wijk & Hellinga, 2018). Burners for existing boilers and furnaces have to be adjusted or replaced, to achieve similar temperature levels (Bertuccioli et al., 2014). The existing natural gas infrastructure can be used for supply of hydrogen (IEA, 2019b). The energy content of hydrogen (high calorific value) of hydrogen is 12 MJ/Nm3,
while that of natural gas is 40 MJ/Nm3 (or approx. 35 MJ/Nm3 for Groningen gas), thus the
volume of hydrogen to be transported must be three times as of natural gas (van den Noort et al., 2017).
Biogas
Biogas can be used as a heating fuel in existing natural gas installations and infrastructure, depending on the specific characteristics. Biofuel producers already process organic
feedstocks, which could make on site biogas generation an interesting option. The specific conditions per company are addressed in the last sections of this chapter. In general, biogas created by anaerobic fermentation is composed of methane and carbon dioxide, with small amounts of water vapour, hydrogen sulphide, hydrogen, nitrogen and oxygen (BioBased Economy, 2010; Morgan et al., 2018; Xie et al., 2018). The composition depends on the feedstock and the technology used for the extraction (Morgan et al., 2018). The biological production pathway (anaerobic digestion) for biogas uses microorganisms to break down the nutritional (digestible) content of biomass (Labatut & Pronto, 2018). The digester process includes a storage, mixing tank, digesters, pasteurisation tank and digestate and waste water treatment (Schulze et al., 2017). Biogas can be upgraded to green gas by removing carbon dioxide and contaminations (membrane technology), resulting in a gas which has similar properties as natural gas and can be fed into the natural gas network after compression (BioBased Economy, 2010). Reprocessing the gas entails capital costs and energy costs (approximately 10% of the combustion values of resulting green gas) (BioBased Economy, 2010). Table 15 includes the data on biogas used in this chapter.
Table 15. Overview of external biogas production data
Characteristic Value Source
Fuel Biogas
Emissions Short cycle CO2
Capacity 5.510 MWth (Uslu, 2019)
Efficiency 90 % Estimation
Lifetime <25 years
Investment cost 2.27-3.03 million €/MWth (Uslu, 2019)
Maintenance cost 0.11-0.28 million €/MWth/yr (Navigant, 2019)
10 The feed input consist of a mixture of pig manure and cattle manure, with a mix of slurry and thick fractions