Methods for calculating the
emissions of transport in
the Netherlands
May 2013
Text and editing:
Task Force on Transportation of the Dutch Pollutant Release and Transfer Register
(see www.emissieregistratie.nl)
comprising the following members:
- John Klein (CBS-Environmental Statistics) jken@cbs.nl Road traffic and other mobile sources
- Gerben Geilenkirchen (PBL- Netherlands Environmental Assessment
Agency) gerben.geilenkirchen@pbl.nl
Chairman
- Jan Hulskotte (TNO) jan.hulskotte@tno.nl
Navigation, aviation and mobile machinery
- Amber Hensema (TNO), emission factors for road traffic amber.hensema@tno.nl - Norbert Ligterink (TNO), emission factors for road traffic norbert.ligterink@tno.nl - Paul Fortuin (DG for Public Works and Water Management-DVS) paul.fortuin@rws.nl - Hermine Molnár-in 't Veld (CBS-Transport Statistics) hmnr@cbs.nl
TABLE OF CONTENTS
INTRODUCTION1. Road traffic 1.1 Introduction
1.2 Contribution to the national emissions 1.3 Description of the process
1.4 Calculation methods
1.4.1 Actual emissions and NEC emissions
Combustion of motor fuels; CO, VOC, NOx, PM10, N2O en NH3 Combustion of motor fuels; SO2, CO2, and heavy metals
Combustion of motor fuels; VOC components and PAH components Evaporation of motor fuels
Wear of tyres, brakes and road surfaces; PM10
Wear of tyres, brakes and road surfaces; heavy metals and PAHs Leakage of engine oil; heavy metals and PAHs
Consumption of engine oil; heavy metals
1.4.2 IPCC emissions 1.5 Activity data
1.5.1 Actual and NEC emissions Vehicle fleet
Average annual number of kilometres Vehicle kilometres of non-Dutch drivers
Allocation of vehicle kilometres to road category
Share of vehicle classes in the vehicle kilometres per vehicle category Fuel consumption of road traffic
1.5.2 IPCC emissions Sales of motor fuels
1.6 Emission factors
1.6.1 Actual and NEC emissions
Emission factors for the combustion of motor fuels; CO, VOC, NOx and PM10 Emission factors for the combustion of motor fuels; N2O and NH3
Emission factors for the combustion of motor fuels; SO2, CO2 and heavy metals Emission factors for the evaporation of motor fuels
Other emission factors 1.6.2 IPCC emission factorss 1.7 Substance profiles
1.7.1 VOC caused by combustion of motor fuels 1.7.2 VOC caused by evaporation of motor fuels 1.7.3 Particulate matter emission (non-combustion) 1.8 Regionalization
1.9 Uncertainties
1.10 Points for improvement 1.10.1 Calculation methods 1.10.2 Activity data 1.10.3 Emission factors 1.11 Verification 2. Inland navigation 2.1 Introduction
2.2 Contribution to the national emissions 2.3 Description of the process
2.4 Calculation methods
2.4.1 Actual and NEC emissions
Combustion of motor fuels: CO, NOx, VOC, PM10, SO2 and CO2
Professional inland shipping Passenger ships and ferries Recreational boat traffic
Combustion of motor fuels: N2O and NH3
Combustion of motor fuels: VOC and PAH components and heavy metals
2.4.2 IPCC emissions 2.5 Activity data
2.5.1 Actual and NEC emissions Professional inland shipping Passenger ships and ferries Recreational boat traffic
2.5.2 IPCC emissions 2.6 Emission factors
2.6.1 Actual and NEC emissions Professional inland shipping Passenger boats and ferries Recreational boat traffic
2.6.2 IPCC emissions 2.7 Substance profiles 2.8 Regionalization 2.9 Uncertainties
2.10 Points for improvement 2.11 Verification
3. Fisheries
3.1 Introduction
3.2 Contribution to the national emissions 3.3 Description of the process
3.4 Calculation methods
3.4.1 Actual and NEC emissions 3.4.2 IPCC emissions 3.5 Activity data 3.6 Emission factors 3.7 Substance profiles 3.8 Regionalization 3.9 Uncertainties
3.10 Points for improvement 3.11 Verification
4. Maritime shipping 4.1 Introduction
4.2 Contribution to the national emissions 4.3 Description of the process
4.4 Calculation methods
4.4.1 Combustion of motor fuels; CO, NOx, VOC, PM10, SO2 and CO2 Seagoing vessels at anchor
Sailing and manoeuvring seagoing vessels on Dutch territory
4.4.2 Combustion of motor fuels; N2O and NH3
4.4.3 Combustion of motor fuels; VOC and PAH components and heavy metals
4.5 Activity data
4.5.1 Seagoing vessels at anchor
4.5.2 Sailing and manoeuvring seagoing vessels on Dutch territory 4.5.3 Seagoing vessels on the national portion of the continental shelf
4.7 Substance profiles 4.8 Regionalization 4.9 Uncertainties
4.10 Points for improvement
4.10.1 Seagoing vessels at anchor
4.10.2 Sailing and manoeuvring seagoing vessels on Dutch territory 4.10.3 Seagoing vessels on the national continental shelf
4.11 Verification
5. Rail traffic 5.1 Introduction
5.2 Contribution to the national emissions 5.3 Description of the process
5.4 Calculation methods
5.4.1 Combustion emissions of CO, VOC, NOx, PM10, SO2, CO2 and heavy metals 5.4.2 Combustion emissions of N2O and NH3
5.4.3 PM10 and heavy metals due to wear of overhead contact lines and carbon brushes 5.5 Activity data
5.6 Emission factors
5.6.1 Combustion emissions of CO, VOC, NOx, PM10, SO2, CO2 and heavy metals 5.6.2 Combustion emissions of N2O and NH3
5.6.3 PM10 and heavy metals due to wear of overhead contact lines and carbon brushes
5.7 Substance profiles 5.8 Regionalization 5.9 Uncertainties
5.10 Points for improvement 5.11 Verification
6. Air traffic
6.1 Introduction
6.2 Contribution to the national emissions 6.3 Description of the process
6.4 Calculation methods
6.4.1 Actual and NEC emissions
Combustion of motor fuels; CO, NOx, VOC, PM10, SO2 and CO2
Combustion of motor fuels; N2O and NH3
Auxiliary Power Units and General Power Units (APU/GPU) Storage and transfer of kerosene
Combustion of motor fuels; VOC and PAH components and heavy metals
6.4.2 IPCC emissions 6.5 Activity data
6.5.1 Actual and NEC emissions 6.5.2 IPCC emissions
6.6 Emission factors 6.7 Substance profiles 6.8 Regionalization 6.9 Uncertainties
6.10 Points for improvement 6.11 Verification
7. Mobile machinery 7.1 Introduction
7.2 Contribution to the national emissions 7.3 Description of the process
7.4 Calculation methods
7.4.1 Combustion of motor fuels; CO, NOx, VOC, PM10, SO2 and CO2 7.4.2 Combustion of motor fuels; N2O and NH3
7.4.3 Combustion of motor fuels; VOC and PAH components and heavy metals 7.5 Activity data
7.6 Emission factors 7.7 Substance profiles 7.8 Regionalization 7.9 Uncertainties
8. Military activities 8.1 Introduction
8.2 Contribution to the national IPCC emissions 8.3 Description of the process
8.4 Calculation methods 8.5 Activity data 8.6 Emission factors 8.7 Substance profiles 8.8 Regionalization 8.9 Uncertainties
8.10 Points for improvement 8.11 Verification
9. IPCC method 9.1 Introduction
9.2 Why are there two estimation methods?
9.3 The most important differences between the two methods 9.4 Emission factors for the IPCC-method
10. Changes with respect to previous versions of the report
References and annexes REFERENCES
Annexes: QUALITY CODES A. Activity data B. Emission factors C. Emissions
INTRODUCTION
The sources that cause emissions of environmental pollutants can roughly be divided into stationary and mobile sources. Examples of stationary sources are installations for generating heat and energy, such as central heating systems and electrical power plants, and installations where all kinds of industrial processes take place. Mobile sources include various means of transport such as passenger cars, light and heavy duty trucks, inland waterway vessels and aircraft, as well as mobile machinery with combustion engines, such as agricultural tractors and forklifts.
This report describes the methodologies, emission factors and relevant activity data that are used to calculate the emissions of environmental pollutants from mobile sources in the Netherlands. The emissions are calculated annually by the Task Force on Transportation of the Dutch Pollutant and Transfer Register (PRTR). The resulting emission figures for greenhouse gases are reported annually in the National Inventory Report, whereas the air polluting emissions are reported in the Informative Inventory Report. Both reports also give a brief description of the trends in emissions and the methodologies used to calculate emissions. These methodologies and underlying data are described in more detail in the present report.
The present report describes the methodologies used for calculating the emissions for the 1990-2011 time series that are published in 2013 and reported in the 2013 National Inventory Report (Van der Maas et al., 2013) and the 2013 Informative Inventory Report (Jimmink et al., 2013). This report has been compiled by the members of the Task Force on Transportation of the PRTR, which includes members of Statistics Netherlands, the PBL Netherlands Environmental Assessment Agency, the Netherlands Organisation of Applied Scientific Research TNO and the RWS Centre for Transport and Navigation (DVS) of the Dutch Ministry of Infrastructure and the Environment. For a more general description of the Dutch PRTR and the different task forces, please refer to the website of the PRTR (www.emissieregistratie.nl).
The majority of the tables accompanying this report have been included in a separate Excel file. References to these tables are printed in italics. In addition to the data for the emission calculation, the tables also contain references and hyperlinks to the underlying data sources and data used for the calculation of the 2011 emission figures.
Source categories and emission processes
One of the first steps in developing a methodology for estimating the emissions from mobile sources is making an inventory of the various mobile sources. In broad terms, the following mobile source categories are distinguished:
Road transport
Railways
National and international inland shipping (including recreational crafts)
Maritime shipping
Fisheries
Civil aviation
Non road mobile machinery (tractors, bulldozers, forklifts etc.)
Military shipping and aviation
For each source category, various emission processes are distinguished:
Combustion of motor fuels for propulsion;
Evaporation of motor fuels from the fuel system of vehicles;
Wear of tyres, brake linings and road surfaces due to road traffic;
Leakage and consumption of motor oil;
Wear of overhead contact lines and carbon brushes on trains, trams and metros;
Within the transport sector, several other emission sources are present that are being estimated in the Dutch PRTR by the MEWAT task force1 due to their specific effect on water quality. This concerns the following sources:
Anti-fouling on recreational boats;
Coatings and bilge water from inland waterway vessels;
Leakage of propeller shaft grease and spillage from inland waterway vessels;
Corrosion of zinc anodes on inland waterway vessels and locks;
Leaching from seagoing vessels and fishery vessels in harbours and national continental shelf;
Anodes of seagoing vessels and fishery vessels in harbours and on the national continental shelf. For more information about the methodologies, activity data and emission factors used to calculate the emissions from the above mentioned sources, please refer to: helpdeskwater.nl (task force: diffuse sources, task field: emission estimates), and to the Emissieregistratie en –Monitoring Scheepvaart2 (EMS) project (protocols, coatings and anodes).
Reporting requirements and formats
The emission figures from the national emission inventory (PRTR) are inter alia used for air quality modelling and for emission reporting under the UNECE Convention on Long-range Transboundary Air Pollution, the EU National Emission Ceilings Directive and the UN Framework Climate Change Convention. Because the reporting requirements differ, we distinguish three different emission categorizations in this report:
1. Actual emissions on Dutch Territory and the Dutch part of the Continental Shelf. This includes all emissions from mobile sources on Dutch territory, with the exception of non-LTO (landing and take-off cycle) emissions from aviation. The resulting emissions are inter alia used for the modelling of air quality.
2. IPCC emissions: Dutch emissions of greenhouse gases as reported to the United Nations and the European Union. Various aspects of this process take place due to the reporting obligations of the UN Framework Convention on Climate Change (UNFCCC) and the EU Greenhouse Gas Monitoring Mechanism. The emissions are calculated according to the IPCC regulations. The IPCC (Intergovernmental Panel on Climate Change) provides the scientific supervision of the implementation of the Kyoto Protocol [ref 68: IPCC,1997 and ref 69: MNP,2005]. The mobile source emission figures show a number of differences when comparing IPCC emissions with the actual emissions (1) on Dutch territory:
The greenhouse gas emissions by road transport are calculated on the basis of sales of motor fuels in the Netherlands, whereas the actual emissions are calculated on the basis of vehicle kilometres travelled on Dutch territory.
CO2 emissions from biofuels are reported separately in the IPCC figures and are
excluded from the national emission totals.
The greenhouse gas emissions by recreational craft are included in the emissions by road transport. It is not possible to differentiate motor fuel sales into road traffic and non-road traffic.
Emissions from maritime shipping and international inland shipping with origin or destination abroad are not included in the IPCC emission figures.
The IPCC emissions from civil aviation only contain emissions from inland flights. The actual emissions are based on all landings and take-offs (LTO cycles) in the Netherlands.
The IPCC emissions include emissions from military operations abroad. The actual military emissions are based on inland activities only.
3. NEC emissions: in 2001, the European Parliament and the Council of Europe approved a Directive concerning national emission ceilings for transboundary air pollution which contributes to acidification, soil eutrophication and tropospheric ozone formation. This Directive is referred to as the NEC Directive (National Emission Ceilings). Emissions from international maritime shipping are excluded from the NEC emission totals. Otherwise, the calculations of mobile source emissions are in accordance with the calculations of the actual emissions [ref 70: EG, 2003].
1
Methods task group for water quality
2
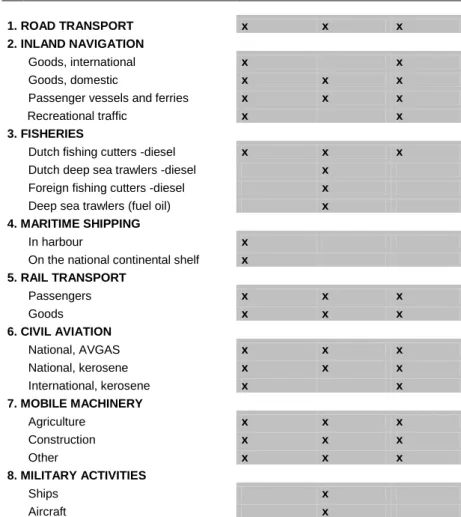
Table A provides an overview of the different emission sources that are taken into account in each of the three categorizations.
Table A
Emission sources for each type of reporting
Actual IPCC NEC
emissions 1) emissions 2) emissions 3)
1. ROAD TRANSPORT x x x
2. INLAND NAVIGATION
Goods, international x x
Goods, domestic x x x
Passenger vessels and ferries x x x
Recreational traffic x x
3. FISHERIES
Dutch fishing cutters -diesel x x x
Dutch deep sea trawlers -diesel x
Foreign fishing cutters -diesel x
Deep sea trawlers (fuel oil) x
4. MARITIME SHIPPING
In harbour x
On the national continental shelf x
5. RAIL TRANSPORT Passengers x x x Goods x x x 6. CIVIL AVIATION National, AVGAS x x x National, kerosene x x x International, kerosene x x 7. MOBILE MACHINERY Agriculture x x x Construction x x x Other x x x 8. MILITARY ACTIVITIES Ships x Aircraft x 1) All substances. 2) CO2, N2O and CH4. 3) NMVOC, SO2, NOx, NH3 and PM10
Shares and trends in emissions from mobile sources
Table B shows the emission totals for mobile sources in the Netherlands in 2011 as reported by the Task Force on Transportation (including non-road mobile machinery, fisheries and military activities) for all three emission categorizations. For each substance and emission categorization, the table also shows the share of transport in the total emissions in the Netherlands. The table shows that the actual emissions on Dutch territory are for the most part higher than the IPCC and NEC emissions, the difference being explained by the differences in methodologies used and differences in the source categories that are taken into account. The table also shows that mobile sources are responsible for a significant share of total CO2, NOx, NMVOC and PM10 emissions in the Netherlands.
The trends in the emissions of greenhouse gases and air polluting substances from mobile sources between 1990 and 2011 are shown in figures A and B respectively. Figure A shows that CO2 and N2O
emissions from mobile sources have increased by over 20% (CO2) and 40% (N2O) respectively since
1990, although in recent years emissions have decreased. Emissions of CH4 have decreased
throughout the time series. The same holds for the emissions of NOx, PM10 and NMVOC, as is shown
in figure B. Emissions of SO2 increased slightly in earlier years of the time series but have decreased
significantly since.
Tabel B
Emissions by mobile sources, 2011 totals
Emission Share in national emission
Actual IPCC NEC Actual IPCC NEC
mln kgs % CO 367 67 CO2 42348 38236 23 23 N2O 1.0 0.9 3.4 3.1 NH3 2.6 2.6 2.2 2.2 NOx 271 159 69 61 SO2 28.5 0.4 46 1.2 NMVOC 34.3 31 23 22 CH4 2.5 2.4 0.3 0.3 PM10 13.9 8.9 41 31
Figure A. IPCC greenhouse gas emission trends, mobile source totals
0 50 100 150 200 250 300 1990 1995 2000 2005 2010 1990=100 CO2 CH4 N2O
Figure B. NEC emission trends, mobile source totals
0 20 40 60 80 100 120 1990 1995 2000 2005 2010 1990=100
Outline of report
In Chapters 1 through 8 the methodologies used for calculating the emissions are described for each source category and for each process according to a fixed structure. This structure is generally used in the Dutch Emission Inventory for describing the calculation methods:
X.1 Introduction with a brief description of the process for which the calculation method is described and a reference to the documents where more information can be obtained. X.2 An overview of the contribution of the emissions to the national total and to the target group.
This indicates the relative importance of the source category for each substance. X.3 An extensive description of the process for which the calculation method is described. X.4 An explanation of the calculation method or methods used. In addition, this chapter indicates
which policy measures are expressed in the calculation and what effect this has.
X.5 Additional information about the origin and backgrounds of the activity data used, such as vehicle kilometres and fuel consumption.
X.6 An explanation of the emission factors used and the corresponding data quality codes. X.7 An explanation and description of the substance profiles used.
X.8 A description of the parameters on the basis of which the data are presented regionally . X.9 An explanation of the uncertainties in the information and a description of the way in which
the uncertainty estimate has been established.
X.10 A description of the aspects of the calculation that could be improved. X.11 A description of the way in which the calculation is verified.
X.12 Additional information (if applicable).
Chapter 9 pays attention to the determination of greenhouse gas emissions according to the IPCC regulations. In particular, it addresses the differences between the actual emissions and the IPCC emissions. Chapter 10 provides a brief summary of the methodological changes with respect to the previous reports on methods. Table 10.1 in the EXCEL-file gives an overview of the changes.
Appendix 1 provides a summary of the quality codes for the activity data, the emission factors and the emissions themselves (= combination of emission factor and volume).
1. ROAD TRAFFIC
1.1 Introduction
This chapter describes the methods that have been used for determining emissions from road traffic. Road traffic is defined as follows: all motorized vehicles that are licensed and which travel on the public road. Road traffic comprises, among other things, passenger cars, light duty vehicles, lorries, road tractors, buses, special vehicles (such as fire trucks and refuse trucks), motorcycles and mopeds. The emissions from road traffic are part of both the actual emissions and the IPCC and NEC emissions. The calculation of the actual and NEC emissions takes place using the same methodology, i.e. based on vehicle kilometres. The calculation of the IPCC emissions deviates from this; it is based on the sales of motor fuels. For more information on this topic, see the Introduction and Chapter 9 (IPCC method).
1.2 Contribution to the national emissions
Road traffic is one of the most important sources of air-polluting emissions in the Netherlands. Tables 1A and 1B below provide a general picture of this contribution.
Table 1A Share of road traffic in the national emissions, 2011
Actual IPCC NEC
emissions 1) emissions emissions
% CO 47 CO2 17 20 N2O 2.6 3.0 NH3 2.2 2.2 NOx 25 38 SO2 0.5 0.8 NMVOC 15 16 CH4 0.3 0.3 PM10 20 23
Table 1B Share of road traffic in the traffic target group emissions1), 2011
Actual IPCC NEC
emissions emissions emissions
% CO 70 CO2 73 89 N2O 77 95 NH3 99 99 NOx 37 62 SO2 1.0 68 NMVOC 66 72 CH4 80 89 PM10 48 74 1)
Including mobile machinery.
1.3 Description of the process
With the exception of a relatively small number of electric vehicles, road vehicles are equipped with a combustion engine for propulsion. In such engines, the chemical energy of fuels such as petrol, diesel and LPG is converted into mechanical energy. During this conversion process, various substances are emitted via the exhaust. In addition, emissions are created by the evaporation of motor fuels and coolants, the wear of brakes, tyres and the road surface, and the leakage and consumption of motor oil. Depending on the emission component, a specific calculation method has been chosen for the emission-causing processes:
Combustion emissions (via the exhaust)
Carbon monoxide (CO), volatile organic compounds (VOC)3, nitrogen oxides (NOx), nitrous oxide (N20), ammonia (NH3) and particulate matter (PM10). These emissions depend primarily on the
type of fuel, the engine technology and exhaust gas aftertreatment technology as well as driving behaviour. These emissions are calculated by multiplying vehicle performance figures (vehicle kilometres) and emission factors (in grams per vehicle kilometre). Since 2006 the emission factors are calculated with the empirical emissions model VERSIT+.
Sulphur dioxide, carbon dioxide and heavy metals (including lead). These emissions depend on fuel consumption and the type of fuel. The emission calculation takes place by multiplying the fuel consumption with emission factors in grams per litre of fuel consumed (based on the content of sulphur, carbon and heavy metals in the fuel).
VOC components. These components comprise a large group of divergent substances. VOC in exhaust gas can be subdivided into alkanes, alkenes, aromatics (including benzene), polycyclic aromatic hydrocarbons (PAHs) and chlorinated hydrocarbons. Calculation of the various VOC components takes place by multiplying the total VOC emission with the VOC profile, to obtain the composition of the VOC according to substance groups (e.g. aromatics, alkanes) and individual chemical substances (e.g. benzene, formaldehyde).
Evaporative emissions (from the fuel system of petrol vehicles)
VOC total and VOC components. VOC emissions caused by evaporation are calculated by multiplying the number of vehicles with emission factors expressed in grams per vehicle per day. The emission factor depends on the year of manufacturing of the vehicle because the demands regarding the maximum quantity of evaporation from a vehicle have become increasingly strict over the years.
Emissions caused by wear processes
PM10 emission caused by the wear of tyres, brakes and the road surface. Calculation
takes place by multiplying the total particle matter emission per tyre per vehicle kilometre with a factor for the share of PM10 in the total emission; then this emission factor is
multiplied by the number of tyres per vehicle and by the number of vehicle kilometres per vehicle category;
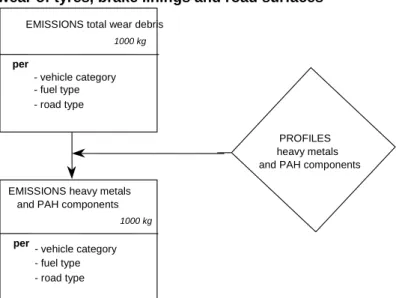
Heavy metals and PAHs caused by the wear of tyres, brakes and the road surface. In many cases, particulate matter emission originating from the wear of tyres, brakes and the road surface contain heavy metals and PAHs. Calculation takes place by means of profiles that describe the content of heavy metals and PAHs in the total particulate matter emission.
Other emissions
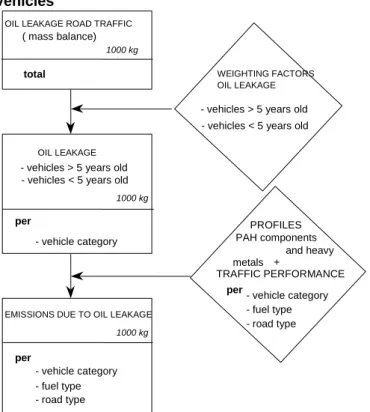
Heavy metals and PAHs from the leakage of engine oil. Calculation takes place by combining data about total engine oil leakage (based on the amount of gaskets) per vehicle per year and the content of heavy metals and PAHs in lubricants;
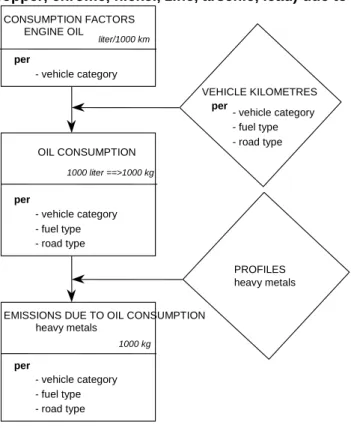
Heavy metals due to the consumption (combustion) of engine oil. Calculation takes place by combining data about the total consumption of engine oil (leakage via the piston rings into the combustion chambers) per vehicle per year and the content of heavy metals and PAHs in lubricants.
1.4 Calculation methods
1.4.1 Actual emissions and NEC emissions
Combustion of motor fuels; CO, NOx, N2O, VOC, CH4, particulate matter (PM10/PM2,5), and NH3
This section describes the actual emissions of CO, NOx, N2O, VOC, particulate matter (PM10) and NH3
that result from combustion of motor fuels. These emissions depend on the type of fuel, the engine technology and exhaust gas aftertreatment technology (vehicle type) as well as on driving behaviour. These emissions are calculated by multiplying figures on vehicle performance (vehicle kilometres) and emission factors (in grams per vehicle kilometre). The emission factors are derived annually from measurement data under test conditions.
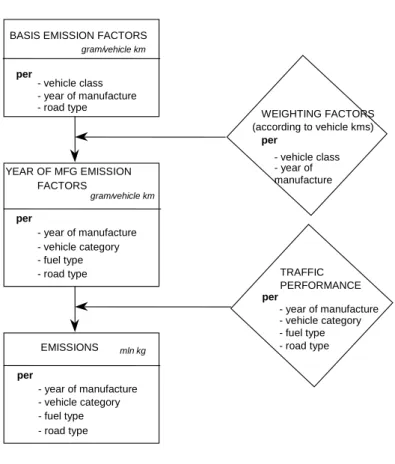
Figure 1.1 below shows the calculation steps in general terms for estimating the combustion emissions of CO, VOC, NOx, N2O, NH3, and PM10 due to road traffic. The calculation begins with determining the
basic emission factors (grams per vehicle kilometre) per vehicle class per road type4. The vehicle class is defined by the vehicle category (passenger cars, light duty vehicles, etc.), weight class, type of fuel and vehicle class. Table 1.1 shows the vehicle categories used according to type of fuel and weight class. Table 1.2, for example, shows a passenger car with a direct fuel injection (DI) diesel engine, an inertia weight of more than 1150 kg and the "Euro 2" vehicle class. The "Euro" classes are important from the viewpoint of calculating emissions. Under pressure from the European Union, vehicles came onto the market beginning in about 1986 with specific technologies to reduce the regulated emissions (CO, VOC, NOx and PM10) per travelled kilometre. The EU periodically reduces
the emission standards: this is the reason for the indications (Euro1, Euro2, Euro3, etc.) in Table 1.2. The higher the Euro number, the stricter the emission demands become.
When determining the so-called basic emission factors per vehicle class, a distinction is made according to the road type (average traffic situation) on which the vehicle travels and according to the age of the vehicle (statistical year minus the year of manufacturing). The statistical year is the year for which the emission is reported. Road type refers to travelling within the urban area (RT1), on rural roads (the roads outside the urban area with a speed limit of 80 kph; RT2) and on motorways (RT3). The distinction between road types is necessary because the emissions per kilometre per road type can differ greatly not only as a result of differences in maximum speed, but also as a result of differences in driving dynamics (degree of acceleration, deceleration, constant driving and idling). In addition, cold starts, which are characterized by relatively high emissions, take place especially often within the urban area. The distinction in the year of manufacturing is necessary because there is a relationship between the age of a vehicle and its emissions per kilometre; a vehicle that was built in 1990 is five years old in the statistical year 1995, and in the statistical year 2000 it would be 10 years old.
The PM10 emission factors are corrected for the presence of retrofit diesel soot filters in Euro1 and Euro2 vehicles (see table 1.41). The PM10 reductions by factory installed filters have been already taken into account in the TNO basic emission factors (see chapter 1.6.1).
In 2011 TNO carried out a project on the emissions by two wheeled vehicles [ref 130: Dröge, R. et al]. The results have been used in the 1990-2011 emission calculations.
No direct data are available about the annually driven number of kilometres per vehicle class, but this information is available according to type of fuel and year of manufacturing based on the “National Car Passport” (see Section 1.5.1). Therefore it is possible to derive vehicle kilometres for each type of fuel and for each year of manufacturing. For these reasons, the basic emission factors are aggregated into year-of-manufacturing emission factors. To this end, the basic emission factors per vehicle class are weighed with the share in sales of new vehicles during a specific year (Tables 1.3 and 1.4). An example of the result would be a year-of-manufacturing emission factor for an average passenger car with a diesel engine manufactured in 1995 which travels within the urban area. Tables 1.13 - 1.15 show as an example the year-of-manufacturing factors for the statistical year 2011 for passenger cars, motorcycles and mopeds (1.13), light duty vehicles and special vehicles (1.14) and heavy duty vehicles (1.15).
4
Figure 1.1 Calculating emissions from road traffic, actual emissions of CO, VOC, NOx, N2O,
NH3, and PM10 due to combustion of motor fuels
The year of manufacturing emission factors are then multiplied by the vehicle kilometres travelled (per year of manufacturing and per vehicle category – the lowest diamond in Figure 1.1) to arrive at the emissions per vehicle category per road type. Until 1997 the allocation of vehicle kilometres travelled to road type is based on the figures from Statistics Netherlands about the use of roads (see 1.5.1). Recent allocation figures are based on a survey by the Goudappel Coffeng Agency commissioned by the Emission Registration
Section 1.5.1 addresses the required vehicle kilometres travelled data. The methodology for ascertaining the basic emission factors and aggregating this data according to year of manufacturing factors is described in Section 1.6.1.
The emissions of individual volatile organic substances are calculated by using a substance profile. This is described in Section 1.4.1.
Combustion of motor fuels; SO2, CO2 and heavy metals
Figure 1.2 shows the calculation method used for the emissions of SO2, CO2 and heavy metals by
road traffic resulting from combustion. Compared with the method described above for calculating carbon monoxide combustion emissions, for example, the calculation method for SO2, CO2 and heavy
metal emissions caused by road traffic is much simpler. The reason is that the emissions of these substances can be directly related to the fuel consumption of vehicles and to the type of fuel. Regarding the method of ascertaining the fuel consumption per vehicle, fuel type and road type (right diamond in Figure 1.2), see Section 1.5.1. The final emission calculation involves multiplying emission factors (gram/litre of fuel) with the fuel consumption per vehicle category, fuel type and road type.
BASIS EMISSION FACTORS
gram/vehicle km per - vehicle class - year of manufacture - road type YEAR OF MFG EMISSION FACTORS gram/vehicle km per - year of manufacture - vehicle category - fuel type - road type EMISSIONS mln kg per - year of manufacture - vehicle category - fuel type - road type WEIGHTING FACTORS per - vehicle class - year of manufacture TRAFFIC PERFORMANCE per - year of manufacture - vehicle category - fuel type - road type (according to vehicle kms)
Figure 1.2 Calculating emissions from road traffic, actual emissions of SO2, CO2 and heavy
metals (cadmium, copper, chrome, nickel, zinc, lead, vanadium) due to combustion of motor fuels
The fuel consumption (the diamond in Figure 1.2) is derived by multiplying fuel consumption factors with the number of kilometres travelled by vehicles in the Netherlands. The total CO2 emission from
road traffic in the Netherlands is calculated in a "bottom-up" fashion: the emissions of individual vehicle categories are added to arrive at total emissions. The "bottom up" method will be hereinafter referred to as the "Netherlands territory method". In Chapter 9 of this report, another method of estimating CO2 emissions from traffic is discussed: a "top-down" method, also called the IPCC
method. Chapter 9 also explains why two calculation methods for greenhouse gas emissions from traffic in the Netherlands are used in parallel.
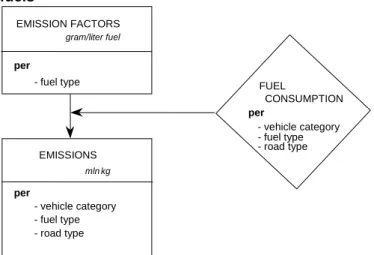
Combustion of motor fuels; VOC components and PAH components
The calculation of the combustion emissions of approximately 70 VOC components, including methane and PAHs, takes place by using profiles. First of all, as described in Section 1.4.1, the combustion emissions of VOC are calculated for each vehicle category, fuel type and road type. For each fuel type, so-called VOC profiles are established (Tables 1.34A-E). In addition, for petrol-fuelled vehicles a distinction is made between those with and without a catalyst, because the catalyst oxidizes certain VOC components more effectively. The profile indicates the fractions of the various VOC components in the total VOC emission. By multiplying the total VOC emission with the fractions from a profile, the emissions of individual VOC components are estimated. The VOC and PAH profiles for each fuel type were obtained from the literature study conducted by TNO-MEP [ref 55: VROM,1993]. For diesel powered vehicles from year of construction 2000 and later and petrol fuelled vehicles equipped with a 3-way catalytic converter, TNO has established new profiles [ref. 125: Broeke, Hulskotte, 2009]. The new profiles (tables 1.34B and 1.34D) have been used for the first time in the calculation of the definite figures of 1990-2009. EMISSION FACTORS gram/liter fuel per - fuel type EMISSIONS mln kg per - vehicle category - fuel type - road type FUEL CONSUMPTION per - vehicle category - fuel type - road type
Figure 1.3 Calculating emissions from road traffic, emissions of VOC and PAH components caused by combustion of motor fuels
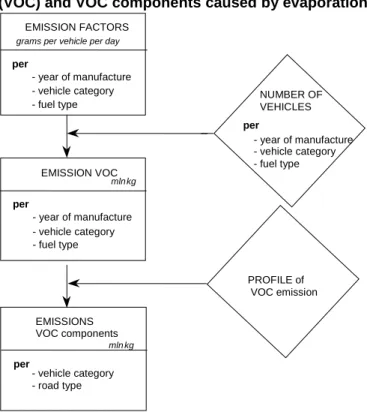
Evaporation of motor fuels; VOC and VOC components
Petrol evaporates to some extent from vehicles when they are parked, when they cool off after travelling and while they are travelling. In the Netherlands the evaporative emissions are calculated according to the methodology described in the European ‘Emission Inventory Guidebook 2007’ [Ref. 116: EEA, 2007]. This methodology distinguishes three mechanisms which are primarily responsible for the evaporative emissions from petrol driven vehicles (in case of LPG, diurnal emissions only):
1. Diurnal emissions
Diurnal emissions are evaporative emissions caused by a daily variation in the outdoor air temperature. A rise in temperature will cause an increase of the amount of petrol vapour in the fuel system (tank, fuel pipes and fuel injection system). A part of this vapour is emitted (together with air) from the system to prevent overpressure (tank breathing). Diurnal emission mainly originate from the fuel tank and are not dependent on vehicle use. The amount of diurnal emissions is expressed in grams per vehicle per day.
2. Running losses
The running losses are evaporative emissions which occur while driving. The heat of the engine leads to warming up of the fuel in the fuel system and by that to evaporation of a fraction of the fuel. In modern cars the extent of use has no influence on the fuel temperature in the tank. Due to this the running loses (and also hot and warm soak emissions) of these cars are very low. Running loses are expressed in grams per car kilometre.
3. Hot and warm soak emissions
Hot and warm soak evaporative emissions are also caused by the engine heat and occur when a warm engine is turned off. The difference between hot soak and warm soak emissions is related to the engine temperature: hot soak occurs when the engine is completely warmed up. The evaporation of petrol is less when the engine is not yet entirely warmed up. This is this case with warm soak. Hot and warm soak emissions are expressed in grams per vehicle per stop.
The amount of petrol vapour released from these three mechanisms strongly depends on outdoor temperature (variations), the fuel volatility and the type of fuel injection. Furthermore running losses depend on vehicle use. Due to the application of carbon cannisters in new cars since the early nineties the evaporative emissions have been reduced strongly. These cannisters adsorb the majority of the emitted petrol vapour and lead this back into the engine.
The Emission Inventory Guide Book includes a generic set of emission factors for each of the
PROFILE of VOC emission per fuel type EMISSION VOC mln kg per - vehicle category - fuel type - road type EMISSIONS mln kg per - year of manufacture - vehicle category - fuel type - road type
has been developed for the Dutch situation (see table 1.17). For this purpose data on the composition and car kilometres of the Dutch vehicle fleet have been used. It has been assumed that the introduction of cannisters and fuel injection took place simultaneously with the introduction of three-way catalytic converters. The average outdoor temperatures in the Netherlands have been determined on the basis of data from the Dutch Meteorological Institute (KNMI) on the average temperatures during 1990-2006. The basic emission factors have been converted into emission factors per vehicle per day for the Dutch situation (see table 1.18). Finally it has been assumed that 90% of the emissions take place in urban areas.
The evaporative emissions of motor cycles and mopeds are likewise been based on emission factors from the Emission Inventory Guidebook 2007.
Petrol vapour released during tanking is attributed to the fuel circuit (filling stations) and not to vehicle use. Due to the low volatility of diesel fuel the evaporative emissions of diesel powerded vehicles have been assumed negligible.
Figure 1.4 Calculating emissions from road traffic, emissions of volatile organic substances (VOC) and VOC components caused by evaporation of motor fuels
Wear of tyres, brakes and road surfaces; PM10 and PM2,5
Tyre wear of road vehicles
Vehicle tyres experience wear due to the friction between the tyres and the road. This causes the emission of tyre particulate matter emission. The emission of tyre particulate matter is calculated by multiplying vehicle kilometres and emission factors (milligrams of tyre particulate matter emission per kilometre). The emission factors are calculated as the total mass loss of tyres resulting from the wear process and the number of tyres per vehicle category. The emission factors used are shown in Table
1.19A.
The only macro-component that is emitted in large quantities is particulate matter (PM10). It is
assumed that 5% of the tyre particulate matter emission can be considered to be particulate matter, the rest concerns larger fragments that fall back immediately onto the ground or water surface. This share of 5% of particulate matter in the total mass of tyre particulate matter emission is an uncertain factor in the calculation of particulate matter emissions caused by tyre wear [ref 4: Van den Brink, 1996]. The share of PM2,5 in PM10 is estimated 20% (see table 1.42)
Wear of brake linings of road vehicles
Similar to the wear of tyres, the vehicle kilometres travelled and emission factors per travelled kilometre determine the emissions caused by the wear of brake linings. The emission factors are
EMISSION FACTORS
grams per vehicle per day
per - year of manufacture - vehicle category - fuel type EMISSION VOC mln kg per - year of manufacture - vehicle category - fuel type NUMBER OF VEHICLES per - year of manufacture - vehicle category - fuel type PROFILE of VOC emission EMISSIONS VOC components mln kg per - vehicle category - road type
shown in Table 1.19A. The emission factors originate from the fact sheet "emissions of brake linings" drawn up by the Centre for Water Management of the Ministry of Public Works and Water Management. [ref 107: CWM]. It is assumed that the material emitted from brake linings is comprised for 49% of particulate matter (PM10) and for 20% of larger fragments. The remainder of the material (31%)
remains "on the vehicle".
The share of PM2,5 in PM10 is estimated 15% (see table 1.42).
Wear of road surface caused by road vehicles
The emissions of road particulate matter are calculated in the same way as the emissions of tyre and brake lining particulate matter. To link up with the earlier estimates of total road wear [WSV, 1994] it is assumed that the emission of road particulate matter is 1.6 times as large as that of tyre particulate matter emission. This factor is assumed to be independent of the statistical year. For the emission factors is referred to Table 1.15. In the same way as with tyre wear, it is assumed that 5% of the road particulate matter emission comprises particulate matter (PM10) and that the remainder therefore
comprises larger fragments.
The share of PM2,5 in PM10 is estimated 15% (see table 1.42)
Figure 1.5 Calculating emissions from road traffic, emissions of particulate matter (PM10)
caused by wear of tyres, brake linings and road surfaces
Wear of tyres, brakes and road surfaces; heavy metals and PAHs Heavy metals in tyre particulate matter emission
The emissions of heavy metals caused by tyre wear are calculated by applying a profile of the composition of the total tyre material. This composition is shown in Table 1.29B. The heavy metals trapped in particulate matter are emitted to the air because it is assumed that 100% of particulate matter remains airborne. Heavy metals trapped in coarse particles fall back to the soil or the surface water. Within the urban area, it is assumed that 100% of coarse particles end up in water. Outside the urban area, a figure of 10% is used, and therefore 90% end up in the soil [ref 118: RWS Centre for Water Management].
Heavy metals in brake particulate matter emission
The emissions of heavy metals caused by the wear of brake linings are calculated by applying a profile
EMISSION FACTORS total wear debris
mg/vehicle km
per
vehicle category
EMISSIONS total wear debris
1000 kg per - vehicle category - fuel type - road type per - vehicle category - fuel type - road type VEHICLE KILOMETRES 1000 kg per - vehicle category - fuel type - road type PROFILES particulate matter/ larger debris EMISSIONS particulate matter
Heavy metals in road surface particulate matter emission
The emissions of heavy metals from road surface wear were calculated in the past by using a profile of the composition of such fragments. A recent literature search showed that hardly any heavy metals are released from road surfaces, so calculations of this component are no longer carried out [ref 117: RWS Centre for Water Management].
PAHs in road particulate matter emission
In a recent literature search by TNO commissioned by the Centre for Water Management, new PAH emission factors have been introduced [ref 117: RWS Centre for Water Management]. This search shows that in 1990 85% of the binders used in rural road and motorway surfaces were tar-based (TAG). After 1991 TAG is no longer applied and replaced by asphalt with bituminous binding agents. Because of this the PAH-content of road surfaces is lowered by a factor of 1,000 to 10,000. The PAH-emissions from road surfaces constructed after 1990 are therefore negligible. PAH emissions only occur from driving on roads with a surface from before 1991. Due to the gradual replacement of asphalt the old TAG is disappearing more and more. It is estimated that in 2000 24% of the motorways and 51% of the rural roads contain TAG-asphalt. In 2004 this is reduced to 0% of the motorways and 27% of the rural roads. On roads in built-up areas a major part of the road network consists of non-asphalt roads. It is assumed that by now all asphalt applied before 1991 on roads in built-up areas, has been replaced.
Effects of open graded asphalt mixes
On motorways on which open graded asphalt mixes5 are used, the coarse particles that fall onto the road surface are partially trapped and are not washed to the soil or surface water. Because open graded asphalt mixes are periodically cleaned (approximately twice per year), these "trapped" coarse particles (containing heavy metals) are removed from the environment. Based on a memorandum from Centre for Water Management from 2000, [ref 6: Roovaart, J. van den] it can be determined that the emission of heavy metals to the soil and the water for open graded asphalt mixes is between 11 and 40 times lower than for closed graded asphalt mixes. For PAHs, this is a factor of 2.5. In the meantime, a large percentage of the motorways have been provided with a top layer of open graded asphalt mixes. Table 1.32(B) shows this percentage. The table also shows the factors for heavy metals and PAHs with which the total quantities of heavy metals and PAHs that are deposited on open graded asphalt mixes must be multiplied to calculate the heavy metals and PAHs that are washed off the road surface. The table shows that in 2004, due to the application of open graded asphalt mixes, the emission of heavy metals to the soil and surface water near motorways is approximately 40% lower than the case would be without this application.
Allocation to soil and surface water
The allocation of the coarse particle emissions to water and soil is different for the urban area, rural roads and motorways, because the washing down characteristics for these road types differ. When the coarse particles fall within the urban area, a percentage is washed away via the sewage system into the surface water, and this material is therefore indirectly considered to be emission to surface water. The emission factors of tyre wear, brake lining wear and road surface wear, expressed in mg per vehicle kilometre, are shown in Table 1.19A. The profiles with respect to the allocation to water and soil (and air) are shown in Table 1.19B. For the backgrounds used to ascertain these emission factors and profiles there is referred to the fact sheets of the Centre for Water Management: ‘Emissions from brake linings’, ‘Emissions from road traffic tyre wear’, and ‘Emissions from the wear of road surfaces due to road traffic’ [ref 107, 118, and 117 : RWS Centre for Water Management].
5
Figure 1.6 Calculation of emissions from road traffic, emissions of PAH components and heavy metals (cadmium, copper, chrome, nickel, selenium, zinc, arsenic, vanadium) caused by wear of tyres, brake linings and road surfaces
Leakage of engine oil; heavy metals and PAHs
The average oil leakage per vehicle per kilometre travelled has been calculated in the past, derived from the total oil leakage in that year and the total number of vehicle kilometres. This calculation is based on measurements on roads that were interpreted by Feenstra and Van der Most [ref 7: Feenstra and Van der Most, 1985] and resulted in an average leakage loss of 10 mg per vehicle kilometre. The leakage losses for the various vehicle categories in road traffic are calculated based on a set of factors, of which an example is given in Table 1.20. These factors are based on a number of assumptions that are listed in Table 1.21. One of the assumptions is that older vehicles have more leakage than younger vehicles (see also Figure 1.7).
Heavy metals in leaked engine oil
The emission of heavy metals due to the leakage of engine oil depends on the composition of the motor oil. The heavy metal fractions in engine oil are shown in Table 1.33B.
PAHs in leaked engine oil
The calculation of the emission of PAH components due to oil leakage takes place in the same way as the calculation of heavy metals. Table 1.33B be shows the composition used in the calculations (fractions of PAH components in engine oil).
EMISSIONS total wear debris
1000 kg
per
- vehicle category - fuel type - road type
EMISSIONS heavy metals and PAH components
1000 kg per - vehicle category - fuel type - road type PROFILES heavy metals and PAH components
Figure 1.7 Calculation of emissions from road traffic, emissions of heavy metals (cadmium, copper, chrome, nickel, zinc, arsenic, lead) and PAHs due to leakage of engine oil from vehicles
Consumption of engine oil; heavy metals
Oil consumption can be estimated with the vehicle kilometres and consumption factors for engine oil (Figure 1.8). It is assumed that the oil consumption of motor vehicles is 0.2 litre per 1000 km. For motorcycles and mopeds the consumption is assumed to be 0.1 and 0.67 litre per 1000 km respectively. Engine oil leaks via the piston rings into the combustion chamber of the engine, where it is burnt. Because this concerns a combustion emission, it is assumed that the emissions of other substances have already been registered via the exhaust gas emissions. The heavy metals are an exception. These are considered to be extra emissions and therefore are calculated separately by multiplying the consumption of engine oil and the engine oil profile (see Table 1.33B).
OIL LEAKAGE ROAD TRAFFIC
( mass balance)
1000 kg
total
1000 kg
EMISSIONS DUE TO OIL LEAKAGE 1000 kg per - vehicle category - fuel type - road type PROFILES PAH components and heavy metals WEIGHTING FACTORS OIL LEAKAGE
- vehicles > 5 years old - vehicles < 5 years old
OIL LEAKAGE
- vehicles > 5 years old - vehicles < 5 years old
- vehicle category per TRAFFIC PERFORMANCE per - vehicle category - fuel type - road type +
Figure 1.8 Calculation of emissions from road traffic, emissions of heavy metals (cadmium, copper, chrome, nickel, zinc, arsenic, lead) due to consumption (combustion) of engine oil
1.4.2 IPCC emissions
The emissions of the greenhouse gases CO2, CH4 and N2O due to traffic are calculated in the
Netherlands in two ways: bottom-up and top-down. The bottom-up method is used for calculating the actual emissions; the top-down method is used for the IPCC emissions. In Chapter 9, the differences between the bottom-up and top-down methods will be explained in greater detail.
Top-down
As part of the international policy efforts regarding climate change, which are coordinated by the Intergovernmental Panel on Climate Change (IPCC), it is mandatory to conduct an annual greenhouse gas emission inventory. To prevent overlap between the data from various countries, the IPCC recommends calculating greenhouse gas emissions based on fuel sales [ref 8: Thoughton et al., 1997]. Sales data for fuels in the Netherlands, as in most other countries, are only known at the aggregate level; for example, the sales to all road traffic are known. The aggregated sales data can be converted into emission data per vehicle category; in this way, in a manner of speaking, calculations are conducted in a top-down fashion. In the present report, the top-down method is referred to as the IPCC method. The aggregated sales data (in Joules) are converted into emission data per type of fuel using CO2, CH4 and N2O emission factors (kg/joule) per fuel. These emission factors are listed in
Section 1.6.2. The methodology is in accordance with the IPCC requirements [ref 68: IPCC, 1997]. Section 1.5.2 provides information about the sales of motor fuels.
Emissions (kg) =
type of fuelfuel sales (kg) * combustion value (MJ/kg) * Emission factor (kg/MJ)
According to the IPCC-regulations the CO2 emission from the combustion of biofuels is not included in
the figures. Tabel 1.31 shows the sales of total motor fuels (including biofuels) as well as biofuels, as reported by the CBS energy statistics (see the hyperlink under the table).
CONSUMPTION FACTORS ENGINE OIL
liter/1000 km
1000 liter ==>1000 kg
EMISSIONS DUE TO OIL CONSUMPTION heavy metals 1000 kg per - vehicle category - fuel type - road type PROFILES heavy metals OIL CONSUMPTION per VEHICLE KILOMETRES per - vehicle category - fuel type - road type - vehicle category per - vehicle category - fuel type - road type
1.5 Activity data
As indicated in Section 1.3, three types of activity data are required to calculate emissions: vehicle kilometres travelled, fuel consumption and the number of vehicles. Vehicle kilometres travelled are derived from the total fleet of vehicles in the Netherlands and the average kilometres travelled by Dutch vehicles in the Netherlands, increased by the number of kilometres that are travelled in the Netherlands by non-Dutch drivers. The fuel consumption is derived from the number of vehicle kilometres and the specific fuel consumption (km/l).
1.5.1 Actual and NEC emissions Vehicle fleet
The basic statistics for the size of the vehicle fleet in the Netherlands originates from Statistics Netherlands. This organization acquires its data from the Road authorities RDW, which register information about all vehicles with a Dutch license plate, including vehicle weight, fuel type and year of manufacturing. For each vehicle category, Statistics Netherlands (StatLine) provides detailed tables (see Statistics Netherlands, StatLine and the survey description in Dutch). Tables 1.5 and 1.6 summarize this information for light duty vehicles (less than 3.5 tonnes gross vehicle weight) and heavy duty vehicles.
Average annual number of kilometres
The average annual number of kilometres of road traffic (see Table 1.7) originates from four sets of statistics:
The Dutch National Travel Survey 1990-2003 (in Dutch: Onderzoek Verplaatsingsgedrag - OVG) from Statistics Netherlands (CBS) [ref1: CBS1]. From 2004 to 2009, this survey has been conducted by the Transport Research Centre of the Directorate for Public Works and Water Management; it then was called the MobiliteitsOnderzoek Nederland (MON) 6. The OVG/MON forms the basis for
the total inland kilometres of Dutch passenger cars and mopeds. Due to doubts about the reliability, the results of the 2008 and 2009 surveys have not been published by CBS and have not been used in the emission calculations. By now the execution of the survey is back to the CBS as OviN. (Onderzoek verplaatsingen in Nederland). Due to a change in the research design there is a break in the series as compared to the former Travel Surveys OVG and MON. There are no comparable data available yet.
The odometer readings compiled by the National Car Passport Foundation (NAP). From it’s database the average yearly mileages (Dutch vehicles) can be derived per year of construction and fuel type. The data include kilometres abroad.
The data of lorries and road tractors from 1990-1993 and buses from 1990-1997 have been derived from the BedrijfsVoertuigenEnquête7[ref 3: CBS3] (Commercial vehicle survey). The vehicle kilometre data for lorries and road tractors from 1994-2000 have been extrapolated by means of economical growth data for the transport sector.
The use of motorcycles in the Netherlands [ref 19: CBS6, 1993]. In 2012 and 2013 a small panel survey will be conducted in order to update the information on the use of motorcycles. It turned out that it was not possible to provide the required information due to a lack of odometer readings from motorcycles in NAP
Descriptions (in Dutch) of the CBS-surveys on the traffic performance of passenger cars, vans, buses and lorries/road tractors can be found on the CBS-website. In case of the vehicle kilometres of buses a comprehensive method description, including results is available on the CBS website [ref 126: Molnár-in’t Veld en Dohmen-Kampert, 2011]. In this publication also the basic method for the calculation of vehicle kilometres is described next to the specific issues related to buses.
Vehicle kilometres of non-Dutch drivers
Information from several sources has been used to calculate the vehicle kilometres travelled in passenger cars in the Netherlands by non-Dutch drivers.
6
Netherlands Travel Survey
7
These vehicle kilometres are devided into kilometres including overnight stay (holidays, business trip) and kilometres without overnight stay (commuting, shopping, family visits, day trips).
A CBS-survey on acommodations during 1998-2010 has been used to estimate the number of kilometres with overnight stay.The estimation of kilometres without overnight stay is based on a German survey into traffic intensity at 9 German-Dutch border-crossings, carried out in 1998, 2003 and 2008. The years in between have been interpolated and 2008 has been extrapolated until 2011. The traffic performance of foreigners during 1990-1997 has been extrapolated with the use of data from the Dutch Mobility Survey (OVG) and the ratio between the kilometres by Dutch citizens and foreigners during 1998-2004.
The vehicle kilometres for vans are based on the odometer readings database (NAP) in combination with the vehicle characteristics data from the Road Authorities (RDW). To divide the total of vehicle kilometres for vans by territory, data are used from the Goods Transport Survey, Eurostat, and the 1993 survey of Commercial Vehicles (Bedrijfsvoertuigenenquête). The use of vans is largely regional. The average trip distance is 32 kilometres. Vans are used by professionals like construction workers, tradesmen, technicians, catering staff, care staff and for parcel delivery etc. Unlike transporters that use lorries and road trans, drivers of vans do not make many large trips. However, if they cross the border it will be often limited to border traffic. This applies not only to the use of Dutch vans but also for foreign vans. Unfortunately there are no data on the kilometres driven with foreign vans on Dutch territory. We therefore made the assumption that the vehicle kilometres driven by Dutch vans outside the Netherlands, are more or less equal to those of foreign vans on Dutch territory. From the Goods Transport Surveys from 1997 to 2008 is derived that the kilometres of Dutch vans on foreign territory is on average 4 percent of the total kilometres driven. According to the assumption made, the total kilometres of foreign vehicles driven on Dutch territory has been equated with Dutch vehicle kilometres abroad.
The vehicle kilometres travelled with foreign trucks [ref 23: CBS10] are based on the statistics concerning "goods transport on the roads8" as well as similar data based on Goods Transport Surveys from other EU countries as collected by Eurostat. The vehicle kilometres travelled with foreign buses are determined by using a model which is divided into 4 sections. The main sources per section are:
1. Transport by foreign coaches in the Netherland for stays of more than one day.The main source is a CBS tourism survey on accomodation [CBS, 1998-2009] with data concerning the number ofguests, overnight stays and destinations per country of origin. Travelled distances are calculated with a route planner.
2. Transport by foreign coaches in the Netherlands for day trips (so without overnight stays). The main sources are a CBS survey on daytrips and ‘UK Travel Trends’.
3. Transport by foreign coaches through the Netherlands (drive through). For this purpose data have been used from ‘UK Travel Trends’ en the Belgian Travel Survey. In addition to this a route planner was used to calculate distances from border to border.
4. Transport by foreign buses in the Netherlands as part of regular bus services in the border regions. For this purpose information has been used from timetables (http://www.grensbus.nl/" and "http://wiki.ovinnederland.nl). Besides this Google Maps was used for a division of the bus lines into kilometres inland and abroad.
Also in case of the estimation of foreign coaches in the Netherlands several additional sources from different countries have been consulted, for instance:
Report “Reiseanalyse Aktuell RA” (Forschungsgemeinschaft Urlaub und Reisen (FUR), 2002-2010): the percentage of holiday trips by Germans by bus, to the Netherlands, and to Western Europe, and the total number of holiday trips of 5 days and longer.
Statistics on incoming Tourism (CBS, 2006): The percentage of foreign guests coming to the Netherlands by bus.
The publication ”Bustransport of passengers” (Eurostat/DG Tren, 1990-2000): for the number of passenger kilometres per bus or coach per EU country
The publicatie "EU energy and transport in figures; statistical pocketbook 2011" (Eurostat /EC,1990-2008): traveller kilometres per bus or coach per EU country.
The publication "Statistisches Jahrbuch 2004" (Statistisches Bundesamt, 2004): total number of trips per bus to the Netherlands.
"Reisonderzoek" (Algemene Directie Statistiek en Economische Informatie, 2000-2009) Belgium: total number of trips to the Netherlands by bus.
"UK Travel Trends" (Office for National Statistics, 2000-2010): total number of trips to the Netherlands, totals and by bus
"Movimientos turísticos de los españoles (FAMILITUR)" (Instituto de turismo de Espana, 1999-2011): percentage travels by bus.
More information about vehicle kilometres, method descriptions and results (in Dutch) can be found in: Verkeersprestaties autobussen, Methodebeschrijving en resultaten [ref 126: Molnár-in’t Veld en Dohmen-Kampert, 2011].
Vehicle kilometres by road traffic, totals
The traffic data used in the emission calculations are shown in tables 1.7 to 1.11 of the set of tables. A major part of these date has been published in CBS Statline, namely the vehicle kilometres of passenger cars, vans, lorries, road tractors and buses.
Allocation of vehicle kilometres to road category
The emission factors (see previous section) are generally differentiated according to three road types: Roads within the urban area
Motorways
Other roads outside the urban area (rural roads).
In order to calculate emissions, the vehicle kilometres travelled must also be differentiated according to road type. To allocate vehicle kilometres travelled to the above road types, data from Statistiek van
de wegen9 have been used in the past [ref 18: CBS5]. The most recent data relate to 1997. Due to all sorts of problems it was impossible to bring these figures up to date. For this reason the Goudappel & Coffeng Agency performed an inquiry, commissioned by the Emission Registration, into the allocation of vehicle kilometres. The results and backgrounds can be found on the site of the Emission Registration in the report ‘Onderzoek naar de wegtypeverdeling en samenstelling van het wegverkeer’. The results refer to 2007. Based on the surveys mentioned above, table 1.12 shows the allocation according to road type for 1990, 1995, 2000 and 2005-2011.
Share of vehicle classes in the vehicle kilometres per vehicle category
The emission factors (see previous section) are frequently differentiated per vehicle category according to various weight classes and vehicle classes (the basic emission factors). The basic emission factors are aggregated into year-of-manufacturing emission factors based on the share of the weight classes and vehicle classes in the sales of new vehicles during a specific year. It is assumed that the number of kilometres per year is independent of the vehicle class. The weighting according to weight class is based on the database of the National Car Passport Autopas (NAP) [ref110: NAP, 2006]
and BVE [ref3: CBS]. Tables 1.3 and 1.4 contain weighting factors to aggregate the basic emission factors to year of manufacturing factors. For more information, see Section 1.6.1.
Fuel consumption of road traffic
Fuel consumption is derived from the vehicle kilometres travelled and specific fuel consumption (km/l), originating from surveys (now abolished) such as the PAP (Passengercar Panel), the BVE (Commercial vehicles), and the motorcycle owners survey. These specific fuel consumption figures urgently require revision. As figures about energy consumption are mainly of interest for the determination of CO2 emissions and for policy purposes (IPCC) CO2 emissions are based on fuel
sales, a revision of the calculation of fuel consumption does not have a high priority. A start has been made of a calculation method based on car energy labels, the central car register, and the NAP. At the moment several essential data are yet lacking, in particular with regard to energy labelling.
This year the existing methodology is used. In order to directly allocate fuel-consumption-dependent emissions according to road type, ratio factors were determined using the former "TNO-VERSIT" model [ref 46: Lefranc, 1999] (see also Section 1.6.1.1). With these ratio factors, the fuel consumption for the three road types can be derived from the average fuel consumption. See Table 1.40B for these ratio factors.
9