Fungal susceptibility of bio-based building materials
Using X-ray micro CT as a tool for monitoring the moisture distribution and
mass loss during lab-based fungal degradation testing
Jordy Caes
Student number: 01502699
Promotors: Prof. dr. ir.-arch. Nathan Van Den Bossche
Prof. dr. ir.-ach. Marijke Steeman
Prof. dr. ir. Jan Van den Bulcke
Tutor: ir. Liselotte De Ligne
Master’s dissertation submitted in order to obtain the academic degree of Master of Science in Civil Engineering
PREAMBLE
Due to the outbreak of the corona epidemic in early March 2020, the Belgian government announced several recommendations to limit the further spread of the coronavirus COVID-19. For educational institutions such as UGent, activities with physical presence of students and lecturers were cancelled and a change to online learning was implemented. Since almost all students were not allowed to enter buildings of UGent, these measures had various consequences for master students whose research required lab work, surveys, interviews, etc.
In this thesis, three different experiments would have been executed. However, the experiment concerning the monitoring of the moisture distribution of several bio-based materials using MRI and CT scanning could not be executed because the weekly follow-up would require physical presence, which infringes the general measurements stated by the Belgian government. After consultation with my promotors and tutor, it was decided to replace the original experiment involving MRI and X-ray CT assessment on several bio-based materials with an analysis of the moisture distribution of four different wood species that are exposed to a basidiomycete fungus using X-ray CT. The analysis is performed on an existing data set, so no physical presence was required.
The control experiment regarding the monitoring of the moisture content of several engineered wood materials without exposure of fungi could be executed thanks to my tutor. She weighed the samples on a weekly basis, making it possible to analyse the evolution of the moisture content over time.
PREFACE
During my civil engineering studies, I often encountered courses dealing with the design of concrete and steel structures. Unfortunately, courses regarding the behaviour of wood-products and wood design were rather rare. I always liked to have a better understanding in the behaviour of wood-based products, so choosing the thesis topic ‘Fungal susceptibility of bio-based building materials’ was an ideal opportunity.
The elaboration of this master’s dissertation was a challenge, which I could not have accomplished without the support of a few people. First of all, I would like to thank my tutor, ir. Liselotte De Ligne, for giving me the necessary instructions, for helping the realisation of multiple experiments and providing me with useful feedback on a regularly basis. I would also like to thank my promotors, prof. dr. ir.-arch. Nathan Van Den Bossche, prof. dr. ir.-ach. Marijke Steeman and prof. dr. ir. Jan Van den Bulcke, for giving me feedback, making it possible to realize this research and for defining the main topics of this thesis.
Furthermore, I want to thank my friends, with whom I have shared countless great moments that I will always remember. Their enthusiasm made the years spent in Ghent an unforgettable period.
Lastly, I want to express my gratitude to my parents for tolerating me in stressful times, but especially for supporting me during the long days and nights I spent working on this thesis and for their unconditional love. I am also aware that I have two wonderful siblings and a loving family, who are always by my side and made me the person I am today.
Permission of usage
The author gives permission to make this master dissertation available for consultation and to copy parts of this master dissertation for personal use. In all cases of other use, the copyright terms have to be respected, in particular with regard to the obligation to state explicitly the source when quoting results from this master dissertation. May 31st, 2020
ABSTRACT
Fungal susceptibility of bio-based building materials
Using X-ray micro CT as a tool for monitoring the moisture distribution and mass
loss during lab-based fungal degradation testing
Jordy Caes
Promotors: Prof. dr. ir.-arch. Nathan Van Den BosscheProf. dr. ir.-ach. Marijke Steeman Prof. dr. ir. Jan Van den Bulcke Tutor: ir. Liselotte De Ligne
Master’s dissertation submitted in order to obtain the academic degree of Master of Science in Civil Engineering
Academic year 2019-2020
Summary: Since climate change and resource depletion are two of the main issues in today’s world, the focus of the building industry is changing towards sustainable designs. As a consequence, bio-based materials are gaining more and more importance. However, they are sometimes susceptible to wood-destroying fungi, which not only cause aesthetical damage, but also degrade the material, possibly compromising the structural integrity. In order to improve the moisture dynamics and biological resistance of bio-based materials, a proper understanding of the relation between fungus and material is required, in particular how the material’s structure and wood anatomical features affect the degradation process. As the current standardized tests are not suitable to investigate how material’s structure affects the degradation process and for the durability assessment of bio-based materials, whose natural durability is enhanced by new technologies, new test methods need to be developed.
In this thesis, we performed a preliminary experiment based on the mini-block test, in which the samples were brought to an initial moisture content ranging between 20-30% MC to increase the degradation potential. Based on the results, we can conclude that most bio-based materials are not durable when they are exposed to conditions favouring fungi (i.e. the samples are initially wet and remain wet during the degradation process and the hyphae can enter the samples from the sides. In case of thermally modified spruce, bringing the samples to 20-30% MC did not make them susceptible to decay.
In order to have a better insight in how the material’s structure and moisture properties affect the degradation process, we performed a second experiment, in which the moisture distribution and mass loss of four solid woods were monitored on a weekly basis using the non-destructive technique X-ray CT. For most materials, a density increase of 10-25% was observed due to the moisture uptake from the malt agar medium. The samples exposed to Coniophora puteana showed an additional 10-50% density increase, due to the moisture production of the fungus. The material’s structure of Scots pine seemed to have big impact on the degradation process. The samples with more latewood have smaller lumina and thicker cell walls, therefore obstructing the fungal colonization, and resulting in less degradation after ten weeks of exposure to C. puteana. Based on this result, there can be concluded that X-ray CT is a suitable technique to investigate the influence of material’s structures on the degradation process.
EXTENDED ABSTRACT
Fungal susceptibility of bio-based building
materials
Using X-ray micro CT as a tool for monitoring the moisture distribution and mass loss during lab-based
fungal degradation testing
Jordy Caes
Supervisors: Ir. L. De Ligne, Prof. Dr. Ir.-ach. N. Van Den Bossche, Prof. Dr. Ir.-ach M. Steeman and
Prof. Dr. Ir. J. Van den Bulcke
Abstract: Since climate change and resource depletion are two
of the main issues in today’s world, the focus of the building industry is changing towards sustainable designs. As a consequence, bio-based materials are gaining more and more importance. However, they are sometimes susceptible to wood-destroying fungi, which not only cause aesthetical damage, but also degrade the material, possibly compromising the structural integrity. In order to improve the moisture dynamics and biological resistance of bio-based materials, a proper understanding of the relation between fungus and material is required, in particular how the material’s structure and wood anatomical features affect the degradation process. As the current standardized tests are not suitable to investigate how the material’s structure affects the degradation process and for the durability assessment of bio-based materials whose natural durability is enhanced by new technologies, new test methods need to be developed.
In this research, we performed a preliminary experiment based on the mini-block test, in which the samples were brought to an initial moisture content ranging between 20-30% MC to increase the degradation potential. Based on the results, we can conclude that most bio-based materials are not durable when they are exposed to conditions favouring fungi (i.e. the samples are initially wet and remain wet during the degradation process and the hyphae can enter the samples from the sides. In case of thermally modified spruce, bringing the samples to 20-30% MC did not make them susceptible to decay.
In order to have a better insight in how the material’s structure and moisture properties affect the degradation process, we performed a second experiment, in which the moisture distribution and mass loss of four solid woods were monitored on a weekly basis using the non-destructive technique X-ray CT. For most materials, a density increase of 10-25% was observed due to the moisture uptake from the malt agar medium. The samples exposed to Coniophora puteana showed an additional 10-50% density increase, due to the moisture production of the fungus. The material’s structure of Scots pine seemed to have a big impact on the degradation process. The samples with more latewood have smaller lumina and thicker cell walls, therefore obstructing the fungal colonization and resulting in less degradation after ten weeks of exposure to C. puteana. Based on this result, there can be concluded that X-ray CT is a suitable
I. INTRODUCTION
In today’s world, climate change and resource depletion are two main issues, so awareness of renewability, recyclability and a small carbon footprint is becoming increasingly important. The building industry has a considerable impact on the environment as it consumes a lot of energy, water and raw materials [1]. Since there is a trend towards sustainable building, bio-based materials are gaining more and more importance. Bio based materials are renewable, recyclable and consume significantly less energy during production compared to steel, aluminium and concrete [2]. However, when bio-based materials are not well applied, and therefore exposed to certain conditions that favour insects, fungi or bacteria, decay can occur when the material is not durable in itself or when the durability was not increased with protection products or enhancement methods [3]. Fungal degradation not only leads to aesthetical damage, but can also compromise the structural integrity of buildings. As a consequence, it is necessary to have a better understanding of the degradation process and its influencing factors.
The most widely used laboratory method for determining the natural durability of solid wood against wood-destroying fungi is the CEN TS 15083-1 test method [4]. This test method adequately assesses the natural durability of various wood species and the efficacy of preservatives. However, this method is not suitable for the durability assessment of bio-based materials, whose natural durability is enhanced by new technologies, such as glued laminated timber, thermally modified wood, chemically modified wood and wood treated with water repellents [5]. These (engineered) materials have the ability that the material resistance can be improved by changing the material’s components during manufacture, for instance the glue type in plywood, or by modifying the wood structure, for instance by thermal modification, chemical modification, etc. As the moisture properties of these materials are enhanced, it might be possible that the strict interpretation of the standard test leads to invalidated results. For example, a
version of the standard test leads to more accurate results, for instance by prolonging the exposure time or increasing the initial moisture contents. We therefore perform a preliminary experiment, in which the samples are brought to an initial moisture content ranging between 20-30% MC (to increase the degradation potential) before exposure to basidiomycete fungi.
In addition, this standardized test does not allow to gain insight in what is going on at the inside of the material. A thorough knowledge about the relationship between fungus and material is still lacking, in particular how the material’s structure and moisture properties affect the degradation process. In order to be able to design new materials and apply them optimally, it is necessary to understand how the material’s structure affects the fungal degradation. X-ray CT seems a suitable technology to monitor the moisture distribution and mass loss, because it is a non-destructive technique that allows to assess the density of wood in three dimensions, thus enabling us to obtain localized information inside the wood during the degradation process [7]. We therefore perform a second experiment, in which the moisture distribution and mass loss of four solid woods are monitored on a weekly basis using X-ray CT.
II. MATERIALS AND METHODS
A. Adapted mini-block test for bio-based materials
In this experiment several (engineered) wood products are exposed to two basidiomycete fungi, in order to investigate their resistance against fungal decay. Before exposure, the materials are brought to moisture contents ranging between 20-30% MC to increase the degradation potential. Two different types of fungi are used, the brown-rot fungus
Coniophora puteana and the white-rot fungus Trametes versicolor. The main objective of this experiment is to assess
if bio-based materials are degraded in a mini-block test, when the samples have a moisture content of 20-30% before fungal exposure.
1) Materials
In total, six different wood materials are tested, of which the components are shown in Table 1. For each material, 21 samples are prepared with a size of 3 x 1 x 0.5 cm³ and marked with a code and number for distinction.
Table 1: Abbreviation and components of tested materials
Material type and abbreviation
Components Scots pine sapwood
(Pinus sylvestrus L.) (SPS)
Radiata pine plywood (RPP)
Radiata pine veneers, glue type: non-specified
Wood insulation (WI) Norway spruce and Scots pine fibres, PUR resin, paraffin Porous fibreboard (PF) Norway spruce and Scots pine
fibres, bitumen emulsion Oriented strand board
(OSB)
Scots pine fibres, PUR resin, formaldehyde-free glueing Thermally modified spruce (TMS) Process: 1) Hydrothermolysis up to 170°C 2) drying 3) heated again to up to 180⁰C in dry conditions without oxygen
2) Method
C. puteana and T. versicolor are grown in Petri dishes
(diameter 9 cm) filled with 20 ml of a growth medium (2% agar and 3% malt). All mini-blocks are oven dried (for 24 hours at 103°C), weighed and sterilized under steam at 121°C (Fedegari Autoclavi Spa). After sterilization, the mini-blocks are placed in a vacuum desiccator and ballasted with weights such that they do not float during the wetting procedure. This operation is done in the laminar flow, while ensuring that all elements of the experiment set-up are sterilized with ethanol.
A sterilized glass piece containing a valve is installed in the desiccator. After closing the outlet of the valve, which ensures the maintenance of sterility at the inside, the desiccator is taken out of the laminar flow and connected to a vacuum pump. After establishing a vacuum corresponding to a pressure of 0.8 bar for 30 minutes, the valve is closed and disconnected from the vacuum pump. The desiccator is then returned in the laminar flow and connected to a sterile water supply. Before opening the valve and filling the desiccator, the tube is made air-free. When the samples are completely submerged, the valve is closed and the desiccator is subjected to vacuum again for 30 minutes. After a day, the samples are taken out of the desiccator and placed on sterilized racks for drying in the laminar flow. The samples are weighed regularly until a moisture content of 20-30% is reached. Next, the samples are wrapped in aluminium foil, to prevent dehydration, and put in the fridge until the start of the experiment.
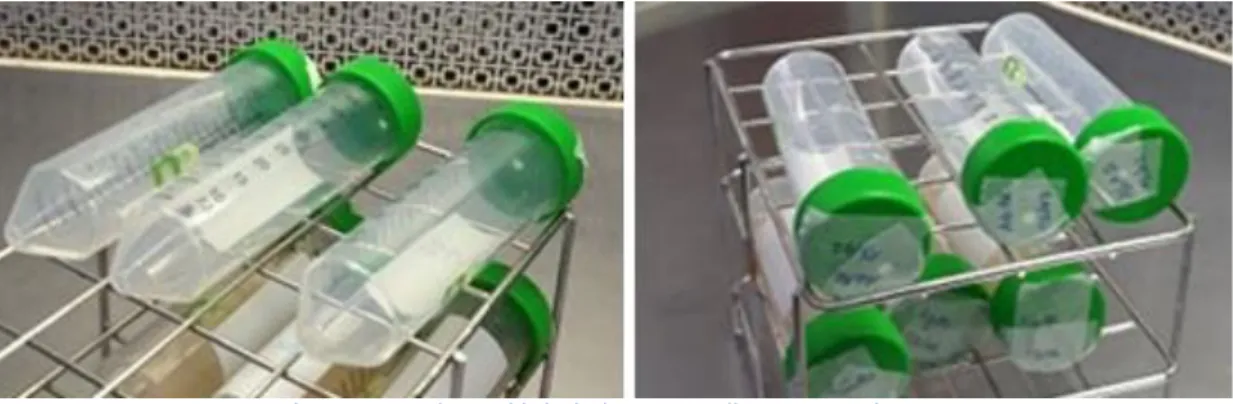
When the fungi have overgrown the Petri dishes, sterilized metal grids are placed on the fungi, this to avoid that the samples take up water directly from the malt agar medium. After checking the moisture contents one last time, three mini-blocks are placed in each Petri dish. The Petri dishes are closed with surgical tape, to prevent mites from contaminating the growth medium, and put in a climate chamber at 20°C and 70% RH. The tape also has the property to allow gas exchange between the interior environment of the Petri dish and the exterior environment, which is required for those fungi that need oxygen to survive.
After 8 weeks, the samples are taken out of the petri dishes, cleaned, weighed, oven dried and weighed again, in order to determine the moisture content at the end of the experiment and the mass loss due to fungal degradation.
B. Using X-ray CT as a tool for monitoring the moisture distribution and mass loss of solid woods
1) Degradation test
In this experiment, a durability test is performed according to the mini-block method of Bravery, because a smaller sample size and a shorter test period seem beneficial for experimenting with X-ray CT [7]. Twenty mini-blocks of beech (Fagus sylvatica L.), Scots pine (Pinus sylvestris L.), gaboon (Aucoumea klaineana Pierre) and Norway spruce (Picea abies (L.) Karst) with dimensions 30 x 10 x 5 mm³ are oven dried for 24 hours at 103°C and weighed. Next, they are sterilized using gamma irradiation and placed in Petri dishes (diameter 9 cm), filled with a malt agar growth medium (40% malt, 2% agar) and inoculated with the brown-rot fungus
Coniophora puteana [7]. Fifteen samples are exposed to the
and serve as control samples to compare the moisture behaviour. The samples are placed on plastic grids to avoid direct contact with the growth medium. The choice for plastic grids can be explained by the fact that metal objects affect the density of adjacent tissues during CT scanning [8]. Furthermore, a reference material was placed on top of each sample. The reference material is required for calculating the density from an X-ray CT image. The Petri dishes are kept in a climate chamber (20°C and 75% RH) for 10 weeks and scanned on a weekly basis with X-ray CT. After 10 weeks of degradation, the samples are weighed immediately to check the final moisture content and oven dried to assess the mass loss. The blocks were scanned one last time after oven drying [7].
2) X-ray CT set-up
The Environmental Micro-CT (EMCT) system at the Centre for X-ray Tomography at Ghent University (UGCT,
www.ugct.ugent.be) is used to obtain X-ray CT scans of the wood samples. The energy source emits X-rays, which partially penetrate through the stack of Petri dishes and hit the 2D pixelated detector. The detector detects how much of the incoming X-ray energy is able to pass through the stack, and therefore also how much energy has been absorbed by the wood, air and other elements in the Petri dish [7]. The denser the wood is, the more energy it will absorb. During the measurements, the stack of Petri dishes remains in place, while the table on which the source and detector are mounted rotates (0-360°). The scan settings used in this set-up allow for a resolution of 68 µm (Table 2).
Table 2: Scan settings EMCT [7]
Voltage +80 kV Exposure time 100 ms
Wattage 12 W Number of averages 3
Filter No filter Rotation 360°
Resolution 68 mm Number of images 2200
Since the detector has a limited field of view, the entire stack of Petri dishes cannot be scanned at once. Consequently, we make use of a motor allowing for vertical movements, such that the height of the stack of Petri dishes automatically changes after each scan cycle [7]. In order to avoid unnecessary X-ray radiation exposure of the fungal cultures that are not in the field of view, a PVC tube with lead cladding is positioned around the stack of Petri dishes. This ensures a blockage of X-rays, except at a central slit that allows X-ray passage only through one Petri dish [7].
3) Image reconstruction
The detector takes 2200 images during one rotation cycle of 360°. The images are then reconstructed with the Octopus reconstruction software package (licensed by TESCAN-XRE:
www.xre.be) [9]. A software beam hardening correction was applied (BHC-values 0.12 0 0). We loaded the resulting greyscale volume for each Petri dish in Fiji and extracted the mini-blocks [10]. A greyscale profile was taken along the longitudinal direction of the mini-block, where the average grey value was calculated for each slice. Afterwards, this
III. RESULTS AND DISCUSSION
A. Adapted mini-block test for bio-based materials
A first observation that can be made is that both fungi are sufficiently virulent to degrade all bio-based materials, except for thermally modified spruce (Figure 1). Considering that all materials are based on softwoods, it is logical that the brown-rot fungus C. puteana causes larger mass losses than the white-rot fungus T. versicolor [11].
Figure 1: Mass losses due to C. puteana and T. versicolor
Since the mass loss of thermally modified spruce is limited, i.e. ranging between -1.16% and 4.49% ML, this could possibly indicate that the samples of thermally modified spruce are too dry or wet for degradation. The first explanation is rejected because all samples had an initial moisture content between 20-30%. Being too wet is most likely not the explanation either, as most samples of thermally modified spruce had a moisture content below 80% (Figure 2).
Figure 2: Moisture contents after fungal degradation
The reason for the limited degradation can be found in the thermal modification. Due to the thermal treatment at 200°C, a multitude of different reactions take place (e.g. hydrolytic splitting of polysaccharides, oxidation and radical reactions and several condensation reactions) [3]. As a consequence, the material’s characteristics undergo several changes: a reduction of the equilibrium moisture content of the wood; a better biological durability and an improved dimensional stability [12]. In a survey of Weiland and Guyonnet, the chemical
(2) The formation of some molecules, e.g. furfural, may blend in the lignin network. This makes sure that the fungi cannot longer recognize the wood substrate and is thus incapable of degrading it.
(3) The thermal treatment eliminates the pentanes (hemicelluloses), the elementary nutritive substances of wood, hence inhibiting the initial fungal colonization.
In a study of De Ligne et al., the existence of fungicidal properties was tested for thermally modified spruce with the same properties as in this experiment. Based on their results, there can be concluded that there were no molecules acting as fungicides, so the first explanation of Weiland and Guyonnet can be rejected [5].
In order to determine whether a material is durable or not, the durability rating scale according to CEN/TS 15083-1 can be used. This rating scale assigns a durability class based on the highest median mass loss. An overview of the assigned durability classes can be found in Table 3. Note that the application of this durability rating is, strictly speaking, only valid when the dimensions of the samples are as prescribed ( 5 x 2.5 x 1.5 cm³) and when the mass loss caused by C.
puteana of the reference material is higher than 30% after an
exposure time of 16 weeks [4].
Table 3: Assigned durability classes
Material type Highest
median mass loss [%]
Durability class Scots pine sapwood 29.03 4 Radiata pine plywood 39.96 5 Oriented strand board 29.07 4
Porous fibreboard 35.08 5
Wood insulation 41.24 5
Thermally modified spruce
2.68 1
Wood insulation and porous fibreboard are both heavily deteriorated by C. puteana. This indicates that the non-wood components, bitumen emulsion for porous fibreboard and PUR resin and paraffin for wood insulation, barely affected the fungal degradation in this experiment set-up. The results for OSB correspond with findings of Amusant and Fojutowsko, who found mass losses ranging between 20-45% for different OSB panels in case of exposure to C. puteana [14], [15]. The pine plywood samples were also severely degraded by C. puteana. Note that this will most likely not occur in practice, where the edges are often shielded by other elements, thus preventing fungal penetration at the sides. This is confirmed by a study from Van den Bulcke et al., in which the sealing of plywood edges has shown to have an important impact on the fungal degradation. [16].
It is important to realize that the mini-block test is not adequate for assessing the actual durability of these bio-based materials. Because of the mini-blocks’ dimensions, the non-wood components could not affect the degradation process. The mini-block test, however, does show that the bio-based materials are not durable when they are exposed to conditions favouring fungi (the samples are initially wet and remain wet
during the degradation process, and the hyphae can enter the samples from the sides. In case of thermally modified spruce, bringing the samples to 20-30% MC did not make them susceptible to decay. Therefore, it would be interesting to find out if the fungus is capable of degrading thermally modified wood using capillary or loosely bound water and if a longer wetting duration will result in the wood reaching a minimum threshold of bound water in the cell wall which allows decay [5].
In this experiment, it is unknown how much of the material moisture content is due to the moisture absorption from the agar medium and how much is due to moisture production by the fungus. Therefore, a control test (with similar set-up) was performed in which the moisture content is monitored on a weekly basis without the presence of basidiomycete fungi. In this control experiment, contamination occurred, so only the results of the samples without contamination are included (Figure 3).
Figure 3: Variation of median moisture content for samples without fungus
By comparing Figure 2 and Figure 3, one can observe that the moisture contents of the samples exposed to C. puteana are higher than those without fungus. This is logical because sugars are metabolized into water and carbon dioxide during fungal deterioration [17]. Since more degradation occurred in case of C. puteana, it is logical that the moisture contents of the samples exposed to T. versicolor are lower than those exposed to C. Puteana and higher than those without fungus. For the insulation materials, an increase of at least 200% in MC was found in case of exposure to C. puteana, whereas the other materials showed moisture content increases of 20% to 40%. Hence, there can concluded that the presence of fungi has a significant impact on the material moisture content.
B. Using X-ray CT for the monitoring of the moisture distribution and mass loss of solid woods
In this data analysis, the main goal is to find out how the moisture distribution varies over time during fungal degradation and how the material’s structure affect the degradation process. Before proceeding with the actual analysis, we compare the mass losses of the CT experiment to those of a parallel experiment. This parallel experiment was executed at the same time as the CT experiment, the only difference is that the samples were not exposed to X-ray radiation. The goal of this comparison is to find out whether X-ray radiation has an influence on the degradation process and if the amount of degradation suffices to further investigate the factors influencing the degradation process.
As it is known that water and carbon dioxide are produced during fungal deterioration, it would be interesting to find out how much of the material moisture content is due to the moisture production by the fungus and how much due to the moisture absorption from the agar medium. Therefore, the relative mean density variations of the samples exposed to C.
puteana are compared to those of the control samples.
Lastly, the densities of the oven dry samples before degradation are compared to those after degradation. This because it would be interesting to find out which phenomena can be observed. Firstly, a density loss is expected due to the fungal degradation. However, it might be possible that there is densification because of the shrinkage as a result of the loss of wood structural elements. Since CT-images are available, both phenomena can be observed visually.
1) Influence of X-rays in CT on fungal degradation
Since high amounts of X-rays can harm living organisms, it is important to test whether X-ray radiation in CT has an influence on the behaviour of C. puteana. In a study of De Ligne et al., it was found that C. puteana showed a clear recovery potential after X-ray treatment, thus enabling the use of X-ray CT scanning to track fungal degradation [7]. The fungus C. puteana is weekly exposed to X-ray radiation for only 14 minutes, so we do not expect that the degradation is significantly inhibited. In order to find out if the X-rays have an influence on the magnitude of the mass losses, the results in the CT experiment are compared to those in the parallel experiment without CT (Figure 4). Note that both experiments were executed in such way that the same conditions were applicable as much as possible. For example, the Petri dishes were put in the same climate chamber, both experiments were executed at the same time and lasted 10 weeks, etc. This is important because that way, the X-ray radiation is the only influencing factor.
Figure 4: Comparison mass losses due to C. puteana
Based on the results for spruce, one could conclude that X-rays do not have an adverse effect on the fungal degradation and X-ray CT is a proper tool to assess the fungal degradation of bio-based materials. However, the mass losses of beech and gaboon are a bit smaller than those of the parallel experiment. Therefore, it could be possible that X-rays have an influence on the fungal degradation. In order to find this out, it is recommended to execute a new experiment. However, for the
2) Evolution of density over time
It could be interesting to find out how the density of the samples changes over time during exposure to C. puteana and how the material’s structure influences the moisture distribution and fungal degradation. As the samples vary in density at the start of the experiment, it was decided to plot the relative mean density variation with respect to the oven dry density. The resulting graphs are not straightforward to interpret because there are several factors affecting the results. On the one hand, there is moisture uptake from the malt agar medium and moisture production by the fungus, resulting in an increase of the mean density profile. On the other hand, there is water evaporation and fungal degradation, resulting in a decrease of the mean density profile. In order to find out the influence of some of these factors, the relative density changes are also analysed for the mini-blocks subjected to the same set-up, but without fungus. The results of the analyses can be found in Figure 5 to Figure 9. Before analysing the results, some important comments are given regarding the indices and the colour codes in the graphs of the samples exposed to C.
puteana. ‘Oven dry’ represents the results of the oven dry
dataset before degradation, week 0 the results of the samples placed in Petri dishes for several minutes, and week 1 to 10 the results of the samples exposed to the fungus for 1 to 10 weeks. The colour code refers to which samples were placed together in a Petri dish, and therefore subjected to the same conditions. In Figure 5 and Figure 6, the relative mean density variation is showed for spruce and Scots pine respectively. The density increases sharply until week 1-2, which indicates that the malt agar medium provides sufficient nutrients for the fungus. The peak can therefore be explained by a high fungal activity and its associated moisture production. After reaching the peak, the density decreases again (for spruce and pine) or stagnates (for pine). The most degraded samples usually have a lower density. This is logical because a higher mass loss indicates that the fungus degraded more of the wood substances.
Figure 5: Relative density variation of spruce during exposure to C. puteana
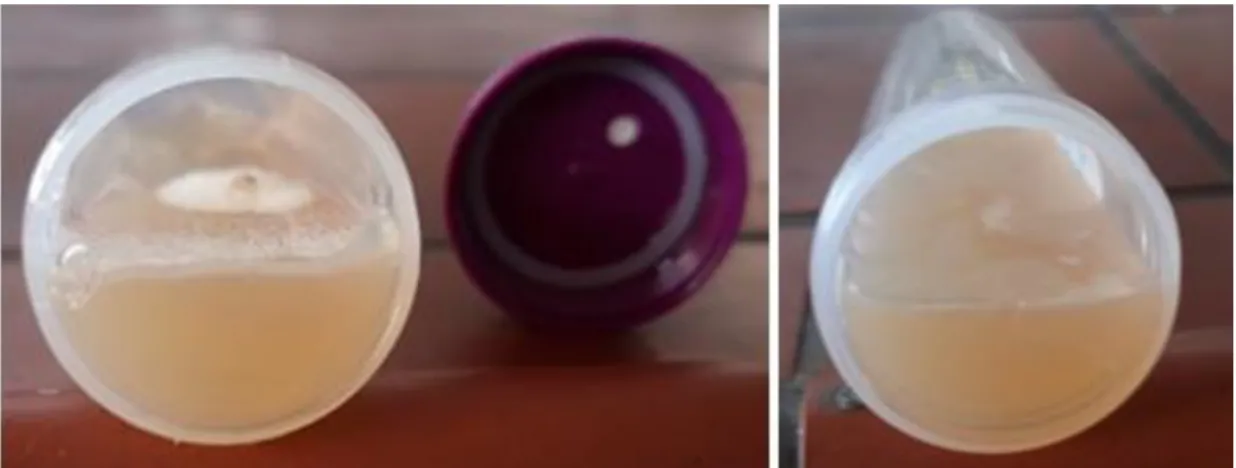
After week 2, two different density patterns can be distinguished for Scots pine. This could indicate that the material’s structure has an important influence on the fungal degradation. Typically, two zones of growth can be distinguished within a tree ring: earlywood and latewood. Earlywood cells have larger radial diameters and thinner cell walls, whereas latewood is denser, has thicker cell walls and smaller lumens [18]. Based on the mass losses of Scots pine mini-blocks, it seems that the amount of latewood regions has an influence on the fungal degradation. Mini-blocks with more latewood regions had a significantly smaller mass loss (Table 4). This implies that the samples with more earlywood, which have larger lumina, are more invasive. The samples with more latewood have smaller lumina and thicker cell walls, therefore obstructing the initial fungal colonization, and resulting in less degradation after ten weeks of exposure to C. puteana.
Table 4: Influence of latewood regions on fungal degradation for Scots pine
Mini-block Mass loss [%]
Mini-block Mass loss [%]
2.68 32.91
0.96 30.20
1.38 31.32
0.56 23.68
For beech and gaboon (Figure 7 and Figure 8), the density increases until week 1 or 2. After reaching the peak, the density decreases again when the samples are being moderately degraded, and stagnates when the samples are barely degraded. Since the median mass loss of gaboon is 2%, this indicates that the density increase is due to the moisture uptake from the malt agar medium and the moisture production of C. puteana when sugars are metabolized from the agar medium.
Figure 7: Relative density variation of beech during exposure to C. puteana
Figure 8: Relative density variation of gaboon during exposure to C. puteana
In Figure 9, the relative mean density variation is shown for the control samples. The density increases until week 1-2 and remains approximately constant for the other weeks. Since the density increase varies between 10-25%, there can be concluded that the moisture production of the fungus is responsible for an additional density increase of 10-50%.
Figure 9: Relative density variation in case there is no exposure to C. puteana
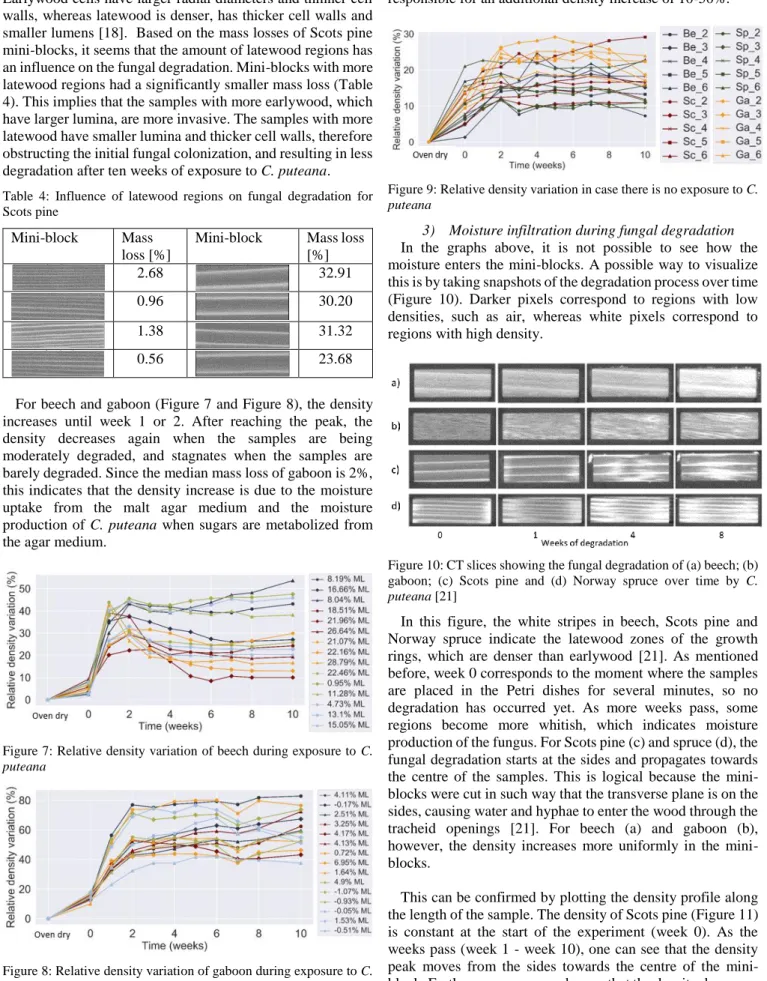
3) Moisture infiltration during fungal degradation
In the graphs above, it is not possible to see how the moisture enters the mini-blocks. A possible way to visualize this is by taking snapshots of the degradation process over time (Figure 10). Darker pixels correspond to regions with low densities, such as air, whereas white pixels correspond to regions with high density.
Figure 10: CT slices showing the fungal degradation of (a) beech; (b) gaboon; (c) Scots pine and (d) Norway spruce over time by C. puteana [21]
In this figure, the white stripes in beech, Scots pine and Norway spruce indicate the latewood zones of the growth rings, which are denser than earlywood [21]. As mentioned before, week 0 corresponds to the moment where the samples are placed in the Petri dishes for several minutes, so no degradation has occurred yet. As more weeks pass, some regions become more whitish, which indicates moisture production of the fungus. For Scots pine (c) and spruce (d), the fungal degradation starts at the sides and propagates towards the centre of the samples. This is logical because the mini-blocks were cut in such way that the transverse plane is on the sides, causing water and hyphae to enter the wood through the tracheid openings [21]. For beech (a) and gaboon (b), however, the density increases more uniformly in the mini-blocks.
This can be confirmed by plotting the density profile along the length of the sample. The density of Scots pine (Figure 11) is constant at the start of the experiment (week 0). As the weeks pass (week 1 - week 10), one can see that the density peak moves from the sides towards the centre of the mini-block. Furthermore, one can observe that the density decreases
fungus is degrading the wood components during its travel towards the centre. A different pattern can be observed for beech (Figure 12). The density is almost constant along the length, so it is more likely that the fungus attacks the sample uniformly at the bottom towards the top.
Figure 11: Density profile in longitudinal direction for a Scots pine mini-block with 17% ML
Figure 12: Density profile in longitudinal direction of a beech mini-block with 22% ML
4) Comparison oven dry densities before and after fungal degradation
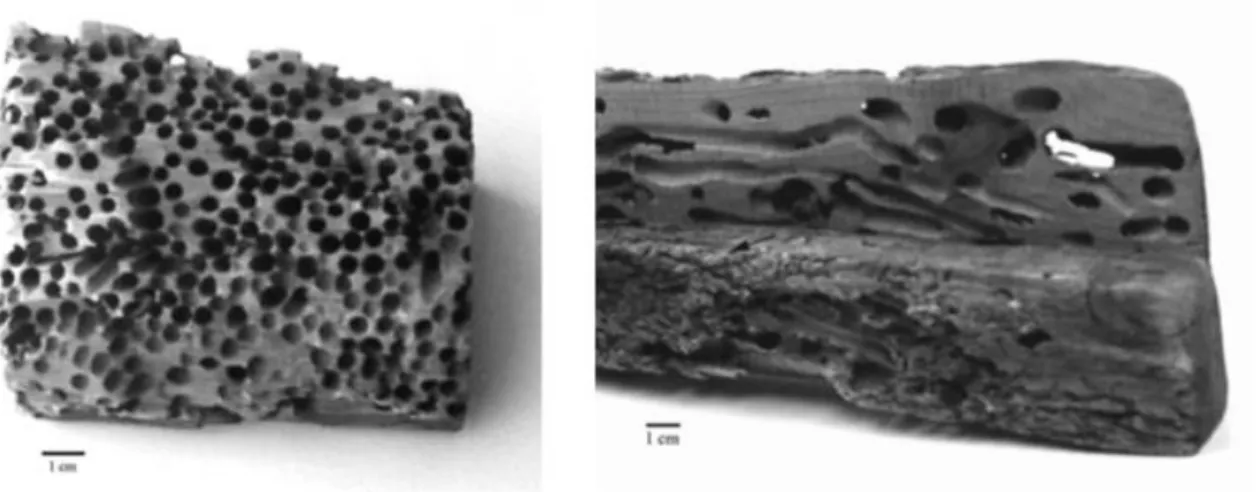
During the degradation process, fungi break down structural elements of the wood. As a consequence, one would expect that the density decreases. However, it may also be possible that the wood densifies due to shrinkage as a result of the degradation. In order to find out which phenomenon occurs, or if there is a combination of both phenomena, the oven dry densities before and after degradation are compared (Figure 13).
Figure 13: Comparison oven dry densities before and after degradation
For all wood species, one can see that the oven dry densities before degradation are higher than after degradation, which
samples. This is logical because the moisture, which is produced when the fungus metabolizes sugars or when the sample takes up moisture from the growth medium, evaporates. However, shrinkage was only noticeable for the most degraded mini-blocks. This can be explained by the fact that the more wood substances are degraded, the less remains of the wood structuring elements and the more the samples will shrink.
Table 5: Shape of mini-blocks before and after degradation: (a) spruce (33% ML); (b) beech (21% ML)
Oven dry shape before degradation
Shape after 10 weeks of degradation
Oven dry shape after degradation a)
b)
The degraded mini-blocks clearly shrunk, but since the graph in Figure 13 shows that there are only density losses, one can conclude that the densification is of minor importance to the overall density loss.
IV. CONCLUSION
Since the current standardized tests are not suitable to investigate how material’s structure affects the degradation process and for the durability assessment of bio-based materials, whose natural durability is enhanced by new technologies, we performed two experiments. The first experiment is based on the mini-block test, and assessed the fungal susceptibility of several bio-based materials, of which the samples were brought to an initial moisture content ranging between 20-30% MC (to increase the degradation potential). Based on the results, we can conclude that most bio-based materials are not durable when they are exposed to conditions favouring fungi (i.e. the samples are initially wet and remain wet during the degradation process and the hyphae can enter the samples from the sides. In case of thermally modified spruce, bringing the samples to 20-30% MC did not make them susceptible to decay.
In a second experiment, the moisture distribution and mass loss of four solid woods were monitored on a weekly basis using X-ray CT. For most materials, a density increase of 10-25% was observed due to the moisture uptake from the malt agar medium. The samples exposed to Coniophora puteana showed an additional 10-50% density increase, due to the moisture production of the fungus. The material’s structure of Scots pine seemed to have a big impact on the degradation process. The samples with more latewood have smaller lumina and thicker cell walls, therefore obstructing the fungal colonization, and resulting in less degradation after ten weeks of exposure to C. puteana. Based on this result, there can be concluded that X-ray CT is a suitable technique to investigate the influence of material’s structures on the degradation
ACKNOWLEDGEMENTS
The elaboration of this research was not possible without the help of some people. First of all, I would like to thank my tutor, ir. Liselotte De Ligne, for giving me the necessary instructions, for helping the realisation of the experiments and providing me with useful feedback. Lastly, I would like to thank my supervisors, prof. dr. ir.-arch. Nathan Van Den Bossche, prof. dr. ir.-ach. Marijke Steeman and prof. dr. ir. Jan Van den Bulcke, for giving me feedback and for making it possible to realize this research.
REFERENCES
[1] L. Melchert, ‘The Dutch sustainable building policy: A model for developing countries?’, Build. Environ., vol. 42, no. 2, pp. 893–901, Feb. 2007, doi: 10.1016/j.buildenv.2005.10.007.
[2] L. Shao et al., ‘Systems accounting for energy consumption and carbon emission by building’, Commun. Nonlinear Sci. Numer. Simul., vol. 19, no. 6, pp. 1859–1873, Jun. 2014, doi: 10.1016/j.cnsns.2013.10.003. [3] D. Jones and C. Brischke, Performance of Bio-based Building
Materials, Woodhead Publishing. Matthew Deans, 2017.
[4] European Committee for Standardization, ‘CEN (2015): CEN/TS 15083-1, Durability of wood and wood-based products - determination of the natural durability of solid wood against wood-destroying fungi. Test methods - part 1, Basidiomycetes’, 2015.
[5] L. De Ligne et al., ‘Performance of bio-based building materials – durability and moisture dynamics’, in IRG51 Scientific Conference on
Wood Protection, Jun. 2020, Accessed: Apr. 16, 2020.
[6] ‘Thermal Modification of Wood’, in Wood Modification, Chichester, UK: John Wiley & Sons, Ltd, 2006, pp. 99–127.
[7] L. De Ligne et al., ‘Exploring the use of X-ray micro CT as a tool for the monitoring of moisture production and mass loss during lab-based fungal degradation testing’, in IRG50 scientific conference on wood
protection : papers, 2019, Accessed: May 09, 2020. Available:
http://hdl.handle.net/1854/LU-8618953.
[8] M. Kataoka, M. Hochman, E. Rodriguez, P. P. Lin, S. Kubo, and V. Raptopolous, ‘A Review of Factors That Affect Artifact From Metallic Hardware on Multi-Row Detector Computed Tomography’, Curr Probl
Diagn Radiol, pp. 125–136, Aug. 2010.
[9] J. Vlassenbroeck, M. Dierick, B. Masschaele, V. Cnudde, L. Van Hoorebeke, and P. Jacobs, ‘Software tools for quantification of X-ray
microtomography at the UGCT’, Nucl. Instrum. Methods Phys. Res.
Sect. Accel. Spectrometers Detect. Assoc. Equip., vol. 580, no. 1, pp.
442–445, Sep. 2007, doi: 10.1016/j.nima.2007.05.073.
[10] J. Schindelin et al., ‘Fiji: an open-source platform for biological-image analysis’, Nat. Methods, vol. 9, no. 7, pp. 676–682, Jul. 2012, doi: 10.1038/nmeth.2019.
[11] P. I. Morris, ‘Understanding Biodeterioration of Wood in Structures’. Forintek Canada Corp., Accessed: Mar. 14, 2020.
[12] S. Metsä-Kortelainen and H. Viitanen, ‘Decay resistance of sapwood and heartwood of untreated and thermally modified Scots pine and Norway spruce compared with some other wood species’, Wood Mater.
Sci. Eng., vol. 4, no. 3–4, pp. 105–114, Sep. 2009, doi:
10.1080/17480270903326140.
[13] J. J. Weiland and R. Guyonnet, ‘Study of chemical modifications and fungi degradation of thermally modified wood using DRIFT spectroscopy’, Holz Als Roh- Werkst., vol. 61, no. 3, pp. 216–220, Jun. 2003, doi: 10.1007/s00107-003-0364-y.
[14] A. Fojutowski, A. Kropacz, and A. Noskowiak, ‘Folia Forestalia Polonica 40: 79-88’, p. 10.
[15] N. Amusant et al., ‘Biological properties of an OSB eco-product manufactured from a mixture of durable and non durablespecies and natural resins’, Eur. J. Wood Wood Prod., vol. 67, no. 4, pp. 439–447, Nov. 2009, doi: 10.1007/s00107-009-0335-z.
[16] J. Van den Bulcke, I. De Windt, N. Defoirdt, J. De Smet, and J. Van Acker, ‘Moisture dynamics and fungal susceptibility of plywood’, Int.
Biodeterior. Biodegrad., vol. 65, no. 5, pp. 708–716, Aug. 2011, doi:
10.1016/j.ibiod.2010.12.015.
[17] O. Schmidt, Wood and Tree Fungi: Biology, Damage, Protection, and
Use. Berlin Heidelberg: Springer-Verlag, 2006.
[18] J.-C. Domec, ‘How do water transport and water storage differ in coniferous earlywood and latewood?’, J. Exp. Bot., vol. 53, no. 379, pp. 2369–2379, Dec. 2002, doi: 10.1093/jxb/erf100.
[19] F. W. M. R. Schwarze, ‘Wood decay under the microscope’, Fungal
Biol. Rev., vol. 21, no. 4, pp. 133–170, Nov. 2007, doi:
10.1016/j.fbr.2007.09.001.
[20] W. W. Wilcox, ‘Comparative Morphology of Early Stages of Brown-Rot Wood Decay’, IAWA J., vol. 14, no. 2, pp. 127–138, Jan. 1993, doi: 10.1163/22941932-90001306.
[21] L. De Ligne, J. Van den Bulcke, J. Baetens, B. De Baets, and J. Van Acker, ‘Bio-based building materials- How to unravel the role of material characteristics on fungal susceptibility?’, presented at the XV international conference on durability of building materials and components, Barcelona, 2020, Accessed: May 13, 2020.
TABLE OF CONTENT
Preamble 3 Preface 4 Abstract 5 Extended abstract 6 Table of content 14 List of figures 16 List of tables 18 1 Introduction 19 2 Literature study 232.1 Properties of bio-based materials 23
2.1.1 Structural function 24
2.1.2 Non-structural function 24
2.2 Threats for bio-based materials 25
2.2.1 Fire 26 2.2.2 Weathering 26 2.2.3 Marine borers 26 2.2.4 Insects 27 2.2.5 Bacteria 27 2.2.6 Fungi 28
2.3 Good building practice 31
2.4 Protective measures for bio-based materials 35
2.4.1 Chemical preservation 37
2.4.2 Modification 37
2.4.3 Coatings 40
2.5 Testing methods for fungal susceptibility 40
3 Material and methods 42
3.1 Preliminary experiment: adapted mini-block test for bio-based materials 42
3.1.1 Sample preparation 42
3.1.2 Optimal conditions for fungal growth 43
3.1.3 Order of operations 45
3.1.4 Control test 45
3.2 Experiment 2: monitoring of the moisture distribution of bio-based materials using MRI and
X-ray CT 46
3.2.1 Working principle of MRI 46
3.2.2 Working principle of X-ray CT 48
3.3.1 Degradation test 55
3.3.2 X-ray CT set-up 56
3.3.3 Image reconstruction and analysis 57
4 Results and discussion 58
4.1 Preliminary experiment: adapted mini-block test for bio-based materials 58
4.1.1 General results 58
4.1.2 Comparison with findings in literature 61
4.1.3 Conclusion and recommendations 67
4.2 Data analysis: using X-ray CT for the monitoring of the moisture distribution and mass loss of
solid woods 67
4.2.1 Influence of X-ray radiation in CT on fungal degradation 68
4.2.2 Relation between actual density and density based on grey values 69
4.2.3 Impact of moisture on density 71
4.2.4 Evolution of density over time 72
4.2.5 Moisture infiltration during fungal degradation 78
4.2.6 Comparison of oven dry densities before and after degradation 80
4.2.7 Conclusion and recommendations 82
5 Conclusion 83
Appendix A: Complete Results of control test 85
References 86
LIST OF FIGURES
Figure 1: CO2 emissions due to cement production [4] ... 20
Figure 2: Energy consumption components in building industry [2] ... 20
Figure 3: Hybrid concrete-timber structure: Illwerke Zentrum Montafon, Austria [11] ... 21
Figure 4: Mannheim Multihalle, wooden roof structure (left); Metropol Parasol, Seville (right) [12], [13] ... 23
Figure 5: Hyperbolic relation between strength and load duration [16] ... 24
Figure 6: Pholad attack of wood (left) and wood damaged by shipworms and gribble (right) ... 27
Figure 7: Steel net as barrier against termites [10] ... 27
Figure 8: Blue staining fungi invading the sapwood and not the inner heartwood [31] ... 29
Figure 9: Whitish colour after degradation of OSB due to white-rot fungus ... 29
Figure 10: Brown-black colour after degradation of pine sapwood due to brown-rot fungus ... 29
Figure 11: Cubic fracture pattern after brown-rot decay [10] ... 30
Figure 12: Temperature-dependent growth rate for wood-decaying fungi [27] ... 30
Figure 13: Causes of building damage [33] ... 31
Figure 14: Design rule 1: avoid direct contact with wet walls [10] ... 32
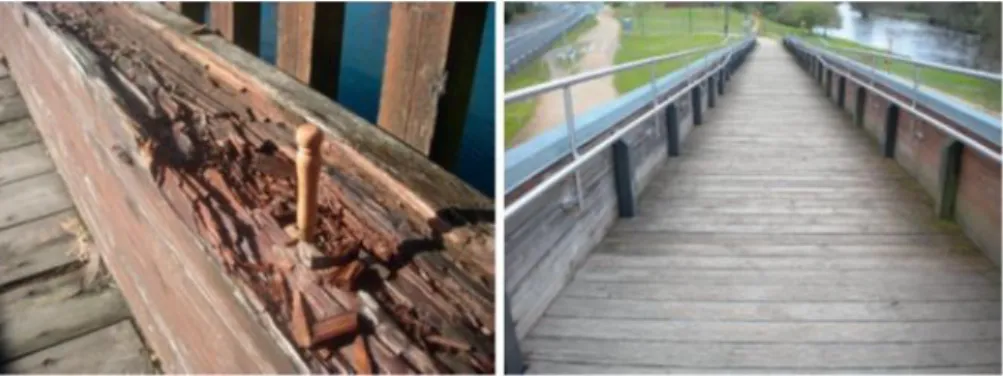
Figure 15: Design rule 2: provide a gutter to avoid splash ... 32
Figure 16: Design rule 3: provide an end grain protection ... 32
Figure 17: Design rule 4: provide cover at the top of main beams ... 33
Figure 18: Design rule 5: prevent water accumulation by providing good separation between beams and allowing for water drainage ... 33
Figure 19: Design rule 6: avoid direct ground contact ... 33
Figure 20: Isoline-diagram in function of fungal index [33] ... 34
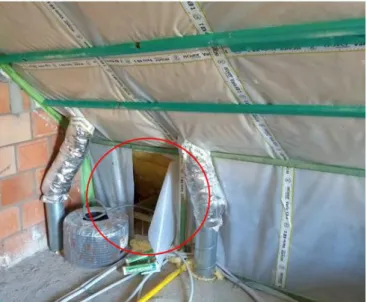
Figure 21: Bad execution of the vapour barrier ... 35
Figure 22: vacuum pump connected to desiccator ... 44
Figure 23: Wetting procedure of porous fibreboard ... 44
Figure 24: MRI machine for people (left) and for mice (right) [49],[50] ... 46
Figure 25: The electromagnetic spectrum [53] ... 47
Figure 26: X-ray source (blue), sensors (black), X-rays (grey lines) [56] ... 49
Figure 27: Intensity image at 0° ... 49
Figure 28: Image of intensities at 90° ... 49
Figure 29: Image of intensities at 45° ... 50
Figure 30: Sealing application on OSB and pine plywood samples ... 52
Figure 31: Tubes with hole in cap to allow gas exchange ... 53
Figure 32: Contamination in tube with inoculated fungus (left) and solidified malt agar medium (right) ... 54
Figure 33: Petri dish set-up at the start of the experiment, cp = C. puteana; g = plastic grid; p = Petri dish; r = reference material and sp= Scots pine sapwood [48] ... 55
Figure 34: X-ray CT set-up, 1) X-ray source 2) Detector 3) Stack of Petri dishes 4) PVC tube with lead cladding 5) rotation table [48] ... 56
Figure 35: For 292 slices along the longitudinal direction of the mini-block (left); the average grey value is determined with Fiji, resulting in a grey scale profile of the mini-block (right) ... 57
Figure 36: Mass losses due to Coniophora puteana ... 58
Figure 37: Mass losses due to Trametes versicolor ... 58
Figure 43: Deterioration of radiata pine plywood samples ... 63
Figure 44: Adhered mycelium to porous fibreboard sample ... 64
Figure 45: Deterioration of OSB samples caused by C. puteana ... 64
Figure 46: Adhering mycelium to wood insulation samples ... 65
Figure 47: Floating samples of thermally modified spruce after wetting them for a day ... 66
Figure 48: Comparison mass losses of samples in CT experiment to parallel experiment ... 68
Figure 49: Linear regression of densities of spruce (left) and beech (right)... 69
Figure 50: Linear regression of densities of Scots pine (left) and gaboon (right) ... 70
Figure 51: Normality test for dependent variable ... 70
Figure 52: Density increase due to moisture in the mini-blocks ... 71
Figure 53: Moisture contents after fungal degradation ... 72
Figure 54: Relative mean density variation of spruce during exposure to C. puteana ... 73
Figure 55: Relative mean density variation of spruce (control samples) ... 74
Figure 56: Relative mean density variation of Scots pine during exposure to C. puteana ... 74
Figure 57: Relative mean density variation of Scots pine (control samples) ... 75
Figure 58: Relative mean density variation of beech during exposure to C. puteana ... 76
Figure 59: Relative mean density variation of beech (control samples) ... 76
Figure 60: Relative mean density variation of gaboon during exposure to C. puteana ... 77
Figure 61: Evolution of the grey values of the reference material over time ... 77
Figure 62: Relative mean density variation of gaboon (control samples) ... 77
Figure 63: CT slices showing the fungal degradation of (a) beech; (b) gaboon; (c) Scots pine and (d) Norway spruce over time by C. puteana [81] ... 78
Figure 64: Longitudinal density profile a Scots pine mini-block with 17% ML... 79
Figure 65: Longitudinal density profile of a beech mini-block with 22% ML... 79
Figure 66: Longitudinal density profile of a control sample of Scots pine ... 80
Figure 67: Comparison of oven dry densities before and after degradation ... 80
Figure 68: Mean density profile in longitudinal direction: sample with 30% ML (left), sample with 1% ML (right) ... 81
LIST OF TABLES
Table 1: Overview of carbon footprint and uptake of several building materials [1] ... 19
Table 2: Overview of maintenance costs, recyclability and renewability for commonly used building materials ... 20
Table 3: Properties of bio-based materials ... 25
Table 4: Biological damage of wood by organisms [19] ... 25
Table 5: Categories of fungi [10] ... 28
Table 6: Use classes according to EN 335 [34] ... 36
Table 7: Durability classes according to EN 350-2 [34] ... 36
Table 8: Methods for modification of wood [36] ... 37
Table 9: Overview of advantages and disadvantages of thermal modification [40] ... 38
Table 10: Durability rating scale [46] ... 40
Table 11: Components of the tested materials ... 42
Table 12: Benefits and disadvantages of MRI [54] ... 50
Table 13: Benefits and disadvantages of CT [54] ... 51
Table 14: Specificities of the tested samples ... 52
Table 15: Scan settings EMCT [48] ... 56
Table 16: Overview median mass loss and corresponding durability class ... 62
Table 17: Mean densities of the bio-based materials... 65
Table 18: Influence of the amount of latewood regions on fungal decay for Scots pine ... 75
Table 19: Shape of mini-blocks before and after degradation: (a) spruce (33% ML); (b) beech (21% ML); (c) Scots pine (33% ML) ... 81
1 INTRODUCTION
Nowadays, a wide range of building materials is available on the market. In order to choose which building materials to use in a specific construction project, a balance should be made between the benefits and limits of the available materials. These days, concrete, steel, masonry, glass and bio-based materials are the most commonly used building materials. However, the important issues regarding climate change and resource depletion may lead to a shift in the ranking of the building materials. Therefore, it is important to have a better understanding of the parameters that might affect the choice of building material. These parameters mainly consist of the carbon footprint and uptake, renewability, recyclability, energy consumption and need for maintenance. Table 1 gives an overview of the carbon footprint and uptake of several building materials. In this table, CO2e is the sum of fossil based emissions calculated taking into account IPPC weighing factors (for 100 years). The components of the CO2e are CO2, CH4 and N2O [1].
Table 1: Overview of carbon footprint and uptake of several building materials [1]
Building material Carbon footprint:
CO2e emission [g/kg]
Carbon uptake CO2 uptake [g/kg]
OSB 208 1692
Plywood 229-718 1188-1731
Cross laminated timber (CLT) 362-408 1610-1611
Fresh timber 44-49 1182-1184
Wood fibre insulation 243 1240
Glass wool 3148 -
Stainless steel 3778 -
Float glass 1230 -
Ceramic tile 613 -
Aluminium sheet 2980 -
Reinforced aerated concrete block 511 -
Note that the carbon footprint of concrete in this table is relatively small compared to steel, glass and aluminium. The reason for this is that the cement production is not taken into account. According to a study of Shao et al., the cement and steel industry are responsible for the highest equivalent carbon emissions of all commonly used building materials [2]. In 2012, the production of cement was accountable for approximately 5% of the total carbon dioxide emission [3]. Figure 1 shows the evolution of the 𝐶𝑂2-emissions from cement production over time. In this figure, CCS stands for ‘Carbon capture and storage’, which is a technology that prevents carbon dioxide from entering the atmosphere. Based on the results of the mentioned studies and the trend of carbon dioxide emissions for cement, one can conclude that the production of concrete is not environmentally friendly.
Figure 1: CO2 emissions due to cement production [4]
The relative share of the energy consumption is visualized in Figure 2. In this figure, one can see that the steel and concrete industry are the most energy intense. This is also confirmed in a study of Schmitz et al., who found that the production of one ton cement requires 3-6 GJ and one ton of steel 20-30 GJ [5].
Figure 2: Energy consumption components in building industry [2]
Apart from the carbon footprint and energy consumption, there are a lot of other parameters that may affect the choice of building material. For the most commonly used building materials, an overview of the maintenance costs, recyclability and renewability is presented in Table 2.
Table 2: Overview of maintenance costs, recyclability and renewability for commonly used building materials
Material Maintenance costs % Recyclability Renewable?
Concrete negligible 30% [6] No (aggregate depletion)
Steel High (due to corrosion) 100% [6] No (depletion of iron ore) Glass High (due to cleaning) Theoretically 100% [6],
in reality 10-40% due to waste and damage [7]
A main challenge of the 21th century involves the reduction of the emission of greenhouse gases. In order to satisfy this challenge, the fabrication process of some materials has to improve and/or one could choose to make use of environmentally friendly building materials, for instance bio-based materials, such that the 𝐶𝑂2 emission and the energy consumption decrease.
The use of concrete or steel has become indispensable in almost all constructions, but at the same time these materials are also responsible for huge amounts of 𝐶𝑂2 emissions. In addition, one should be aware of the fact that many materials, including aggregates and iron ore, two important substances of respectively concrete and steel, are finite resources. The depletion of the latter often results in rising costs of raw materials, so using other materials such as bio-based products can be advantageous. However, a change in perspective is necessary in order to tackle the climate issues. One possibility is to reduce the use of concrete and steel and utilize bio-based materials instead when possible. Bio-based materials will never fully replace concrete or steel, because extensive knowledge about their structural behaviour is already available and is still expanding. Furthermore, both the steel and concrete industry are focusing on recyclability and lowering their carbon footprint by innovative concepts. Architects and engineers should, however, try to implement bio-based materials more, such that a harmonious design between steel, concrete and wood is obtained and the overall carbon footprint is reduced. The technology already allows the use of hybrid structures, as can be seen in Figure 3.
Figure 3: Hybrid concrete-timber structure: Illwerke Zentrum Montafon, Austria [11]
From now on, the focus is put on bio-based materials, as many people are still unaware of their benefits and properties. Depending on several properties (thermal, structural, acoustic, etc.), a specific type of material could be interesting for a certain application. Therefore, the first chapter of the literature study deals with some general information regarding bio-based materials and its properties. Since all materials have their limits, it is important to understand to which threats bio-based materials can be exposed. After discussing the threats, good building practice and protection measures for bio-based materials are tackled. This because it is important to prevent fungal growth as much as possible, but also to have an idea of how the material’s characteristics can be enhanced when moisture cannot be avoided, therefore exposing bio-based materials to conditions favouring fungi. The final chapter of literature study describes the procedure and problems of the most widely used laboratory method for determining the natural durability against wood-destroying fungi. In order to tackle these problems, we execute two experiments to obtain more insight in the degradation process.
As a preliminary experiment, the natural durability of several bio-based materials is tested. Since these materials consist of non-wood components, such as glues, coatings, resins, etc., that most likely affect the fungal susceptibility, a modified version of the standardized procedure is used to find out if the materials are sufficiently degraded after 8 weeks of exposure to Coniophora puteana. Additionally, an experiment set-up is proposed such that the effect of the material structure and wood anatomical features on the progress of decay can be investigated using both MRI and X-ray CT. Finally, an analysis is made of the results of a previously executed experiment, in which the moisture distribution of four solid woods is monitored using X-ray CT. In this analysis, we investigate whether the X-rays have an influence on the fungal degradation, how the density varies over time and how the material’s structure affects the fungal susceptibility.
2 LITERATURE STUDY
2.1
Properties of bio-based materials
Throughout human history bio-based materials such as wood, straw, bamboo, reed, hemp, etc. always have had an important role. They have been and are still widely used as construction materials and have important advantages. Wood is, for instance, a very versatile material. After cutting the tree, wood can be adapted to the desired needs and use, as can be seen in Figure 4. The Mannheim Multihalle was initially built as a temporary structure for a horticultural exhibition in Mannheim. It has a roof area of almost 10 000 m² and is one of the largest self-supporting timber grid shell structure in the world [12].
Figure 4: Mannheim Multihalle, wooden roof structure (left); Metropol Parasol, Seville (right) [12], [13]
One of the main advantages of bio-based materials in today’s world is the fact that they are sustainable and recyclable [9]. When bio-based materials are being used in construction applications, they offer some extra advantages [10]:
- Exceptionally low linear coefficient of thermal expansion
- Capture and storage of carbon extracted from atmospheric 𝐶𝑂2 through photosynthesis - Buffering capacity of insulation materials
- Biodegradability at the end of the material’s service life (production of an organic fertilizer and biomethane to supply energy)
- Excellent performance-to-weight ratios
- Lower embodied energy than most man-made materials - Relatively high specific heat capacity
- Beneficial contributions to health and indoor air quality
Note that the way of producing bio-based materials is important for the ecological footprint. Using chemical fertilizers or pesticides has negative consequences for the quality of the environment. Cutting down trees should be done in sustainably managed forests in order to have a low ecological footprint [9].
Bio-based materials also have their limits. When not well applied and therefore exposed to certain conditions that favour insects, fungi or bacteria, decay can occur when the material is not durable in itself or when the durability is not increased with protection products or enhancement methods [14]. In structural applications, this can lead to loss in strength and ultimately compromise the structural stability of the building. Bio-based materials are composed of organic compounds, which is often regarded as at risk for fire. If fire safety is a concern due to the purpose of the building, bio-based materials are not
preferred, unless a fire protection system is implemented. Foreseeing such a protection is costly and the treatment usually has a negative impact on the environment. Abiotic factors such as the sun, water and wind can cause deterioration of bio-based materials as well [14]. Wood is a hygroscopic material, which means that it absorbs and desorbs moisture. This causes swelling and shrinkage, which can lead to damage of the structure when not taken into account.
The type of bio-based material used in a construction project mainly depends on its function in the built facility. An important distinction is made whether the material is used in the main load-bearing structure or not, because the required properties are very different.
2.1.1
Structural function
In case the bio-based material is used in the main load-bearing structure, the most important properties are the strength and stiffness that need to be sufficient to maintain structural integrity. Contrarily to steel and concrete, the variability in strength and stiffness is larger, hence several safety factors should be included in the design. Furthermore, it is important to take into account the fact that the strength of wood is not constant in time. The strength varies with the moisture content and the load duration. From literature, it is found that the strength-load duration relationship approximately follows a hyperbolic curve, which can be seen in Figure 5 [15].
Figure 5: Hyperbolic relation between strength and load duration [16]
In wood design, it is impractical to implement this strength-load duration relationship exactly. It is, however, very important to take this influence into account. For that reason, Eurocode 5 defines five load-duration classes and three service classes, which determine the value of a safety factor taking into account the effect of the moisture content and load duration.
2.1.2
Non-structural function
In case the function of building element is non-structural, the strength and stiffness are of less importance. The application area of bio-based materials is still quite large: thermal insulation, furniture, doors, gates, ships, façade cladding, etc. These specific applications all require some properties that can affect the thermal or acoustic performance, the comfort, the aesthetical appearance, etc. An overview of the most important properties can be found in Table 3.
![Table 1: Overview of carbon footprint and uptake of several building materials [1]](https://thumb-eu.123doks.com/thumbv2/5doknet/3297826.22241/19.892.148.711.433.717/table-overview-carbon-footprint-uptake-building-materials.webp)
![Figure 8: Blue staining fungi invading the sapwood and not the inner heartwood [31]](https://thumb-eu.123doks.com/thumbv2/5doknet/3297826.22241/29.892.281.573.87.351/figure-blue-staining-fungi-invading-sapwood-inner-heartwood.webp)
![Table 6: Use classes according to EN 335 [34] Use class General service conditions Occurring organisms Wood-disfiguring fungi Wood-destroying](https://thumb-eu.123doks.com/thumbv2/5doknet/3297826.22241/36.892.90.769.118.577/classes-according-general-conditions-occurring-organisms-disfiguring-destroying.webp)
![Figure 24: MRI machine for people (left) and for mice (right) [49],[50]](https://thumb-eu.123doks.com/thumbv2/5doknet/3297826.22241/46.892.95.767.662.906/figure-mri-machine-people-left-mice-right.webp)