002745
This is a publication of:
National Institute for Public Health and the Environment
P.O. Box 1 | 3720 BA Bilthoven The Netherlands www.rivm.nl July 2011
Agricultural
practice
and water
quality
Agricultural practice and water quality on farms
registered for derogation
Agricultural practice and water quality
on farms registered for derogation
Results for 2009 in the derogation monitoring network
Colophon
© RIVM 2011
Parts of this publication may be copied, provided the source is stated: 'National Institute for Public Health and the Environment (RIVM), the title of the
publication and the year in which it was published'.
M.H. Zwart (author), RIVM
C.H.G. Daatselaar (author), LEI
L.J.M. Boumans (researcher), RIVM
G.J. Doornewaard (researcher), LEI
Contact:
Manon Zwart
Centre for Environmental Monitoring
manon.zwart@rivm.nl
This study was commissioned by the Ministry of Economic Affairs, Agriculture and Innovation, within the framework of project 680717, National Programme for Monitoring the Effectiveness of the Minerals Policy (LMM)
Abstract
Agricultural practice and water quality on farms registered for derogation
Results for 2009 in the derogation monitoring network
This report provides an overview of fertilisation practices in 2009 and of water quality in 2009 and 2010 on grassland farms that are allowed to use more animal manure than the limit set in the European Nitrates Directive
(derogation). Data from this research can be used to study the consequences for the water quality. The water quality values measured in 2009 reflect agricultural practices in 2008, which was the third year in which the derogation was applied. The water quality values measured in 2010 reflect the consequences of
agricultural practices in 2009.
The European Nitrates Directive obliges Member States to limit the use of animal manure to a specified maximum (the application standard animal manure of 170 kg N/ha). A Member State may request permission from the European Commission to deviate from this obligation under specific conditions. In
December 2005, the Commission granted the Netherlands the right to derogate from the obligation from 2006 to 2009. On 5 February 2011, this derogation was extended to 2013. One of the underlying conditions of the derogation is that the Dutch government establishes a monitoring network and reports the results each year to the European Commission.
In 2006, the National Institute for Public Health and the Environment (RIVM) and LEI, part of Wageningen University and Research Centre, set up a derogation monitoring network. This measures the effects on agricultural practice and water quality when farmers are allowed to deviate from the European application standard for livestock manure. The derogation monitoring network is part of the Minerals Policy Monitoring Programme (LMM). The agricultural practice was measured on 275 grassland farms and the water quality on 285 grassland farms. The monitoring network covers 300 farms. However, fewer than 300 farms are reported: there were changes to the farms included in the monitoring network and, in retrospect, not all farms applied for derogation or were awarded it.
Keywords:
nitrates directive, derogation decision, agricultural practice, water quality, manure
Rapport in het kort
Landbouwpraktijk en waterkwaliteit op landbouwbedrijven aangemeld voor derogatie
Resultaten meetjaar 2009 in het derogatiemeetnet
Dit rapport geeft een overzicht van de bemestingspraktijk in 2009 en de waterkwaliteit in 2009 en 2010 op graslandbedrijven in Nederland die meer dierlijke mest mogen gebruiken dan in de EU-Nitraatrichtlijn is aangegeven (derogatie). De gegevens uit dit onderzoek kunnen worden gebruikt om de gevolgen voor de waterkwaliteit te bepalen. De waterkwaliteit gemeten in 2009 geeft de gevolgen weer van de landbouwpraktijk in 2008, het derde jaar dat de derogatie in de praktijk werd toegepast. De waterkwaliteit gemeten in 2010 geeft de gevolgen weer van de landbouwpraktijk in 2009.
De Europese Nitraatrichtlijn verplicht lidstaten het gebruik van dierlijke mest te beperken tot een bepaald maximum (de gebruiksnorm dierlijke mest van 170 kg N/ha). Een lidstaat kan de Europese Commissie vragen om onder voorwaarden van deze beperking af te wijken. Nederland heeft in december 2005 derogatie gekregen om van 2006 tot en met 2009 af te mogen wijken van de gestelde norm. Deze derogatie is op 5 februari 2010 verlengd tot en met 2013. Een van de voorwaarden is dat de Nederlandse overheid een
monitoringnetwerk inricht en over de resultaten daarvan jaarlijks aan de Commissie rapporteert.
Het Rijksinstituut voor Volksgezondheid en Milieu (RIVM) en het LEI, onderdeel van Wageningen Universiteit en Research Centrum, hebben in 2006 voor Nederland een monitoringnetwerk opgezet. Dit zogenoemde derogatiemeetnet meet de gevolgen voor de landbouwpraktijk en de waterkwaliteit als
landbouwbedrijven afwijken van de Europese gebruiksnorm voor dierlijke mest. Het derogatiemeetnet is een onderdeel van het Landelijk Meetnet effecten Mestbeleid (LMM). Van 275 graslandbedrijven is de bedrijfsvoering gemonitord en van 285 bedrijven de waterkwaliteit. Het meetnet omvat
300 graslandbedrijven. Dat er minder dan 300 bedrijven zijn gerapporteerd komt doordat sommige bedrijven achteraf geen derogatie toepasten of toegekend kregen en door bedrijfswisselingen in het meetnet.
Trefwoorden:
Preface
The National Institute for Public Health and the Environment (RIVM) and LEI, part of Wageningen University and Research Centre, have drawn up this report, commissioned by the Ministry of Economic Affairs, Agriculture and Innovation (EL&I) and the Ministry of Infrastructure and the Environment (I&M). LEI is responsible for the information about agricultural practice and RIVM for the water quality data. RIVM is also the official secretary within this project. RIVM report 680717001/2007 describes the design of the derogation network and the reporting method used in the annual reports. Annual reports have been released in 2008, 2009 and 2010.
This report provides an overview of agricultural practices in 2009 for all farms in the derogation monitoring network that have registered for derogation. This includes data about fertilisation and the nutrient surpluses realised. Information is also provided about the results of water quality monitoring in 2009 and 2010 at farms in the derogation monitoring network.
The present report covers virtually all the 300 farms participating in the derogation monitoring network. Due to changes in the sample population, such as relocations, variations between the participating farms occur across the years measured. Moreover, in retrospect, not each farm makes use of the derogation in practice. Consequently the numbers of farms in the different regions and water types can vary each year. The 300 farms were already participating in the Minerals Policy Monitoring Programme (LMM) or were recruited and sampled during the sampling campaign.
The authors thank Mr M. van Rietschoten of the Ministry of Economic Affairs, Agriculture and Innovation, Mr K. Locher of the Ministry of Infrastructure and the Environment and Mr G. Velthof and Mr J. Schröder of the Professional Committee for the Fertilisers Act (CDM) for their critical comments. Finally, we would like to thank our colleagues from LEI and RIVM who, each in their own way, have contributed to the development of this report.
Manon Zwart, Co Daatselaar, Leo Boumans and Gerben Doornewaard 29 April 2011
Contents
Summary—11
1 Introduction—19
1.1 Background—19
1.2 Previous reports—20
1.3 Content of this report—20
2 Design of the derogation monitoring network—23
2.1 Introduction—23
2.2 Design and realisation of the sample—24 2.2.1 Number of farms in 2009—24
2.2.2 Representativeness of the sample—25 2.3 Description of the farms in the sample—26 2.4 Monitoring of water quality—28
2.4.1 Sampling at farms—28
2.4.2 Chemical analyses and calculations—32
3 Results for 2009—33
3.1 Agricultural characteristics—33
3.1.1 Nitrogen use via livestock manure—33
3.1.2 Fertiliser use compared to the application standards—34 3.1.3 Crop yields—36
3.1.4 Nutrient surpluses—37
3.2 Water quality—39
3.2.1 Leaching from the root zone, measured in 2009—39 3.2.2 Ditch water quality, measured in 2008-2009—41 3.2.3 Provisional figures for the measurement year 2010—43
4 Changes in the monitoring network since the derogation—47
4.1 Introduction—47
4.1.1 Method used for comparison of successive years.—47 4.2 Trends in agricultural practice—48
4.2.1 Classification of the farms—48 4.2.2 Use of livestock manure—49
4.2.3 Use of fertilisers compared to the application standards—49 4.2.4 Crop yields—52
4.2.5 Nutrient surpluses on the soil surface balance—53 4.2.6 Agricultural practices summarised—54
4.3 Evolution of the water quality—55
4.3.1 Development in average concentrations from 2007 through 2010—55 4.3.2 Influence of weather conditions—57
4.3.3 Water quality summarised—58
4.4 Effect of agricultural practice on water quality—59 References—61
Appendix 1 The derogation decision, relevant articles—65
Appendix 2 Selection and recruitment of participants for the derogation monitoring network—67
Appendix 3 Monitoring of farm characteristics—73 Appendix 4 Sampling of water on farms—83 Appendix 5 Methods for correction for weather—93
Summary
Background
The Nitrates Directive obliges EU Member States to limit the use of livestock manure to a maximum of 170 kg of nitrogen per ha per year. A Member State can, under certain conditions, ask the European Commission if it may deviate from this obligation (derogation). In December 2005, the European Commission issued a derogation decision to the Netherlands for the period 2006-2009; in February 2010, this was extended until December 2013. Under this decision, grassland farms with 70% or more grassland may, under prescribed conditions, apply up to 250 kg nitrogen (N) per ha to their land in the form of manure from grazing livestock. In return the Dutch government is obliged to set up a
monitoring network in accordance with the requirements stipulated in the derogation decision of the European Commission. Each year the Netherlands must also provide the European Commission with information – based on monitoring and model-based calculations – about the quantities of fertilisers applied to each crop per soil type and about the evolution of water quality.
The derogation monitoring network
In 2006, a new monitoring network was designed and established to monitor the evolution in agricultural practices and water quality as a consequence of the derogation. This network comprises 300 farms that applied for derogation. The derogation monitoring network was set up by expanding the Minerals Policy Monitoring Programme (LMM). By using a stratified random sampling method, the 300 farms are distributed as evenly as possible throughout the Netherlands in terms of region (sand, loess, clay and peat), farm type (dairy farms and other grassland farms) and economic size class, and with this the emphasis is on the sand region. With this approach, the requirement that the derogation decision be representative for all soil types (clay, peat, sand and loess soils), fertilisation practices and cropping patterns – with emphasis on the sand region – is
effectuated.
Characteristics of the farmland and the farms in the derogation monitoring network
1 Characteristics of farms included in the derogation monitoring network for 2009, per region.
Characteristics Region
Sand Loess Clay Peat All
Number of farms in the monitoring network 160 20 60 60 300
Number of farms with derogation and fully processed in FADN
158 18 58 59 293
- of which specialised dairy farms 137 15 51 53 256
- of which other grassland farms 21 3 7 6 37
Descriptive characteristics
Acreage of cultivated land (ha) 48.7 47.7 55.9 61.7 52.7
Percentage grassland 80 74 84 92 83
Milk production (kg FPCM1) per ha fodder crop 15,400 13,400 15,500 13,400 14,900 FPCM = Fat and Protein Corrected Milk - this is a comparative standard for milk with different fat and protein
contents (1 kg milk with 4.00% fat and 3.32% protein = 1 kg FPCM). The means reported only refer to the 256 specialised dairy farms.
In 2009, the total agricultural area in the derogation monitoring network was 1.8% of the area used by all derogation farms that fulfilled the criteria for inclusion in the network (the sample population). At 52.7 ha (see Table 1), the mean acreage of farms in the derogation monitoring network is larger than that of the sample population (43.9 ha). Dairy farms in the network also produced more milk per hectare, especially in the clay region. The percentage of farmland used as grassland (83%, see Table 1) is slightly higher than in the sample population (81%).
Use of fertilisers
In 2009, farms in the derogation monitoring network used on average 253 kg of nitrogen from livestock manure per ha of cultivated land (see Table 2) and, with this, exceeded the application standard for livestock manure at farm level. On arable land an average of 179 kg per ha was used, whereas on grassland 270 kg nitrogen from livestock manure was applied.
The use of plant-available nitrogen from livestock manure and inorganic fertiliser (calculated with the prevailing statutory availability coefficients) was 283 kg per ha on grassland and 127 kg per ha on arable land (mainly silage maize - see Table 2). On grassland in the sand region and on arable land in the loess region, use was higher than for the 2009 application standards but, at the farm level, the use in all regions was below the nitrogen application standards. Phosphate use from livestock manure and inorganic fertiliser on arable land was on average 94 kg P2O5 per ha, slightly above the 2009 phosphate application standard on
arable land, while on grassland (102 kg P2O5 per ha) in the sand and loess
regions the grassland was also fertilised by several kilograms over the phosphate application standards. At the farm level, phosphate use was just below the average for phosphate application standards in the clay and peat regions and several kilograms above that of the sand and loess regions.
2 Mean use of fertiliser on farms in the derogation monitoring network in 2009, per region.
Characteristics Region
Sand Loess Clay Peat All Fertiliser use
Nitrogen from livestock manure (kg N per ha) Farm level 255 245 250 253 253 Arable land2 185 181 171 163 179 Grassland 273 269 269 262 270 Total plant-available nitrogen1 Arable land2 124 172 131 112 127
(kg N per ha) Grassland 286 247 313 259 283
Total phosphate1 Arable land2 95 88 91 100 94
(kg P2O5 per ha) Grassland 103 115 100 97 102
1 From livestock manure, other organic fertiliser and inorganic fertiliser. The quantity of plant-available nitrogen
from livestock manure and other organic fertiliser was calculated using the statutory availability coefficients determined for 2009.
Crop yield and nutrient surpluses at farm level
On average, yields of 184 kg of nitrogen and 74 kg of phosphate were estimated for silage maize and yields of 259 kg of nitrogen and 86 kg of phosphate were calculated for grassland (Table 3). The mean nitrogen surplus on the soil surface balance in 2009 was calculated to be 208 kg per ha. This surplus decreases in the sequence peat >clay >sand >loess (Table 3). The high surplus in the peat region was partly caused by an average of 75 kg of net nitrogen mineralisation per ha being included in the calculation, whereas in the other regions the net nitrogen mineralisation was negligible. The phosphate surplus in the soil balance is on average 20 kg P2O5 per hectare with little difference between the regions.
3 Mean estimated silage maize yield and calculated grassland yield on all farms that satisfied the selection criteria for applying the calculation method (Aarts et al., 2008) and nutrient surpluses on the soil surface balance on the farms in the derogation monitoring network in 2009, per region.
Characteristics Region
Sand Loess Clay Peat All Estimated silage maize yields1
kg N per ha 184 191 189 173 184
kg P2O5 per ha 73 77 77 75 74
Calculated yield on grassland1
kg N per ha 254 287 253 270 259
kg P2O5 per ha 84 97 86 90 86
Nutrient surpluses per ha cultivated land Nitrogen surplus on the soil surface
balance (kg N per ha) 196 172 222 237 208
Phosphate surplus on the soil surface
balance (kg P2O5 per ha) 21 25 20 18 20
1 The silage maize and grassland yields are based on 178 of 275 farms. The other farms did not satisfy the
selection criteria.
Comparison of agricultural practice for the years 2006 to 2009
Comparison of the results for the years 2006 to 2009 reveals that milk production per farm and per hectare have increased. There was also an associated increase in the production of livestock manure, yet due to a greater export of livestock manure in particular, the use of livestock manure remained more or less the same until 2009. In 2009, the stocks of livestock manure decreased, in contrast to the previous 3 years, as a result of which the use of animal manure in 2009 increased in comparison to the previous three years. The phosphate application standards were also stricter in the years 2006-2008, which mainly led to less use of inorganic phosphate fertiliser. In 2009, the use of phosphate fertiliser decreased further. However, the phosphate surplus on the soil balance decreased no more in 2009, partly due to increased use of livestock manure. The consumption of nitrogen fertiliser in 2009 was not different from previous years. The nitrogen surplus in the soil balance rose slightly due to the increased use of livestock manure.
In 2009, the calculated maize yield (kg N and P2O5 per hectare) was about the
same as the mean for the years 2006-2008. The dry matter yield (ds) was slightly higher in 2009. In 2009, the estimated grassland yield (kg dry matter and P2O5 per hectare) was not different from the mean for the years 2006-2008.
The yield in kg N in 2009 was, indeed, well below the mean of the previous three years.
From a comparison of several years, it can be concluded that the use of
livestock manure in 2009 was higher than the mean of the previous three years. The decrease in the stocks of livestock manure in 2009, as opposed to the increases in the years 2006-2008, is the most important reason for this. This increased fertiliser use, with constant use of nitrogen fertiliser and slightly decreased use of phosphate fertiliser, did not result in higher crop yields but did lead to slightly higher soil surpluses for nitrogen and phosphate in 2009
compared to the years 2006-2008.
Water quality in measurement year 2009
The water quality measured in 2009 partly reflects the agricultural practices in the third year of derogation (2008) and previous years. The mean nitrate concentration was higher in the sand and loess regions than in the other two regions, just as in previous years.
4 Quality of the water leaching from the root zone on farms in the derogation monitoring network in 2009: mean nitrate concentration, total nitrogen and phosphorous (in mg/l) and the percentage of farms with a mean nitrate concentration higher than 50 mg/l.
Characteristic Region
Sand Loess Clay Peat
Number of farms 154 18 56 57
Nitrate (NO3) (mg/l) 39 51 20 7
Nitrate% >50 mg/l 31 56 12 2
Nitrogen (N) (mg/l) 11.5 12.1 6.5 7.7
Phosphorus (P) (mg/l) 0.15 0.04 0.28 0.37
In the sand, clay and peat regions, the nitrate and total nitrogen concentrations in the ditch water were on average lower than in water leaching from the root zone (see Table 5). In the sand and clay regions, the phosphorous
concentrations in the ditch water were comparable to those in the water
leaching from the root zone. In the peat region, the phosphorous concentrations in the ditch water were lower than in the water leaching from the root zone.
5 Quality of the ditch water in 2009: mean nitrate concentration, total nitrogen and phosphorous (in mg/l) and the percentage of farms with a mean nitrate concentration higher than 50 mg/l.
Characteristic Region
Sand Clay Peat
Number of farms 29 55 55
Nitrate (NO3) (mg/l) 26 10 4
Nitrate% >50 mg/l 21 0 0
Nitrogen (N) (mg/l) 7.8 4.3 4.2
Water quality in measurement year 2010, preliminary results
The table below shows the provisional results for the water quality in 2010. These partly reflect agricultural practices in 2009 (fourth year of derogation). These can therefore be directly linked to the agricultural data that are also stated in this report. The final results will be included in the report for 2012 (these are not expected to strongly deviate from the provisional results).
6 Quality of the water leaching from the root zone in 2010: mean nitrate concentration, total nitrogen and phosphorous (in mg/l) and the percentage of farms with a mean nitrate concentration higher than 50 mg/l.
Characteristic Region
Sand Loess Clay Peat
Number of farms 158 0 58 59 Nitrate (NO3) (mg/l) 46 * 28 12 Nitrate % >50 mg/l 41 * 12 3 Nitrogen (N) (mg/l) 13.2 * 8.3 9.7 Phosphorus (P) (mg/l) 0.15 * 0.21 0.43
* At the time of preparation of the present report, results from the loess region were not available: sampling was conducted between October 2010 and March 2011.
7 Quality of the ditch water in 2010: mean nitrate concentration, total nitrogen and phosphorous (in mg/l) and the percentage of farms with a mean nitrate concentration higher than 50 mg/l.
Characteristic Region
Sand Clay Peat
Number of farms 30 57 57
Nitrate (NO3) (mg/l) 32 11 4
Nitrate% >50 mg/l 20 0 0
Nitrogen (N) (mg/l) 9.5 4.4 4.0
Phosphorus (P) (mg/l) 0.14 0.23 0.15
Comparison of water quality results between 2007 and 2010
This year's results are available from four consecutive sampling years (except for the loess region). Therefore, a simple analysis has been performed in which the years are compared. The graphs below shows the results for nitrate leaching from the root zone and ditch water to illustrate the change in concentrations. Figure 9 also shows concentrations for the sand region adjusted for the effects of precipitation.
Ditch water derogation monitoring network 0 5 10 15 20 25 30 35 40 45 2007 2008 2009 2010
Water quality measurement year
Ni tra te mg /l sand region clay region peat region
8 Illustration of the nitrogen concentrations in the ditch water in successive measurement years.
Leaching nitrate from root zone derogation monitoring network
0 10 20 30 40 50 60 70 80 2007 2008 2009 2010
Water quality measurement year
Ni tra te mg /l sand region clay region peat region loess region sand region corrected
9 Illustration of nitrogen concentrations in the root zone in successive measurement years.
The conclusion is that most concentrations did not relevantly change during the current measurement period. Where changes were observed these were probably correlated with:
• differences in the precipitation surplus; • differences in the hydrological conditions.
Only the phosphorus concentrations in ditch water in the clay and peat regions exhibit a relevant difference (Table 50). These concentrations decreased in 2010. It should be noted that this decline was not visible in previous years. Nitrate and nitrogen concentrations also exhibit a relevant decrease in the loess region. The decrease is also mentioned and described in the progress report (Zwart et al., 2010). For this region, fewer than four survey years are available. After correction for the effect of precipitation in the sand region, the
2009. However, it should be remembered that the results for 2010 are only provisional. The final concentrations will be given in the progress report for 2012 and in that report it will also be apparent if this decreasing trend has continued in the 2011 water quality.
Effect of agricultural practice on water quality
Nitrogen
Nitrate concentrations show no relevant decrease in the sand region between 2007 and 2008 after adjusting for weather. The decrease in the nitrate
concentration between 2008 and 2009 cannot be adequately explained in terms of the developments in agricultural practice. The decrease in the nitrogen surplus is small, not relevant and has not been observed in all regions. Since 2010 is a very dry year, the adjusted nitrate concentration in groundwater shows a slight decrease in the sand region while the measured concentrations show an increase between 2009 and 2010. The decrease in the adjusted concentrations cannot be explained by the slight increase exhibited by the nitrogen surplus in the sand region. This is illustrated in Figure 10 with a trend line for both agricultural practice and water quality.
0 10 20 30 40 50 60 70 80 2007 2008 2009 2010
Water quality measurement year
Ni tra te mg /l 0 50 100 150 200 250 300 N -s u rp lu s k g N /h a
sand region clay region peat region loess region sand region corrected N-surplus loess N-surplus sand N-surplus peat N-surplus clay
Leaching nitrate from root zone and associated nitrogen surplus agriculture
10 Illustration of nitrate concentrations leaching from the root zone by soil-type region, together with the N-surplus from agricultural practice.
Phosphate
The phosphate surplus on the soil balance decreased during the measurement period to 2009; in 2009, however, the decrease stopped. The effect of this decrease is not observed in the water quality. Here, both small increases as well as decreases can be seen. In 2010, a relevant decrease in phosphorus
concentration was observed in the water quality for the first time. The cause is possibly the strong fixation of phosphate to the soil. The phosphorous
concentration in the leaching water and the ditch water is therefore mainly determined by the hydrological conditions.
1
Introduction
1.1 Background
The Nitrates Directive obliges EU Member States to limit the use of livestock manure to a maximum of 170 kg of nitrogen per ha per year. A Member State can, under certain conditions, ask the European Commission if it may deviate from this obligation (derogation). In December 2005, the European Commission issued the Netherlands with a definitive derogation decision under which
grassland farms, cultivating at least 70% of their total area as grassland, were allowed to apply up to 250 kg of nitrogen per ha in the form of livestock manure that originates from grazing livestock (EU, 2005). The derogation decision covers the years 2006 to 2009 and was extended in February 2010 to December 2013 (EU, 2010). In return for this, the Dutch government is obliged to collect a wide range of data regarding the effects of the derogation and to report these annually to the European Commission.
One of the obligations of the derogation decision (see Appendix 1) concerns 'the formation of a monitoring network for the sampling of groundwater, soil
moisture, drainage water and ditches on farms permitted an individual derogation' (Article 8 of the decision, paragraph 2). The monitoring network must 'provide data on the nitrate and phosphorus concentrations in the water leaving the root zone and ending up in the groundwater and surface water system' (Article 8, paragraph 4). This monitoring network, which covers at least 300 farms, should be 'representative for all types of soil (clay, peat, sand, and loess), fertilisation practices and crop rotations' (Article 8, paragraph 2). However, within the monitoring network, the monitoring of water quality on farms on sandy soils should be improved (Article 8, paragraph 5). The composition of the monitoring network should remain unchanged during the period (2006-2013) to which the decision applies (Article 8, paragraph 2). During the negotiations with the European Commission it was agreed that the design of this monitoring network would tie in with the existing national network for monitoring the effectiveness of the minerals policy, the Minerals Policy Monitoring Programme (LMM), under which the water quality and operational management of farms selected for this purpose has been monitored since 1992 (Fraters and Boumans, 2005). It was also agreed that participants in the LMM, who satisfy the conditions, could be regarded as participants in the monitoring network for the derogation. Accordingly, the derogation monitoring network has become part of the LMM. For the LMM the top metre of the phreatic
groundwater, the soil moisture and/or the drainage water are sampled, as this is considered to sample the water leaving the root zone (see Appendix 4).
Aside from the obligation to monitor, there is the requirement to report the evolution of the water quality. The report should be based on 'the monitoring of leaching from the root zone, the surface water quality and the groundwater quality, as well as on model-based calculations' (Article 10, paragraph 1). Furthermore, an annual report must be submitted for the different soil types and crops regarding the fertilisation and yield on grassland farms on which
derogation is permitted, to provide the European Commission with an
understanding of the management on these farms and the degree to which this has been optimised (Article 10, paragraph 4). This report is intended to meet the aforementioned reporting requirements.
1.2 Previous reports
The first report (Fraters et al., 2007) was limited to a description of the derogation monitoring network, the progress made in 2006 in terms of setting this up, the design and content of the reports for the years 2008 to 2010, as well as a general description of the measurement and calculation methods to be used, and the models to be applied.
In 2008, the second report was published. This contained the first results from the derogation monitoring network (Fraters et al., 2008). The first year of derogation was 2006. The figures about agricultural practice concerned farm practice under derogation. The water quality data from 2006 relate to the agricultural practice from 2005 and therefore are not yet related to farm practice under derogation.
The third progress report was published in 2009; this contains the data from 2007 (Zwart et al., 2009). A brief comparison is also made between the results from 2006 and 2007, with the caveat placed that water quality data from 2006 related to agricultural practice in 2005. In 2005 there was no derogation and so there was no data set available from which to draw conclusions about trends. The fourth progress report was published in 2010; this contains the data from 2008 and 2009 (Zwart et al., 2010). A brief comparison of the results from 2007, 2008 and 2009 is also made, with the caveat that this is a very limited data set from which to draw solid conclusions about trends. For the first time, a limited analysis of the relationship between farm results and the associated water quality was conducted.
1.3 Content of this report
This is the fifth annual report about the results of the derogation monitoring network. It reports on the fertilised crop yields and nutrient surpluses. These surpluses are a major determinant for the quantity of nutrients that could potentially wash out.
The results in this report are based on the data as they are defined in the Farm Accountancy Data Network (FADN). In the FADN, the actual situation on the farm is established according to the report offered by the farmer. These data need not necessarily correspond to the data used in enforcement checks. The area used may differ from the area that is recorded in the land registration system of the National Service (DR) of the Ministry of Economic Affairs, Agriculture and Innovation (EL&I), since land belonging administratively to the farm but which is not actually used for fertilisation is not recorded in the FADN. There may also be other animal numbers, other supply and removal of products and other stocks.
Relating the fertilisation determined using the FADN data to the acreages actually used provides the best possible insight into the relationship between agricultural practice and water quality. However, these data cannot be used to assess compliance with the legislation, since this requires the data as recorded by the National Service for the Implementation of Regulations.
Both annual mean nitrate concentrations measured by region and the results of the limited model calculations are included in the analysis of the data. The calculations quantify the influence of confounding factors on the measured nitrate concentrations. In particular, the nitrate concentration in water leaching
from the root zone is affected not only by fertilisation but also by variations in the precipitation surplus (Boumans et al., 1997). A statistical model has been developed to analyse the effect of variations in the precipitation surplus on the nitrate concentration in the uppermost layer of groundwater (Boumans et al., 1997, 2001). This method also corrects for changes in the composition of the group of participating farms, the sample (Fraters et al., 2004). Participants sometimes have to be replaced during the course of the programme (see
chapter 2) or changes in the acreage of the participating farms occur. As a result of this, the ratio between the soil types and/or drainage classes on the farms in the derogation monitoring network can change during the course of the
programme. The soil type (sand, loess, clay, peat) and the drainage class (poor, moderate, well drained) affect the relationship between the nitrogen surplus and the nitrate concentration measured. A change in the nitrate concentration measured could therefore be caused by a change in the composition of the group of participating farms or changes in the acreage within this group. Chapter 2 contains a brief description of the design and realisation of the derogation monitoring network. It also details the agricultural characteristics of the participating farms and provides a description of how the water quality is sampled. An explanation of the modelling and analyses performed is also given. Chapter 3 presents and discusses the measurement results of the monitoring in 2009. This chapter also contains the provisional results of the water quality monitoring for 2010. Chapter 4 presents the results from the successive derogation years and compares these with each other.
The relevant articles from the derogation decision granted to the Netherlands by the European Commission (EU, 2005) have been included in Appendix 1.
Appendix 2 provides further details about the set-up of the derogation monitoring network. The other appendices provide a detailed justification concerning the registration of data for agricultural practice and the calculation of the fertilisation and the nitrogen and phosphate surpluses (Appendix 3) and how the quality of the water is measured (Appendix 4). Appendix 5 details the methodology applied for weather correction. Finally, Appendix 6 describes the methodology for comparing the results of successive years.
2
Design of the derogation monitoring network
2.1 Introduction
The design of the monitoring network must satisfy the requirements of the European Commission, as stipulated in the derogation decision of December 2005 and the extension of the derogation in 2009 (see Appendix 1).
Previous reports provided extensive details about the composition of the sample and the choices this entailed (Fraters et al., 2007; Fraters and Boumans, 2005). The setting up of the derogation monitoring network and the reporting of the results follows the segmenting of the Netherlands into regions, as was done in the Nitrate Directive Action Programme and the fertilisation legislation. Here four regions are distinguished: the sand region, the loess region, the clay region and the peat region. The acreage of farmland in the sand region constitutes about 46% of the approximately 1.92 million hectares of total farmland in the Netherlands. The acreage of farmland in the loess region constitutes approximately 1.5%, in the clay region approximately 40% and in the peat region approximately 12.5% of the total farmland.
The sampling of the water quality for the measurement year 2009 was carried out during the winter of 2008/2009 in the Low Netherlands and in the summer and the rest of 2009 in the High Netherlands. The Low Netherlands covers the clay and peat regions, and those soils in the sand region that are drained via ditches, whether or not in combination with drainage pipes or channels. The High Netherlands covers the other sand and loess soils. The sampling for determining the water quality for 2010 took place in the winter of 2009/2010 and in the summer of 2010 respectively. Farms that submitted an application for derogation but did not use this were not included in this report so as to ensure that the results concerning the effects of using derogation were not confounded. Consequently the number of farms reported on deviates from 300.
The water quality measured in 2009 partly reflects the agricultural practice of 2008 and the preceding years. The extent to which agricultural practice in a previous year affects the measured water quality depends, amongst other things, on the level of and variation in the precipitation surplus in that year. The difference between the Low and High Netherlands is caused by the difference in hydrology. This difference in hydrology also explains the different sampling methods used in the Low and High Netherlands.
As previously stated, all data about agricultural practices relevant for the derogation were registered, for all 300 derogation farms, according to the FADN system (Poppe, 2004). A description of the monitoring of the agricultural
characteristics and the methods of calculation of the fertilisation and the nutrient surpluses can be found in Appendix 3. The water sampling on the farms was carried out in accordance with the standard LMM procedures (Fraters et al., 2004). This sampling method is explained in Appendix 4.
2.2 Design and realisation of the sample
2.2.1 Number of farms in 2009
The derogation monitoring network is a permanent monitoring network. However, the loss of a number of farms is unavoidable. Farms can drop out because:
• at the end of the year they indicate that they do not use the derogation; • they no longer participate in the LMM because the farm has been sold,
because cultivated land is no longer used or because of administrative problems.
Furthermore, although a farm might have been processed in the FADN, it might have proved impossible to fully describe the nutrient flows. This could have been due to the presence of animals from other owners, as a result of which the import and export of feed, animals and manure could, by definition, not be complete or because of administrative errors in the registration of imports and/or exports.
Table 11 shows the planned and actual number of farms in the derogation monitoring network for 2009, per region (sand, loess, clay and peat) and farm type (dairy farms versus other grassland farms).
11 Planned (design) and realised (realisation) number of dairy and other grassland farms per region in 2009.
Farm type Design/realisation Sand Loess Clay Peat All
Dairy Design 140 17 52 52 261 Realisation water quality 135 15 49 51 250 Realisation FADN monitoring 137 15 51 53 256
For which nutrients flows are complete
132 15 48 52 247 Other grassland farms Design 20 3 8 8 39 Realisation water quality 19 3 7 6 35 Realisation FADN monitoring 21 3 7 6 37
For which nutrients flows are complete
15 3 5 5 28 Total Design 160 20 60 60 300 Realisation water quality 154 18 56 57 285 Realisation FADN monitoring 158 18 58 59 293
For which nutrients flows are complete
147 18 53 57 275
Six of the farms that had participated in the FADN in 2008, no longer did so in 2009. These farms were therefore replaced.
The various sections of this report detail the agricultural practice on the following numbers of farms:
• The description of general farm characteristics (section 2.3) concerns all farms that could be processed in FADN in 2009 and that made use of the derogation (= 293).
• The description of agricultural practices in 2009 (section 3.1) concerns all farms for which the nutrient flows in 2009 could be fully completed in FADN (= 275).
• The comparison between agricultural practices in the years 2006 to 2009 (section 4.2) includes all farms that participated in the derogation network in all years (265 farms). For 243 of these farms the nutrient flows could be fully completed in FADN in all years.
2.2.2 Representativeness of the sample
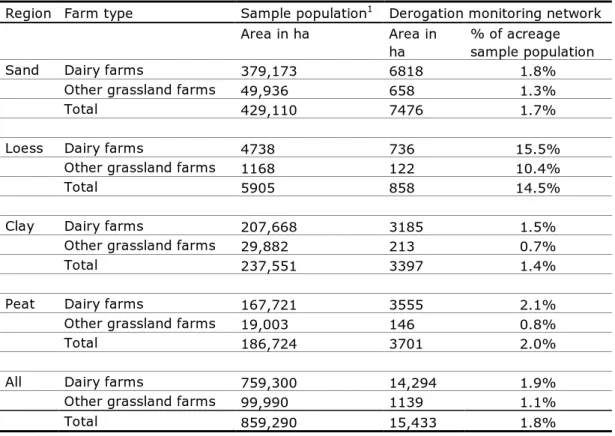
The sample population covers 86.6% of the farms and 96.7% of the acreage of all farms that registered for derogation in 2009 and which satisfied the LMM selection criteria (the sample population, Appendix 2). Farms outside the sample population that did sign up for derogation are mainly other grassland farms with a size of less than 16 NGE (Netherlands units of magnitude). With an area of 15,184 ha, 1.8% of the national acreage of the total sample population has been included in the sample (see Table 12).
A minimum number of farms is needed to be able to make a reasoned statement per region. For loess, that minimum has been set at 15 (Fraters and Boumans, 2005). The loess region is relatively small and so it does not have a lot of derogation farms in the sample population. Consequently, a relatively large number of farms are included in the monitoring network (16.0%). Furthermore, the dairy farms in all regions are more strongly represented in the acreage than the other grassland farms. This is because the desired number of sample farms per farm type is derived during the selection and acquisition process from the share in the total acreage of cultivated land, whereas the other grassland farms included were on average smaller than the dairy farms in terms of the acreage of cultivated land.
12 Area of cultivated land (in ha) in the derogation monitoring network compared to the total area of cultivated land of farms with derogation in 2009 in the sample population, according to the Agricultural Census 2009.
Region Farm type Sample population1 Derogation monitoring network
Area in ha Area in
ha
% of acreage sample population
Sand Dairy farms 379,173 6818 1.8%
Other grassland farms 49,936 658 1.3%
Total 429,110 7476 1.7%
Loess Dairy farms 4738 736 15.5%
Other grassland farms 1168 122 10.4%
Total 5905 858 14.5%
Clay Dairy farms 207,668 3185 1.5%
Other grassland farms 29,882 213 0.7%
Total 237,551 3397 1.4%
Peat Dairy farms 167,721 3555 2.1%
Other grassland farms 19,003 146 0.8%
Total 186,724 3701 2.0%
All Dairy farms 759,300 14,294 1.9%
Other grassland farms 99,990 1139 1.1%
Total 859,290 15,433 1.8%
1 Estimate based on Statistics Netherlands Agricultural Census 2009, processed by LEI. Further information about how the sample population was defined can be found in Appendix 2.
2.3 Description of the farms in the sample
Table 13 describes a number of characteristics of the farms in the derogation monitoring network. This table contains data from all farms in the derogation monitoring network for which the registration in FADN has been fully processed. For comparison, data from companies in the 2009 Agricultural Census (LBT) have been included where these companies are in the sample population (Appendix 2).
13 Description of a number of general farm characteristics in 2009 of the farms in the derogation monitoring network (DM) compared to the mean of the sample population (LBT).
Farm characteristic3 Population Sand Loess Clay Peat All
Total number of farms: 158 18 58 59 293
Area grassland (ha) DM 37.0 34.4 46.5 55.2 42.4
LBT 30.7 29.0 42.3 41.4 35.7
Area silage maize (ha) DM 9.5 9.0 9.5 7.0 9.0
LBT 8.0 7.5 5.9 4.0 6.7
Area other arable land (ha) DM 0.8 4.3 2.6 0.5 1.3
LBT 1.3 3.1 2.5 1.0 1.6
Total area cultivated land (ha) DM 47.3 47.7 58.6 62.7 52.7
LBT 40.1 39.6 50.7 46.4 43.9
Percentage grassland DM 80 74 83 92 82
LBT 77 73 83 89 81
Area natural habitat (ha) DM 0.6 4.3 2.1 0.7 1.2
LBT 0.7 1.1 1.2 0.7 0.8
Stocking density grazing livestock (GVE per ha)
DM
2.26 2.09 2.31 2.01 2.21
LBT 2.24 2.10 1.98 1.88 2.11
Percentage farms with housed animals
DM 15 17 10 12 14
LBT 15 4 5 7 11
Specification livestock density derogation monitoring network (GVE per ha)
Dairy cattle (including young stock)
DM
2.14 1.91 2.12 1.89 2.07
Other grazing livestock DM 0.11 0.18 0.18 0.12 0.13
Total housed animals DM 0.90 0.07 0.40 0.25 0.62
Total all animals DM 3.16 2.15 2.71 2.26 2.83
Source: Statistics Netherlands Agricultural Census 2009, processed by LEI and Informatienet
1DM = Farms in the derogation monitoring network 2009, LBT = Sample population based on Agricultural
Census 2009 (Data Statistics Netherlands (CBS), processed by LEI).
2 GVE = Livestock Unit, this is a comparative standard for animal numbers based on the phosphate production
forfeit (phosphate production forfeit dairy cow = 1 GVE).
3 Areas are given in hectares of cultivated land and the acreage of natural habitats is not included.
An examination of the agricultural characteristics of the sample population and a comparison with the farms from the Agricultural Census (see Table 13) reveals the following differences:
• The mean acreage of cultivated land of the sampled farms is greater than that of the farms in the sample population (52.7 versus 43.9 hectares). This applies to all regions.
• An average of 0.9 ha natural habitat is managed. This area is not included in the calculation of the environmental pressure per hectare of cultivated land (fertilisation, surpluses and the like).
• For the farms sampled, 83% of the acreage is grassland and this is comparable to the mean of the sample population.
• On the farms sampled, an average of 89% of the arable land is used for silage maize (8.7 ha silage maize divided by 9.8 ha total arable land). • In all regions, the livestock density of grazing livestock on the farms
• On 13% of the farms in the derogation monitoring network, housed animals as well as grazing livestock are present. In all regions, the percentage of farms in the derogation monitoring network with housed animals is higher than in the sample population. The presence of housed animals was not a criterion during the stratification process.
• Dairy cattle and the associated young stock constitute almost 93% of the grazing livestock present. The group other grazing livestock consists of beef cattle, sheep, goats, horses and ponies.
These differences between the Agricultural Census and the sample population are such that the sample is not disqualified.
Table 14 provides a more detailed description of dairy farms in the derogation monitoring network. As the correct comparative material was not present in the Agricultural Census, for comparative purposes this table contains the weighted mean of the national sample from the Farm Accountancy Data Network (FADN). This table shows that in all regions the dairy farms have a higher acreage and higher milk production than the weighted national mean.
14 Mean milk production and grazing on dairy farms in 2009 in the derogation monitoring network (DM) compared to the weighted mean of dairy farms in the national sample (FADN).
Farm characteristic Population Sand Loess Clay Peat All
Total number of farms
in DM 131 14 48 52 245 Kg FPCM farm DM 744,000 662,500 885,100 917,000 803,700 FADN 654,400 364,000 846,300 738,300 701,400 Kg FPCM per ha forage crop DM 15,400 13,700 15,500 13,700 14,900 FADN 15,300 13,600 14,300 13,100 14,600 Kg FPCM per dairy cow DM 8530 8,020 8560 8280 8450 FADN 8640 7610 8380 8290 8490
Percentage farms with grazing
DM 84 100 81 83 84
FADN 78 100 85 83 81
1 FPCM= Fat and Protein Corrected Milk. This is a standard used for comparing milk with different fat and
protein contents (1 kg milk with 4.00% fat and 3.32% protein = 1 kg FPCM).
Table 14 specifically reveals the following:
• With more than 14,900 kg FPCM, the mean milk production per ha of forage crop is higher than the national mean. In each of the regions, the milk production per hectare of forage crop on the farms sampled is higher than the weighted national mean.
• On the farms sampled, the average milk production per dairy cow present is slightly higher than the national mean.
• Grazing takes place on 84% of the dairy farms sampled. For farms in the derogation monitoring network, this percentage is slightly higher than the national mean.
2.4 Monitoring of water quality
2.4.1 Sampling at farms
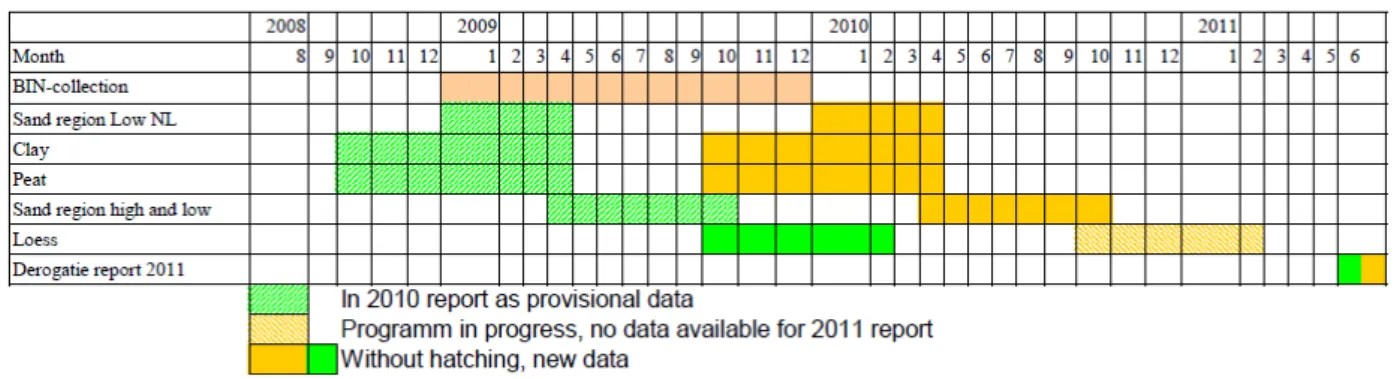
In the measurement year 2009, water quality was sampled at the 285 farms participating in the derogation monitoring network that actually used derogation in 2009 (FADN year - see Table 15 and Figure 17). In 2010, 275 derogation
farms were sampled in the sand, clay and peat soil regions. The groundwater, drain water or soil moisture were sampled. On the participating farms in the Low Netherlands, the ditch water on the farms was also sampled. The number of farms sampled per region in this period is stated in Tables 15 and 16. The mean sampling frequency is also stated. The difference between 2009 and 2010 is explained by farms that were new in the FADN in 2009 and that have not yet participated in the water quality monitoring network; participation in this network takes place one year later (in this case in 2010). Results for the FADN Year 2009 are linked to Water Quality Year 2010.
15 Number of sampled farms registered for derogation per subprogramme and per region for 2009 and the sampling frequency of the leaching (L) and ditch water (DW). The desired sampling frequency is stated in parentheses.
Year Sand region Loess
region
Clay region
Peat region
All farms Of which drained 2009 154 29 18 56 57 L rounds 1.0 (1) - (-) 1.0 (1) 3.2 (2-41) 1.0 (1) DW rounds - (-) 3.8 (4) - (-) 3.9 (4) 4.0 (4)
1 In the clay region, groundwater is sampled up to 2 times; drainage water is sampled up to 4 times. Depending on the type of farm, the total number of samples will therefore be between 3 and 4 in the best case.
16 Number of sampled farms registered for derogation per subprogramme and per region for 2010 and the sampling frequency of the leaching (L) and ditch water (DW). The desired sampling frequency is stated between parentheses.
Year Sand region Loess
region* Clay region Peat region
All farms Of which drained
2010 158 30 - 58 59
L rounds 1 (1) - (-) - (-) 3.1 (2-41) 1 (1)
DW rounds - (-) 4.0 (4) - (-) 3.8 (4) 3.6 (4)
* In the loess region 4 farms were sampled in the period October 2010 to February 2011. The results of this sampling were not yet known when this report was compiled.
1 In the clay region, groundwater is sampled up to 2 times; drainage water is sampled up to 4 times. Depending on the type of farm, the total number of samples will therefore be between 3 and 4 in the best case.
The 2009 water quality sampling occurred in the period between October 2008 and February 2010 and is part of the FADN data from 2008. The 2010 water quality sampling occurred in the period between October 2009 and
February 2011 and is part of the FADN data from 2009. The figures for the water quality in the loess region, sampled from October 2010 to February 2011, are not yet available.
The sampling period per region is stated in Figure 17. In addition to this, the sampling in the loess region for 2009 and 2010 was continued in January and February of the following year, as the sampling there was delayed due to frost. A detailed description of the sampling method per region is provided in
17 Sampling periods for water quality in 2009 (green) and 2010 (yellow) per region per programme.
In this report the water quality data for FADN Year 2009 are still provisional figures. The final figures shall be reported in 2012. Then the data from the loess region for 2010/2011 shall also have been completed and finalised.
Figure 18 shows the distribution of the sampled farms over the main soil type regions. A distinction is also made between dairy farms and other grassland farms. The distribution clearly shows that the focus of the derogation monitoring network lies in the sand region.
18 Location of the 285 grassland farms that participated in the water sampling for the purpose of the derogation monitoring network in 2009.
The soil and drainage characteristics of the farms concerned are given per region in Table 19 for 2009 and Table 20 for 2010. The tables reveal that within a region, other soil types occur in addition to the main soil type after which the region is named. The loess region primarily consists of naturally good-draining soils and the peat region chiefly contains naturally poor-draining soils.
19 Soil type and drainage class (in percentages) per main soil type region on derogation farms sampled in 2009.
Region Soil types Drainage class 1
Sand Loess Clay Peat Poor Moderate Good
Sand region 80 0 12 8 41 49 10
Loess region 1 75 24 0 2 3 95
Clay region 13 0 84 3 41 53 6
Peat 13 0 38 49 89 10 0
1 The drainage classes are linked to the groundwater regime classes. The class naturally poor draining
contains Gt I to Gt IV, the class moderately draining Gt V, V* and VI, and the class good draining Gt VII and Gt VIII.
20 Soil type and drainage class (in percentages) per main soil type region on derogation farms sampled in 2010.
Region Soil types Drainage class 1
Sand Loess Clay Peat Poor Moderate Good
Sand region 81 0 11 8 41 50 10
Loess region * * * * * * *
Clay region 13 0 84 3 41 53 6
Peat 13 0 37 50 89 10 0
1 The drainage classes are linked to the groundwater regime classes. The class o naturally poor
draining contains Gt I to Gt IV, the class moderately draining Gt V, V* and VI, and the class good draining Gt VII and Gt VIII.
* Results from the loess region were not yet available when this report was written.
2.4.2 Chemical analyses and calculations
The chemical analyses of the water samples were carried out in an accredited analytical laboratory of RIVM. Table 21 provides an overview of the methods used for the different components. Further details can be found in Wattel-Koekoek et al. (2008).
21 Components analysed with analysis method and detection limit.
Component Analysis method1 Detection limit
Nitrate (NO3) (mg/l) IC 0.31 mg l-1
Ammonium (NH4-N) CFA 0.064 mg l-1
Total nitrogen (N) CFA 0.2 mg l-1
Total phosphorus (P) Q-ICP-MS 0.06 mg l-1
1 Q-ICP-MS : Quadruple inductively coupled plasma mass spectrometry.
IC : Ion chromatography. CFA : Continuous flow analyser.
An annual mean concentration per component was calculated for each farm. For this calculation, observations with a concentration lower than the detection limit were assigned a value of 0. This allows farm mean concentrations below the detection limit to be calculated.
3
Results for 2009
3.1 Agricultural characteristics
3.1.1 Nitrogen use via livestock manure
Table 22 details the use of nitrogen from livestock manure on farms in the derogation monitoring network in 2009. For most of the farms, the manure production was calculated by means of forfeit standards. However, dairy farmers could also choose to deviate from these standards and to calculate a specific manure production using the so-called Guidance (LNV, 2009). This farm-specific manure production was adopted for dairy farms that indicated they were using the so-called Guidance (and who also benefited from this) and for which all of the necessary data were available (n = 41). On all other farms (n = 236) forfeits were used to determine the manure production. A more detailed explanation of the farm-specific and forfeit calculation methods for manure use is provided in Appendix 3.
22 Mean nitrogen use via livestock manure (in kg N per ha) in 2009 on farms in the derogation monitoring network. Means per region.
Description Sand Loess Clay Peat All
Number of farms 147 18 53 57 275
Use of livestock manure
Produced on farm* 279 233 269 253 268
+ import 11 15 9 15 12
+ stock mutation** 7 9 2 1 5
- export 42 12 29 16 32
Total 255 245 250 253 253
Application standard livestock manure
246 241 246 244 245
Use on arable land*** 185 181 171 163 179
Use on grassland*** 273 269 269 262 270
* Calculated on the basis of forfeit standards with the exception of dairy farms that indicated they were using the Guidance farm-specific excretion dairy cattle (see Appendix 3).
** A positive inventory mutation is a stock decrease and will correspond to supply.
*** The mean use and the application standards on grassland and arable land are based on 269 farms and 203 farms respectively instead of 275 farms, as on 6 farms the allocation of fertilisers to arable land and grassland did not fall within the confidence intervals and because 66 farms had no arable land.
The following conclusions can be drawn from Table 22:
• at 245 kg per ha, the mean application standard for livestock manure was below the derogation standard of 250 kg N from grazing livestock manure because:
o a number of farms had only applied for derogation on a part of their acreage;
o a number of farms also applied livestock manure from housed animals for which a standard of 170 kg per ha applies;
• the mean use of nitrogen from livestock manure (253 kg per ha) was several kilograms above the mean application standard;
• the use of nitrogen from livestock manure decreased in the order sand >clay >peat >loess;
• the use of nitrogen from livestock manure on arable land (mainly silage maize) was considerably lower in all regions than the use on grassland. The use of animal manure in 2009 was 17 kg higher than the mean 236 kg N/ha in 2008 (Zwart et al., 2010). Causes are:
• change in the stock mutation: from a 7 kg increase to a 5 kg decrease means 12 kg more use;
• change (i.e. improvement) to the calculation of the forfeit manure production with an effect of +3 kg;
• a modest decline of 2 kg in manure removal.
For 2009, 22 farms indicated that they worked with farm-specific manure production for their fertilisation plan, but forfeit manure production was used for calculation in the FADN because these farms do not meet all the criteria listed in the 'calculation of grass and maize yields' in Appendix 3.2. Most of these
22 farms have both grazing animals and housed animals and so do not meet the 'no housed animals' criterion. In particular, those farms with housed animals could arrive at distinctly different and probably lower manure productions than are now indicated with the standard manure production figures – by using farm-specific manure production for grazing livestock via the Guide plus the
application of the housing balance for housed animals. If these 22 farms are not included, then the use of livestock manure, averaged over the remaining
253 farms, is 249 kg N/ha, 4 kg lower than in Table 22.
The farms in the monitoring network imported and exported livestock manure. As the production was generally higher than the use permitted, the export of manure was on average higher than the import of manure. This applied to all regions. Table 23 provides a more detailed explanation of the import and export of livestock manure.
23 Percentage of farms in the derogation monitoring network that supplied and/or removed livestock manure in 2009. Means per region.
Description Sand Loess Clay Peat All
No import and export 25 39 32 28 28
Only export 38 33 38 33 37
Only import 24 17 21 32 25
Both import and export 12 11 9 7 11
Table 23 shows that on 28% of the farms there was no import or export of manure. On 37% of the farms manure was only exported, whereas on 25% of the farms manure was only imported. This manure import can be explained by the fact that the purchase of nutrients via livestock manure in 2009 had a clear economic advantage compared to inorganic fertiliser. On 11% of the farms, there was both import and export of manure.
3.1.2 Fertiliser use compared to the application standards
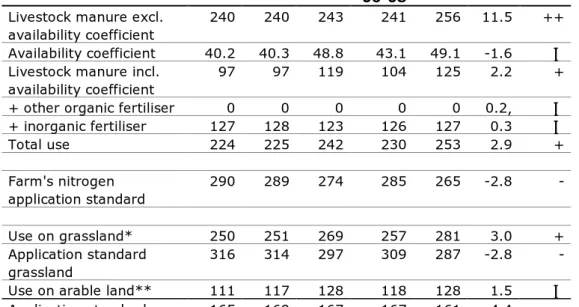
Tables 24 and 25 detail the calculated use of plant-available nitrogen and phosphate from fertilisers. The quantity of plant-available nitrogen from livestock manure is calculated by multiplying the quantity of nitrogen in the livestock manure used (produced on own farm or imported, see Table 22) by the prevailing statutory plant-availability coefficients relevant to the specific
situation (see Appendix 3). These tables also contain the mean application standards per ha for arable land (mainly maize acreage) and grassland to allow a comparison of fertiliser use. These mean application standards are based on the acreage of cultivated crops and the soil type classifications as registered in the FADN and the statutory application standards determined for 2009 (Dienst Regelingen, 2006).
The following conclusions can be drawn from Table 24:
• At the farm level, the calculated total (plant-available) nitrogen use was lower in all regions than the nitrogen application standard.
• The calculated total (active) nitrogen use in all regions on both grassland and arable land was less than the application standard except on grassland in the sand region and on arable land in the loess region. This was partly because 84% of the dairy farms used grazing (Table 14), as a result of which a lower statutory nitrogen availability coefficient (45% in 2009) could be used.
• In the clay region, the total (plant-available) nitrogen use is higher than in the other regions due to a higher use of inorganic fertiliser. Also the nitrogen application standards are higher on the clay soils than on other soils.
• In the loess region, the total (plant-available) nitrogen use was lower than in the other regions due to a lower use of both livestock manure and inorganic fertiliser.
• In all regions, the nitrogen fertilisation on arable land, which mostly consists of silage maize, is considerably lower than the nitrogen fertilisation on grassland.
24 Mean nitrogen use from fertilisers (in kg plant-available N per ha)* on farms in the derogation monitoring network in 2009. Means per region.
Description Category Sand Loes
s
Clay Peat All
Number of farms 147 18 53 57 275
Average statutory
coefficient of effectiveness of livestock manure in%
50 48 50 49 50
Fertiliser use Livestock manure 128 118 125 124 126
Other organic fertiliser 0 0 0 0 0
Inorganic fertiliser 123 106 154 120 127
Total mean 251 223 279 244 253
Nitrogen application
standard 256 238 289 281 266
Use of plant-available nitrogen on arable land**
124 172 131 112 127
Application standard on arable land** 158 164 163 166 161
Use of plant-available nitrogen on grassland**
286 247 313 259 283
Application standard on grassland** 280 266 313 292 289
* Calculated according to the prevailing statutory availability coefficients (see Appendix 3).
** The mean use and the application standards on grassland and arable land are based on 269 farms and 203 farms respectively instead of 275 farms, as on 6 farms the allocation of fertilisers to arable land and grassland did not fall within the confidence intervals and because 66 farms had no arable land.
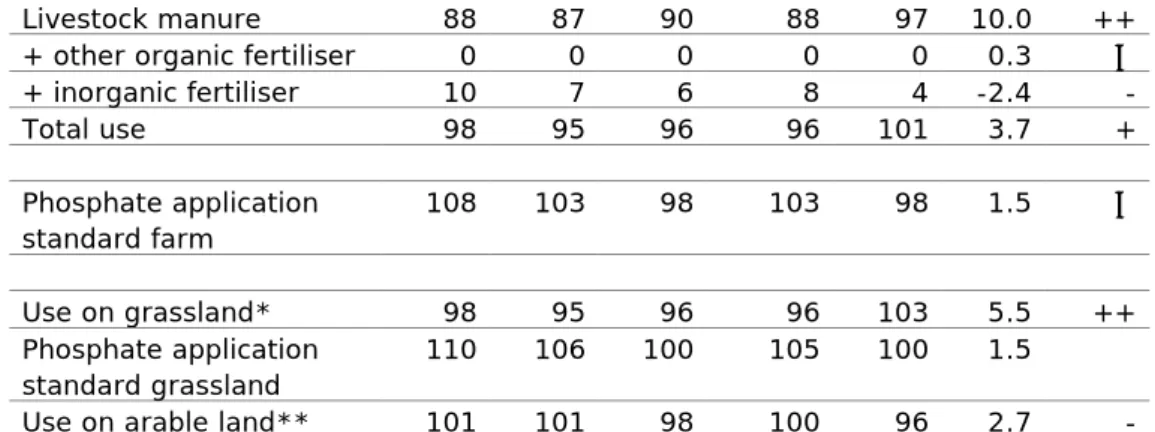
25 Mean phosphate use (in kg P2O5 per ha) in 2009 on farms in the derogation
monitoring network. Means per region.
Description Category Sand Loes
s
Clay Peat All
Number of farms 147 18 53 57 275
Fertiliser use Livestock manure 97 100 93 94 96
Other organic fertiliser 0 0 0 0 0
Inorganic fertiliser 4 5 4 3 4
Total mean 101 105 97 97 100
Phosphate application
standard 98 97 98 99 98
Use of phosphate on arable land* 95 88 91 100 94
Application standard on arable land,** 85 85 85 85 85
Use of phosphate on grassland* 103 115 100 97 102
Application standard on grassland,** 101 100 100 100 100
* The mean use and the application standards on grassland and arable land are based on 269 farms and 203 farms respectively instead of 275 farms, as on 6 farms the allocation of fertilisers to arable land and grassland did not fall within the confidence intervals and because 66 farms had no arable land. ** The mean phosphate application standard on grassland was over 100 kg per ha and on arable land over
85 kg per ha because a small proportion of the plots are phosphate poor or phosphate fixating. On these plots a phosphate application standard of 160 kg per ha was used.
The following conclusions can be drawn from Table 25:
• In the sand and loess regions more phosphate was applied in the form of fertiliser than in the clay and peat regions.
• In the sand and loess regions, the total consumption of phosphate from fertilisers is higher than the phosphate application standard. Since nearly 95% of the phosphate fertiliser comes from livestock manure, the same issues apply to these differences as are mentioned in section 1.3 and in Table 22.
• At an average of 102 kg, the phosphate use on grassland was just above the application standard of 100 kg on grassland. Only in the peat region the phosphate use on grassland was below the application standard.
• However, at 94 kg per ha, the use of phosphate on arable land was higher than the application standard of 85 kg phosphate per ha. This applied to all regions.
• On average 95% of the phosphate was applied via livestock manure.
3.1.3 Crop yields
Table 26 shows the mean crop yield, estimated for silage maize and calculated for grassland, on the farms in the derogation monitoring network that satisfied the criteria for applying the calculation method for crop yield. This calculation method is derived from Aarts et al. (2008). In this method the yield from silage maize is estimated by measuring the quantity of ensilaged silage maize. The grass yield is calculated as the difference between the energy requirement of the cattle herd on the one hand and the energy uptake from farm-grown silage maize (and forage crops other than grass) and purchased feed on the other hand. Further information about this method is provided in Appendix 3.
26 Average crop yield (in kg dry matter, N, P and P2O5 per ha) for silage maize
(estimated) and grassland (calculated) in 2009 on farms in the derogation monitoring network that satisfy the criteria for using the calculation method (Aarts et al., 2008). Means per region.
Description Sand Loess Clay Peat All
Silage maize yields
Number of farms 86 11 26 19 142
Kg dry matter per ha 16,100 16,400 16,400 14,800 16,000
Kg N per ha 184 191 189 173 184
Kg P per ha 32 33 34 33 32
Kg P2O5 per ha 73 77 77 75 74
Yields grassland
Number of farms 100 11 34 33 178
Kg dry matter per ha 9400 10,800 9800 10,100 9700
Kg N per ha 254 287 253 270 259
Kg P per ha 36 42 37 39 38
Kg P2O5 per ha 84 97 86 90 86
Table 26 shows that:
• Estimated mean dry matter yield of silage maize was over 16,000 kg/ha. The yield in the peat region was less than 15,000 kg dry matter per hectare and in the other regions it was more than 16,000 kg dry matter per hectare. • Per hectare an estimated mean of 184 kg N and 32 kg P (74 kg P2O5) was
harvested in the form of silage maize.
• At 9700 kg per ha, the calculated grassland yield of dry matter was considerably lower than the estimated silage maize yield. Due to higher N and P levels in grass products compared with silage maize, both the N-yield per hectare and the P-yield per hectare were, however, higher.
• The calculated grassland yields were highest in the loess region and lowest in the sand region.
3.1.4 Nutrient surpluses
Tables 27 and 28 detail the nitrogen and phosphate surpluses on the soil surface balance for farms in the derogation monitoring network in 2009. The surpluses are calculated using the calculation method described in Appendix 3.