Assessment of odour annoyance in
chemical emergency management
Report 609200001/2009RIVM Report 609200001/2009
Assessment of odour annoyance in chemical emergency
management
M.W.M.M. Ruijten, CrisisTox Consult
R. van Doorn, Municipal Health Service Rotterdam (GGD) A.Ph. van Harreveld, PRA OdourNet BV
Contact: Peter Bos
Centre for Substances and Integrated Risk Assessment peter.bos@rivm.nl
© RIVM 2009
Parts of this publication may be reproduced, provided acknowledgement is given to the 'National Institute for Public Health and the Environment', along with the title and year of publication.
Abstract
Assessment of odour annoyance in chemical emergency management
In chemical emergencies the exposed community is likely to interpret the presence of an unusual odour not common to the normal ‘odour landscape’ as a potential health risk. This report describes a methodology for assessing the airborne concentration level at which the exposed community is likely to become aware of the presence of a chemical by detecting its odour, which in turn may require communicative emergency response activities, even in the absence of toxicological health risks.
The presented methodology will help emergency response organizations to improve the
understanding of odour driven public concerns in chemical emergencies, and improve their ability to assess if and which type of response is adequate.
The methodology builds on consensus reached within the Acute Exposure Guideline Levels (AEGL) program that an airborne concentration producing a distinct odour perception in more than half of an accidentally exposed, distracted population would qualify as significant odour awareness. This concentration is designated as ‘Level of distinct Odour Awareness (LOA)’. The LOA is determined in three steps:
1. Select an appropriate odour threshold, for instance from one of the suggested sources. 2. Derive a distinct odour level based on the Weber-Fechner equation.
3. Adjust for field circumstances such as age, head cold and the usual exposure pattern. The LOA must be developed on a chemical-by-chemical basis. The availability of high quality chemical specific information for steps 1 and 2 is a major hurdle, which has been partly overcome by introducing default values.
Key words:
Rapport in het kort
Bepaling van geurhinder voor crisisbeheersing
Bij chemische incidenten zal de blootgestelde bevolking de aanwezigheid van een ongebruikelijke geur vaak interpreteren als een mogelijk gezondheidsrisico. Dit rapport beschrijft een methode om de luchtconcentratie te schatten waarbij de blootgestelde bevolking zich bewust wordt van de aanwezigheid van een chemische stof door geur(hinder). Deze waarneming kan communicatie en andere maatregelen nodig maken, zelfs bij afwezigheid van relevante toxische risico’s.
De voorgestelde methode zal het begrip bij crisisbeheersers over onrust bij de getroffenen door geurwaarneming vergroten, en hen beter in staat stellen te beslissen wanneer welke
crisisbeheersingsmaatregelen wenselijk zijn.
De methode sluit aan bij consensus binnen het Acute Exposure Guideline Levels (AEGL) programma waarin is bepaald dat een concentratie waarbij 50% van een afgeleide incidenteel blootgestelde bevolking een ‘duidelijke’ geur waarneemt, dit beschouwd wordt als ‘duidelijke geurwaarneming’. De luchtconcentratie waarbij dat optreedt heet ‘Level of Distinct Odour Awareness (LOA)’. De LOA wordt in drie stappen bepaald:
1. Selecteer een goede geurdrempel, bijvoorbeeld via een van de aangegeven bronnen. 2. Bepaal een niveau van ‘duidelijke’ geurwaarneming.
3. Verdisconteer veldomstandigheden zoals leeftijd, verkoudheid en blootstellingspatroon. De LOA moet voor iedere stof apart worden afgeleid. De beschikbaarheid van goede informatie voor de stappen 1 en 2 blijkt in de praktijk beperkend te zijn; deze beperkingen zijn deels omzeild door gebruik van standaardwaarden.
Trefwoorden:
Contents
Summary 9
1 The relevance of odour in chemical emergency response 11
1.1 Risk assessment in chemical emergencies 11
1.2 Background 11
1.3 Appraisal of odour 12
1.4 Scope of this report 13
2 Odour detection 15
2.1 Detectability 15
2.2 Intensity 17
2.3 Hedonic tone 18
2.4 Odour quality 20
3 Irritation, somatic symptoms and annoyance 21
3.1 Irritation 21
3.2 Somatic symptoms 23
3.3 Annoyance 24
3.4 Nuisance 24
4 Field considerations 27
4.1 Variation within the population 27
4.2 Distraction and adaptation 28
4.3 Peak to mean ratio in odour exposure 29
5 Significant odour awareness 31
5.1 Obtain the odour detection threshold (ODT) 31
5.2 Derive distinct odour level 33
5.3 Adjust for field conditions 34
6 Conclusions and recommendations 35
6.1 Conclusions 35
6.2 Recommendations 35
References 37 Appendix 1: The olfactory system 45 Appendix 2: Olfactometry 49 Appendix 3: Consistency of odour thresholds 55
Summary
One of the most prominent public health roles in a chemical emergency is to assess the risk of acute and delayed health effects due to the chemical exposure and to promote an adequate response, including communication with the community. The usual approach is based on a characterization of actual exposure and determination of toxicological exposureresponse (or -effect) relationships for the released chemicals.
In many cases, such a toxicological approach provides clear guidance about the necessary
emergency response approach and activities, but may not suffice for releases of chemicals that can be perceived by the pubic and can cause odour annoyance at ambient concentrations well below a threshold for toxicity. This situation will invariably raise questions in the exposed population which may develop into anxiety unless there is clear communication about the source and the nature of the smell and the risk and severity of potential health effects, even when the toxicological assessment may indicate there is no real health risk.
This report describes a methodology for assessing the airborne concentration level at which the exposed community is likely to become aware of the presence of a chemical by detecting its odour, which in turn may require communicative emergency response activities, even in the absence of toxicological health risks.
The methodology builds on consensus reached within the Acute Exposure Guideline Levels (AEGL) program that an airborne concentration producing a distinct odour perception in more than half of an accidentally exposed, distracted population would qualify as significant odour awareness. This concentration is designated as ‘Level of distinct Odour Awareness (LOA)’. The LOA is determined in three steps:
1. Select an appropriate odour threshold, for instance from one of the suggested sources. 2. Derive a distinct odour level based on the Weber-Fechner equation.
3. Adjust for field circumstances such as age, head cold and the usual exposure pattern. The LOA must be developed on a chemical-by-chemical basis. The availability of high quality chemical specific information for steps 1 and 2 is a major hurdle, which has been partly overcome by introducing default values.
The presented methodology will help local (GHOR, fire brigade) and national (BOT-mi)
emergency response organizations to improve the understanding of odour driven public concerns in chemical emergencies, and improve their ability to assess if and which type of response is adequate.
1 The relevance of odour in chemical emergency
response
1.1 Risk assessment in chemical emergencies
One of the most prominent public health roles in a chemical emergency is to assess the risk of acute and delayed health effects due to the chemical exposure and to promote an adequate response, including communication with the community (WHO, 2009). The usual approach to such risk assessments is based on a characterization of actual exposure and determination of toxicological exposure-response (or -effect) relationships for the released chemicals. To speed up the assessment process, the initial assessments for airborne releases are often based on exposure estimates from air dispersion modelling and emergency guidelines predicting the severity of the health outcome (for instance AEGL, ERPG).
In many cases, such a toxicological approach provides clear guidance about the necessary emergency response approach and activities. The toxicological approach may not suffice for releases of chemicals that can be perceived by the pubic and can cause odour annoyance at ambient concentrations well below a threshold for toxicity. This situation will invariably raise questions in the exposed population which may develop into anxiety unless there is clear
communication about the source and the nature of the smell and the risk and severity of potential health effects, even when the toxicological assessment may indicate there is no real health risk. This report aims to develop a methodology for assessing the concentration level at which the exposed public is likely to become aware of the presence of a chemical by detecting its odour, which in turn may require communicative emergency response activities, even in the absence of toxicological health risks, to avoid unwarranted anxiousness and community stress.
1.2 Background
Humans, like most creatures, continuously need information on their environment ,in order to survive. They rely on their senses to obtain this information and to assess their environment. All sensory perception is provided to the brain for appraisal and is then used to determine and adapt our behaviour in such a way as to optimize survival.
In simple terms of behaviour, perception of odour can lead to two basic behavioural responses: avoidance or approach (Carter, 1998). These responses can occur for example in judging food or water or air, but also in a social or sexual context. Humans can distinguish thousands of odours and can detect odours of some chemicals at concentrations as low as a few parts per trillion. For example, our nose is very sensitive to certain repulsive-smelling compounds, produced in trace amounts by some bacteria and moulds in rotting processes involving proteins, such as methyl
mercaptan and trimethyl amine. The evolution of a high sensitivity for these odorants may have developed in order to provide early warning to avoid dangerous infection or food poisoning. In general, however, there is no correlation between odorous and toxic properties of chemicals. Some compounds cannot be detected by smell, even when they are present in toxic concentrations (for instance carbon monoxide). Other compounds, such as hydrogen sulphide, trigger a response as a result of their odorous properties, although they are present in concentrations well below toxic levels. In the case of hydrogen sulphide, the character of the perceived odour even changes to more pleasant and eventually becomes less odorous at higher, toxic concentrations (AIHA, 1989). For specific compounds the intensity of the perceived odour provides information about the concentration we are exposed to. If the toxicity threshold is substantially higher than the odour recognition threshold, the intrinsic odour of the compound provides an indication of its presence, at a sufficiently low concentration to avoid harm to the exposed human. Conversely, if the odour recognition threshold is much higher than the toxicity threshold, then anybody detecting the odour of the compound has a warning that a safe concentration has already been exceeded
(Amoore,1983).
1.3 Appraisal of odour
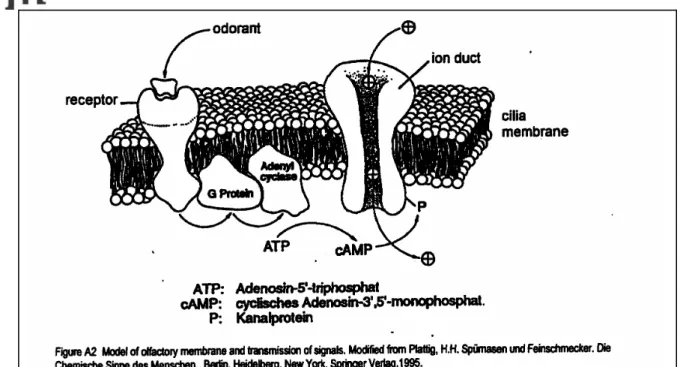
The function of our smell sensor is similar to that of all senses: to translate environmental information into electrical signals, transmitted by neurons firing in our brain. This information is then evaluated in the brain, a process broadly termed appraisal (Buck, 2005).
Appraisal is a complex process, involving various parts of the brain. The processing of smell signals differs from other senses, because the olfactory information goes straight to the limbic system – a fast route to the brain’s emotional and memory organisation centre. Whether we find a smell nice or nasty depends crucially on the memories that are associated with that particular odour. The same smell may have a positive connotation for one individual and a negative connotation for another (Paduch, 1995; Distel and Hudson, 2001). Appendix 1 provides a little more detail about the organization of the olfactory system.
When an individual detects an unknown odour and is not provided with any information about the odour source (and potential adverse effects), the ensuing appraisal is likely to be negative. Such negative appraisals lead to hyper-vigilance and arousal, which can result in a cascade of autonomic symptoms, including altered respiration (often to minimize odour perception), increases in heart rate, feelings of dizziness or throat or chest tightness (Shusterman, 1992; Dalton, 1997).
Paradoxically, the very same effects that are generated as a result of the negative appraisal by the individual are then perceived as and attributed to a direct physiological effect of the chemical exposure, unless information to the contrary is provided from a trusted source. The concentrations at which these adverse appraisal effects occur will be significantly modulated by regular exposure leading to habituation, such as occurs in the workplace (Wysocki et al., 1997, Smeets and Dalton, 2002). Thus, it is possible that concentrations that generate concern in a community will not be of consequence or significance in an occupational setting. Detectable and recognisable concentrations that may generate alarm in a community are not necessarily at toxicologically significant levels.
They do, however, represent concentrations where notification (i.e., informing the public about properties of the unusual odour) is recommended to positively modulate appraisal of the odour and thus prevent or reduce unnecessary anxiety and stress-related health effects.
This document aims to provide scientific underpinning of a ‘Level of distinct Odour Awareness’ (LOA) in accidental chemical exposure of the general population. This LOA can be used to estimate in which locations members of the public are likely to become sufficiently anxious to call the emergency services or environmental complaint response services in significant numbers (‘telephone zone’). The ability to predict the ‘telephone zone’ enables the emergency response system to make informed decisions about communication to the public. Such information is crucial for emergency response organizations.
1.4 Scope of this report
This report is aimed at public health professionals and toxicologists involved in chemical
emergency planning and response or in the derivation of emergency guidelines to assess possible health outcomes of acute inhalation exposures in the general population (such as AEGL and ERPG).
The authors have explored the scientific basis for making use of odour characteristics in
determining the emergency response to chemical incidents. More specifically this report aims to develop a methodology for assessing the concentration level at which the exposed general
population is likely to become aware and potentially alarmed about the presence of a chemical due to odour detection (or rather: annoyance).
2 Odour detection
Four major attributes can characterise the sensory
perception of odorants: detectability, intensity, hedonic
tone and odour quality.
Because there are no instrumental methods that predict
the responses of our sense of smell to a satisfactory
degree, the human nose is the most suitable ‘sensor’.
Olfactometry employs a panel of human noses as sensors.
2.1 Detectability
Detectability is the most common attribute used to
characterize odours. Detectability refers to the minimum
concentration of odorant necessary for detection by some
specified percentage of the test population. In
chemosensory detection, other pathways may contribute,
such as the trigeminal nerve (irritation) and the vomeronasal organ. Using panelist
responses over a range of concentrations, the odour threshold concentration can be
assessed. The variability and likelihood of detection both within and between individuals
plays a role:
Figure 1: Dynamic olfactometry with human assessors, to measure odour concentration according to EN13725. Photo courtesy of Odournet UK Ltd.
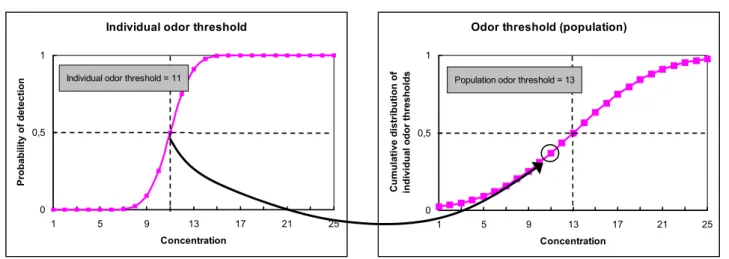
1. As with any psychophysiological measurement (odour, hearing, sight, vibration, et
cetera), the likelihood of an individual to detect a signal is related to the stimulus
intensity. In this case, the likelihood that an individual will smell the chemical is
related to its airborne concentration. An individual’s odour threshold is usually defined
as the concentration where this likelihood is 50% (cf. left part of Figure 2,
Cometto-Muñiz and Abraham, 2008).
2. The population odour detection threshold is the airborne concentration at which 50%
of the population can smell the odorant. This odour threshold is usually determined by
a limited number of panelists in an olfactometry experiment (cf. right part of Figure 2).
At the odour threshold (ODT), the odour concentration of an odour sample (single
compound or mixture) is defined to be 1 odour unit per cubic meter. In modern
olfactometry standards (EN13725:2003, AS/NZS4323.3:2001,) the odour unit is
linked to a specific concentration of a reference odorant, such as 1 ou
E/m
3(European
Odour Unit) ≡ 40 ppb/v n-butanol. The relation is implemented by selecting a sample
from the population of assessors with olfactory sensitivity close to that agreed
Individual odor threshold 0 0,5 1 1 5 9 13 17 21 25 Concentration Probabilit y of det ect ion
Individual odor threshold = 11
Odor threshold (population)
0 0,5 1 1 5 9 13 17 21 25 Concentration C u mulative distribution of
individual odor thresholds
Population odor threshold = 13
Figure 2: Individual and group odour detection thresholds.
The way in which the response of our sense of smell is reduced to a single value of a parameter amounts to a gross simplification of the rich spectrum of sensory information that is actually perceived by the brain. Such a simplification may be useful, however, in describing potential effects. The reduction of a very complex physiological process to a simple parameter is
methodologically very similar to expressing the effects of toxic substances on an organism as the LC50, which indicates the concentration causing lethality in 50% of a well-defined test population
under well-defined test conditions. The complex physiological response is regarded as the unifying reaction that can be caused by a wide range of substances, at an equally wide range of
concentrations.
The inter-individual variability of odour detectability is known to be very large. Given the typical size of an odour panel (6-10 individuals), such a sample cannot be expected to represent the general population adequately. The mere choice of the sample of assessors forming the panel may introduce a large bias in the measured odour threshold. There are two ways out of this dilemma: 1. Use very large odour panels (hundreds of people); this is regarded to be impractical. 2. Standardize the test subjects to assess the sensory response without introducing a bias
(EN13725:2003, Van Harreveld et al., 1998).
Reproducible results can be obtained by selecting panel members with a known sensitivity to an accepted reference material (currently n-butanol). The assumption underlying this method is that the sensitivity for the reference odorant will predict the sensitivity to other substances. However, just as olfactory sensitivity can vary widely across a population to the same chemical, olfactory sensitivity to different chemical compounds can vary dramatically within the same individual. In other words, the sensitivity to a single chemical can never serve as a fully satisfactory predictor for sensitivity to all chemicals in an individual assessor. The approach benefits from the use of a number of assessors in a panel, and excluding those with aberrant responses in a retrospective screening process, that is applied to each dataset underlying a test result according to
EN13725:2003. The use of at least one internal standard has proven the most effective step forward in improving reproducibility compared to not using a referent compound at all. Its
effectiveness has been demonstrated in practice in interlaboratory testing (Van Harreveld et al., 1998). In modern olfactometry standards, the odour unit is therefore linked, through selection of assessors, to a reference odorant concentration (e.g.1 ouE/m3 ≡ 40 ppb/v n-butanol in
EN13725:2003 and AS/NZS4323.3:2001). It is very encouraging that there is such an excellent agreement in data obtained from Dutch and Japanese studies (Hoshika et al., 1993, Annex 3). Appendix 2 provides more detailed information about olfactometry.
2.2 Intensity
Intensity is the second dimension of the sensory perception of odorants and refers to the perceived strength or magnitude of the odour sensation. Intensity increases as a function of concentration. The relation between perceived intensity and the logarithm of odour concentration is linear. The relationship between perceived intensity I and stimulus concentration may be described as a theoretically derived logarithmic function according to Fechner:
5
.
0
)
log(
w⋅
+
=
k
C
ODT
I
whereI perceived intensity of sensation (on intensity scale) C odour concentration in ppb
ODT population odour detection threshold concentration in ppb kw Weber-Fechner coefficient
The preferred method for measuring intensity is derived from the German standard VDI3882 Part 1 (1992). The principle of measurement is the presentation of odour to human assessors in an odour panel, at varying degrees of dilution, hence varying perceived intensity. The members of the panel are asked to indicate perceived intensity at each presentation as a value I on an ordinal seven point intensity scale:
0 no odour
1 very faint odour
2 faint odour
3 distinct odour
4 strong odour
5 very strong odour
6 overwhelming odour
The values for I are then plotted against the logarithm of the odour concentration or the dilution factor. The regression line characterizes the relation between perceived intensity and odour concentration. The point where the regression line intersects with the horizontal axis is approximately equivalent to the detection threshold. For example, the regression equation for menthone was:
From this it may be calculated that a distinct menthone odour (I=3) was perceived at a concentration of 170 ppb.
The Fechner model assumes that the intensity coefficient is constant over the whole exposure range. This assumption may hold below the chemesthetic (irritation) threshold, the slope will likely increase once that threshold is exceeded. In intensity variation studies of pure substances the following kw values were found with the standard method VDI 3882, Part 1: n-butanol 1.9 (1.65
and 2.1) iso-amyl alcohol 2.2; hydrogen sulphide 2.2 (1.9, 2.33 and 2.41); acetone 2.3; menthone 2.35; guiacol 2.66; methylacrylate 2.7; and ammonia 3.5. The range is surprisingly small with a median value of 2.33. The high value for ammonia may be the result of chemesthetic receptor involvement. Odorants with high slope values, such as ammonia dissipate quickly with dilution. Odours with lower slope values, such as n-butanol are more difficult to control.
2.3 Hedonic tone
Hedonic Tone is the third dimension of odour (AIHA, 1989; US EPA, 1992). This is a category judgement of the relative like (pleasantness) or dislike (unpleasantness) of the odour. The method for measuring hedonic tone is derived from a German standard method VDI 3882, Part 2 (1994). The principle of measurement is presentation of the odour to human assessors in an odour panel, at varying degrees of dilution. The members of a panel of assessors are requested to indicate the perceived hedonic tone as a value from the nine-point hedonic tone scale:
+4 very pleasant +3 pleasant
+2 moderately pleasant +1 mildly pleasant 0 neutral odour / no odour -1 mildly unpleasant -2 moderately unpleasant -3 unpleasant
-4 offensive
In contrast to the small inter-individual variation in the perceived intensity of a certain odorant concentration, the inter-individual variation in hedonic perception is substantial, among other factors dependant on odour experience, education and cultural setting (Paduch, 1995; Distel and Hudson, 2001).
For each concentration level, the mean of the values for H of all panel members is calculated, and plotted against the odour concentration. A fictitious example of the plotted result is presented in Figure 3. Using a suitable curve fitting procedure a line can be fitted through the points obtained in the experiment. Using this interpolation, characteristic values can be derived from the plot, such as the odour concentration at H = -2.
There is no simple general relationship between intensity and hedonic tone. For example, a number of odorants (pure substances as well as mixtures) were diluted to reach strong odour detection (I = 4) in an odour panel (Winneke et al., 1995). Subsequently, the members of the panel were asked to estimate the hedonic tone. The results are shown in Table 1. Some strong odours (pine, menthone) were perceived as neutral or pleasant. Other strong odours (sulphur disulphide) were perceived as moderately to clearly unpleasant.
Distel and Hudson (2001) found that ratings for pleasantness for 24 everyday odorants increased when subjects could identify the odour source themselves or were provided with the name by the investigator. Ratings were highest when subjects judged that the names provided by the
: Hedonic tone as a function of odour concentration.
Figure 3
Table 1 : Hedonic perception of odorant concentrations at strong intensity level (Winneke 1995).
Hedonic value Hedonic description Odour quality
H = > 0 Neutral or pleasant Pine, menthone, perfume, bakery H = < 0 and > - 1 Neutral to mildly unpleasant Amylacetate, thinner, butanol H = < - 1 and > -2 Mildly to moderately unpleasant Chlorine, perchloroethylene, biofilter H = < - 2 and > -3 Moderately to clearly unpleasant Pig house, sulfur disulfide, teflon
melting
investigators matched their own perception, suggesting an interaction between individuals’ cognitive representation of odours and their immediate perceptual experience.
2.4 Odour quality
Odour quality is the fourth dimension of odour. It is expressed in descriptors, i.e. words that describe what the substance smells like. This is a qualitative attribute, expressed in words, such as fruity, fishy, hay, nutty. The American Society for Testing and Materials (ASTM) developed a list of 146 descriptors and used it to characterize 160 compounds and mixtures in a standardized manner, with a large panel of 120-140 individuals. The results are published in an ‘Atlas of Odour profiles’ (ASTM, 1968).
In an alternative approach, a formal set of descriptors is arranged in an ‘odour wheel’ to
characterize a specific domain of odorants, for instance to evaluate off flavours in drinking water or to characterise sensory attributes of wines. (Suffet and Rosenfeld, 2007)
The character of an odour may change with concentration level. For example, hydrogen sulphide at levels of 20 ppm or above ceases to be perceived as the typical ‘rotten egg’ smell and its perceived odour at these elevated concentrations will be described as ‘sweet’. At even higher concentrations, which are acutely toxic, hydrogen sulphide becomes odourless.
A special area in odour quality is masking. When an odour is unpleasant, strong odours are usually considered ‘pungent’, not just strong. Deodorants may affect the quality (pleasantness) of the overall just because they mix with the malodours (Ruth, 1986). The mixtures of the smells may be perceived to be less intense or of a different character and hence less unpleasant than the original malodour.
3 Irritation, somatic symptoms and annoyance
3.1 Irritation
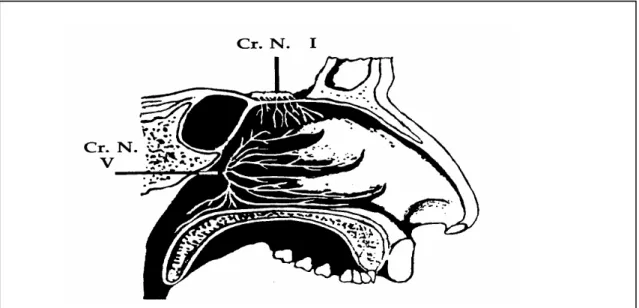
Some chemicals, besides having a true odour, also cause immediate irritation of the eyes, throat and nose. The sensation of stinging, prickling, or burning, mediated by the trigeminal or 5th cranial nerve, is quite distinct from the smell sensation carried out by the
olfactory or 1st cranial nerve (Figure 4). The free nerve endings of the trigeminal nerve are located over the nasal, oral, and ocular mucosae. Stimulation of the trigeminal nerve in the nose produces chemical irritation (Cain and Murphy, 1980; Dalton, 2003; Doty et al., 2004; Arts et al., 2006). Irritation combines with olfaction to form an overall perception.
Figure 4 : Simplified anatomy and innervation of the lateral wall of the nasal cavity: Cr.N. I = first cranial (olfactory) nerve; Cr.N.V. = fifth cranial (trigeminal) nerve (Shusterman 1992).
For example, at low concentrations ammonia has a distinct odour; at higher concentrations
however, the perception of ammonia is also characterised to be pungent, which is indicative for the irritation component of the overall perception. The lowest observed level at which a chemical exposure produces sensory irritation has been the basis for establishing exposure limits for a substantial number of compounds (Bos et al., 1992; Bos et al., 2002; Doty et al., 2004; Van Thriel et al., 2006).
When a volatile compound is inhaled into one nostril and air into the other, the stimulated side can be determined (lateralized) only after the concentration reaches a level that stimulates the
trigeminal nerve; compounds (at concentrations) stimulating olfaction alone cannot be lateralized. The distinction between olfaction and chemesthesis allows to establish both olfactory and
intranasal irritation thresholds.
Van Thriel et al.(2006) assessed odour and chemesthetic thresholds for 15 irritants, and found that these thresholds differed by a factor 10-106. For this study a static olfactometer was used which possibly biased the absolute values of the thresholds.
Odour and irritation sensitivity for methyl isobutyl ketone (MIBK, Dalton, 2000), glutaraldehyde (Cain et al., 2007) the plasticizer TXIB and ethanol (Cain et al., 2005) and ethyl acetate
(Kleinbeck et al., 2008) were evaluated by obtaining olfactory detection and irritation
(lateralization) thresholds, as well as perceived odour intensity and irritation ratings. The best predictors of perceived irritation to high concentrations of MIBK were those measures related to its odour, not to the threshold for sensory irritation. For glutaraldehyde, TXIB, ethanol and ethyl acetate odour detection also occurred at concentration levels well below levels resulting in
chemesthesis, and this appears to be the general rule (Doty et al., 2004). This finding suggests that negative responses to these chemicals involve olfactory reactions, and that exposed individuals find olfaction difficult to distinguish from chemesthesis.
Individuals who lack a sense of smell (anosmics) can detect some, but not all, compounds through other chemosensory pathways although such compounds might produce a perceivable smell in normosmic subjects (Cometto-Muñiz et al., 2005b). This suggests that some compounds only stimulate the olfactory system, and not other pathways, such as the trigeminal nerve. Other compounds stimulate both pathways. These two chemosensory pathways to the brain may activate at different concentration ranges. For example, in anosmics the average n-butanol lateralization threshold was equivalent to the average n-butanol detection threshold. These thresholds for anosmics were equal to the average butanol lateralization threshold from normosmics, whose detection thresholds for n-butanol were substantially lower. This suggests that the detection of n-butanol in normosmics is driven by olfaction rather than by irritation (Kendal-Reed and Walker et al, 1996; Hummel et al., 1996).
However, several studies have suggested that anosmics may have lowered sensitivity to irritants, thus raising concern about the use of anosmic data to predict irritation thresholds for individuals with intact olfactory and trigeminal systems (Kendal-Reed and Walker et al., 1996; Hummel et al., 1996). Some studies suggest that anosmics have a lower trigeminal sensitivity than normosmics (Hummel et al., 2003) and that the processing of trigeminally mediated information is different in the presence or absence of an intact sense of smell, as determined with MRI imaging of the brain (Ianelli et al., 2006).
Wysocki assessed the sensitivity of olfaction and chemesthesis for acetone and n-butanol in workers habitually exposed to acetone in their working environment and in unexposed (naive)
subjects (Wysocki et al., 1997). The naive subjects experienced a different perception of irritation at concentrations of acetone that were below the intranasal irritation threshold. In general, the workers treated the stimuli simply as non irritating odours, whereas the unexposed subjects ascribed irritating qualities to the stimuli. The authors speculated about the possibility that
concentrations of acetone and n-butanol that were well above the olfactory detection threshold but below the lateralization threshold could be annoying to some subjects, simply because they do not recognize the odour and attribute liabilities, for instance toxicity, to the compound.
Smeets and Dalton (2002) reported the same result for isopropanol, where the odour detection threshold was about 4 times higher in occupationally exposed individuals than in naïve subjects, and the irritation threshold a factor 2. Both thresholds were essentially equal for n-butanol; isopropanol exposed workers had a lower odour threshold (not statistically significant) for phenyl ethyl alcohol.
3.2 Somatic symptoms
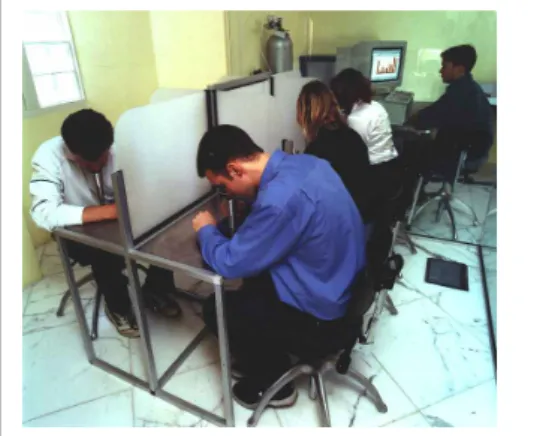
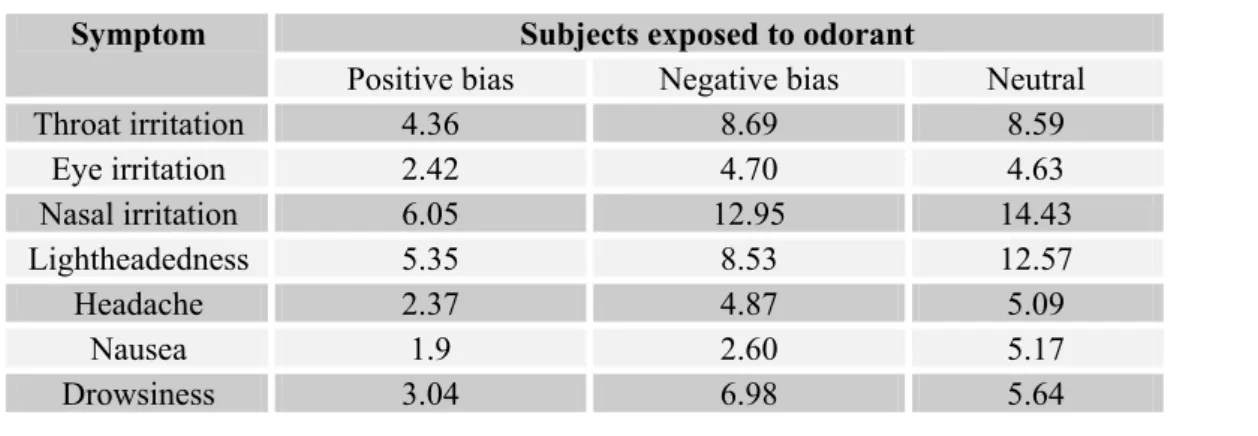
The human response to perceived odour and irritant stimuli and their appraisal may be more driven by psychology than by the concentration of the odorants only. For example, in one experiment 90 adults were divided into three groups, each of which was given different information about chemicals to which they would be exposed (Dalton, 1997).
Table 2 : Selected Reported Health Symptoms in Subjects (n=30 for each group) after 20 min Exposure to 800 ppm Acetone compared. Adapted from Dalton (1997).
Subjects exposed to odorant Symptom
Positive bias Negative bias Neutral
Throat irritation 4.36 8.69 8.59 Eye irritation 2.42 4.70 4.63 Nasal irritation 6.05 12.95 14.43 Lightheadedness 5.35 8.53 12.57 Headache 2.37 4.87 5.09 Nausea 1.9 2.60 5.17 Drowsiness 3.04 6.98 5.64
Researchers told the neutral group that the chemical they were to be exposed to is commonly used in olfactory research and approved for that purpose. The positive bias group was told that the odour was from natural extracts that are used in aroma therapy and that it is reported to have beneficial effects on mood and health. The negative bias group was told that the chemical was an industrial solvents that is reported to cause adverse health effects and cognitive problems
Following the exposure the subjects completed questionnaires to collect information on health symptoms. The positively biased group reported far fewer symptoms than the other two groups. Neutrally biased subjects responded similar to the negatively biased group. One interpretation for this finding may be that a normative response exists to unknown odours which is negative. The overall pattern of results of this and other studies suggests that many of the health-related effects of exposure to odorants are mediated by cognitive variables, such as mental models of the relationship between environmental odours and health (Dalton, 1997). This hypothesis is
supported by other publications and appears to be quite generic (Shusterman, 1992; Chen et al., 2005).
3.3 Annoyance
Investigations of the effects of odour exposure on health and well-being in the population have typically assessed annoyance as the main target (Steinheider, 1999). Annoyance is the complex of human reactions that occurs as a result of exposure to an ambient stressor that, once perceived, causes negative cognitive appraisal that requires a degree of coping (Van Harreveld, 2001). Annoyance, related to noise, has been described in terms of three components (Clark, 1984): 1. an emotional component (for instance, a feeling of anger).
2. an interference component (for instance, disturbance of desired activities). 3. a somatic component (for instance, headache, nausea).
Since these three dimensions have been found to correlate rather well, simple one-dimensional annoyance scales have been used in field studies (Cavalini, 1991; Steinheider, 1999).
Whether or not one experiences odour as annoyance depends on perception and appraisal
(Paustenbach and Gaffney, 2006). When a person detects a smell, a process of appraisal is started. If the odorant is associated with previous events in memory, and on that basis considered to be benign, it will not cause a negative cognitive response. On the other hand, when the odour is unknown, considered to be inappropriate in the behavioural context or appraised as harmful with possible health effects, annoyance is the likely result. Annoyance initiates coping behaviour, that may fall into two major categories:
1. Problem-oriented: attacking the problem caused by the stressor, for instance by closing windows to avoid malodorous air.
2. Emotion-oriented: regulating emotions caused by the stressor, for instance comforting cognition about health effects or ignoring its presence.
3.4 Nuisance
Nuisance is the cumulative effect on man, caused by repeated events of annoyance over an
extended period of time, which leads to modified or altered behaviour (Van Harreveld, 2001). This behaviour can be active (for instance, registering complaints, closing windows, keeping ‘odour diaries’, avoiding use of the garden) or passive (only made visible by different behaviour in test situations, e.g. responding to questionnaires or different responses in interviews). Odour nuisance
can lead to infringement of our sense of well-being and cause increased levels of stress related symptoms which constitute a negative health effect. Nuisance occurs when people are affected by an odour they can perceive in their living environment (home, work environment, recreation environment) and:
1. the appraisal of the odour is negative, 2. the perception occurs repeatedly,
3. it is difficult to avoid perception of the odour,
4. the odour is considered a negative effect on their well-being.
Odour nuisance can develop after long-term intermittent exposure to odours that causes a negative appraisal in the individual concerned. It directly reflects with the way we value our environment (Van Harreveld, 2001). The development of nuisance is not a straightforward process. Our attitudes towards the source, the inevitability of the exposure, and the aesthetic expectations regarding our residential environment are some of the less tangible factors that are relevant to the probability of experiencing nuisance. Once the balance tips and an environmental stressor, such as a chemical or livestock odour, becomes a nuisance to an individual, it is very difficult to reverse the process and instil a positive connotation rather than a negative one.
4 Field considerations
4.1 Variation within the population
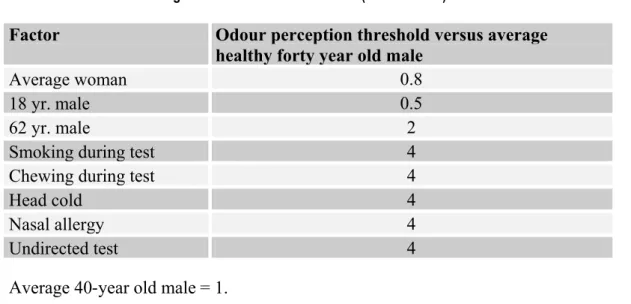
Olfactory responses of individuals vary with age. Increasing age is correlated with decreasing sensitivity, although the findings are not consistent. Furthermore, female panelists on average have a lower odour threshold than male panelists from the same age group. Factors such as health status (e.g., cold, nasal allergy), smoking behaviour, personality and training may contribute in some degree to the ability to assess an odour. The magnitude of the influence is shown in Table 3 as the ratio of the threshold in a subgroup as compared with an average healthy forty-year-old male (Amoore and Hautala, 1983).
Table 3 : Factors influencing the odour detection threshold (Amoore 1983).
Factor
Odour perception threshold versus average
healthy forty year old male
Average woman
0.8
18 yr. male
0.5
62 yr. male
2
Smoking during test
4
Chewing during test
4
Van Thriel et al., (2007) reported age related differences in odour thresholds for 3 out of
15 irritant chemicals in two groups with mean ages of about 25 and 54 years, odour thresholds in the > 45 year group were about twice those of the young adult group. Boesveldt however (2008) reported a decrease in odour discrimination scores as determined with ‘Sniffin’ Sticks’ (16 odours) among women, but not men in 150 subjects aged 47-78 years. Stevenson et al., (2007) found that 6-year old children performed less well than young adults in a series of odour discrimination tests. This was likely due to a lesser olfactory discriminative ability, and not (completely) due to their inability to describe names of odours.
Katotomichelakis et al., (2007) found that the odour threshold as determined with ‘Sniffin’ Sticks’ was 4 times higher in smokers (not smoking during the test) compared with non-smokers. Odour discrimination (the ability to identify which of 3 presented odours differed from the other two)
Head cold
4
Nasal allergy
4
Undirected test
4
was reduced 5-fold in the smokers. In addition a decline in odour threshold and discrimination was found with age.
Subjects in good health can normally reproduce their individual odour thresholds for a certain compound within a factor ±2. Intra-individual variation is relatively small compared to inter-individual variation. Dutch data on inter-inter-individual variation are available for over 1000
individuals who answered to panel recruitment for odour perception studies (Van Harreveld et al., 1999). The variation in odour thresholds in this group is large, with a difference of approximately a factor 30 between the top and bottom 5% of the distribution, corresponding to a standard deviation of 3.2. This group is not a proper random sample of the population, and the inter-individual variation in the general population is likely to be larger.
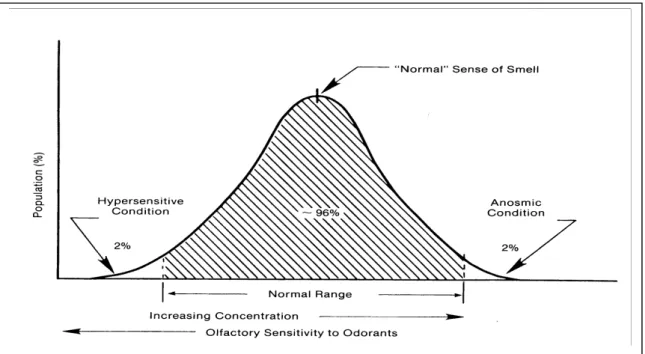
Other sources state that the standard deviation in the distribution of individual odour thresholds is approximately the same for all tested odorants, averaging very close to a factor of 4 (Amoore and Hautala, 1983). In practice this means that two-third of the general population will be able to detect concentrations between 1/4 and 4 times the odour threshold. Less than 2% (hyperosmic or hypersensitives) are able to detect a concentration 10 times below the ODT and less than 2% (hyposmics including anosmics) are unable to detect a concentration of 10 times the ODT (Figure 5).
Figure 5 : The sensitivity in the sense of smell within a population (AIHA 1989).
4.2 Distraction and adaptation
There is a substantial difference between the level of odorant that can be detected, and the level that will be detected (Whisman et al., 1977). In a study on the influence of various degrees of distraction on the responsiveness of people to well-known warning odours, substantial differences
where found between directed and undirected tests. In a directed test, the attention of the subject is purposely focused on the sole objective of detecting odour. In the undirected test, the subjects were given no indication of the object of the exercise. Recalculation of the data on log/probit coordinates resulted in a four-fold increased detection threshold for the undirected test as compared to the directed test (Amoore, 1985).
With continuing exposure to a certain odour concentration, the sensation gradually decreases, and may even disappear. Olfactory fatigue from continued exposure to an odour may affect a person’s sense of smell. This phenomenon is called adaptation (US EPA, 1992; Shusterman, 1992). Adaptation begins to reduce perceived odour intensity and quality during the first inhalation. Adaptation may reduce both perceived odour intensity and perceived odour quality. The degree of adaptation resulting from exposure to an odorous air will depend on the odour concentration experienced. The weaker the odour concentration of an air sample, the more does adaptation affect perceived strength. Although adaptation takes some time to develop, recovery takes place more quickly. Recovery periods may range from seconds to minutes depending upon type and
concentration of odour and duration of exposure. It has been pointed out that while sensitivity to an odour may decrease after sniffing a sample, 80 to 90% recovery generally occurs within a minute with complete recovery in several minutes (Shusterman, 1992, EN13725:2003). During exposure to hydrogen sulphide, most subjects experienced an exponential decrease of intensity, that dropped to a steady level within 2-5 minutes, and did not change appreciably up to 15 minutes later (Ekman et al., 1967). One of eight subjects indicated virtually complete loss of odour sensation and another a substantial loss which is attributed to reversible paralysis of the olfactory nerve. The other six showed an approximately 50% decrease of perceived intensity, which corresponds to an apparent four-fold reduction in the hydrogen sulphide concentration. After breathing pure air, the sensitivity recovered almost completely in about four minutes. In most situations a mixture of odorants, rather than just a single compound, will cause odour detection. One single compound may excite more than one type of olfactory receptor, while a different odorant is likely to excite a different subset of the 350 types of human olfactory receptor cells. Studies have been undertaken on the perceived intensity of odour mixtures by mixing two odorants, both above the detection threshold. The typical finding was that the perceived intensity of a mixture is less than the arithmetic sum (hypo-addition) of the individual intensities (Berglund et al., 1973; Cometto-Muñiz et al., 2005a).
4.3 Peak to mean ratio in odour exposure
Field conditions typically apply to chemical emergencies, where the odorant concentration will vary significantly due to atmospheric turbulent dispersion. The population is typically exposed at a
few hundred to a few thousand meters distance from a (point) source, and their sense of smell will assess the atmosphere with every breath.
The perception of odours is very quick. One breath inhalation takes approximately 3 seconds. One inhalation can lead to odour detection, perception, and appraisal. As we spend approximately half of our time exhaling, a practical value for the smallest period of interest to assessing the effects of odours is therefore approximately 5 seconds. No matter the duration of the exposure to an odorant, it is known that the peaks (not the average concentration), the height of peaks and the frequency of occurrence of peaks are important in determining the perception of the odour (NSW EPA, 2001). Therefore, peak to mean ratio caused by turbulent atmospheric dispersion on a 5 second time frame scale will be relevant, with the peaks determining the awareness of the presence of an odour. At the edges of the zone of distinct odour awareness the variations will cause alternating periods of low exposure with peaks in concentration. These peaks are determining the appraisal by the exposed population. In the long run, adaptation or habituation may reduce the perceived odour intensity (Shusterman, 1992), although in typical field conditions the short time required for recovery from adaptation implies that this phenomenon will not be a major factor in assessment and appraisal by the public.
Given the rapidity and reversibility of the odour response, the usual time scaling of AEGL and ERPG values seems inappropriate for the odour endpoint. Dispersion modelling typically produces 10-60 minute to exposure level averages, while for acute odour responses, a timescale of 5 seconds is appropriate. Therefore it makes sense to adjust for the peak-to-mean ratio of the variable
concentration level. In a proposed odour guideline for New South Wales, Australia, factors were recommended for estimating peak-to-mean concentration ratios for different source types, stabilities and distances (NSW EPA, 2001). These factors are applied in screening procedures for flat terrain situations. At distances of more than 200-1000 meters peak to mean ratios were 1.9 to 7. Based on the current state of the art, a default value of 3 is considered to be the best estimate for adjusting exposure levels averaged over 10-60 minutes, which are relevant in emergency response planning, to 5second peak exposures that are determining for acute odour perception in the field. This means that on any proposed odour criterion a factor 3 has to be applied to typical
10-60 minute averaged concentration levels predicted by dispersion modelling to account for peak concentrations of 5 second duration within that 10-60 minutes of exposure.
5 Significant odour awareness
Any unusual odour not common to the normal ‘odour landscape’ has the potential to cause arousal and awareness of a smell in individuals. The probability that this happens increases with odour concentration. Consensus was reached in the AEGL program that a concentration where more than half of an accidentally exposed, distracted population perceives a distinct odour would qualify as significant odour awareness. This concentration is designated as ‘Level of distinct Odour
Awareness (LOA)’.
For some people exposure to the odorant may go unnoticed, especially in areas where a certain odour landscape is already present. In densely populated areas however, the probability that more than a few persons will react to the exposure will increase and can become significant. Health and environmental authorities will get involved because of public information requests.
A stepwise procedure to derive the LOA for a chemical is introduced below. The general idea behind the procedure is to apply currently available knowledge and data to make a best estimate wherever robust specific knowledge or data are lacking. As with other AEGL endpoints for derivation of toxicologically based guideline levels, the knowledge of the underlying mechanism and the quality of the data is rarely adequate. Some defaults have been developed to circumvent incomplete knowledge and data (much like time scaling for toxic endpoints).
The stepwise procedure to provide a LOA for a certain chemical, is provided in the following paragraphs.
5.1 Obtain the odour detection threshold (ODT)
The first step is to obtain a reliable population odour detection threshold (ODT) for the compound. Modern standards for forced choice dynamic olfactometry, which require traceability to reference odorants and adherence to minimum performance criteria, have greatly improved the sensitivity, repeatability and reproducibility of odour measurement. Unfortunately, the availability of ODT data for pure compounds, as determined according to EN13725:2003 or equivalent standards, is limited. So far, no authoritative compilation of such ODTs has been located. To avoid that this lack of data hampers the application of odour characteristics to a wide range of compounds, the following three tiered classification of odour threshold data quality is proposed:
Level 1: the ODT of a compound determined according to EN13725:2003,
AS/NZS4323.3:2001, NVN2820 (or equivalent) or the ‘Triangle Odor Bag Method’. Because these standards require minimum performance criteria, it is possible to
determine a geometric mean value from the data of one or more laboratories if necessary after adjustment for the n-butanol ODT. Additionally it is possible to derive the
stated uncertainty for the laboratories involved. Some laboratories may work under international accreditation to quality assurance standards such as ISO17025 or data may become available from inter-laboratory comparisons related to such accreditation. That type of independently verified data constitutes the most reliable source.
Level 2: ODT from a source that includes a reported value for n-butanol.
If no level 1 ODT is available, an attempt can be made to derive a level 2 ODT. If internal consistency of results (long term repeatability) can be established for a laboratory, or if a compound with a known reference compound for which a Level 1 quality value is available was analysed in one measurement session, using the same panel of assessors, a correction can be made for the sensitivity of the method in question relative to a traceable method. The ratio of the experimental threshold, for instance for n-butanol determined in a test panel and the reference value of 40 ppb can be used to calculate a level 2 ODT.
For example: the ODT for styrene in a test panel was 30 ppb. In the same panel the ODT for n-butanol was assessed as 100 ppb. In this case the level 2 ODT for styrene is estimated to be 30 x 40/100 = 12 ppb.
If two or more level 2 ODTs can be calculated the applicability and quality of the available sources can be evaluated, and a geometric mean value of all qualifying sources can be used as a point of departure for calculating the LOA
Nota bene: this procedure requires ODT data for n-butanol and the odorant from one primary literature source. Listing in an odour review will not suffice, because the presented ODTs may have been determined in many different laboratories. Once level 1 ODT values become available for a wider range of chemicals, the adjustment could also be performed with chemicals other than n-butanol with a level 1 ODT.
Level 3: ODT without an internal reference to an n-butanol or level 1 ODT.
If no level 1 or 2 ODTs can be calculated, a level 3 ODT can be used. Such
ODTs are often found in compilations such as by AIHA (1989) and US EPA (1992). These compilations critique thresholds reported in literature based on:
1. The quality of the reference (secondary source, incidental reference, passive exposure, availability).
2. The odour panel: panel size, panel member selection and calibration.
3. The presentation apparatus: vapour modality (gas/air mixture or vapour over aqueous solution), diluents, presentation mode, analytic measurement of concentrations and system calibration (including presentation flow)
4. The presentation method: threshold type, concentration presentation (includes duration), number of trials, forced choice method and the concentration steps used. The main issues that cause limited applicability of odour studies are too low stimulus presentation flow (< 10 liter/minute) and lack of a reference odour in the panel session to ascertain panel sensitivity.
In these cases, the crude but most effective approach is to use the lowest reported value from all acceptable sources (Code A for AIHA and US EPA 1992). The geometric mean would be misleading, because the bias introduced by inadequate testing methodology is almost without exception towards higher odour thresholds.
The choice or determination of a level 1 or 2 ODT requires review of the primary literature source, as is customary when deriving toxicologically based guideline values. At the least a common primary source for the 2 chemicals used in the calculation of a level 2 ODT should be verified. Generation of new olfactory data of quality level 1, preferably by accredited laboratories, is an option when data are absent or insufficient.
Odour reviews can be very valuable resources for identification of ODT data. Large listings can be found in Nagata (2003, level 1), Van Gemert (2003), AIHA (1989), US EPA (1992), Van Thriel et al., (2006), Cometto-Muñiz and Abraham (2008), Katz (1930), Helman and Small (1974) and Punter (1983).
5.2 Derive distinct odour level
In odour laboratories odorant concentrations leading to distinct odour detection can be estimated. An alternative is to use the Fechner function (cf. section 2.2), preferably using an experimentally determined value of kw for the compound in question:
I = kw × log (C/ODT) + 0.5
Experimentally derived kw values are available for a limited number of chemicals. Sources with
information on odour intensity include VDI (1992) and Cometto-Muñiz et al. (2005).
Some sources provide odour intensity information as Steven’s coefficients (Patte et al., 1975). These can be used as an alternative way to calculate a distinct odour level, even though the methodology has not been standardized and the conversion is by no means straightforward. The range of experimental kw values is surprisingly small with a median value of 2.33. If no
experimental kw value is available, it is suggested to use the median value of 2.33 as default. When the default is used, the intensity perceived by 50% of a population exposed to an odorant
concentration C is predicted by:
I = 2.33 × log (C/ODT) + 0.5
Concentrations corresponding to various perceived intensities can now be calculated. The concentration that is expected to lead to perception of a distinct odour (I=3) equals 11.8 × ODT. This means that 12 odour units per m3 can be expected to generate distinct odour perception under
5.3 Adjust for field conditions
Outside of the laboratory, factors such as sex, age, sleep, smoking, head cold and nasal allergy influence the perception of odours. Distraction (the fact that in a laboratory the individual’s attention is purposely focused on detecting odours, whereas this in not the case in ordinary life situations) increases the operational ODT by a factor of 4 (Amoore, 1985).
The perception of odours is very quick. One breath with a total duration (inhalation and
exhalation) of approximately 5 seconds can lead to odour detection, perception and appraisal. For such rapid effects, the average concentration over a certain time period does not predict the response very well and the usual methodology for time-weighting of effects is not applicable. We clearly need to account for peaks in the exposure pattern, where we are interested in the frequency of peaks that exceed the detection threshold criterion. To account for the peaks, various ‘peak-to-mean’ ratios have been proposed and applied in odour control policy. To convert on-hour average concentrations predicted by dispersion modeling to reflect 5 second peak values, lowering the 1-hour average concentration by a factor 3 is considered to be the best estimate (NSW EPA, 2001). Accounting for the peak-to-mean ratio is the most appropriate way to time-scale AEGL-values for the odour endpoint.
Adjustment for distraction and peak exposure leads to a combined correction factor of
4 / 3 = 1.33 from laboratory to time-weighted average field conditions. It follows that we expect that 16 odour units/m3 (or 16 × ODT under laboratory conditions) will lead to a distinct odour
perception among a significant proportion of members of the general population under field conditions.
6 Conclusions and recommendations
6.1 Conclusions
Detectable odour concentrations can generate anxiety in a relevant proportion of members of an exposed community are not necessarily toxicologically significant levels. Rather they represent concentrations where notification (i.e., informing the public about properties of the unusual odour) is recommended to modulate appraisal of odour with the aim of reducing or preventing the
incidence of anxiety and associated stress-related health effects.
This paper presents criteria for a ‘Level of distinct Odour Awareness’ (LOA) in accidental exposure of the general population. Despite many knowledge and data gaps, a methodology for which sufficient agreement exists has been developed. The method has been applied to a number of AEGL chemicals, and the approach delivers a LOA value that can be applied in practice. The methodology needs to be validated much more rigorously, and this document and the methodology described should be regarded as a first step towards development of a practically useful metric. Adequate validation requires additional information that is currently insufficiently available.
6.2 Recommendations
The LOA can only be determined on a chemical-by-chemical basis. Many of the data required to do so for chemicals relevant for emergency planning and response are lacking or of poor quality. The procedure outlined in chapter 5 produces the best available quantitative assessment of a LOA. It is recommended that an attempt is made to develop a LOA for each chemical under review for development of acute guideline values (AEGL, ERPG, Dutch Intervention values, and others). The validity of the derived LOA values would be greatly enhanced if the following knowledge and data would be available:
1. High quality assessments of the concentration leading to distinct odour perception under laboratory conditions for relevant chemicals, or alternatively:
• Well determined (level 1) odour detection thresholds, and • Fechner coefficients
2. Information about necessary adjustments for field conditions such as colds, attention, smoking and variability of the exposure level to derive a LOA based on the distinct odour level from the laboratory.
All this information should be available in the public domain or for the specific purpose of development of LOA values.
To validate the approach, systematic observations of odour annoyance should be made in chemical emergencies. The methodology to make such observations should be developed or adapted from existing methodologies. The methodology to derive LOA values should be adjusted accordingly. The possibility for experimental validation should also be explored.
References
American Industrial Hygiene Association (AIHA): Odour Thresholds for Chemicals with Established Occupational Health Standards. Akron, OH (1989).
Amoore, J.E: Molecular Basis of Odour. Charles C Thomas, Springfield, Illinois (1970).
Amoore, J.E., E. Hautala: Odour as an Aid to Chemical Safety: Odour Thresholds Compared with Threshold Limit Values and Volatilities for 214 Industrial Chemicals in Air and Water Dilution. J. Appl. Toxicol. 3: 272-290 (1983).
Amoore, J.E: The Perception of Hydrogen Sulfide Odour in Relation to Setting an Ambient Standard. Prepared for California Air Resources Board. ARB Contract A4-046-33 (1985). Anon: Control measures against offensive odour. Nagoya International Training Center, Japan International Coorperation Agency and the International Center for Environmental Technology Transfer, Tokyo, Japan (2000).
Arts, J.E., C. De Heer, R.A. Woutersen: Local effects in the respiratory tract: relevance of subjectively measured irritation for setting occupational exposure limits. Int. Arch. Occup. Environ. Health 79:283-298 (2006).
AS/NZS4323.3:2001: Australian/New Zealand Standard. Stationary source emissions. Part 3: Determination of odour concentration by dynamic olfactometry. Standards Australia, Sydney, Australia: (2003).
ASTM: Manual on Sensory Testing Methods, no. 434. American Society for Testing and Materials, Philadelphia, Pa. (1968).
Axel, R.: The Molecular Logic of Smell. Scientific American 273: 130-137 (1995). Beek, B., C.J. Valk, M. Pereboom: (in Dutch) De herhaalhaarheid van hedonische geurhindermetingen. Lucht 3: 82-87 (1999).
Berglund, B., U. Berglund, T. Lindvall: A quantitative principle of perceived intensity summation in odour mixtures. J. Exp. Psychol. 100: 29-38 (1973).
Boesveldt, S., D. Verbaan, D.L. Knol, et al.: Odour identification and discrimination in Dutch adults over 45 years. Rhinology 46:131-136 (2008).
Bos, P.M.J., A. Zwart, P.G.J. Reuzel, P.C. Bragt: Evaluation of the sensory irritation test for the assessment of occupational health risk. Crit. Rev. Toxicol. 21:423-450 (1992).
Bos, P.M.J., M. Busschers, J.H.E. Arts: Evaluation of the sensory irritation test (Alarie test) for the assessment of respiratory tract irritation. J. Occup. Environ. Med. 44:968-976 (2002).
Buck, L., Axel, R.: A novel multigen family may encode odorant receptors: A molecular basis for odour reception. Cell 65: 175-187 (1991).
Buck, L. Unraveling the Sense of Smell (Nobel Lecture). Angew. Chem.Int. Ed. 44:6128-40 (2005).
Cain, W.S., Murphy, C.L.: Interaction between chemoreceptive modalities of odour and irritation. Nature 284: 255-257 (1980).
Cain, W.S., R.A. de Wijk, A.A. Jalowayski et al.: Odor and chemesthesis from brief exposures to TXIB. Indoor Air 15:445-457 (2005).
Cain, W.S., R. Schmidt, A.A. Jalowayski: Odor and chemesthesis from exposures to glutaraldehyde. Int Arch Occup Environ Health 80:721-731 (2007).
Carter, R. : Mapping the mind, ISBN 0 297 62330 2, Weidenfeld & Nicholson, London, (1998). Cavalini, P.M., Koeter-Kemmerling, L.G., Pulles, M.P.J.: Coping with odour annoyance and odour concentrations: three field studies J. Environ. Psychol. 11: 123-142 (1991).
Chen, D., P. Dalton: The Effect of Emotion and Personality on Olfactory Perception. Chem. Senses 30:345-351 (2005).
Clark, C.R.: The effects of noise on health. In: Jones, D.M. and A.J. Chapman, editors. Noise and Society. Chichester: John Wiley 111-124 (1984).
Cometto-Muñiz, J.E., W.S. Cain, M.H. Abraham: Odor detection of single chemicals and binary mixtures. Behaviour. Brain Res. 156:115-123 (2005a).
Cometto-Muñiz, J.E., W.S. Cain, M.H. Abraham: Determinants for Nasal Trigeminal Detection of Volatile Organic Compounds. Chem. Senses. 30:627-642 (2005b).
Cometto-Muñiz, J.E., M.H. Abraham: Human olfactory detection of homologous n-alcohols measured via concentration-response functions. Pharmacol. Biochem. Behaviour 89:279-291 (2008).
Dalton, P., C.J. Wysocki, M.J. Brody, H.J. Lawley: The influence of cognitive bias on the perceived odour, irritation and health symptoms from chemical exposure. Int. Arch. Occup. Environ. Health 69: 407-417 (1997).
Dalton, P.: Cognitive influences on health symptoms from acute chemical exposure. Health Psychol .18: 579-90 (1997).
Dalton, P.H., D.D. Dilks, M.I. Banton: Evaluation of Odour and Sensory Irritation Thresholds for Methyl Isobutyl Ketone in Humans. AIHAJ 61: 340-350 (2000).
Dalton P.: Upper airway irritation, odor perception and health risk due to airborne chemicals. Toxicol. Letters 140-141: 239-248 (2003).
Distel, H., R. Hudson: Judgement of Odor Intensity is Influenced by Subjects’ Knowledge of the Odor Source. Chem. Senses; 26:247-251 (2001).
Doty, R.L., J.E. Cometto-Muñiz, A.A. Jalowayski, P. Dalton, M. Kendal-Reed,
M. Hodgson: Assessment of upper respiratory tract and ocular irritative effects of volatile chemicals in humans. Crit. Rev. Toxicol. 34:85-142 (2004).
Dravnieks, A., F. Jarke: Odour threshold measurements by dynamic olfactometry: significant operational variables. Journal Air. Poll. Contr. Ass. 30: 1284-1289 (1980).
Dupraz, C.A.: Observations on the Impact of Flow Rates on Odour Thresholds, Int. Soc. for Respir. Protection J.,1, 34-36 (1990).
Ekman, G., B. Berglund, U. Berglund: Perceived intensity of odour as a function of time adaptation. Scand. J. Psychol. 8: 177-186 (1967).
EN13725:2003: Air quality - Determination of odour concentration by dynamic olfactometry. CEN (Comite´Européen de Normalisation): Brussels, Belgium (2003).
Helman, T. M., F. H. Small: Characterization of the Odor Properties of 101 Petrochemicals Using Sensory Methods. J. Air Pollution Control Assoc. 24: 979-982 (1974).
Hoshika, Y., T. Imamura, G. Muto, L.J. van Gemert, J.A. Don, J.I. Walpot: International Comparison of Odor Threshold Values of Several Odorants in Japan and in The Netherlands. Environ. Res. 61: 78-83 (1993).
Hummel, T., S. Barz, J. Loetsch, S. Roscher, B. Kettenmann, G. Kobal: Loss of olfactory function leads to a decrease of trigeminal sensitivity. Chem. Senses 21: 75-80 (1996).
Hummel, T., T. Futschik, J. Frasnelli et al.: Effects of olfactory function, age and gender on trigeminally mediated sensations: a study based on the lateralization of chemosensory stimuli. Toxicol. Letters 140-141:273-280 (2003).
Ianelli E, J. Gerber, J. Frasnelli et al.: Intranasal trigeminal function in subjects with and without an intact sense of smell. Brain Res. 1139:235-244 (2007).
Katotomichelakis, M., D. Balatsouras, G. Tripsianis et al.: The effect of smoking on the olfactory function. Rhinology 45: 273-280 (2007).
Katz, S. H., E. J. Talbert: Intensities of odors and irritating effects of warning agents for
inflammable and poisonous gases. Bureau of Mines, Technical paper 480. Government Printing Office: Washington (1930).
Kendal-Reed, M., J.C. Walker: Human normosmics and anosmic sensory responses to propionic acid. Chem. Senses 21: 622 (1996).
Kleinbeck, S., S.A. Juran, E. Kiesswetter et al.: Evaluation of ethyl acetate on three dimensions: Investigation of behavioural, physiological and psychological indicators of adverse chemosensory effects. Toxicol. Letters 182:102-109 (2008).
Leffingwell, R.C.: Olfaction: a review in progress. http://www.leffingwell.com/olfaction.htm
(2008).
May, J.: Odour Thresholds of Solvents for Assessment of Solvent Odours in the Air. Staub 26: 385-389 (1966).
Nagata Y.: Odor intensity and odor threshold value. Journal of JACA 2003;41:17-25 (2003). More information http://www.env.go.jp/en/air/odor/olfactory_mm/.
NSW EPA: Technical Notes - Draft Policy: Assessment and Management of Odour from Stationary Sources In NSW, Environment Protection Authority, NSW, Sydney, Australia (2001). NVN2820: Luchtkwaliteit. Sensorische geurmetingen met olfactometer (Air Quality –Sensory measurement of odour using an olfactometer). NEN Netherlands Normalisation Institute, Delft (1990).
O'Brien, M.; Duffee, R.A.; Ostojic, N.: Effect of Sample Flow Rate in the Determination of Odour Thresholds. In Proceedings of Odours: Indoor and Environmental Air; Air & Waste Management Association: Pittsburgh, PA (1996).