RIVM report 330300011/2006
EU Interlaboratory comparison study IX (2005) on bacteriological detection of Salmonella spp.
P.A. Berk, C. Veenman and K.A. Mooijman
Contact: K. Mooijman
Microbiological Laboratory for Health Protection Kirsten.mooijman@rivm.nl
This investigation has been performed by order and for the account of the European
Commission, Législation Vétérinaire et Zootechnique and the Microbiological Laboratory for Health Protection of the RIVM within the framework of project E/330300/04/CS by the Community Reference Laboratory for Salmonella.
Abstract
EU Interlaboratory comparison study IX (2005) on bacteriological detection of Salmonella spp.
In 2005 the ninth interlaboratory comparison study on bacteriological detection of Salmonella spp. was organised by the Community Reference Laboratory for Salmonella
(CRL-Salmonella, Bilthoven, the Netherlands). National Reference Laboratories for Salmonella
(NRLs-Salmonella) of the EU Member States (26) and the NRLs of Norway and of Romania participated in the study. Reference materials in combination with or without the presence of chicken faeces, as well as naturally contaminated dust (containing Salmonella Virchow and
Salmonella Livingstone) were tested. The reference materials existed of gelatin capsules
containing Salmonella Typhimurium (STM), Salmonella Enteritidis (SE) or Salmonella Panama (SPan) at different contamination levels. In addition to the performance testing of the laboratories, a comparison was made between 4 h and 18 h incubation of the samples in the pre-enrichment broth Buffered Peptone Water (BPW), followed by selective enrichment on Modified Semi-solid Rappaport Vassiliadis (MSRV) and plating-out on Xylose Lysine Deoxycholate agar (XLD) and a second selective medium chosen by the laboratory.
Significant more positive isolations were obtained from the artificially contaminated samples (negative chicken faeces, artificially contaminated with reference materials) after 18 h of incubation in BPW when compared to 4 h incubation of BPW. The accuracy rates for the artificially contaminated samples were 57 % and 98 % after respectively 4 and 18 h of incubation in BPW. The results for the naturally contaminated dust samples revealed also significant more positive results after 18 h of incubation. The accuracy rates for these samples were respectively 81 % and 99 % after 4 and 18 h of incubation in BPW. All NRLs achieved the level of good performance which was defined during the CRL-Salmonella workshop 2005; only two NRLs had small problems with one of the controls.
Keywords: CRL-Salmonella, Salmonella, interlaboratory comparison, reference materials, detection methods.
Rapport in het kort
EU Ringonderzoek IX (2005) voor bacteriologische detectie van Salmonella spp. In 2005 werd door het Communautair Referentie Laboratorium voor Salmonella
(CRL-Salmonella, Bilthoven, Nederland) het negende bacteriologische ringonderzoek
georganiseerd. Deelnemers van de studie waren de Nationale Referentie Laboratoria voor
Salmonella (NRL’s-Salmonella) van de EU lidstaten (26), van Noorwegen en van Roemenië.
Referentiematerialen in combinatie met of zonder de aanwezigheid van kippenfeces, evenals natuurlijk besmet stof (bevattende Salmonella Virchow en Salmonella Livingstone) werden getest. De referentiematerialen bestonden uit gelatine capsules met verschillende
besmettingsniveaus van Salmonella Typhimurium (STM), Salmonella Enteritidis (SE) en
Salmonella Panama (SPan). Bovendien werd naast de uitvoering van de testen door de
laboratoria een vergelijking gemaakt tussen 4 en 18 uur voorophoping van de monsters in gebufferd Pepton Water (BPW), gevolgd door selectieve ophoping op Modified Semi-solid Rappaport Vassiliadis en uitplating op Xylose Lysine Deoxycholate agar en een tweede selectief medium gekozen door de laboratoria.
Significant meer positieve isolaties werden gevonden met de kunstmatig besmette monsters (negatieve kippenfeces, kunstmatig besmet met referentiematerialen) na 18 uur incubatie in BPW in vergelijking met 4 uur incubatie in BPW. De waarden voor nauwkeurigheid (“accuracy rates”) van de kunstmatig besmette monsters waren 57 % en 98 % na respectievelijk 4 en 18 uur incubatie in BPW. De resultaten van de natuurlijk besmette stofmonsters lieten ook significant meer positieve isolaties zien na 18 uur incubatie. De waardes voor nauwkeurigheid (“accuracy rates”) voor deze monsters waren respectievelijk 81 % en 99 % na 4 en 18 uur incubatie in BPW. Alle NRLs voldeden aan de “good
performance” die gedefinieerd was tijdens de CRL-Salmonella workshop 2005; slechts 2 NRLs hadden enkele problemen met één van de controles.
Trefwoorden: CRL-Salmonella, Salmonella, ringonderzoek, referentie materialen, detectie methoden.
Contents
Summary 7
List of abbreviations 9 1. Introduction 11 2. Participants 13
3. Materials and Methods 15
3.1 Reference materials 15
3.2 Faecal samples and dust samples 16 3.2.1 General 16
3.2.2 Total bacterial count in faeces and in dust 16 3.2.3 Enterobacteriaceae count in faeces and in dust 16 3.2.4 MPN of Salmonella in naturally contaminated dust 17 3.3 Design of the interlaboratory comparison study 18
3.3.1 Samples 18 3.3.2 Methods 19
3.3.3 Temperature recording during shipment 19 3.4 Accreditation/certification 20
3.5 Statistical analysis of the data 20
4. Results 21
4.1 Reference materials 21 4.2 Dust and faeces samples 22
4.3 Technical data interlaboratory comparison study 23 4.3.1 Pre-warming time and temperature of BPW 24
4.3.2 Incubation time and temperature for dissolving the capsules 24 4.3.3 Incubation time and temperature of pre-enrichment 24
4.3.4 Composition of selective enrichment medium MSRV 26 4.3.5 Incubation times and temperatures of selective enrichment 26 4.4 Control samples 28
4.5 Results faeces samples artificially contaminated with Salmonella spp. 33 4.5.1 Results per type of capsule and per laboratory 33
4.5.2 Specificity, sensitivity and accuracy rates of artificially contaminated samples 38
4.6 Results dust samples naturally contaminated with Salmonella spp. 39 4.7 PCR 42
4.8 Transport of samples 43
5. Discussion 45 6. Conclusions 49
References 51
Annex 1. History of bacteriological studies 55 Annex 2. Calculation of T2 57
Annex 3. Results per laboratory, sample and medium combination 58 Annex 4. Information on the media used 68
Annex 5. Results of alternative methods 82 Annex 6. Temperature recording 84 Annex 7. Protocol 93
Annex 8. Standard Operating Procedure 98 Annex 9. Draft Annex D of ISO 6579 (Oct ’04) 106
Summary
In fall 2005 the Community Reference Laboratory for Salmonella (CRL-Salmonella) organised the ninth interlaboratory comparison study on bacteriological detection of
Salmonella. Participants were the twenty-six National Reference Laboratories for Salmonella (NRLs-Salmonella) of the EU Member States, the NRL from Norway and the NRL from Romania.
The main objective of the eighth interlaboratory comparison study was to make a comparison of the results obtained with the different levels of contamination and different serotypes of
Salmonella in the presence or absence of competitive micro-organisms between and within
the NRLs.During the CRL-Salmonella workshop 2005 a proposal was made to define “good performance” of the NRLs. In addition to the performance testing of the laboratories, a comparison was made between 4 h and 18 h incubation of the samples in the pre-enrichment broth Buffered Peptone Water (BPW), followed by selective enrichment on Modified Semi-solid Rappaport Vassiliadis (MSRV) and plating-out on Xylose Lysine Deoxycholate agar (XLD) and a second selective medium. Optionally, a laboratory could also use other, own media of procedures for the detection of Salmonella in addition to the prescribed procedure. Thirty five individually numbered capsules had to be tested by the participants for the presence or absence of Salmonella.Twenty five of the capsules had to be examined in combination with 10 gram of Salmonella negative chicken faeces. In this study the faeces was not mixed with any preservation medium as earlier studies have shown a negative effect of glycerol on the growth of Salmonella (Veenman et al., in preparation). The 25 capsules were divided over the following groups: 5 capsules with circa 10 colony forming particles (cfp) of Salmonella Typhimurium (STM10), 5 capsules with circa 100 cfp S. Typhimurium (STM100), 5 capsules with circa 100 cfp S. Enteritidis (SE100), 5 capsules with circa 500 cfp S. Enteritidis (SE500) and 5 blank capsules.The other 10 capsules, to which no faeces had to be added, were control samples, existing of 3 capsules with circa 10 cfp S. Typhimurium, 2 capsules with circa 100 cfp S. Enteritidis, 1 capsule with circa 500 cfp S. Enteritidis, 2 capsules with circa 5 cfp S. Panama and 2 blank capsules. Beside the reference materials, also 10 dust samples (10 g each) naturally contaminated with Salmonella Virchow and Salmonella Livingstone were examined.
Significant more positive isolations were obtained from the artificially contaminated samples (negative chicken faeces, artificially contaminated with reference materials) after 18 h of incubation in BPW when compared with 4 h incubation in BPW. The accuracy rates for the artificially contaminated samples were 57 % and 98 % after respectively 4 and 18 h of incubation in BPW. The results for the naturally contaminated samples revealed also significant more positive results after 18 h of incubation. The accuracy rates for these
to earlier studies the faeces was not mixed with any preservation medium, since studies at the CRL-Salmonella have shown a negative effect of glycerol on the growth of Salmonella. The high accuracy rates compared to earlier studies confirm the negative effect of glycerol. All NRLs achieved the level of good performance which was defined during the CRL-Salmonella workshop 2005. Only two NRLs had small problems with the control samples. Since the samples were tested well by all NRLs, no further actions were taken.
List of abbreviations
BGA Brilliant Green Agar
BPLS Brilliant Green Phenol-Red Lactose Sucrose agar BPW Buffered Peptone Water
BxLH Brilliant Green, Xylose, Lysine, Sulphonamide cfp colony forming particles
CI Confidence interval
CRL Community Reference Laboratory dPCA Double concentrated Plate Count Agar
dVRBG Double concentrated Violet Red Bile Glucose agar hcmp Highly Contaminated Milk Powder
ISO International Standardisation Organisation
LDC Lysine Decarboxylase
MKTTn Mueller Kauffmann Tetrathionate novobiocin broth MLCB Mannitol Lysine Crystal violet Brilliant green agar MSRV Modified Semi-solid Rappaport Vassiliadis
NRL National Reference Laboratory PCR Polymerase Chain Reaction
RIVM Rijks Instituut voor Volksgezondheid en het Milieu (National Institute for Public Health and the Environment.
RM Reference Material
R Sal Rapid Salmonella Agar
RV Rappaport Vassiliadis
RVS Rappaport Vassiliadis Soya broth
SC Selenite Cystine
SE Salmonella Enteritidis
SM(ID)2 Salmonella Detection and Identification-2 SOP Standard Operation Procedure
SPan Salmonella Panama
STM Salmonella Typhimurium
TC Technical Committee
TSI Triple Sugar Iron agar
UA Urea Agar
XLD Xylose Lysine Deoxycholate agar XLT4 Xylose Lysine Tergitol 4 agar
1.
Introduction
In pursuance of the Directive 2003/99/EC, which replaced the Council Directive 92/117/EEC, the Community Reference Laboratory for Salmonella (CRL-Salmonella) organises bacteriological interlaboratory comparison studies with the objective that the examination of samples in the EU Member States is carried out uniformly and that
comparable results should be obtained by all National Reference Laboratories for Salmonella (NRLs-Salmonella).
Earlier studies (see Annex 1) have shown significantly better results when using Modified Semi-solid Rappaport-Vassiliadis with novobiocin (MSRV) compared to the use of Rappaport-Vassiliadis broth (RV) as selective enrichment. Since the fourth study, all laboratories used the selective enrichment medium MSRV, in addition to RV or RVS (Rappaport-Vassiliadis Soya broth). In 2002 a new version of ISO 6579 was published. In this ISO the selective broths Mueller Kaufmann Tetrathionate with novobiocin (MKTTn) and RVS are prescribed. Furthermore, this ISO prescribes Xylose Lysine Deoxycholate (XLD) as the plating out agar. In the studies of 2002 and 2003 these media were also prescribed to analyse the samples.
Also the 2002 version of ISO 6579 is mainly intended for the detection of Salmonella spp. in food and feeding stuff and is less appropriate for the detection of Salmonella spp. in animal faeces. It was therefore requested at ISO/TC34/SC9 (Subcommittee dealing with
microbiology under ISO Technical Committee for Food and Feeding stuff) to standardise the detection of Salmonella spp. in animal faeces. A draft proposal including MSRV as selective enrichment was sent to the secretariat of ISO/TC34/SC9 in 2004. It was proposed to prepare a new annex to ISO 6579 (Annex D) which would describe the procedure of Salmonella spp. in animal faeces.
In the present study of 2005, the media MSRV and XLD as mentioned in this draft Annex D of ISO 6579 are prescribed. In a report of Heuvelman and In ‘t Veld (1998) it was described that a shorter incubation time of chicken faeces in BPW (4-7 h) would reveal more positive results. As different experiments at CRL-Salmonella and also earlier interlaboratory
comparison studies did not always show the expected number of positive results, it was decided to try a short incubation time of BPW (4 h) beside the “normal” incubation time (18 h). These two incubation times of BPW were prescribed in the study of 2004 as well as of 2005.
Ten control samples containing different reference materials had to be tested without the addition of chicken faeces. These reference materials consisted of 3 capsules with circa 10 cfp Salmonella Typhimurium (STM10), 2 capsules with circa 100 cfp Salmonella
Enteritidis (SE100), 1 capsule with circa 500 cfp Salmonella Enteritidis (SE500), 2 capsules with circa 5 cfp Salmonella Panama (SPan5) and 2 blank capsules. Blank capsules were also tested without the addition of chicken faeces. Twenty-five samples of Salmonella negative chicken faeces spiked with four different reference materials had to be examined including
blank capsules. The four different reference materials consisted of two levels of Salmonella Typhimurium (STM10 and STM100) and two levels of Salmonella Enteritidis (SE100 and SE500). In this study the faeces was not mixed with any preservation medium as earlier studies have shown a negative effect of glycerol on the growth of Salmonella. Furthermore, 10 naturally contaminated samples of dust containing Salmonella Virchow and Salmonella Livingstone were also examined.
2.
Participants
Country City Institute
Austria Graz Institut für Medizinische Mikrobiologie und Hygiene, Nationale Referenzzentrale für Salmonellen
Belgium Brussels Veterinary and Agrochemical Research Center (VAR) Cyprus Nicosia Cyprus Veterinairy Services, Laboratory for the Control
of Foods of Animal Origin (LCFAO) Czech Republic Prague State Veterinary Institute
Denmark Copenhagen Danish Veterinary Laboratory
Estonia Tartu Estonian Veterinary and Food Laboratory, Diagnostic Department
Finland Kuopio National Veterinary and Food Research Institute, Kuopio Department
France Ploufragan Agence Française de Sécurité Sanitaire des Aliments (AFSSA) Laboratoire d’Etudes et de Recherches Avicoles et Porcines (LERAP)
Germany Berlin Federal Institute for Risk Assessment (BFR) National Salmonella Reference Laboratory Greece Halkis Veterinary Laboratory of Halkis
Hungary Budapest National Food Investigation Institute Ireland Dublin Department of Agriculture and Food
Central Veterinary Research Laboratory
Italy Venice Istituto Zooprofilattico Sperimentale delle Venezie, Centro Nazionale di Referenza per le Salmonellosi Latvia Riga State Veterinary Medicine Diagnostic Centre Lithuania Vilnius National Veterinary Laboratory
Luxembourg Luxembourg Laboratoire de Médecine Vétérinaire de l’Etat , Animal Zoonosis
Malta Marsa Food and Veterinary Regulatory Division, Ministry of Rural Affairs and the Environment
The
Netherlands
Bilthoven Rijksinstituut voor Volksgezondheid en Milieu (RIVM) Norway Oslo National Veterinary Institute, Section of Bacteriology Poland Pulawy National Veterinary Research Institute
Country City Institute
Portugal Lisbon Laboratório Nacional de Investigaçã Veterinária Romania Bucharest Institutul de diagnostic si Sanatate Animala Slovak
Republic
Bratislava State Veterinary and Food Institute
Slovenia Ljubljana National Veterinary Institute, Veterinary Faculty
Spain Madrid Laboratorio de Sanidad Y Produccion Animal de Algete Sweden Uppsala National Veterinary Institute, Department of Bacteriology United
Kingdom
Addlestone Veterinary Laboratories Agency ,
Department of Bacterial Diseases, New Haw United
Kingdom
Belfast Department of Agriculture for Northern Ireland,
3.
Materials and Methods
3.1
Reference materials
Five batches of reference materials were prepared. For this purpose milk, artificially
contaminated with a Salmonella strain was spray-dried (In ‘t Veld et al, 1996). The obtained highly contaminated milk powder (hcmp) was mixed with sterile (γ-irradiated) milk powder (Carnation, Nestlé, the Netherlands) to obtain the desired contamination level. The mixed powder was filled in gelatin capsules resulting in the final reference materials (RMs). The target levels of the five batches of RMs were:
• 5 colony forming particles (cfp) per capsule for Salmonella Panama (SPan5); • 10 and 100 colony forming particles (cfp) per capsule for Salmonella Typhimurium
(STM10 and STM100);
• 100 and 500 colony forming particles (cfp) per capsule for Salmonella Enteritidis (SE100 and SE500).
Before filling the mixed powders into gelatin capsules, test batches capsules were prepared of each mixture to determine the mean number of cfp per capsule and the homogeneity of the mixture. The remaining mixed powders were stored at –20 oC. If the test batch fulfilled the pre-set criteria for contamination level and homogeneity, the relevant mixed powders were filled into gelatin capsules and stored at -20 oC.
The pre-set criteria were:
- mean contamination levels should lie between target level minus 30 % and target level plus 50 % (e.g. between 70 and 150 cfp if the target level is 100 cfp);
- for the homogeneity within one batch of capsules the maximum demand for the variation between capsules should be T2/(I-1) ≤ 2, where T2 is a measure for the variation between
capsules of one batch (see formula in Annex 2) and I is the number of capsules. The contamination levels of the capsules were determined following the procedure as described by Schulten et al. (2000). Shortly the procedure is as follows:
- reconstitution of each capsule in 5 ml peptone saline solution in a Petri dish at (38.5 ± 1) oC for (45 ± 5) min;
- repair of Salmonella by the addition of 5 ml molten double concentrated plate count agar (dPCA) to the reconstituted capsule solution, and after solidification incubation at (37 ± 1) oC for (4 ± ½) h;
- after incubation, 10 ml of molten double concentrated Violet Red Bile Glucose agar (dVRBG) was added as an overlayer and after solidification the plates were incubated for (20 ± 2) h at (37 ± 1) oC.
3.2
Faecal samples and dust samples
3.2.1 General
Salmonella negative chicken faeces was obtained from Salmonella free poultry flocks. The
dust samples were obtained from Salmonella positive poultry flocks. The faeces and the dust were tested for the presence or obsence of Salmonella. For this purpose 10 portions of 10 g were each added to 90 ml BPW. After pre-enrichment at 37 oC for 16-18 h, selective enrichment was carried out on MSRV. Next, the cultures were plated-out on BGA and confirmed biochemically and serologically. The suspected colonies of the positive dust were isolated on TSI agar and sent for serotyping to the Diagnostic Laboratory for Infectious Diseases and Perinatal Screening (LIS/RIVM). The faeces, bacteriologically negative for
Salmonella, was used for the artificially contaminated samples. Both the faeces and dust were
stored at 5 ºC. In this study the faeces was not mixed with any preservation medium as earlier studies have shown a negative effect of glycerol on the growth of Salmonella (Chung et al., 1972 and Veenman et al., in preperation).
3.2.2 Total bacterial count in faeces and in dust
The total number of aerobic bacteria was investigated for the faeces as well as for the dust. The procedure of ISO 4833 (Anonymous, 2003) was used for this purpose. Portions of 10 gram were homogenised into 90 ml peptone saline solution in a plastic bag. The content was mixed by using a pulsifier (60 sec). Next tenfold dilutions were prepared in peptone saline solution. Two times one ml of each dilution was brought into 2 empty Petri-dishes (diameter 9 cm). To these two dishes 25 ml of molten Plate Count Agar (PCA) was added. These plates were incubated at (30 ± 1) oC for (72 ± 3) h for the enumeration of the total number of aerobic bacteria.
3.2.3 Enterobacteriaceae count in faeces and in dust
In addition to the total count of aerobic bacteria the Enterobacteriaceae count was
determined. The procedure of ISO 21528-2 was used for this purpose. Portions of 20 gram were homogenized into 180 ml peptone saline solution in a plastic bag. The content was mixed by using a pulsifier (60 sec).Next tenfold dilutions were prepared in peptone saline solution. Two times one ml of each dilution was brought into 2 empty Petri-dishes (diameter 9 cm). To these two dishes 15 ml of molten Violet Red Bile Glucose agar (VRBG) was added. After the VRBG was solidified an additional 10-15 ml VRBG was added to the agar. These plates were incubated at (37 ± 1) oC for (24 ± 2) h for the enumeration of the
3.2.4 MPN of Salmonella in naturally contaminated dust
To semi-quantify the number of Salmonellae in the Salmonella positive dust, a Most Probable Number (MPN) method was used. For this purpose, ten gram of dust was added to 90 ml of buffered peptone water (BPW). Next tenfold dilutions were prepared in BPW until a
concentration of 0.01 mg dust per 100 ml BPW. This procedure was repeated five times. The BPW jars with concentrations of 1000 mg till 0.01 mg dust (per 100 ml BPW) were
incubated and handled according to the same procedure as described in subsection 3.2.1. After completion of the test the MPN was calculated using a MPN table (e.g. ISO 16649-3).
3.3
Design of the interlaboratory comparison study
3.3.1 Samples
Two weeks before the study the reference materials (35 individually numbered capsules) and 300 grams of negative faeces and 150 grams of positive dust for Salmonella were mailed (with cooling devices) as diagnostic specimens by courier service to the participants.After arrival at the laboratory the capsules had to be stored at –20 oC and the faecal and dust samples had to be stored at +5 oC until the start of the study. Details about mailing and handling of the samples and reporting of test results can be found in theProtocol (Annex 7) and Standard Operation Procedure (Annex 8). The testreport which was used during the study can be found at the CRL-Salmonella website:
http://www.rivm.nl/crlsalmonella/collabstudies/detection.html.
Ten control capsules had to be tested without faeces (numbered C1-C10). Twenty-five capsules (numbered 1 – 25) were tested in combination with 10 grams of chicken faeces each (negative for Salmonella). Beside these artificially contaminated samples, also 10 samples (numbered D1 – D10) of 10 grams each of naturally contaminated dust samples (containing
S. Virchow and S. Livingstone) were analysed. The types and the number of capsules and
faeces or dust samples to be tested are shown in Table 1.
Table 1 Overview of the types and the number of the capsules to be tested per laboratory in the interlaboratory comparison study
Capsules Control capsules
(n = 10) No faeces added Test samples (n=25) with 10 g Salmonella- negative faeces Test samples (n=10) with 10 g Salmonella- positive dust S. Panama 5 2 --- --- S. Enteritidis 100 2 5 --- S. Enteritidis 500 1 5 --- S. Typhimurium 10 3 5 --- S. Typhimurium 100 --- 5 --- Blank 2 5 --- No capsules --- --- 10
3.3.2 Methods
During the CRL-Salmonella workshop of April 2005 it was decided that the prescribed method of this interlaboratory comparison study would be draft Annex D of ISO 6579 (see also Standard Operation Procedure in Annex 8):
Pre-enrichment in:
• Buffered Peptone Water (BPW): (beside incubation of 18 h also incubation of 4 h)
Selective enrichment on/in:
• Modified semi-solid Rappaport Vassiliadis medium (MSRV) • Own selective enrichment medium (not compulsory)
Plating-out on:
• Xylose lysine desoxycholate agar (XLD)
• Second plating-out medium for choice (obligatory!) • Own plating-out medium (not compulsory)
Biochemical confirmation:
• Urea, Triple Sugar Iron agar (TSI) and Lysine Decarboxylase (LDC)
Beside the prescribed methods the NRLs were also allowed to use their own methods. This could be different medium combinations and/or investigation of the samples with a
Polymerase Chain Reaction based method.
3.3.3 Temperature recording during shipment
For the control of exposure to abusive temperatures during shipment and storage, so called micro temperature loggers were used to record the temperature during transport. These loggers are tiny sealed units in a 16 mm diameter and 6 mm deep stainless steel case. Each package contained one logger. The loggers were programmed by the CRL-Salmonella to measure the temperature every hour. Each NRL had to return the temperature recorder immediately after receipt of the parcel to the CRL. At the CRL-Salmonella the loggers were read via the computer and all data from the start of the shipment until the arrival at the National Reference Laboratories were transferred to an Excel graphic which shows all recorded temperatures.
Three biopacks and six cooling devices were placed in one large shipping box. In one of the three biopacks (the one containing the reference materials), a temperature recorder was enclosed.
3.4
Accreditation/certification
Twenty laboratories mentioned to be accredited for their quality system according to EN-ISO/IEC 17025 (labcodes 1, 2, 3, 4, 5, 6, 7, 9, 11, 12, 13, 14, 15, 16, 17, 18, 20, 22, 24 and 27) as is the CRL-Salmonella. Three laboratories (labcodes 8, 26 and 28) mentioned that they were not accredited or certified to any system and mentioned no planning to do so in the near future. Five laboratories (labcodes 10, 19, 21, 23 and 25) are planning to be accredited or certified in the near future.
3.5
Statistical analysis of the data
To be able to investigate the results of the participating laboratories the specificity, sensitivity and accuracy rates were calculated for the control samples, the artificially contaminated samples with faeces (negative for Salmonella spp.) as well as for the naturally contaminated dust samples.
The specificity, sensitivity and accuracy were calculated according to the following formulae: Specificity rate: ___Number of negative results____________ x 100 %
Total number of (expected) negative samples
Sensitivity rate: ___Number of positive results____ ________ x 100 % Total number of (expected) positive samples
Accuracy rate: Number of correct results (positive and negative) x 100 % Total number of samples (positive and negative)
3.6
Good performance
During the tenth CRL-Salmonella workshop in April 2005 a proposal was made to define “good performance” of the NRLs.
The following was suggested:
• Positive control capsules should all be positive, except for SPan5 of which 1 out of 2 may be negative;
• Blank control capsules should all be negative;
• Of blank capsules + faeces, 80 % should be negative; • Of STM100 and SE500 + faeces, 80 % should be positive; • Of STM10 and SE100 + faeces, 50 % should be positive
4.
Results
4.1
Reference materials
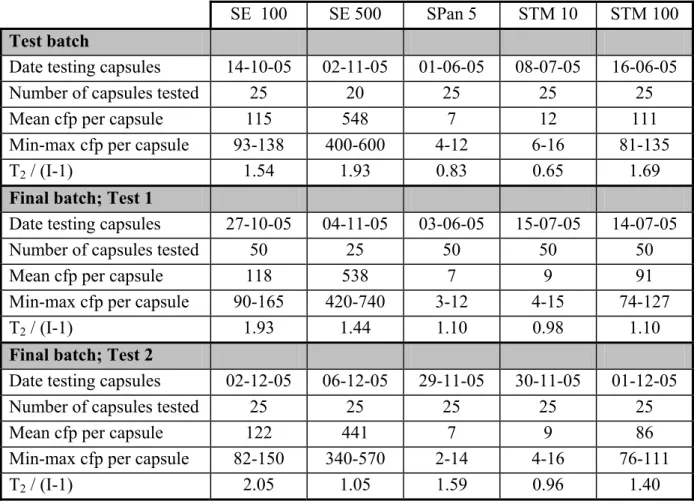
The level of contamination and the homogeneity of the test batches as well as of the final batches of capsules are presented in Table 2. All batches met the pre-set criteria as stated under section 3.1. The enumerated minimum and maximum levels within each batch of capsules are also given in the table.The final batches were tested twice; firstly immediately after preparing the batch and secondly at the time of the interlaboratory comparison study.
Table 2 Level of contamination and homogeneity of SE, SPan and STM capsules
SE 100 SE 500 SPan 5 STM 10 STM 100 Test batch
Date testing capsules 14-10-05 02-11-05 01-06-05 08-07-05 16-06-05
Number of capsules tested 25 20 25 25 25
Mean cfp per capsule 115 548 7 12 111
Min-max cfp per capsule 93-138 400-600 4-12 6-16 81-135
T2 / (I-1) 1.54 1.93 0.83 0.65 1.69
Final batch; Test 1
Date testing capsules 27-10-05 04-11-05 03-06-05 15-07-05 14-07-05
Number of capsules tested 50 25 50 50 50
Mean cfp per capsule 118 538 7 9 91
Min-max cfp per capsule 90-165 420-740 3-12 4-15 74-127
T2 / (I-1) 1.93 1.44 1.10 0.98 1.10
Final batch; Test 2
Date testing capsules 02-12-05 06-12-05 29-11-05 30-11-05 01-12-05
Number of capsules tested 25 25 25 25 25
Mean cfp per capsule 122 441 7 9 86
Min-max cfp per capsule 82-150 340-570 2-14 4-16 76-111
T2 / (I-1) 2.05 1.05 1.59 0.96 1.40
cfp = colony forming particles;
min-max = enumerated minimum and maximum cfp; formula T2 see Annex 2; I is number of capsules; Demand for homogeneity T2 /(I-1) ≤ 2
4.2
Dust and faeces samples
The dust samples were received at 29-10-2005 and the faeces samples were received at 29-10-2005 and 13-10-2005 at the CRL-Salmonella. The dust contained Salmonella
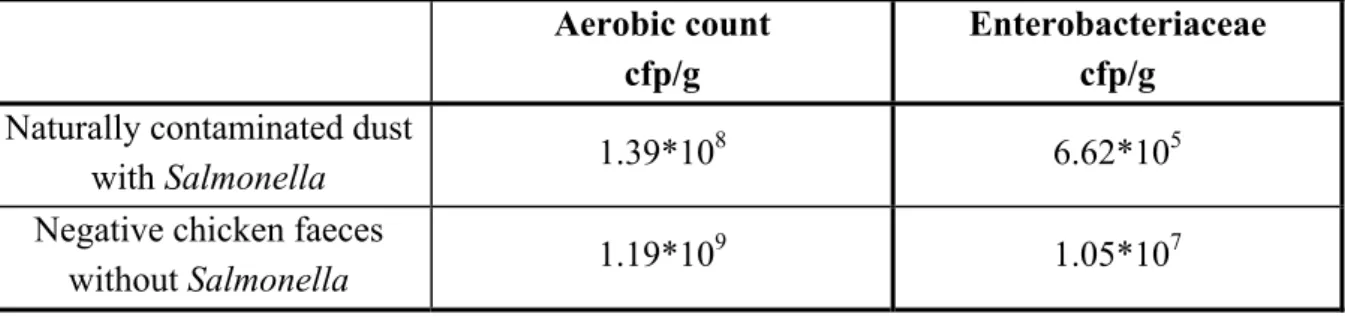
Livingstone and Salmonella Virchow. The number of Salmonella in the dust was determined by performing the MPN procedure (see subsection 3.2.4) on 22-11-2005. The MPN result of this positive dust was 34 cfp per gram (95 % confidence interval: 10-100 cfp per gram). In Table 3 the total number of aerobic bacteria and Enterobacteriaceae are shown for the positive dust and the negative chicken faeces samples
Table 3 Number of aerobic bacteria and Enterobacterieae per gram of naturally contaminated dust with Salmonella and faeces without Salmonella
Aerobic count cfp/g
Enterobacteriaceae cfp/g
Naturally contaminated dust
with Salmonella 1.39*10
8 6.62*105
Negative chicken faeces
without Salmonella 1.19*10
4.3
Technical data interlaboratory comparison study
4.3.1 Media
Each laboratory was asked to test the samples with the selective enrichment medium MSRV and the plating out medium XLD and a plating out medium of own choice. The media used are shown in Table 4. All NRLs tested the samples with the prescribed medium
combinations. Laboratory 14 did use XLD and another plating out medium (BGA), but only confirmed colonies of BGA when suspected colonies were found on both XLD and BGA. Three laboratories used RVS next to MSRV as selective enrichment medium; two
laboratories used RV, two MKTTn, one SC and one DIASSALM. One laboratory used MSRV at both pH 5.2 (as prescribed in this study) and at pH 5.4 (as prescribed by the manufacturer). Small differences were found after 4 h incubation of BPW between the MSRV with pH 5.2 and 5.4, but no differences were found after 18 h incubation of BPW (see Annex 3).
Table 4 Media used per laboratory
Labcode Selective enrichment Isolation medium Labcode Selective enrichment Isolation medium 1 MSRV XLD 15 MSRV XLD Onoz BGA 2 MSRV XLD 16 MSRV XLD SC MacConkey BGA 3 MSRV XLD 17 MSRV XLD BxLH Rambach 4 MSRV XLD 18 MSRV XLD RVS R Sal SMID2 BGA 19 MSRV XLD 5 MSRV XLD Rambach Rambach BGA 6 MSRV XLD 20 MSRV XLD RV BG MKTTn BPLS 7 MSRV XLD 21 MSRV XLD BGA Rambach 8 MSRV XLD 22 MSRV XLD RVS MLCB MKTTn BGA BGA 23 MSRV XLD 9 MSRV XLD SM2 BGA 24 MSRV XLD 10 MSRV XLD BGA XLT4 25 MSRV XLD 11 MSRV XLD DIASSALM BGA MSRV (pH 5.4) BGA RVS 12 MSRV XLD 26 MSRV XLD RV Rambach MKTTn SMI XLT4 27 MSRV XLD 13 MSRV XLD RVS BGA BGA 28 MSRV XLD 14 MSRV BGA Hektoen
4.3.2 Pre-warming time and temperature of BPW
Before adding the capsules, faeces and/or dust to the BPW, all jars had to be pre-warmed at (37 ± 1) ºC overnight. All laboratories met the criteria as set in the standard operation procedure.
4.3.3 Incubation time and temperature for dissolving the capsules
Before adding the chicken faeces to the pre-enrichment medium (BPW), the capsules had to be dissolved in the BPW at (37 ± 1) oC for 45 min.Twenty-three laboratories dissolved the capsules in exactly forty-five minutes.One laboratory (labcode 11) reported a dissolving time of 5 min. Four laboratories used a dissolving time of more than 45 min, i.e. 50 min
(laboratories 2 and 12) and 60 min (laboratories 17 and 24).One laboratory (labcode 26) started the dissolving with an incubator temperature of 34.7 oC and a final temperature of 34.7 oC. The NRL with labcode 19 reported a final temperature of the incubator of 35 oC. Laboratory 23 reported that the capsules were not completely dissolved after 45 min at 37 ºC.
4.3.4 Incubation time and temperature of pre-enrichment
In this study two incubation times of the pre-enrichment medium BPW were compared, being (4 ± ½) h and (18 ± 2) h. The last incubation time is according to ISO 6579: 2002. All
laboratories except one laboratory (labcode 24) incubated the BPW for the prescribed short incubation time (4 ± ½) h (see Table 4). Laboratory 24 incubated the samples for 1 h. Eight laboratories (labcodes 6, 10, 12, 13, 17, 19, 20 and 26) incubated the samples less than the prescribed long incubation time (less than 16 h). One laboratory (labcode 4) exceeded the prescribed long incubation time (more than 20 h).
The prescribed temperature for the incubation of BPW is (37 ± 1) oC.All laboratories except two (labcode 19 and 26) incubated the BPW at the prescribed temperature (Table 5).
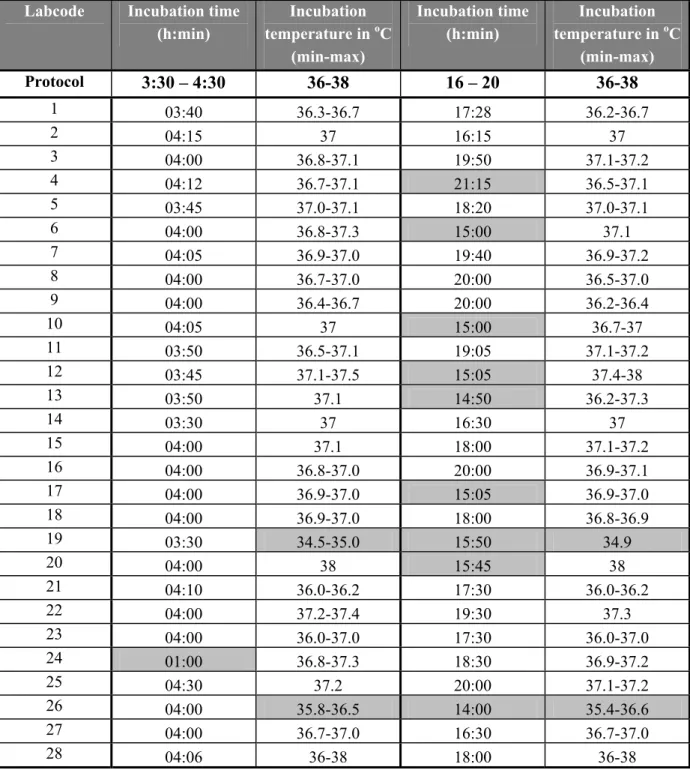
Table 5 Incubation times and temperatures of pre-enrichment medium BPW Labcode Incubation time
(h:min) Incubation temperature in oC (min-max) Incubation time (h:min) Incubation temperature in oC (min-max) Protocol 3:30 – 4:30 36-38 16 – 20 36-38 1 03:40 36.3-36.7 17:28 36.2-36.7 2 04:15 37 16:15 37 3 04:00 36.8-37.1 19:50 37.1-37.2 4 04:12 36.7-37.1 21:15 36.5-37.1 5 03:45 37.0-37.1 18:20 37.0-37.1 6 04:00 36.8-37.3 15:00 37.1 7 04:05 36.9-37.0 19:40 36.9-37.2 8 04:00 36.7-37.0 20:00 36.5-37.0 9 04:00 36.4-36.7 20:00 36.2-36.4 10 04:05 37 15:00 36.7-37 11 03:50 36.5-37.1 19:05 37.1-37.2 12 03:45 37.1-37.5 15:05 37.4-38 13 03:50 37.1 14:50 36.2-37.3 14 03:30 37 16:30 37 15 04:00 37.1 18:00 37.1-37.2 16 04:00 36.8-37.0 20:00 36.9-37.1 17 04:00 36.9-37.0 15:05 36.9-37.0 18 04:00 36.9-37.0 18:00 36.8-36.9 19 03:30 34.5-35.0 15:50 34.9 20 04:00 38 15:45 38 21 04:10 36.0-36.2 17:30 36.0-36.2 22 04:00 37.2-37.4 19:30 37.3 23 04:00 36.0-37.0 17:30 36.0-37.0 24 01:00 36.8-37.3 18:30 36.9-37.2 25 04:30 37.2 20:00 37.1-37.2 26 04:00 35.8-36.5 14:00 35.4-36.6 27 04:00 36.7-37.0 16:30 36.7-37.0 28 04:06 36-38 18:00 36-38 Times and temperatures deviating from the prescribed ones are indicated as grey cells.
4.3.5 Composition of selective enrichment medium MSRV
The prescribed composition of the MSRV was according to the draft Annex D of ISO 6579 (see Annex 9). Laboratory 5 did not report the composition of the MSRV. All other
laboratories except two (labcodes 8 and 24) reported the correct composition (see Table 4.4 in Annex 4). However, according to draft Annex D the concentration of novobiocin in MSRV should be of 0.01 g/l. Four laboratories (labcodes 4, 15, 24 and 26) used a concentration of 0.02 g/l novobiocin in their selective enrichment medium MSRV. The NRL with labcode 18 did not add novobiocin to their MSRV and three laboratories (labcode 8, 9 and 28) did not report the concentration of novobiocin used.
4.3.6 Incubation times and temperatures of selective enrichment
The incubation time and temperature for MSRV according to draft Annex D of ISO 6579 should be between 21 – 27 h and (41.5 ± 1) oC, respectively. If plates were negative they should be incubated for another 21-27 h. Two laboratories (labcodes 4 and 24) used a total incubation time outside the prescribed range of 42 – 54 h. Most laboratories however complied with the required incubation time (see Table 6). All NRLs except six (labcodes 4, 6, 10, 11, 19 and 24) met the prescribed temperature of (41.5 ± 1) oC. In all these laboratories the starting temperature was too low.
Table 6 Incubation times and temperatures of selective enrichment medium MSRV after 4 and 18 h of incubation in BPW
After 4 h incubation in BPW After 18 h incubation in BPW Labcode Incubation time
in h:min Incubation temperature in oC (min-max) Incubation time in h:min Incubation temperature in oC (min-max) SOP 2 x (24 ± 3) h 40.5 – 42.5 2 x (24 ± 3) h 40.5 – 42.5 1 45:00 41.2-41.5 48:55 41.2-41.5 2 48:00 41.5 49:20 41.5 3 45:00 41.9-42.3 46:55 41.9-42.3 4 40:35 39.6-41.8 36:15 39.5-41.5 5 44:15 41.5 47:30 41.5 6 44:40 41.0-41.5 48:40 39.9-41.6 7 47:21 41.2-42.1 46:58 41.7-42.0 8 46:15 41.5-42.0 48:00 41.5-42.0 9 42:00 41.5-41.8 47:00 41.4-41.6 10 47:30 41.0-41.5 50:20 36-41.5 11 45:00 40.4-40.8 46:40 39.3-41.0 12 42:55 40.9-41.8 42:05 40.9-41.4 13 44:20 41.3-41.7 45:15 41.2-41.6 14 46:30 41.5 46:30 41.5 15 46:30 41.1-41.2 47:45 41.2-41.3 16 45:30 41.5-41.7 46:30 41.5-41.7 17 43:25 40.8-41.7 45:20 40.8-41.2 18 46:45 41.8 47:50 41.8 19 44:55 38.0-41.1 46:30 39.1-43.8 20 45:40 41.9-42.0 48:00 42.0 21 42:10 41.3-41.7 46:50 41.4-41.5 22 44:30 41.5 45:15 41.5 23 44:00 41.0-42.0 46:30 41.0-42.0 24 24:30 41.0-41.5 41:05 36.6-41.5 25 42:05 41.5-41.7 45:55 41.5 26 47:00 42.2-42.5 45:50 41.6-42.5 27 47:30 41.3-41.6 47:30 41.1-41.7 28 48:30 41-43 49:30 41-43 Incubation times and temperatures according to SOP. Times and temperatures deviating from the prescribed
4.4
Control samples
General
None of the laboratories isolated Salmonella from the procedure control (C11: no capsule/no faeces) and one laboratory (labcode 8) isolated Salmonella from the faeces control (C12: no capsule/negative faeces).
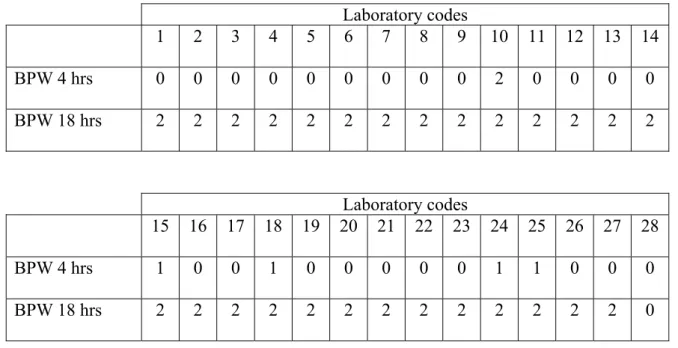
Blank capsules (n=2) without addition of faeces
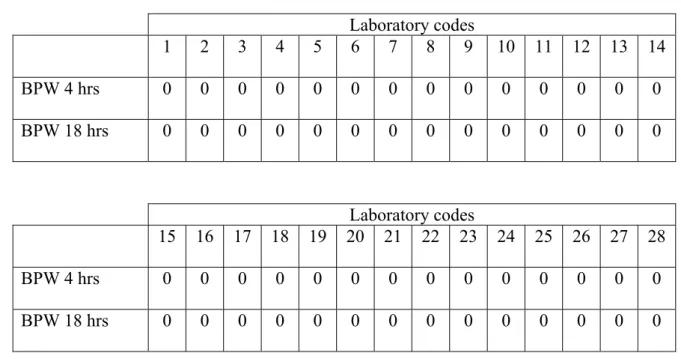
The blank capsules contained only sterile milk powder. For the analyses no faeces was added. All twenty-seven participating laboratories did not isolate bacteria from these blank capsules (see Table 7).
Table 7 Number of positive isolations per laboratory for blank capsules (n=2) without
addition of faeces Laboratory codes 1 2 3 4 5 6 7 8 9 10 11 12 13 14 BPW 4 hrs 0 0 0 0 0 0 0 0 0 0 0 0 0 0 BPW 18 hrs 0 0 0 0 0 0 0 0 0 0 0 0 0 0 Laboratory codes 15 16 17 18 19 20 21 22 23 24 25 26 27 28 BPW 4 hrs 0 0 0 0 0 0 0 0 0 0 0 0 0 0 BPW 18 hrs 0 0 0 0 0 0 0 0 0 0 0 0 0 0
Salmonella Panama 5 capsules (n=2) without addition of faeces
One laboratory (labcode 10) was able to isolate Salmonella from both capsules containing
S. Panama at a level of circa 5 cfp/capsule after both 4 h and 18 h incubation of BPW. Four
laboratories (labcodes 15, 18, 24 and 25) isolated Salmonella from only one of the two capsules after 4 h incubation of BPW and isolated Salmonella from both capsules after 18 h incubation of BPW. Twenty-three laboratories failed to isolate Salmonella after 4 h incubation of BPW, but isolated Salmonella from both capsules after 18 h incubation of BPW. One laboratory (labcode 28) was not able to isolate Salmonella from any of the
S. Panama capsules and therefore did not achieve the good performance level as proposed
Table 8 Number of positive isolations per laboratory for SPan 5 (n=2) without addition of faeces Laboratory codes 1 2 3 4 5 6 7 8 9 10 11 12 13 14 BPW 4 hrs 0 0 0 0 0 0 0 0 0 2 0 0 0 0 BPW 18 hrs 2 2 2 2 2 2 2 2 2 2 2 2 2 2 Laboratory codes 15 16 17 18 19 20 21 22 23 24 25 26 27 28 BPW 4 hrs 1 0 0 1 0 0 0 0 0 1 1 0 0 0 BPW 18 hrs 2 2 2 2 2 2 2 2 2 2 2 2 2 0
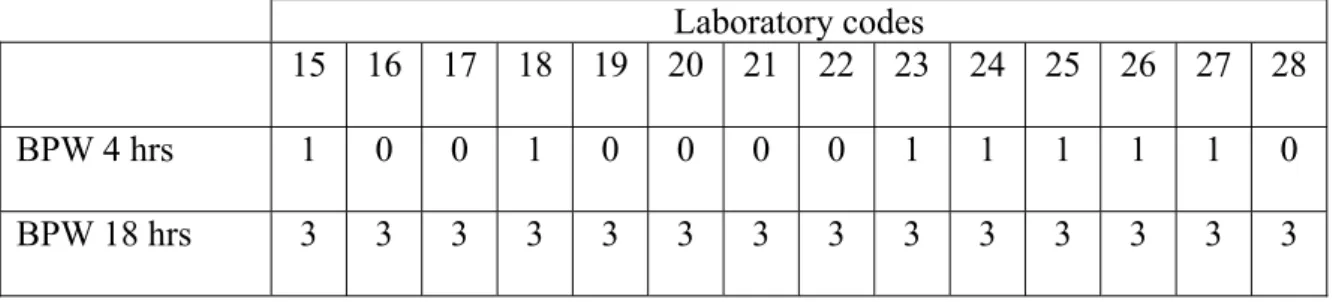
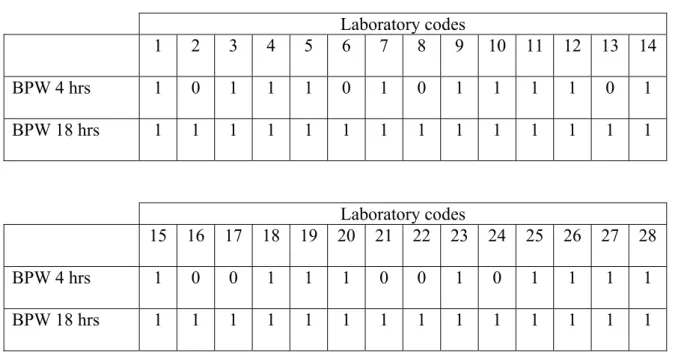
Salmonella Typhimurium 10 capsules (n=3) without addition of faeces
One laboratory (labcode 10) was able to isolate Salmonella from both capsules containing
Salmonella Typhimurium at a mean level of circa 10 cfp/capsule after both 4 h and 18 h
incubation of BPW. Two laboratories (labcodes 2 and 7) isolated Salmonella from only one of the three capsules after 4 h incubation of BPW and isolated Salmonella from all three capsules after 18 h incubation of BPW. Ten laboratories (labcodes 4, 11, 14, 15, 18, 23, 24, 25, 26 and 27) isolated Salmonella from two of the three capsules after 4 h incubation of BPW and isolated Salmonella from all three capsules after 18 h incubation of BPW. Fifteen laboratories (labcodes 1, 3, 5, 6, 8, 9, 12, 13, 16, 17, 19, 20, 21, 22 and 28) failed to isolate
Salmonella after 4 h incubation of BPW, but isolated Salmonella from both capsules after
18 h incubation of BPW (see Table 9).
Table 9 Number of positive isolations per laboratory for STM 10 (n=3) without
addition of faeces
Laboratory codes
1 2 3 4 5 6 7 8 9 10 11 12 13 14
BPW 4 hrs 0 2 0 1 0 0 2 0 0 3 1 0 0 1
Laboratory codes
15 16 17 18 19 20 21 22 23 24 25 26 27 28
BPW 4 hrs 1 0 0 1 0 0 0 0 1 1 1 1 1 0
BPW 18 hrs 3 3 3 3 3 3 3 3 3 3 3 3 3 3
Salmonella Enteritidis 100 capsules (n=2) without addition of faeces
Two laboratories (labcodes 10 and 26) were able to isolate Salmonella from both capsules containing Salmonella Enteritidis at a mean level of circa 100 cfp/capsule after both 4 h and 18 h incubation of BPW. Eight laboratories (labcodes 1, 2, 4, 7, 12, 18, 24 and 25) isolated
Salmonella from only one of the two capsules after 4 h incubation of BPW and isolated Salmonella from all three capsules after 18 h incubation of BPW. Eighteen laboratories
(labcodes 3, 5, 6, 8, 9, 11, 13, 14, 15, 16, 17, 19, 20, 21, 22, 23, 27 and 28) failed to isolate
Salmonella after 4 h incubation of BPW, but isolated Salmonella from both capsules after
18 h incubation of BPW (see Table 10).
Table 10 Number of positive isolations per laboratory for SE 100 (n=2) without
addition of faeces Laboratory codes 1 2 3 4 5 6 7 8 9 10 11 12 13 14 BPW 4 hrs 1 1 0 1 0 0 1 0 0 2 0 1 0 0 BPW 18 hrs 2 2 2 2 2 2 2 2 2 2 2 2 2 2 Laboratory codes 15 16 17 18 19 20 21 22 23 24 25 26 27 28 BPW 4 hrs 0 0 0 1 0 0 0 0 0 1 1 2 0 0 BPW 18 hrs 2 2 2 2 2 2 2 2 2 2 2 2 2 2
Salmonella Enteritidis 500 capsules (n=1) without addition of faeces
Nineteen laboratories (labcodes 1, 3, 4, 5, 7, 9, 10, 11, 12, 14, 15, 18, 19, 20, 23, 25, 26, 27 and 28) were able to isolate Salmonella from the capsule containing Salmonella Enteritidis at a mean level of circa 500 cfp/capsule after both 4 h and 18 h incubation of BPW. The other nine laboratories (labcodes 2, 6, 8, 13, 16, 17, 21, 22 and 24) failed to isolate Salmonella after 4 h incubation of BPW, but isolated Salmonella from the capsule after 18 h incubation of BPW (see Table 11).
Table 11 Number of positive isolations per laboratory for SE 500 (n=1) without
addition of faeces Laboratory codes 1 2 3 4 5 6 7 8 9 10 11 12 13 14 BPW 4 hrs 1 0 1 1 1 0 1 0 1 1 1 1 0 1 BPW 18 hrs 1 1 1 1 1 1 1 1 1 1 1 1 1 1 Laboratory codes 15 16 17 18 19 20 21 22 23 24 25 26 27 28 BPW 4 hrs 1 0 0 1 1 1 0 0 1 0 1 1 1 1 BPW 18 hrs 1 1 1 1 1 1 1 1 1 1 1 1 1 1
In Table 12 the specificity, sensitivity and accuracy for the control capsules without the addition of faeces are shown.
After 4 h of incubation of BPW as well as after 18 h of incubation of BPW the specificity was in both cases 100 %. The sensitivity for SPan 5 capsules, STM 10 capsules, SE 100 capsules and SE 500 capsules after 4 h of incubation in BPW was respectively 9 %, 20 %, 23 % and 68 %. The sensitivity after 18 h of incubation in BPW was for SPan 5 capsules 96 % and for all other three kinds of samples 100 % (see Table 11). The sensitivity for all capsules containing Salmonella was after 4 h of incubation of the BPW 24 % and after 18 h of incubation in BPW 99 %. The accuracy rate for all capsules (blank and capsules containing
Salmonella) was 39 % after 4 h of incubation of BPW and 99 % after 18 h of incubation of
Table 12 Specificity, sensitivity and accuracy for all participating laboratories (n = 28) with all control capsules and all medium combinations without addition of faeces
4 hr BPW 18 hr BPW
Blank (n =2 per lab) number of samples 56 56
negative samples 56 56
Specificity in % 100.0 100.0
SPan 5 (n = 2 per lab) number of samples 56 56
positive samples 5 54
Sensitivity in % 8.9 96.4
STM 10 (n = 3 per lab) number of samples 84 84
positive samples 17 84
Sensitivity in % 20.2 100.0
SE 100 (n = 2 per lab) number of samples 56 56
positive samples 13 56
Sensitivity in % 23.2 100.0
SE 500 (n = 1 per lab) number of samples 28 28
positive samples 19 28
Sensitivity in % 67.9 100.0
All capsules with
Salmonella number of samples 224 224
positive samples 54 222
Sensitivity in % 24.1 99.1
All capsules number of samples 280 280
correct samples 110 278
4.5
Results faeces samples artificially contaminated with
Salmonella spp.
4.5.1 Results per type of capsule and per laboratory
GeneralTwo laboratories (labcode 12 and 24) received two capsules with the same number and one capsule was missing. The results of both the double and the missing capsule numbers are not included in the results. Therefore n = 4 for laboratory 12 for STM 100 and SE100 and for laboratory 24 for SE100 and blank capsules.
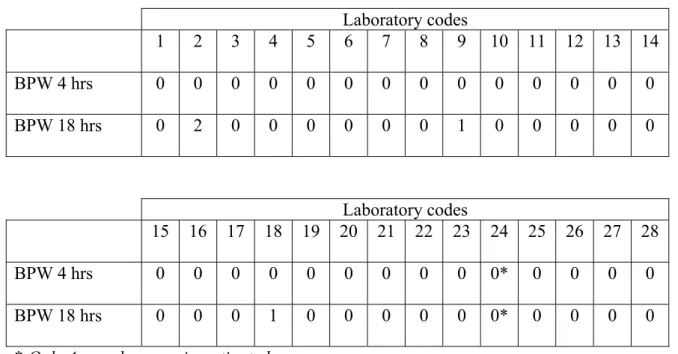
Blank capsules with negative faeces
No Salmonella spp. were reported after 4 h incubation of BPW.
Laboratory 2 reported the isolation of Salmonella spp. of two of the five capsules and therefore did not achieve the level of “good performance” as suggested during the
CRL-Salmonella workshop 2005. Laboratories 9 and 18 reported the isolation of CRL-Salmonella spp.
of one of the five capsules after 18 h of incubation of the BPW (Table 13).
Table 13 Number of isolations per laboratory for blank capsules (n=5) with the addition of 10 g Salmonella negative chicken faeces
Laboratory codes 1 2 3 4 5 6 7 8 9 10 11 12 13 14 BPW 4 hrs 0 0 0 0 0 0 0 0 0 0 0 0 0 0 BPW 18 hrs 0 2 0 0 0 0 0 0 1 0 0 0 0 0 Laboratory codes 15 16 17 18 19 20 21 22 23 24 25 26 27 28 BPW 4 hrs 0 0 0 0 0 0 0 0 0 0* 0 0 0 0 BPW 18 hrs 0 0 0 1 0 0 0 0 0 0* 0 0 0 0
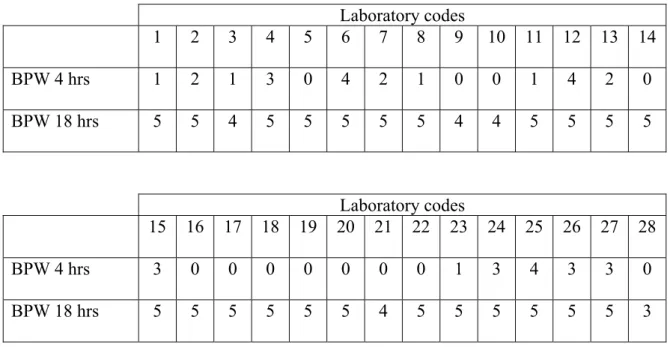
S. Typhimurium 10 capsules (STM10) with negative faeces
In Table 14 the results are summarized of the Salmonella-negative faeces samples artificially contaminated with capsules containing STM10. Twelve laboratories (labcode 4, 8, 13, 21, 23 and 25) did not isolate Salmonella from any of the five samples after 4 h incubation of BPW. No laboratory found the maximum number (5) of positive isolations after 4 h incubation of BPW.After 18 h of incubation of BPW the maximum number of positives were found by 23 laboratories. Four laboratories (labcodes 3, 9, 10 and 21) reported the isolation of
Salmonella of four of the five capsules and one laboratory (labcode 28) reported the isolation
of Salmonella of three of the five capsules after 18 h incubation of BPW.
Table 14 Number of positive isolations per laboratory for STM 10 (n=5) with the addition of 10 g Salmonella negative chicken faeces
Laboratory codes 1 2 3 4 5 6 7 8 9 10 11 12 13 14 BPW 4 hrs 1 2 1 3 0 4 2 1 0 0 1 4 2 0 BPW 18 hrs 5 5 4 5 5 5 5 5 4 4 5 5 5 5 Laboratory codes 15 16 17 18 19 20 21 22 23 24 25 26 27 28 BPW 4 hrs 3 0 0 0 0 0 0 0 1 3 4 3 3 0 BPW 18 hrs 5 5 5 5 5 5 4 5 5 5 5 5 5 3
S. Typhimurium 100 (STM100) with negative faeces
In Table 15 the results are summarized of the Salmonella-negative faeces samples artificially contaminated with capsules containing STM100. All laboratories isolated Salmonella out of at least one of the five capsules after 4 h incubation of BPW. Thirteen laboratories (labcodes 3, 4, 6, 7, 10, 11, 12, 13, 15, 23, 25, 26 and 27) found the maximum number of positive isolations after 4 h incubation of BPW.After 18 h of incubation of BPW the maximum number of positives was found by all laboratories except for laboratory 3, who isolated
Table 15 Number of positive isolations per laboratory for STM 100 (n=5) with the addition of 10 g Salmonella negative chicken faeces
Laboratory codes 1 2 3 4 5 6 7 8 9 10 11 12 13 14 BPW 4 hrs 3 1 5 5 2 5 5 3 1 5 5 4* 5 1 BPW 18 hrs 5 5 4 5 5 5 5 5 5 5 5 4* 5 5 Laboratory codes 15 16 17 18 19 20 21 22 23 24 25 26 27 28 BPW 4 hrs 5 1 3 4 3 3 2 1 5 2 5 5 5 2 BPW 18 hrs 5 5 5 5 5 5 5 5 5 5 5 5 5 5
* 4 samples were investigated instead of 5
S. Enteritidis 100 (SE100) with negative faeces
In Table 16 the results are summarized of the Salmonella-negative faeces samples artificially contaminated with capsules containing SE100. Twelve laboratories (labcode 2, 5, 7, 9, 10, 11, 14, 16, 17, 21 and 22) did not isolate Salmonella from any of the five samples after 4 h
incubation of BPW.No laboratory found the maximum number (5) of positive isolations after 4 h incubation of BPW.After 18 h of incubation of BPW the maximum number of positives was found by 26 laboratories. Two laboratories (labcodes 21 and 22) reported the isolation of
Table 16 Number of positive isolations per laboratory for SE 100 (n=5) with the addition of 10 g Salmonella negative chicken faeces
Laboratory codes 1 2 3 4 5 6 7 8 9 10 11 12 13 14 BPW 4 hrs 2 0 2 3 0 1 0 1 0 0 0 2* 1 0 BPW 18 hrs 5 5 5 5 5 5 5 5 5 5 5 4* 5 5 Laboratory codes 15 16 17 18 19 20 21 22 23 24 25 26 27 28 BPW 4 hrs 1 0 0 1 0 3 0 0 2 2* 2 1 4 2 BPW 18 hrs 5 5 5 5 5 5 4 4 5 4* 5 5 5 5
* 4 samples were investigated instead of 5 S. Enteritidis 500 (SE500) with negative faeces
One laboratory (labcode 22) did not isolate Salmonella from any of the five samples after 4 h incubation of BPW. Fourteen laboratories (labcode 3, 4, 6, 10, 11, 12, 13, 14, 15, 17, 18, 23, 25, 26 and 27) found the maximum of number (5) of positive isolations after 4 h incubation of BPW.After 18 h of incubation of BPW the maximum number of positives was found by all 28 laboratories (Table 17).
Table 17 Number of positive isolations per laboratory for SE 500 (n=5) with the addition of 10 g Salmonella negative chicken faeces
Laboratory codes 1 2 3 4 5 6 7 8 9 10 11 12 13 14 BPW 4 hrs 4 1 5 5 3 5 4 1 1 5 5 5 5 2 BPW 18 hrs 5 5 3 5 5 5 5 5 5 5 5 5 5 5 Laboratory codes 15 16 17 18 19 20 21 22 23 24 25 26 27 28 BPW 4 hrs 5 2 5 5 2 4 2 0 5 4 5 5 5 2 BPW 18 hrs 5 5 5 5 5 5 5 5 5 5 5 5 5 5
In Figure 1 the percentages of positive isolations per laboratory for all capsules (n = 20) containing Salmonella with the addition of 10 g Salmonella negative chicken faeces after 4 h incubation of BPW are presented.
In Figure 2 the percentages of positive isolations per laboratory for all capsules (n = 20) containing Salmonella with the addition of 10 g Salmonella negative chicken faeces after 18 h incubation of BPW are presented.
Figure 1 Percentages of positive isolations per laboratory for all capsules (n = 20) with the addition of 10 g Salmonella negative chicken faeces after 4 h incubation of BPW. For laboratories 12 and 24 n = 18.
0 10 20 30 40 50 60 70 80 90 100 1 2 3 4 5 6 7 8 9 10 11 12 13 14 15 16 17 18 19 20 21 22 23 24 25 26 27 28 Labcode p ercen ta ge o f p os it iv e i so la ti on s
Figure 2 Percentages of positive isolations per laboratory for all capsules (n = 20) with the addition of 10 g Salmonella negative chicken faeces after 18 h incubation of BPW. For laboratories 12 and 24 n = 18.
0 2 4 6 8 10 12 14 16 18 20 1 2 3 4 5 6 7 8 9 10 11 12 13 14 15 16 17 18 19 20 21 22 23 24 25 26 27 28 Labcode p er ce n ta ge of p os it ive i sol at io n s
4.5.2 Specificity, sensitivity and accuracy rates of artificially
contaminated samples
The specificity, sensitivity and accuracy rates for all types of capsules with the addition of
Salmonella-negative faeces are shown in Table 18. The specificity rate (of the blank samples)
after 4 h of incubation of BPW was 100 %, and after 18 h of incubation 97 %. After 4 h of incubation of BPW the sensitivity was 27, 68, 21 and 71 % for respectively STM 10, STM 100, SE 100 and SE 500 capsules. After 18 h of incubation of BPW the sensitivity was more than 95 % in all cases. The sensitivity rate for all capsules containing Salmonella was 47 % after 4 h of incubation of BPW and 98 % after 18 h of incubation of BPW. The accuracy rate was 57 % and 98 % after 4 h and 18 h of incubation of BPW, respectively.
Table 18 Specificity, sensitivity and accuracy rates for all participating laboratories (n = 28) and all capsules with the addition of 10 g Salmonella negative faeces
4 h BPW 18 h BPW
Blank (n = 5 per lab*) number of samples 139 139
negative samples 139 135
Secificity in % 100.0 97.1
STM 10 (n = 5 per lab) number of samples 140 140
positive samples 38 134
Sensitivity in % 27.1 95.7
STM 100 (n = 5 per lab*) number of samples 139 139
positive samples 94 138
Sensitivity in % 67.6 99.3
SE 100 (n = 5 per lab*) number of samples 138 138
positive samples 29 136
Sensitivity in % 21.0 98.6
SE 500 (n = 5 per lab) number of samples 140 140
positive samples 100 138
Sensitivity in % 71.4 98.6
All capsules with
Salmonella number of samples 557 557
positive samples 261 546
Sensitivity in % 46.9 98.0
All capsules number of samples 696 696
correct samples 400 681
Accuracy in % 57.5 97.8
4.6
Results dust samples naturally contaminated with
Salmonella spp.
The results in Table 19 and Figures 3 and 4 shows that eleven laboratories (labcodes 1, 4, 6, 11, 13, 18, 20, 23, 25, 26 and 27) were able to recover Salmonella from all dust samples after 4 h incubation of BPW, whereas 26 laboratories were able to recover
Salmonella from all dust samples after 18 h incubation of BPW. One laboratory
(labcode 21) tested only 2 samples after 18 h incubation of BPW. Both of these samples were tested positive for Salmonella. Another laboratory (labcode 28) tested only 5 dust samples after 18 h incubation of BPW, of these 5 samples 3 were tested positive for
Salmonella.
Table 19 Number of positive isolations per medium combination and per laboratory for
naturally contaminated dust (n=20)
Laboratory codes Medium combination 1 2 3 4 5 6 7 8 9 10 11 12 13 14 BPW 4 hrs 10 4 8 10 6 10 8 9 9 9 10 9 10 8 BPW 18 hrs 10 10 10 10 10 10 10 10 10 10 10 10 10 10 Laboratory codes Medium combination 15 16 17 18 19 20 21 22 23 24 25 26 27 28 BPW 4 hrs 8 7 8 10 1 10 8 5 10 5 10 10 10 3 BPW 18 hrs 10 10 10 10 10 10 2* 10 10 10 10 10 10 5*
* Laboratory 21 investigated only 2 samples after 18 h in BPW and laboratory 28 investigated only 5 samples after 18 h in BPW
Six laboratories (labcode 1, 2, 11, 12, 13 and 27) reported a strain in the dust samples that was yellow in LDC (meaning a positive reaction, whereas a negative purple color is normally expected). Two laboratories (labcode 1 and 13) confirmed the samples with API 20E as
Salmonella. Laboratory 1 used a InvA-PCR and typed the strain as S. Virchow. Four
laboratories (labcode 2, 11, 20 and 27) serotyped all samples (including artificially contaminated, control samples and dust). Laboratory 1 found S. Virchow, S. Kortrijk and
S. Isangi in the dust samples. Laboratory 11 found S. Virchow, S. Livingstone and S. Infantis.
Laboratory 20 typed all strains as S. Livingstone. Laboratory 25 and 27 only determined the O group. Laboratory 25 found both group B and C and laboratory 27 typed the strains O 6,7 group C.
0 10 20 30 40 50 60 70 80 90 100 1 2 3 4 5 6 7 8 9 10 11 12 13 14 15 16 17 18 19 20 21 22 23 24 25 26 27 28 Labcode P ercen ta ge o f p os it iv e i so la ti on s
Figure 3 Percentages of positive isolations (n = 10) per laboratory when analysing 10 g Salmonella positive dust after 4 h incubation of BPW.
0 10 20 30 40 50 60 70 80 90 100 1 2 3 4 5 6 7 8 9 10 11 12 13 14 15 16 17 18 19 20 21 22 23 24 25 26 27 28 Labcode P ercen ta ge o f p os it iv e i so la ti on s
Figure 4 Percentages of positive isolations (n = 10*) per laboratory when analysing 10 g Salmonella positive dust after 18 h incubation of BPW. * n = 2 for laboratory 21 and n = 5 for laboratory 28.
The sensitivity rates for 28 participating laboratories for the naturally contaminated samples per medium combination are given in Table 20. The isolation of Salmonella from the naturally contaminated dust showed less positive isolations after 4 h of incubation of BPW than after 18 h of incubation of BPW, resulting in a sensitivity of 81 % and 99 %,
respectively.
Table 20 Sensitivity rates of all participating laboratories (n = 28) after 4 and 18 h incubation of BPW for the naturally contaminated dust with Salmonella (n=10) 4 hr BPW 18 hr BPW number of samples (n = 10*) 280 270 positive samples 226 267 Sensitivity1 in % 80.7 98.9 * n = 2 for laboratory 21 and n = 5 for laboratory 28 after 18 h incubation of BPW
4.7
PCR
Six laboratories (labcodes 1, 2, 6, 16, 20 and 22) applied the PCR as additional detection technique. Laboratory with labcode 16 only carried out PCR on 15 artificially contaminated samples, the other laboratories for all artificially contaminated, control and dust samples. Laboratory 1 carried out a PCR after both 4 and 18 h incubation in BPW. All other laboratories only tested the samples after 18 h incubation of BPW.
Table 21 Details on the Polymerase Chain Reaction method, used as own method during the interlaboratory comparison study by four laboratories
Labcode Volume of BPW (μl)
Volume of DNA sample (μl)
Volume DNA added to PCR (μl) 1 1000 150 5 2 1000 150 5 16 1000 150 5 20 1000 300 5 22 1000 200 5
Laboratory 6 used a touch of a loop of a MSRV plate.
Three laboratories (labcodes 2, 16 and 22) used a PCR procedure which was commercially available. The PCR results of all laboratories are shown in the Tables 5.1 - 5.3 in Annex 5. For the control samples no samples were tested positive after 4 h incubation of BPW by laboratory 1 while with the culture method two samples were tested positive. After 18 h incubation of BPW laboratory 1, 6, 20 and 22 tested all samples correct, while with the culture method laboratory 1 tested one blank capsule positive. Laboratory 2 tested one blank capsule positive in the PCR, but negative in the culture method.
For the naturally contaminated samplesall samples were tested positive after 18 h incubation of BPW as well in the PCR as in the culture method for all labs. After 4 h however, in the culture method all samples were tested positive by laboratory 1 while all samples were tested negative in the PCR.
No positive results were found in the PCR after 4 h incubation of BPW by laboratory 1 while 10 samples were found positive in the culture method. Also after 18 h of BPW more positive results (20) were obtained with the culture method than with the PCR (16) by laboratory 1. Laboratory 2 tested two blank samples positive in the culture method and one in the PCR. Laboratories 6, 16 and 20 found the same results in the PCR method as in the culture method. One positive sample was found negative in the culture method by laboratory 22, in the PCR the same sample was tested negative and one additional positive sample was tested negative.
4.8
Transport of samples
The temperature recorders were returned immediately after receipt to CRL-Salmonella by all NRLs. Print-outs of the temperature recorders can be found in Annex 6. The majority of the laboratories received the materials within 1 to 2 days. Only for laboratories 12 and 28 the transport time was 3 days. The average number of transport time was 1.5 days. The temperature of the content of the parcel was below 5 oC in all cases.
5.
Discussion
Performance of the laboratoriesDue to a mistake of the CRL-Salmonella, laboratory 12 and 24 received two capsules with the same number and one capsule was missing. The results of both the double and missing capsule numbers were not included in the results. In general all laboratories performed very well this year. Only two NRLs did not achieve the level of “good performance” as was suggested during the CRL-Salmonella workshop in April 2005. The NRL with labcode 2 isolated Salmonella out of 2 of the 5 blank capsules with the addition of faeces and the NRL with labcode 28 did not isolate Salmonella out of both capsules containing SPan5. Since all NRLs (including the NRLs with labcode 2 and 28) tested all the samples correctly no further actions were taken.
In this study more positive isolations were found than in the former study of 2004. For both the artificially contaminated samples as well as for the naturally contaminated dust, more positive isolations were found after 18 h incubation of BPW than after 4 h incubation. After 18 h incubation of BPW almost all samples were found positive for Salmonella. Incubation of BPW for 4 h therefore seems to be too short to isolate all Salmonellas present in the samples.
Transport of the samples
For this study the samples were shipped by courier service from door-to-door as diagnostic specimens, resulting in short transport times. All NRLs received the packages within 3 days. The temperature of the contents of the packages did not exceed 5 ºC.
Dust samples
The dust samples contained S. Livingstone and S. Virchow. For the S. Virchow present in this dust sample the conformation on LDC was yellow instead of purple (thus positive instead of negative). Six laboratories reported a strain in the dust samples that was yellow in LDC. Five laboratories further typed the strains in the dust. One laboratory only found S. Livingstone, one laboratory found S. Isangi and S. Kortrijk next to S. Virchow and one laboratory found S. Infantis next to S. Virchow and S. Livingstone. Another laboratory typed only the O-antigens and found strains from group C as well from group B. It is possible that these strains (S. Isangi, S. Kortrijk, S. Infantis and group B) were also present in the dust; however it could also be that the strains are typed incorrectly.