Report 680717017/2010
M.H. Zwart | C.H.G. Daatselaar | L.J.M. Boumans | G.J. Doornewaard
Agricultural practice and water quality
on farms registered for derogation
RIVM report 680717017/2010
Agricultural practice and water quality on farms
registered for derogation
Results for 2008 in the derogation monitoring network
M.H. Zwart, RIVM C.H.G. Daatselaar, LEI L.J.M. Boumans, RIVM G.J. Doornewaard, LEI Contact: Manon Zwart
Centre for Environmental Monitoring manon.zwart@rivm.nl
This study was carried out on behalf of the Ministry of Agriculture, Nature and Food Quality and the Ministry of Housing, Spatial Planning and the Environment, under the auspices of project 680717, Minerals Policy Monitoring Programme
© RIVM 2010
Parts of this publication may be copied, provided the source is stated: 'National Institute for Public Health and the Environment (RIVM), the title of the publication and the year in which it was published'.
Rapport in het kort
Landbouwpraktijk en waterkwaliteit op landbouwbedrijven aangemeld voor derogatie Resultaten meetjaar 2008 in het derogatiemeetnet
Dit rapport geeft een overzicht van de bemestingspraktijk in 2008 en de waterkwaliteit in 2008 en 2009 op graslandbedrijven in Nederland die meer dierlijke mest mogen gebruiken dan in Europese
regelgeving is aangegeven (derogatie). De gegevens uit dit onderzoek kunnen worden gebruikt om de gevolgen voor de waterkwaliteit te bepalen. De waterkwaliteit gemeten in 2008 geeft de gevolgen weer van de landbouwpraktijk in 2007, het tweede jaar dat de derogatie in de praktijk werd toegepast. De waterkwaliteit gemeten in 2009 geeft de gevolgen weer van de landbouwpraktijk in 2008.
De Europese Nitraatrichtlijn verplicht lidstaten het gebruik van dierlijke mest te beperken tot een bepaald maximum. Een lidstaat kan de Europese Commissie vragen om onder voorwaarden van deze beperking af te wijken. Nederland heeft in december 2005 toestemming gekregen om van 2006 tot en met 2013 af te mogen wijken van de gestelde norm. Een van de voorwaarden is dat de Nederlandse overheid een monitoringnetwerk inricht en aan de Commissie jaarlijks rapporteert over de resultaten daarvan.
Het Rijks Instituut voor Volksgezondheid en Milieu (RIVM) en het Landbouw Economisch Instituut (LEI) hebben in 2006 voor Nederland een monitoringnetwerk opgezet. Dit zogenoemde
derogatiemeetnet meet de gevolgen voor de landbouwpraktijk en de waterkwaliteit als
landbouwbedrijven afwijken van de Europese gebruiksnorm voor dierlijke mest. Het meetnet omvat driehonderd graslandbedrijven. Het derogatiemeetnet is een onderdeel van het Landelijk Meetnet effecten Mestbeleid (LMM). Van 284 graslandbedrijven is zowel de bedrijfsvoering als de waterkwaliteit gemonitord. Van iets minder dan driehonderd bedrijven is gerapporteerd doordat sommige achteraf geen derogatie toepasten of kregen en door bedrijfswisselingen in het meetnet. Trefwoorden: nitraatrichtlijn, derogatiebeschikking, landbouwpraktijk, waterkwaliteit, mest
Abstract
Agricultural practice and water quality at grassland farms under derogation Results for 2008 within the framework of the derogation monitoring network
This report provides an overview of fertilisation practices in 2008 and of water quality in 2008 and 2009 on grassland farms that are allowed to use more animal manure than the limit set in European legislation (derogation). Data in this report can be used to study the consequences of this derogation on the water quality. The water quality values measured in 2008 reflect agricultural practices in 2007, which was the second year in which the derogation was applied. The water quality values measured in 2009 reflect the consequences of agricultural practices in 2008.
The European Nitrates Directive obliges Member States to limit the use of animal manure to a specified maximum. A Member State may request the European Commission for permission to deviate from this obligation under specific conditions. In December 2005, the Commission granted the Netherlands the right to derogate from the obligation from 2006 up to and including 2009; in 2009 derogation was extended to 2013. One of the underlying conditions of the derogation is that the Netherlands establish a monitoring network and report the results to the European Commission.
In 2006, the National Institute for Public Health and the Environment (RIVM) and the Agricultural Economics Research Institute (LEI) set up a derogation monitoring network aimed at determining the effects of allowing farmers to deviate from the European use-standard for livestock manure. The monitoring network is part of the Minerals Policy Monitoring Programme. On 284 grassland farms the fertilisation practices as well as the water quality has been monitored. Fewer that 300 farms are reported in the network due to the fact that some farms ultimately did not make use of this option (derogation).
Foreword
On behalf of the Ministry of Agriculture, Nature and Food Quality (LNV) and the Ministry of Housing, Spatial Planning and the Environment (VROM), the National Institute for Public Health and the Environment (RIVM) and the Agricultural Economics Research Institute (LEI) have compiled this report. LEI is responsible for the information about agricultural practice and RIVM for the water quality data. RIVM is also the official secretary within this project.
In 2006, the Dutch government appointed the project group EU Monitoring to satisfy its reporting obligations to the European Commission with respect to the derogation decision of 8 December 2005. This project group, in which the Ministries of LNV and VROM are represented, has drawn up a project plan (26 October 2006). This details the obligations with respect to monitoring and reporting and describes how these ought to be realised. One of the reporting obligations is the monitoring of the water quality and agricultural practices. The Ministry of Agriculture, Nature and Food Quality (LNV) and the Ministry of Housing, Spatial Planning and the Environment (VROM) are responsible for all reports submitted to the European Commission.
This report provides an overview of the results of the water quality monitoring in 2008 and 2009 on a sample of farms registered for derogation. The water quality monitoring 2008 and 2009 covered most of the 300 farms participating in the monitoring network for the sampling of water quality on
derogation farms (the derogation monitoring network). Due to changes in the sample population, such as relocations, variations between the participating farms occur across the years measured. Moreover, in retrospect, not each farm makes use of the derogation in practice. Consequently the numbers of farms in the different regions and water types can vary each year. The 300 farms were already participating in the National Programme for Monitoring the Effectiveness of the Minerals Policy (LMM) or were recruited and sampled during the sampling campaign. The results of the water quality monitoring 2008 and 2009 are related to the agricultural practices of 2007 and 2008, the second and third derogation years. Furthermore, information is provided about the agricultural practices in 2008 for all farms in the derogation monitoring network that made use of the derogation. This includes data about the fertilisation and the nutrient surpluses realised.
We would also like to thank Mr J. M. Dalhuizen (LNV), Mr K. Locher (VROM) and Mr G. Velthof (CDM) for their critical comments. Finally, we would like to thank our colleagues from LEI and RIVM who, each in their own way, have contributed to this report.
Manon Zwart, Co Daatselaar, Leo Boumans and Gerben Doornewaard 30 April 2010
Contents
Summary 11
1 Introduction 19
1.1 Background 19
1.2 Previous reports 20
1.3 Content of this report 20
2 Design of the derogation monitoring network 23
2.1 Introduction 23
2.2 Design and realisation of the sample 24
2.2.1 Number of farms in 2008 24
2.2.2 Representativeness of the sample 25
2.3 Description of the farms in the sample 26
2.4 Monitoring of water quality 28
2.4.1 Sampling at farms 28
2.4.2 Chemical analyses and calculations 31
3 Results for 2008 33
3.1 Agricultural characteristics 33
3.1.1 Nitrogen use via livestock manure 33
3.1.2 Fertiliser use compared to the application standards 34
3.1.3 Crop yields 36
3.1.4 Nutrient surpluses 37
3.2 Water quality 39
3.2.1 Leaching from the root zone, measured in 2008 39
3.2.2 Ditch water quality, measured in 2007-2008 40
3.2.3 Provisional figures for the measurement year 2009 42
4 Changes since the derogation 45
4.1 Introduction 45
4.2 Trends in agricultural practice 45
4.2.1 Change in assessment method 45
4.2.2 Characterisation of the farms 46
4.2.3 Use of livestock manure 47
4.2.4 Use of fertilisers compared to the application standards 48
4.2.5 Crop yields 49
4.2.6 Nutrient surpluses on the soil surface balance 50
4.2.7 Summary 52
4.3 Evolution of the water quality 52
4.3.1 Introduction 52
4.3.2 Evolution in the years 2006 and 2007 53
4.3.3 Evolution during the derogation years 2007, 2008 and 2009 53
4.3.4 Influence of weather conditions 56
4.3.5 Summary 57
References 61 Appendix 1 The derogation decision, relevant articles about monitoring and reporting 65 Appendix 2 Selection and recruitment of participants for the derogation monitoring network 67
Appendix 3 Monitoring of agricultural characteristics 73
Appendix 4 Sampling of water on farms 83
Appendix 5 Descriptions of methods for weather correction 91
Summary
Background
The Nitrates Directive obliges Member States to limit the use of livestock manure to a maximum of 170 kg of nitrogen per ha per year. A Member State can, under certain conditions, ask the European Commission if it may deviate from this obligation (derogation). In December 2005, the Commission granted the Netherlands derogation for the period 2006-2009. Grassland farms with 70% or more grassland may, under prescribed conditions, apply up to 250 kg nitrogen (N) per ha to their land in the form of manure from grazing livestock. In return the Dutch government is obliged to set up a
monitoring network in accordance with the requirements stipulated in the derogation decision of the European Commission. Each year the Netherlands must also provide the European Commission with information − based on monitoring and model-based calculations − for example about the quantities of fertilisers applied to each crop per soil type and about the evolution of water quality.
The derogation monitoring network
In 2006, a new monitoring network was designed and established to monitor the evolution in agricultural practices and water quality as a consequence of the derogation. This network comprises 300 farms that applied for derogation. The derogation monitoring network was set up by expanding the National Programme for Monitoring the Effectiveness of the Minerals Policy (LMM). This means that all 300 selected farms also participate in the Farm Accountancy Data Network (FADN) of the
Netherlands Agricultural Economics Research Institute (LEI). The National Institute for Public Health and the Environment (RIVM) is the designated authority responsible for monitoring the quality of water that leaches from the root zone and the quality of surface waters. By using a stratified random sampling method, the 300 farms are distributed as evenly as possible throughout the Netherlands in terms of region (sand, loess, clay and peat), farm type (dairy farms and other grassland farms) and economic size class, putting emphasis on the sand region. This approach fulfils the condition that the sample should be representative for all soil types (clay, peat, sand and loess soils), fertilisation practices and crop rotations and that the focus is on the sand region.
Characteristics of the area and the farms in the derogation monitoring network
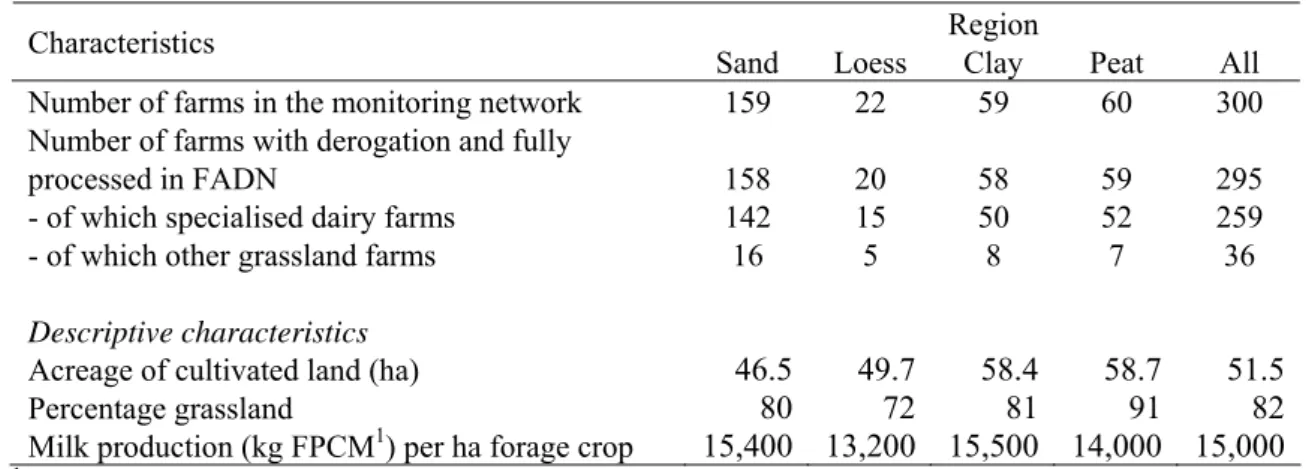
Table S.1Characteristics per region of farms included in the derogation monitoring network for 2008.
Region Characteristics
Sand Loess Clay Peat All
Number of farms in the monitoring network 159 22 59 60 300
Number of farms with derogation and fully
processed in FADN 158 20 58 59 295
- of which specialised dairy farms 142 15 50 52 259
- of which other grassland farms 16 5 8 7 36
Descriptive characteristics
Acreage of cultivated land (ha) 46.5 49.7 58.4 58.7 51.5
Percentage grassland 80 72 81 91 82
Milk production (kg FPCM1) per ha forage crop 15,400 13,200 15,500 14,000 15,000
1FPCM = Fat and Protein Corrected Milk. This is a standard used for comparing milk with different fat and
protein contents (1 kg milk with 4.00% fat and 3.32% protein = 1 kg FPCM). The means reported only refer to the 259 specialised dairy farms.
In 2008, the total agricultural area covered by the derogation monitoring network was 1.8% of the total area of all derogation farms, meeting the criteria for inclusion in the network (the sample population). The sample population covers 86.7% of the farms and 96.7% of the acreage of all farms that registered for derogation in 2008. In the loess region, the percentage of the sample acreage included in the monitoring network was 13.9% and therefore considerably higher compared to other regions. At 51.5 ha (see Table S1), the mean acreage of farms in the derogation monitoring network is larger than that of the sample population (42.6 ha). Furthermore, the dairy farms in the monitoring network produced more milk per ha than the average dairy farm in the sample population, especially in the loess region. The percentage of acreage used as grassland in the derogation monitoring network (82%, Table S.1) is virtually the same as the mean percentage of grassland in the sample population (83%).
Use of fertilisers
In 2008, farms in the derogation monitoring network used on average 236 kg nitrogen from livestock manure per ha of cultivated land (see Table S.2) and with this remained under the application standard for livestock manure at farm level. On arable land on average 175 kg per ha was used, whereas on grassland 250 kg nitrogen from livestock manure was applied. The manure production on some of the farms was calculated using a farm-specific method instead of forfeits.
The use of plant-available nitrogen from livestock manure and inorganic fertiliser (calculated with the prevailing statutory availability coefficients) was 272 kg per ha on grassland and 124 kg per ha on arable land (mainly silage maize) (see Table S.2). On both grassland and arable land the nitrogen use was lower than the nitrogen application standards in force in 2008. The mean use of phosphate, from livestock manure and inorganic fertiliser, on arable land (96 kg P2O5 per ha) exceeded the phosphate application standard in force in 2008, while on grassland the mean application of fertiliser (93 kg P2O5 per ha) was considerably lower in all regions than the phosphate application standard. Also on the farm level, phosphate application was below the phosphate application standards in all regions.
Table S2 Mean use of fertiliser on farms in the derogation monitoring network in 2008, per region.
Region Characteristics
Sand Loess Clay Peat All
Fertiliser use:
Farm level 237 228 236 237 236
Arable land2 180 194 151 181 175
Nitrogen from livestock manure
(kg N per ha) Grassland 253 249 255 237 250
Total plant-available
nitrogen1 Arable land2 121 129 131 120 124
(kg N per ha) Grassland 272 264 303 243 272
Total phosphate1 Arable land2 95 105 94 97 96
(kg P2O5 per ha) Grassland 95 94 91 90 93
1From livestock manure, other organic fertiliser and inorganic fertiliser. The quantity of plant-available nitrogen from
livestock manure and other organic fertiliser was calculated using the statutory availability coefficients determined for 2008.
2 Arable land on grassland farms is mainly used for the production of silage maize (mean 86%).
Crop yield and nutrient surpluses at farm level
For over 50% of the farms in the monitoring network, the grassland and silage maize yields were calculated according to the method described by Aarts et al (2008). On average, a yield of 180 kg nitrogen and 91 kg phosphate were estimated for silage maize and a yield of 262 kg nitrogen and 87 kg
phosphate were calculated for grassland (Table S.3). The mean nitrogen surplus on the soil surface balance in 2008 was calculated to be 196 kg per ha. This surplus decreases in the sequence peat >clay >sand >loess (Table S.3). The high surplus in the peat region was partly caused by a mean of 75 kg net nitrogen mineralisation per ha being included in the calculation, whereas in the other regions the net nitrogen mineralisation was negligible. The mean phosphate surplus on the soil surface balance is 16 kg P2O5per ha.
Table S.3 Mean estimated silage maize yield and calculated grassland yield on all farms that satisfied the selection criteria for applying the calculation method (Aarts et al, 2008) and nutrient surpluses on the soil surface balance on the farms in the derogation monitoring network in 2008, per region.
Region Characteristics
Sand Loess Clay Peat All Estimated yield silage maize1
kg N per ha 182 180 173 180
kg P2O5per ha 73 73 65 72
Calculated yield grassland1
kg N per ha 264 252 268 262
kg P2O5per ha 87 85 88 87
Nutrient surpluses per ha cultivated land
Nitrogen surplus on the soil surface balance (kg N
per ha) 174 157 216 246 196
Phosphate surplus on the soil surface balance
(kg 2O5 per ha) 15 14 16 18 16
1 The silage maize and grassland yields are based on 148 of the 284 farms. The number of farms in the loess region that
satisfied the selection criteria (6) was too low to be represented: these farms have therefore not been included in the mean. The other farms did not satisfy the selection criteria.
Comparison of agricultural practice for the years 2006, 2007 and 2008
The comparison of the results for the years 2006 to 2008 reveals that the milk productions per farm and per hectare have increased. There was also an associated increase in the production of livestock
manure, yet due to a greater export of livestock manure in particular, the use of livestock manure remained more or less the same.
However, the use of inorganic nitrogen and phosphate fertilisers decreased in 2008, which was probably due to the increased availability coefficient forfeit for livestock manure for the grazing of dairy cattle and the slightly stricter nitrogen application standards. This had little effect on the nitrogen surplus on the soil surface balance, partly due to the moderate intensification (more milk and more animals per hectare).
The phosphate application standards also became stricter in the years 2006 to 2008, which mainly resulted in less use of inorganic phosphate fertiliser. The mean phosphate surplus on the soil surface balance therefore decreased.
The estimated silage maize yield (kg N and P2O5 per ha) was lower in 2007 and 2008 compared to
2006. This decrease was not expressed in the dry matter yield. The estimated grassland yield (kg N and P2O5 per ha) in 2007 and 2008 was also lower than in 2006. However, the yield of dry matter in 2008
was higher than in the other two years, although this difference was not significant.
In conclusion, it can be stated that the tightening of the application standards in the years 2006 to 2008 resulted in a reduced application of inorganic fertiliser. Apparently this resulted in lower nitrogen and phosphorous levels in silage maize and grass; the yield of dry matter is not affected by this. The surplus
for nitrogen on the soil surface balance has not really changed in the years 2006 to 2008. However, the surplus for phosphorous did decrease during this period.
Report water quality for the measurement year 2008
The water quality measured in 2008 partly reflects the agricultural practices in the second year of derogation. The mean nitrate concentration in water leaching from the root zone in the sand region was 51 mg NO3 per litre in 2006 and 56 mg per litre in 2007 In the loess region the figures were 88 mg per
litre in 2006 and 68 mg per litre in 2007. In 2008 the average values were 43 mg NO3 per litre in the
sand region and 54 mg per litre in the loess region (see Table S.4). The mean nitrate concentration was higher in the sand and loess regions than in the other two regions, where the mean nitrate concentration was lower, just as in previous years.
Table S.4 Quality of the water leaching from the root zone on farms in the derogation monitoring network in 2008, expressed as mean nitrate concentration, total nitrogen and phosphorous (in mg/l) and the percentage of farms with a mean nitrate concentration higher than 50 mg per litre.
Region Characteristic
Sand Loess Clay Peat
Number of farms 155 20 56 57
Nitrate (NO3) (mg/l) 43 54 23 7
% Nitrate >50 mg/l 37 55 14 2
Nitrogen (N) (mg/l) 13.2 13.3 7.2 8.8
Phosphorus (P) (mg/l) 0.17 0.03 0.24 0.44
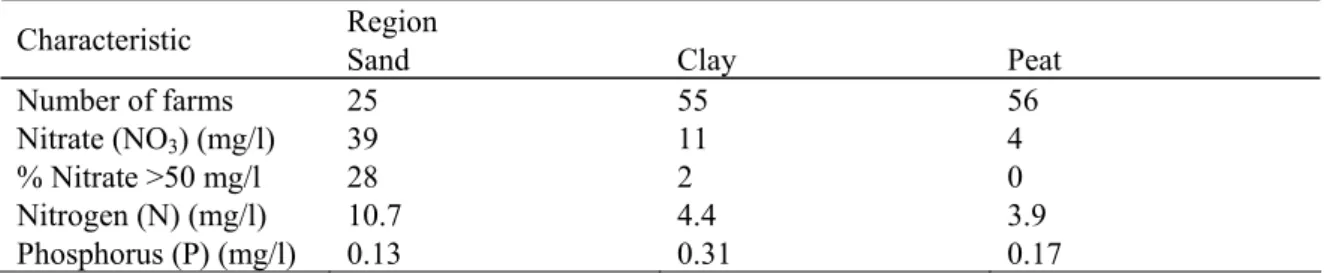
In the sand, clay and peat regions, the nitrate and total nitrogen concentrations in the ditch water were on average lower than in water leaching from the root zone (see Table S.5). In the sand and clay regions, the phosphorous concentrations in the ditch water were comparable to those in the water leaching from the root zone. In the peat region, the phosphorous concentrations in the ditch water were lower than in the water leaching from the root zone.
Table S.5 Quality of the ditch water on farms in the derogation monitoring network in 2008; mean nitrate concentration, total nitrogen and phosphorous (in mg/l) and the percentage of farms with an mean nitrate concentration higher than 50 mg per litre.
Region Characteristic
Sand Clay Peat
Number of farms 25 55 56
Nitrate (NO3) (mg/l) 39 11 4
% Nitrate >50 mg/l 28 2 0
Nitrogen (N) (mg/l) 10.7 4.4 3.9
Phosphorus (P) (mg/l) 0.13 0.31 0.17
Report water quality for the measurement year 2009, provisional results
The table below shows the provisional results for the water quality in 2009. These partly reflect agricultural practices in 2008 (third year of derogation). These can therefore be directly linked to the agricultural data that are also presented in this report. The final results for 2009 shall be included in the report for 2011 (it is not expected that these will strongly deviate from the provisional results).
Table S.6 Quality of the water leaching from the root zone on farms in the derogation monitoring network in 2009; mean nitrate concentration, total nitrogen and phosphorous (in mg/l) and the percentage of farms with a mean nitrate concentration higher than 50 mg per litre.
Region Characteristic
Sand Loess Clay Peat
Number of farms 154 0 58 58
Nitrate (NO3) (mg/l) 39 * 20 6
%Nitrate >50 mg/l 31 * 12 2
Nitrogen (N) (mg/l) 11.6 * 6.5 7.7
Phosphorus (P) (mg/l) 0.15 * 0.28 0.39
* Results from the loess region were not yet available when this report was written.
Table S.7 Quality of the ditch water on farms in the derogation monitoring network in 2009; mean nitrate concentration, total nitrogen and phosphorous (in mg/l) and the percentage of farms with a mean nitrate concentration higher than 50 mg per litre.
Region Characteristic
Sand Clay Peat
Number of farms 30 57 57
Nitrate (NO3) (mg/l) 26 9 4
%Nitrate >50 mg/l 20 0 0
Nitrogen (N) (mg/l) 7.7 4.1 4.2
Phosphorus (P) (mg/l) 0.10 0.32 0.22
Comparison of results from 2007, 2008 and 2009 with respect to the water quality
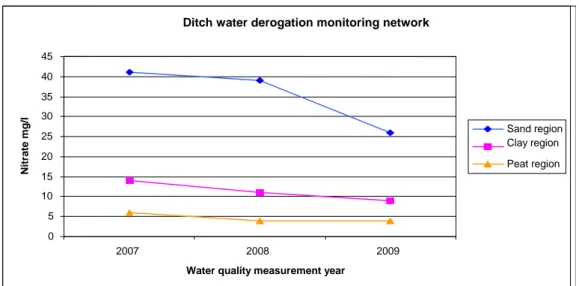
This is the first report in which results are available from several successive sampling years. The graphs below shows the results for nitrate leaching from the root zone and ditch water. In these graphs the nitrate concentrations measured are given. The figures below do not show any statistical
uncertainties as their purpose is to provide a visual impression of the trend in the concentrations.
Figure S.1 Illustration of the nitrogen concentrations in the ditch water in successive measurement years
Ditch water derogation monitoring network
0 5 10 15 20 25 30 35 40 45 2007 2008 2009
Water quality measurement year
Nit ra te m g /l Sand region Clay region Peat region
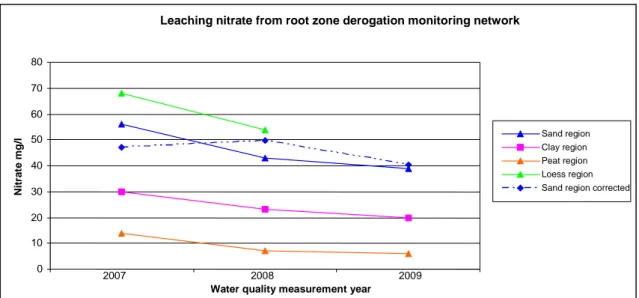
Leaching nitrate from root zone derogation monitoring network 0 10 20 30 40 50 60 70 80 2007 2008 2009
Water quality measurement year
N itr at e m g /l Sand region Clay region Peat region Loess region Sand region corrected In the graph below for the leaching from the root zone, the result for the sand region is also given with a correction for the precipitation effect. In this graph a decrease in the concentrations can be observed.
Figure S.2 Nitrogen concentrations in the ditch water in successive measurement years.
It is concluded that the majority of concentrations have not significantly changed. Where a decrease has been observed, this is probably associated with:
• a difference in precipitation surplus (nitrate and total nitrogen in the sand region); • a difference in hydrological conditions (supply ditch water in the peat region).
After correction for the precipitation effect, it was found that the concentrations in the sand region had decreased in 2009 compared to 2007 and 2008. However, it should be remembered that the results for 2009 are only provisional. In the report for 2011, the final concentrations shall be given and it will also be possible to see if this trend in the water quality has continued through 2010.
Effect of agricultural practice on water quality Nitrogen
The water quality measured in 2007 was influenced by the agricultural practices of 2006 and earlier years, etc. After correcting for the effects of weather conditions, no significant decrease in nitrate concentration is observed in the sand region between 2007 and 2008. This concurs with the unchanged nitrogen use in agriculture. In agricultural practice little has changed with respect to both the use of nitrogen and its removal with the crop. The use of nitrogen from livestock manure has not changed and that for inorganic nitrogen fertiliser has decreased somewhat. The removal of nitrogen via silage maize exhibits no clear trend and varies considerably over time. The removal was highest in 2006 and lowest in 2007. For grass there is also no trend in the removal of nitrogen with the crop. The nitrogen soil surface surplus exhibits no trend over time and does not differ significantly between years.
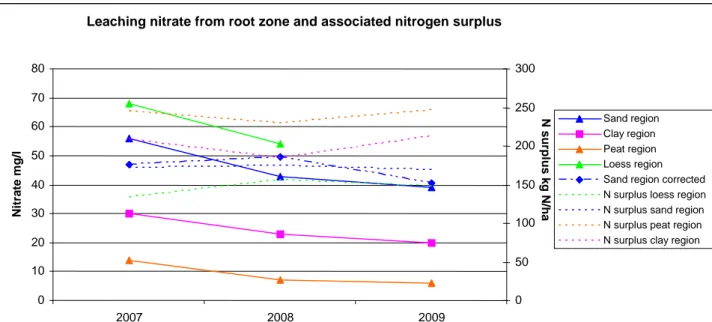
The decrease in the nitrate concentration between 2008 and 2009 cannot be adequately explained in terms of the developments in agricultural practice. The decrease in the nitrogen surplus is small, not significant and has also not been observed in all regions. This is illustrated in Figure S.3 with a trend line for both the agricultural practice and the water quality.
Figure S.3 Nitrate concentrations leaching from the root zone per soil type in successive measurement years combined with the nitrogen surplus from agricultural practice.
Phosphate
The phosphate surplus on the soil surface balance decreased in the measurement period. The effect of this decrease is not observed in the water quality. Here both small increases as well as decreases can be seen. The cause is possibly the strong binding of phosphate to the soil. The phosphorous concentration in the leaching water and the ditch water is therefore mainly determined by the hydrological conditions.
Leaching nitrate from root zone and associated nitrogen surplus
0 10 20 30 40 50 60 70 80 2007 2008 2009
Water quality measurment year
Ni trate m g /l 0 50 100 150 200 250 300 N surpl u s kg N/ ha Sand region Clay region Peat region Loess region Sand region corrected N surplus loess region N surplus sand region N surplus peat region N surplus clay region
1
Introduction
1.1
Background
The Nitrates Directive obliges Member States to limit the use of livestock manure to a maximum of 170 kg of nitrogen per ha per year. A Member State can, under certain conditions, ask the European Commission if it may deviate from this obligation (derogation). In December 2005, the European Commission issued the Netherlands with a definitive derogation decision under which grassland farms, cultivating at least 70% of their total area as grassland, were allowed to apply up to 250 kg of nitrogen per ha in the form of livestock manure that originates from grazing livestock (EU, 2005). The
derogation decision applies to the period 2006 to and including 2009. In return,the Dutch government is obliged to collect a wide range of data regarding the effects of the derogation and to report these annually to the European Commission.
One of the obligations of the derogation decision (see Appendix 1) concerns 'the setting-up of a monitoring network for the sampling of groundwater, soil moisture, drainage water and ditches on farms permitted an individual derogation' (Article 8 of the decision, para 2). The monitoring network must 'provide data on the nitrate and phosphorus concentrations in the water leaching from the root zone and ending up in the groundwater and surface water system' (Article 8, para 4). This monitoring network, which covers at least 300 farms, should be 'representative for all types of soil (clay, peat, sand, and loess), fertilisation practices and crop rotations' (Article 8, para 2). However, within the monitoring network, the monitoring of water quality on farms on sandy soils should be intensified (Article 8, para 5). The composition of the monitoring network should remain unchanged during the period (2006-2009) in which the decision applies (Article 8, para 2). During the negotiations with the European Commission it was agreed that the design of this monitoring network would tie in with the existing National Programme for Monitoring the Effectiveness of the Minerals Policy (LMM), under which the water quality and operational management of farms selected for this purpose has been monitored since 1992 (Fraters and Boumans, 2005). It was also agreed that participants in the LMM, who meet the conditions, could be regarded as participants in the monitoring network for the
derogation. Accordingly, the monitoring network for the derogation (the derogation monitoring network) has become part of the LMM. For the LMM the top metre of the phreatic groundwater, the soil moisture and/or the drainage water are sampled, as this is considered to sample the water leaching from the root zone (see Appendix 4).
Aside from the obligation to monitor, there is the requirement to report the evolution of the water quality. The report should be based on 'the monitoring of leaching from the root zone, the surface water quality and the groundwater quality, as well as on model-based calculations' (Article 10, para 1). Furthermore, an annual report must be submitted for the different soil types and crops regarding the fertilisation and yield on grassland farms with derogation, to provide the European Commission with an understanding of the management on these farms and the degree to which this has been optimised (Article 10, para 4). This report is intended to meet the aforementioned reporting requirements.
1.2
Previous reports
The first report (Fraters et al, 2007) was limited to a description of the derogation monitoring network, the progress made in 2006 in terms of setting-up this network, the design and content of the reports for the years 2008 to 2010, as well as a general description of the measurement and calculation methods to be used, and the models to be applied.
In 2008, the second report was published. This contained the first results from the derogation monitoring network (Fraters et al, 2008). The first year of derogation was 2006. The figures about agricultural practice related to farm practice under derogation. The water quality data from 2006 relate to the agricultural practice during 2005 and therefore are not yet related to farm practice under
derogation.
The third progress report was published in 2009; this contains the data from 2007 (Zwart et al, 2009). A brief comparison was also made between the results from 2006 and 2007, for which the caveat was made that 2006 was not a derogation year and so no series of measurements was available from which conclusions about trends could be drawn.
1.3
Content of this report
This is the fourth annual report about the results of the derogation monitoring network. Here we report on fertilisation with nitrogen and phosphate that is related to the acreage actually used as registered in the FADN (Farm Accountancy Data Network of the Agricultural Economics Research Institute). This acreage may deviate from the acreage recorded in the land registration system of the National Service for the Implementation of Regulations of LNV. In other words, land that administratively belongs to a farm but in practice is not used for fertilisation is not registered in the FADN but is, however,
registered in the plot registration system of National Service for the Implementation of Regulations of LNV. Relating the fertilisation to the actual acreage in use allows a better understanding of the relationship between agricultural practices and water quality. However, these data cannot be used to assess compliance with the legislation, since this requires the acreages as recorded by the National Service for the Implementation of Regulations. Furthermore, this fourth report reports on the crop yields.
Apart from water quality, fertilisation and crop yields, the nutrient surpluses of the farms in the derogation monitoring network are also reported, since these surpluses determine to a large extent the quantity of nutrients that could potentially leach from the soil.
This is the first year in which both the annual mean measured nitrate concentrations per region and the outcomes of the limited model calculation are included. The calculations quantify the influence of confounding factors on the measured nitrate concentrations. In particular, the nitrate concentration in water leaching from the root zone is affected not only by fertilisation but also by variations in the precipitation surplus (Boumans et al, 1997). A statistical model has been developed to analyse the effect of variations in the precipitation surplus on the nitrate concentration in the uppermost layer of groundwater (Boumans et al, 1997, 2001). This method also corrects for changes in the composition of the group of participating farms, the sample (Fraters et al, 2004). Participants sometimes have to be replaced during the course of the programme (see Chapter 2) or changes in the acreage of the
participating farms occur. As a result of this, the ratio between the soil types and/or drainage classes on the farms in the derogation monitoring network may change during the course of the programme. The
soil type (sand, loess, clay, peat) and the drainage class (poor, moderate, well drained) affect the relationship between the nitrogen surplus and the nitrate concentration measured. A change in the nitrate concentration measured could therefore be caused by a change in the composition of the group of participating farms or changes in the acreage within this group. Further details can be found under the description of the weather correction in Appendix 5 and the sample correction in Appendix 6. Chapter 2 contains a brief description of the design and realisation of the derogation monitoring network. It also details the agricultural characteristics of the participating farms and provides a description of how the water quality is sampled. An explanation of the modelling and analyses
performed is also given. Chapter 3 presents and discusses the measurement results of the monitoring in 2008. This chapter also contains the provisional results of the water quality monitoring for 2009. In Chapter 4 the changes since the implementation of the derogation are presented and discussed. The relevant articles from the derogation decision granted to the Netherlands by the European
Commission (EU, 2005) have been included in Appendix 1. Appendix 2 provides further details about the set-up of the derogation monitoring network. The other appendices provide a detailed justification concerning the registration of data for agricultural practice and the calculation of the fertilisation and the nitrogen and phosphate surpluses (Appendix 3) and how the quality of the water is measured (Appendix 4).Appendix 5 details the methodology applied for weather correction. Finally, Appendix 6 describes the methodology for calculating the evolution of water quality (sampling correction).
2
Design of the derogation monitoring network
2.1
Introduction
The design of the monitoring network must satisfy the requirements of the European Commission, as stipulated in the derogation decision of December 2005 and the extension of the derogation in 2009 (see Appendix 1).
Previous reports provided extensive details about the composition of the sample and the choices this entailed (Fraters et al 2007, Fraters and Boumans, 2005).
The setting up of the derogation monitoring network and the reporting of the results follows the
subdivision of the Netherlands into regions, as made in the Nitrate Directive Action Programme and the fertilisation legislation. In this respect four regions are distinguished: the sand region, the loess region, the clay region and the peat region. The acreage of agricultural land in the sand region constitutes about 47% of the approximately 1.95 million hectares of agricultural land in the Netherlands. The acreage of agricultural land in the loess region constitutes approximately 1.5%, in the clay region 39% and in the peat region 12% of the total agricultural acreage.
The sampling of the water quality for the measurement year 2008 was carried out during the winter of 2007/2008 in the Low Netherlands and in the summer and the rest of 2008 in the High Netherlands. The Low Netherlands covers the clay and peat regions, and those soils in the sand region that are drained via ditches, whether or not in combination with tile drainage or surface drains. The High Netherlands covers the other sand and loess soils. The sampling for determining the water quality for 2009 took place in the winter of 2008/2009 and in the summer of 2009 respectively. Water sampling took place on 300 farms in the derogation monitoring network. Farms that submitted an application for derogation but did not use it were not included in this report so as to ensure that the results concerning the effects of using derogation were not confounded. Consequently the number of farms reported on deviates from 300.
The water quality measured in 2008 partly reflects the agricultural practice of 2007 and the preceding years. To what extent agricultural practice in a previous year affects the water quality measured depends, amongst other things, on the level of and variation in the precipitation surplus in that year. The difference between the Low and High Netherlands is caused by the difference in hydrology. This difference in hydrology also explains the different sampling methods used in the Low and High Netherlands.
As previously stated, all data about agricultural practices relevant for the derogation were registered for all 300 derogation farms, according to the FADN system (Poppe, 2004). This report only includes data about the agricultural practices of farms that actually made use of the derogation. A description of the monitoring of the agricultural characteristics and the methods of calculation of the fertilisation and the nutrient surpluses can be found in Appendix 3. The water sampling on the farms was carried out in accordance with the standard LMM procedures (Fraters et al, 2004). This sampling method is explained in Appendix 4.
2.2
Design and realisation of the sample
2.2.1
Number of farms in 2008
The derogation monitoring network is a permanent monitoring network. However, the loss of a number of farms is unavoidable. Farms can drop out because:
• at the end of the year they indicate that they do not use the derogation;
• they no longer participate in the LMM because the farm has been sold or because cultivated land is no longer used or because of administrative problems.
Furthermore, although a farm may have been processed in the FADN, it may have proved impossible to fully describe the nutrient flows. This could have been due to the presence of animals from other owners, as a result of which the import and export of feed, animals and manure are, by definition, not complete or because of administrative errors in the registration of imports and/or, exports.
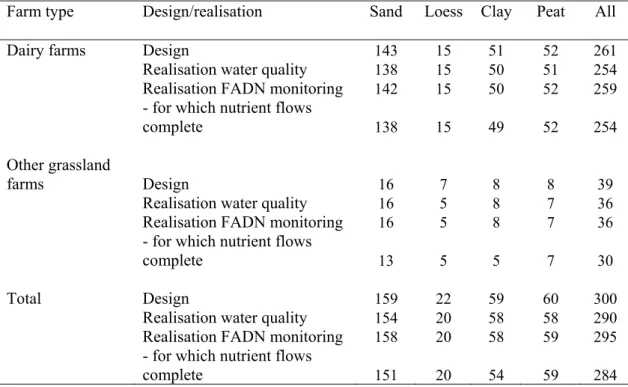
Table 2.1 shows the planned and actual number of farms in the derogation monitoring network for 2008, per region (sand, loess, clay and peat) and farm type (dairy farms versus other grassland farms). Table 2.1 Planned (design) and realised (realisation) number of dairy and other grassland farms per region in 2008.
Farm type Design/realisation Sand Loess Clay Peat All
Dairy farms Design 143 15 51 52 261
Realisation water quality 138 15 50 51 254
Realisation FADN monitoring 142 15 50 52 259
- for which nutrient flows
complete 138 15 49 52 254
Other grassland
farms Design 16 7 8 8 39
Realisation water quality 16 5 8 7 36
Realisation FADN monitoring 16 5 8 7 36
- for which nutrient flows
complete 13 5 5 7 30
Total Design 159 22 59 60 300
Realisation water quality 154 20 58 58 290
Realisation FADN monitoring 158 20 58 59 295
- for which nutrient flows
complete 151 20 54 59 284
Eight of the farms that had participated in FADN in 2007, no longer did so in 2008. These farms were therefore replaced.
In the various sections of this report the following numbers of farms are reported on:
• the description of general farm characteristics (Section 2.3) concerns all farms that could be processed in FADN in 2008 and that made use of the derogation (= 295);
• the description of agricultural practices in 2008 (Section 3.1) concerns all farms for which the nutrient flows in 2008 could be fully completed in FADN (= 284).
The comparison of agricultural practice between 2006, 2007 and 2008 (Section 4.1) concerns all farms that participated in the monitoring network in all three years (274 farms). For 261 of these farms the nutrient flows could be fully recorded in FADN for all three years.
2.2.2
Representativeness of the sample
The sample population covers 86.7% of the farms and 96.7% of the acreage of all farms that registered for derogation in 2008 and which satisfied the LMM selection criteria (the sample population,
Appendix 2). With an area of 15,184 ha, 1.8% of the national acreage of the total sample population has been included in the sample (see Table 2.2).
Table 2.2 Area cultivated land (in ha) in the derogation monitoring network compared to the total area of cultivated land of farms with derogation in 2008 in the sample population, according to the Agricultural Census 2008.
Region Farm type Sample population1 Derogation monitoring network
Acreage in ha Acreage in ha
% of acreage sample population
Sand Dairy farms 373,250 6820 1.8%
Other grassland farms 51,318 523 1.0%
Total 424,569 7342 1.7%
Loess Dairy farms 4803 775 16.1%
Other grassland farms 1432 220 15.4%
Total 6235 995 16.0%
Clay Dairy farms 204,800 3144 1.5%
Other grassland farms 29,843 241 0.8%
Total 234,642 3385 1.4%
Peat Dairy farms 163,617 3298 2.0%
Other grassland farms 17,835 165 0.9%
Total 181,453 3462 1.9%
All Dairy farms 746,470 14,036 1.9%
Other grassland farms 100,428 1148 1.1%
Total 846,898 15,184 1.8%
1 Estimate based on Statistics Netherlands Agricultural Census 2008, processed by LEI Further information about how the sample population was defined can be found in Appendix 2.
A minimum number of farms is needed to be able to make a well-founded statement per region. For loess that minimum has been set at fifteen. The loess region is relatively small and therefore it does not have many derogation farms in the sample population, as a result of which a relatively large number of farms are included in the monitoring network (16.0%). Furthermore, in all regions the dairy farms are more strongly represented in the acreage than the other grassland farms. This is because during the
selection and acquisition process the desired number of farms in the sample per farm type is derived from the share in the total acreage of cultivated ground, whereas the other grassland farms included were on average smaller than the dairy farms in terms of the acreage of cultivated land.
2.3
Description of the farms in the sample
Table 2.3 provides a number of descriptive characteristics of the farms in the derogation monitoring network. This table contains data from all farms in the derogation monitoring network for which the registration in FADN has been fully processed. For comparative purposes, the data from farms in the Agricultural Census 2008 (sample population) have also been included.
Table 2.3 Description of a number of general farm characteristics in 2008 of the farms in the derogation monitoring network (DM) compared to the mean of the sample population (LBT)1.
Farm characteristic3 Population Sand Loess Clay Peat All
Total number of farms: 158 20 58 59 295
Area grassland (ha) DM 36.2 34.3 45.3 52.0 41.0
LBT 30.2 28.8 41.6 41.0 35.1
Area silage maize (ha) DM 9.3 12.4 9.6 6.4 9.0
LBT 7.9 7.6 5.9 4.1 6.7
Area other arable land (ha) DM 0.9 3.1 3.4 0.3 1.5
LBT 0.7 2.1 1.4 0.4 0.8
Total area cultivated land (ha) DM 46.5 49.7 58.4 58.7 51.5
LBT 38.8 38.5 48.9 45.6 42.6
Percentage grassland DM 80 72 81 91 82
LBT 79 76 86 92 83
Area natural habitat (ha) DM 0.5 2.8 1.7 0.5 0.9
LBT 0.4 0.4 0.7 0.5 0.5
Stocking density grazing livestock
(GVE2/ha) DM 2.22 1.99 2.24 2.02 2.17
LBT 2.19 1.95 1.97 1.86 2.07
Percentage farms with intensive
livestock farming DM 16 20 14 14 15
LBT 15 5 6 4 11
Specification livestock density derogation monitoring network (GVE per ha)
Dairy cattle (including young stock) DM 2.12 1.67 2.06 1.88 2.03
Other grazing livestock DM 0.10 0.32 0.19 0.14 0.14
Total intensive livestock DM 0.67 0.08 0.71 0.27 0.56
Total all animals DM 2.89 2.07 2.95 2.29 2.73
Source: Statistics Netherlands Agricultural Census 2008, processed by LEI and Informatienet
1DM = Farms in the derogation monitoring network 2008, LBT = Sample population based on Agricultural Census
2008 (Data Statistics Netherlands (CBS), processed by LEI)
2 GVE = Livestock Unit, this is a comparative standard for animal numbers based on the phosphate production forfeit
(phosphate production forfeit dairy cow = 1 GVE).
An examination of the agricultural characteristics of the sample population in comparison with the farms from the agricultural census (see Table 2.3) reveals the following differences:
• the mean acreage of cultivated land of the sampled farms is larger than that of the farms in the sample population (51.5 versus 42.6 hectares). This applies to all regions;
• on average an additional 0.9 ha of natural habitat is under farm management. This area is not included in the calculation of the environmental pressure per hectare of cultivated land (fertilisation, surpluses and the like);
• for the farms sampled, 82% of the acreage is grassland and this is comparable to the mean of the sample population. On the farms sampled in the loess and clay regions, the percentage of grassland is slightly lower than in the sample population;
• on the farms sampled, a mean of 86% of the arable land is used for silage maize (9.0ha silage maize divided by 10.5 ha of arable land in total);
• in all regions, the livestock density of grazing livestock on the farms sampled is higher than the mean of the sample population;
• on 15% of the farms in the derogation monitoring network, intensive livestock farming as well as grazing livestock are present. In all regions, the percentage of farms in the derogation monitoring network with intensive livestock farming is higher than in the sample population. The presence of intensive livestock farming was not a criterion during the stratification process;
• dairy cattle and the associated young stock constitute almost 93% of the grazing livestock present. The group other grazing livestock consists of beef cattle, sheep, goats, horses and ponies;
• the presence of larger numbers of animals under intensive livestock farming on the sampled farms compared to the sample population gives rise to a considerably higher mean total stock density in all regions except for the loess region. The loess region has the lowest stock density in terms of dairy cattle and the associated young stock and the highest stock density for other grazing animals. These differences between the agricultural census and the sample population are not such that the sample is disqualified.
Table 2.4 provides a more detailed description of dairy farms in the derogation monitoring network. As the correct comparative material was not present in the Agricultural Census, this table contains for comparative purposes the weighted mean of the national sample from the Farm Accountancy Data Network (FADN). This table shows that in all regions the dairy farms have a higher acreage and higher milk production than the weighted national mean.
Table 2.4 Mean milk production and grazing on dairy farms in the derogation monitoring network (DM) compared to the weighted mean of dairy farms in the national sample (FADN).
Farm characteristic Population Sand Loess Clay Peat All
Total number of farms
in DM: 142 15 50 52 259 DM 699,200 642,800 882,500 909,300 773,500 kg FPCM1 per farm FADN 600,600 354,000 756,800 710,400 643,300 DM 15,400 13,200 15,500 14,000 15,000 kg FPCM per ha forage crop FADN 14,700 12,700 14,200 13,400 14,300 DM 8430 8100 8600 8200 8400 kg FPCM per dairy cow FADN 8450 7500 8400 8200 8400 DM 85 100 82 87 86
Percentage farms with
grazing FADN 79 100 88 87 83
1FPCM= Fat and Protein Corrected Milk. This is a standard used for comparing milk with different fat and
Table 2.4 specifically reveals the following:
• with more than 15,000 kg FPCM, the mean milk production per ha of forage crop is higher than the national mean. In each of the regions the milk production per hectare of forage crop on the farms sampled is higher than the weighted national mean;
• on the farms sampled, the mean milk production per dairy cow present is slightly higher than the national mean;
• grazing takes place on 86% of the dairy farms sampled. For farms in the derogation monitoring network this percentage is slightly higher than the national mean.
2.4
Monitoring of water quality
2.4.1
Sampling at farms
In the measurement year 2008, water quality was sampled at 288 farms participating in the derogation monitoring network that actually used derogation (see Table 2.5 and Figure 2.1). In 2009, 290
derogation farms were sampled. This concerned the sampling of groundwater, drain water or soil moisture. On the participating farms in the Low Netherlands, the ditch water on the farms was also sampled. The number of farms sampled per region in this period is listed in Tables 2.5 and 2.6. The mean sampling frequency is also indicated. This frequency was lower than intended due to drought (drains did not produce water) and problems in the realisation. These last-mentioned problems have now been dealt with by means of new contracts (2008) and a change in the contractor (2009); the result is demonstrated in the higher sampling frequency in 2008 and 2009 compared to 2007.
Table 2.5 Number of sampled farms registered for derogation per subprogramme and per region for 2008 and the sampling frequency of the leaching water (L) and ditch water (DW). The desired sampling frequency is stated between parentheses.
Year Sand region
All farms Of which drained Loess region Clay region Peat region
2008 155 25 20 56 57
L rounds 1 (1) (-) 1 (1) 2 (2) 1 (1)
DW rounds - (-) 3.7 (4) - (-) 2.9 (4) 3.9 (4)
Table 2.6 Number of sampled farms registered for derogation per subprogramme and per region for 2009 and the sampling frequency of the leaching water (L) and ditch water (DW). The desired sampling frequency is stated between parentheses.
Year Sand region
All farms Of which drained Loess region Clay region Peat region
2009 154 30 20* 58 58
L rounds 1 (1) - (-) 1 (1) 2 (2) 1 (1)
DW rounds - (-) 3.8 (4) - (-) 3.9 (4) 4.0 (4)
* In the loess region 20 farms were sampled in the period October 2009 to February 2010. The results of this sampling were not yet known when this report was compiled.
The water quality sampling in 2008 took place in the period November 2007 to February 2009. The water quality sampling in 2009 took place in the period October 2008 to February 2010. The figures for the water quality in the loess region, sampled from October 2009 to February 2010, are not yet
available. The two new farms in this region were sampled in April 2010 as the addresses and consent for these farms were not available any earlier.
The sampling period per region is indicated in Table 2.7.In addition to this, the sampling in the loess region for 2008 and 2009 was continued in January and February of the following year, as the sampling there was delayed due to frost. A detailed description of the sampling method per region is provided in Appendix 4.
Table 2.7 Sampling periods for the water quality 2008 and 2009 per region and programme, in the period October 2007 to October 2009. Contains water quality data from the FADN collection 2007 (green) and FADN collection 2008 (yellow)
In this report the water quality data for FADN-year 2008 are still provisional. The final figures will be reported in 2011. Then the data from the loess region for 2009 will also be complete and final.
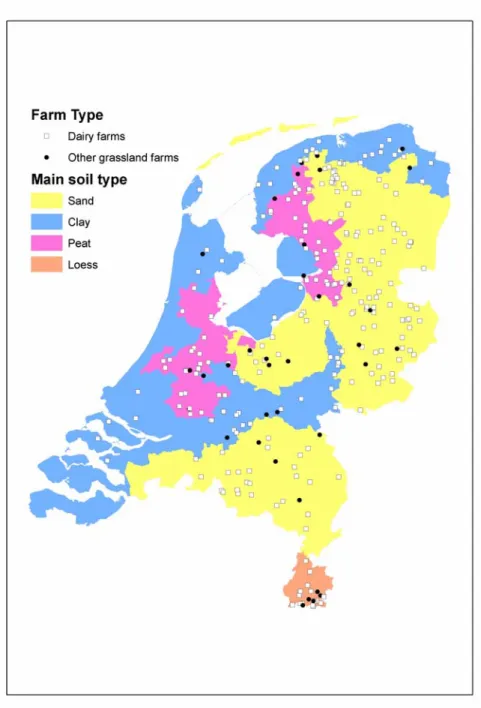
Figure 2.1 shows the distribution of the sampled farms over the main soil type regions. A distinction is also made between dairy farms and other grassland farms. The distribution clearly shows that the derogation monitoring network is focussed on the sand region.
Mon th 8 9 10 11 12 1 2 3 4 5 6 7 8 9 10 11 12 1 2 3 4 5 6 7 8 9 10 11 12 1 2 3 4 5
FADN col l e cti on Sand re gi on Low NL C l ay Pe at Sand re gi on hi gh and l ow Loe ss De rogati on re port 2010
reported in 2009 as provisional data; made f inal in current report new data, f inal in this report
in current report presented as provisional data
programme ongoing at time of reporting; not included in current report
6
Figure 2.1 Location of the 288 grassland farms participating in the water sampling for the derogation monitoring network in 2008.
The soil and drainage characteristics of the farms concerned are given per region in Table 2.8 for 2008 and Table 2.9 for 2009. The tables reveal that within a region, other soil types occur in addition to the main soil type after which the region is named. By nature, the loess region primarily consists of well-drained soils and the peat region chiefly contains poorly-well-drained soils.
Table 2.8 Soil type and drainage class (in percentages) per main soil type region on derogation farms sampled in 2008
Soil types Drainage class 1
Region
Sand Loess Clay Peat Poor Moderate Good
Sand 81 0 11 8 41 48 10
Loess 1 71 28 0 2 3 96
Clay 15 0 82 3 41 53 6
Peat 12 0 37 51 89 10 0
Table 2.9 Soil type and drainage class (in percentages) per main soil type region on derogation farms sampled in 2009
Soil types Drainage class 1
Region
Sand Loess Clay Peat Poor Moderate Good
Sand 81 0 11 9 41 48 10
Loess * * * * * * *
Clay 14 0 83 3 40 55 6
Peat 12 0 37 50 89 10 0
1 The drainage classes are linked to the groundwater regime classes. The class of naturally poorly draining soils contains Gt I to Gt IV, the class of moderately draining soils Gt V, V* and VI, and the class well draining soils Gt VII and Gt VIII.
* Results from the loess region were not yet available when this report was prepared.
2.4.2
Chemical analyses and calculations
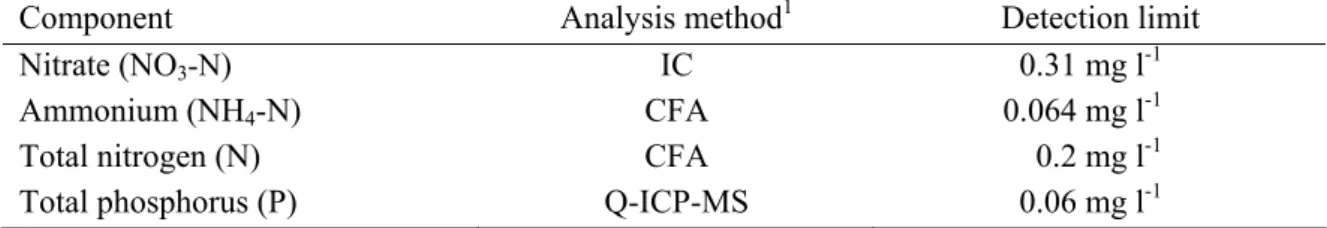
The chemical analyses of the water samples were carried out in the accredited analytical laboratory of RIVM. Table 2.10 provides an overview of the methods used for the different components. Further details can be found in Wattel-Koekoek et al (2008).
Table 2.10 Components analysed with analysis method and detection limit.
Component Analysis method1 Detection limit
Nitrate (NO3-N) IC 0.31 mg l-1
Ammonium (NH4-N) CFA 0.064 mg l-1
Total nitrogen (N) CFA 0.2 mg l-1
Total phosphorus (P) Q-ICP-MS 0.06 mg l-1
1 Q-ICP-MS : Quadruple inductively coupled plasma mass spectrometry.
IC : Ion chromatography. CFA : Continuous flow analyser.
For each farm an annual mean concentration per component was calculated. For this calculation, observations with a concentration lower than the detection limit were assigned a value of 0. Consequently, calculated mean farm concentrations may result in values below the detection limit.
3
Results for 2008
3.1
Agricultural characteristics
3.1.1
Nitrogen use via livestock manure
Table 3.1 details the use of nitrogen from livestock manure on farms in the derogation monitoring network in 2008. For most of the farms, the manure production was calculated by means of forfeit standards. However, dairy farmers could also choose to deviate from these standards and to calculate a farm-specific manure production using the so-called Guidance (LNV, 2009b). This farm-specific manure production was adopted for dairy farms that indicated they were using the so-called Guidance (and who also benefited from this) and for which all of the necessary data were available (N = 41). On all other farms (N = 243) forfeits were used to determine the manure production. A more detailed explanation of the farm-specific and forfeit calculation methods for manure use is provided in Appendix 3.
Table 3.1 Mean nitrogen use via livestock manure (in kg N per ha) in 2008 on farms in the derogation monitoring network. Means per region.
Description Sand Loess Clay Peat All
Number of farms 151 20 54 59 284
Use livestock manure
Produced on farm* 270 224 278 252 265
- export 37 14 42 23 34
- stock mutation -8 -4 -6 -5 -7
+ import 12 22 7 14 12
Total 237 228 236 237 236
Application standard livestock
manure 246 237 248 245 245
Use on arable land** 180 194 151 181 175
Use on grassland** 253 249 255 237 250
* Calculated on the basis of forfeit standards with the exception of dairy farms that indicated they were using the Guidance farm-specific excretion diary cattle (see Appendix 3).
** The mean use and the application standards on grassland and arable land are based on 275 farms and 208 farms respectively instead of 284 farms, as on 9 farms the allocation of fertilisers to arable land and grassland did not fall within the confidence intervals and because 68 farms had no arable land.
The following conclusions can be drawn from Table 3.1:
• at 245 kg per ha, the mean application standard for livestock manure was below the derogation standard of 250 kg N from grazing livestock manure because:
- a number of farms had only applied for derogation on a part of their acreage;
- a number of farms also applied livestock manure from intensive livestock farming for which a standard of 170 kg per ha applies;
• the mean use of nitrogen from livestock manure (236 kg per ha) was several kilograms under the mean application standard;
• the use of nitrogen from livestock manure decreased in the order clay >sand >peat >loess; • the use of nitrogen from livestock manure on arable land (mainly silage maize) was considerably
lower in all regions than the use on grassland.
The farms in the monitoring network imported and exported livestock manure. As the production was generally higher than the use permitted, the export of manure was on average higher than the import of manure. This applied to all regions. Table 3.2 provides a more detailed explanation of the import and export of livestock manure on the farms in the derogation monitoring network.
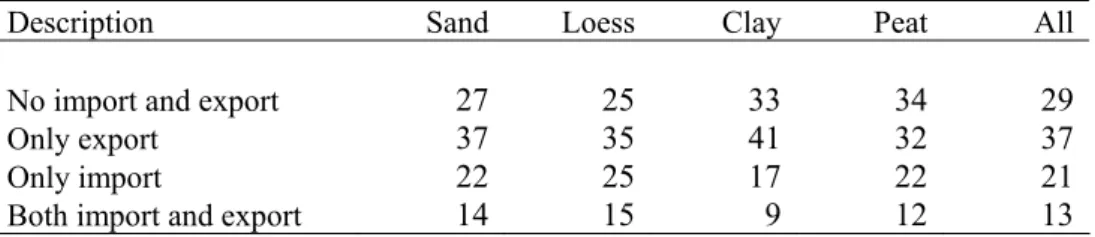
Table 3.2 Percentage of farms in the derogation monitoring network that imported and/or exported livestock manure in 2008. Means per region.
Description Sand Loess Clay Peat All
No import and export 27 25 33 34 29
Only export 37 35 41 32 37
Only import 22 25 17 22 21
Both import and export 14 15 9 12 13
Table 3.2 shows that on 29% of the farms there was no import or export of manure. On 37% of the farms manure was only exported, whereas on 21% of the farms manure was only imported. This manure import can be explained by the fact that the purchase of nutrients via livestock manure in 2008 had a clear economic benefit compared to inorganic fertiliser. On 13% of the farms, manure was both imported and exported.
3.1.2
Fertiliser use compared to the application standards
Tables 3.3 and 3.4 detail the calculated use of plant-available nitrogen and phosphate from fertilisers. The quantity of plant-available nitrogen from livestock manure is calculated by multiplying the quantity of nitrogen in the livestock manure used (produced on own farm or imported, see Table 3.1) by the prevailing statutory plant-availability coefficients relevant to the specific situation (see Appendix 3). These tables also contain the mean application standards per ha for arable land (mainly maize acreage) and grassland to allow a comparison of fertiliser use. These mean application standards are based on the acreage of cultivated crops and the soil type classifications as registered in the FADN and the statutory application standards determined for 2008 (Dienst Regelingen, 2006).
The following conclusions can be drawn from Table 3.3:
• The calculated total (plant-available) nitrogen use was lower than the application standard in all regions on both grassland and arable land. This was partly because 86% of the dairy farms used grazing (Table 2.4) as a result of which a lower statutory nitrogen availability coefficient (45% in 2008) could be used.
• In the clay region, the total (plant-available) nitrogen use was higher than in the other regions due to a higher use of inorganic fertiliser. Also the nitrogen application standards are higher on the clay soils than on other soils.
• In the loess region, the total (plant-available) nitrogen use was lower than in the other regions due to a lower use of both livestock manure and inorganic fertiliser.
• In all regions, the nitrogen fertilisation on arable land, which mostly consists of silage maize, was considerably lower than the nitrogen fertilisation on grassland.
• In the peat region, the calculated nitrogen fertilisation on grassland was lower than on the other soil types. But from the perspective of the entire farm, the nitrogen fertilisation in the peat region was on average higher than for farms in the loess region and almost equal to farms in the sand region. This is explained by the fact that grassland in the peat region had a greater share of the crop
rotation (Table 2.3) and that the calculated nitrogen fertilisation on grassland was higher than on arable land.
Table 3.3 Mean nitrogen use from fertilisers (in kg plant-available N per ha)* on farms in the derogation monitoring network in 2008. Means per region.
Description Category Sand Loess Clay Peat All
Number of farms 151 20 54 59 284
Mean statutory availability coefficient from livestock manure
50.2% 50.1% 50.6% 49.7% 50.2%
Fertiliser use: Livestock manure 119 114 119 117 118
Other organic fertiliser 0 0 0 0 0
Inorganic fertiliser 118 104 154 116 124
Total mean 237 218 274 234 242
Use of plant-available nitrogen on arable
land** 121 129 131 120 124
Application standard arable land** 156 163 165 157 158
Use of plant-available nitrogen on
grassland** 272 264 303 243 272
Application standard on grassland** 290 280 324 297 298
* Calculated according to the prevailing statutory availability coefficients (see Appendix 3)
** The mean use and the application standards on grassland and arable land are based on 275 and 208 farms respectively instead of 284 farms, as on 9 farms the allocation of fertilisers to arable land and grassland did not fall within the confidence intervals and because 68 farms had no arable land.
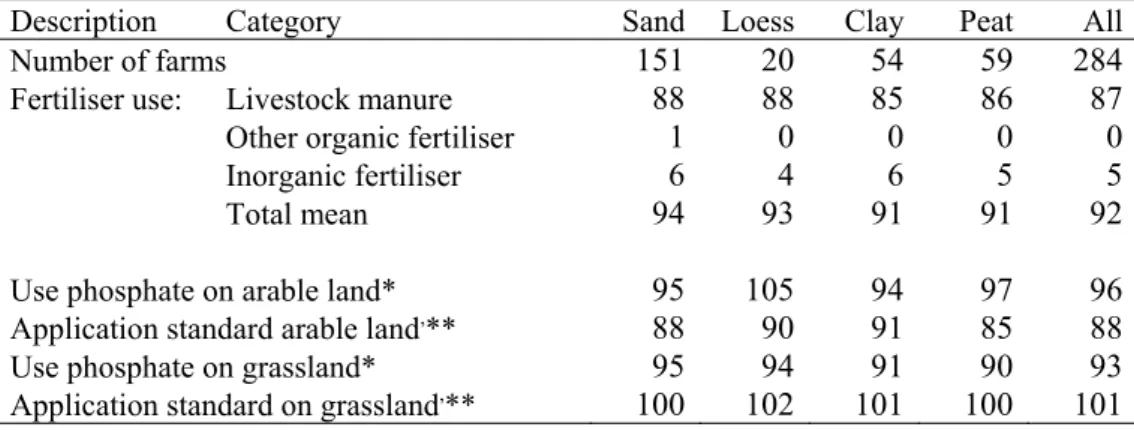
The following conclusions can be drawn from Table 3.4:
• In the sand and loess regions more phosphate was applied in the form of fertiliser than in the clay and peat regions.
• At a mean of 93 kg, the phosphate use on grassland was lower than the application standard of 101 kg on grassland. This was the case in all regions.
• However, at 96 kg per ha, the use of phosphate on arable land was higher than the application standard of 88 kg phosphate per ha. This was the case in all regions.
• On average 95% of the phosphate was applied via livestock manure.
Table 3.4 Mean phosphate use from fertilisers (in kg P2O5 per ha) in 2008 on farms in the derogation monitoring network. Means per region.
Description Category Sand Loess Clay Peat All
Number of farms 151 20 54 59 284
Fertiliser use: Livestock manure 88 88 85 86 87
Other organic fertiliser 1 0 0 0 0
Inorganic fertiliser 6 4 6 5 5
Total mean 94 93 91 91 92
Use phosphate on arable land* 95 105 94 97 96
Application standard arable land,** 88 90 91 85 88
Use phosphate on grassland* 95 94 91 90 93
* The mean use and the application standards on grassland and arable land are based on 275 and 208 farms
respectively instead of 284 farms, as on 9 farms the allocation of fertilisers to arable land and grassland did not fall within the confidence intervals and because 68 farms had no arable land.
** The mean phosphate application standard on grassland was over 100 kg per ha and on arable land over 85 kg per ha because a small proportion of the plots are phosphate poor or phosphate fixating. On these plots a phosphate application standard of 160 kg per ha was used.
3.1.3
Crop yields
Table 3.5 shows the mean crop yield, estimated for silage maize and calculated for grassland, on the farms in the derogation monitoring network that satisfied the criteria for applying the calculation method for crop yield. This calculation method is derived from Aarts et al (2008). In this method the yield from silage maize is estimated by measuring the quantity of ensilaged silage maize. The grass yield is calculated as the difference between the energy requirement of the cattle herd on the one hand and the energy uptake from farm-grown silage maize (and forage crops other than grass) and purchased feed on the other hand. Further information about this method is provided in Appendix 3.
The loess region is not included in Table 3.5 because the number of available farms in the loess region for crop yields was below the minimum required number of farms for which outcomes from FADN may be published. Therefore the loess farms have also been omitted from the total means in the last column of Table 3.5 Table 3.5 shows that:
• the mean estimated dry matter yield for silage maize was more than 15,000 kg per ha. The yield in the peat region was less than 15,000 kg dry matter per hectare and in the other regions it was higher than this;
• per hectare an estimated mean of 180 kg N and 40 kg P (91 kg P2O5) were harvested in the form of
silage maize;
• at 9500 kg per ha, the calculated grassland yield of dry matter was considerably lower than the estimated silage maize yield. However, as grass products have higher N and P levels than silage maize, the N yield per ha was higher and the P yield per ha was about the same;
• the calculated grassland yields were highest in the peat region and lowest in the clay region. Table 3.5 Mean crop yield (in kg dry matter, N, P and P2O5 per ha) for silage maize (estimated) and grassland (calculated) in 2008 on farms in the derogation monitoring network that satisfied the criteria for using the calculation method (Aarts et al, 2008). Means per region.
Category Sand Clay Peat All
Yields silage maize
Number of farms 77 26 17 120
kg dry matter per ha 15,500 15,500 14,500 15,400
kg N per ha 182 180 173 180
kg P per ha 32 32 29 31
kg P2O5 per ha 73 73 65 91
Yields grassland
Number of farms 88 32 28 148
kg dry matter per ha 9500 9400 9700 9500
kg N per ha 264 252 268 262
kg P per ha 38 37 38 38