PBL Netherlands Environmental Assessment Agency Mailing address PO Box 30314 2500 GH The Hague The Netherlands Visiting address Oranjebuitensingel 6 2511VE The Hague T +31 (0)70 3288700 www.pbl.nl/en December 2013
Guidance for uncertainty
assessment and
communication
GUIDANCE FOR UNCERTAINTY
ASSESSMENT AND COMMUNICATION
Second Edition
This document is the second edition of the Guidance for Uncertainty Assessment and
Communication. The Guidance has been developed under the direction of Arthur Petersen and Peter Janssen (PBL Netherlands Environmental Assessment Agency) and Jeroen van der Sluijs (Utrecht University) as part of the strategic research project on uncertainty analysis, transparency and communication.
This second edition comprises a revised version of the Mini-Checklist and Quickscan
Questionnaire, merged with a concise version of the associated Quickscan Hints & Action List from the first edition of the Guidance for Uncertainty Assessment and Communication series. A web application of the Guidance is available from http://leidraad.pbl.nl
The following volumes have been published in this series (the numbering of the volumes is conform the first edition):
1. Guidance for Uncertainty Assessment and Communication, A.C. Petersen, P.H.M. Janssen, J.P. van der Sluijs, J.S. Risbey, J.R. Ravetz, J.A. Wardekker, H. Martinson Hughes, 2nd Edition, PBL, 2013.
replacing
1.a Mini-Checklist & Quickscan Questionnaire, A.C. Petersen, P.H.M. Janssen, J.P. van der Sluijs , J.S. Risbey, J.R. Ravetz,
1st Edition, RIVM/MNP, 2003.
1.b Quickscan Hints & Actions List, P.H.M. Janssen, A.C. Petersen, J.P. van der Sluijs, J.S. Risbey, J.R. Ravetz,
1st Edition, RIVM/MNP, 2003.
3. Detailed Guidance, J.P. van der Sluijs, J.S. Risbey, P. Kloprogge, J.R. Ravetz,
S.O. Funtowicz, S. Corral Quintana, Â. Guimarães Pereira, B. De Marchi, A.C. Petersen, P.H.M. Janssen, R. Hoppe, S.W.F. Huijs, Utrecht University, 2003.
4. Tool Catalogue for Uncertainty Assessment, J.P. van der Sluijs, J.S. Risbey , P.H.M. Janssen, A.C. Petersen, P. Kloprogge, J.S. Risbey, W. Tuinstra, J.R. Ravetz, Utrecht University, 2004.
5. Checklist for uncertainty in spatial information and visualising spatial uncertainty, H. Visser, A.C. Petersen, A.H.W. Beusen, P.S.C. Heuberger, P.H.M. Janssen, MNP, 2006.
6. Guide for Uncertainty Communication, J.A. Wardekker, P. Kloprogge, A.C. Petersen, P.H.M. Janssen, J.P. van der Sluijs, PBL, 2013.
7. Uncertainty Communication: Issues and Good Practice, P. Kloprogge, J.P. van der Sluijs, J.A. Wardekker, Utrecht University, 2007.
Contents
Introduction to the Guidance 4 Components of the Guidance 6 Details per component 6Mini-Checklist - Uncertainty Evaluation 8 Quickscan Questionnaire 10
Question 1. How is the problem framed; which contextual factors are included/excluded? 10
Question 2. What are the main parties (stakeholders/actors) involved; what are their views, roles, stakes and involvement with respect to the problem, and what would be the added value of involving certain stakeholders in the study? 12
Question 3. What are the main indicators/visualisations used in this study and how do these relate to the problem definition? 14
Question 4. How adequate is the knowledge base that is available for the study? 15 Question 5. What are the uncertainties relevant to this problem and what is their
nature and location? 16
Question 6. How is uncertainty information communicated? 20 References 22
Annexes 24
Annex I: Additional Information on the Guidance 24
Annex II: Advice on the Use of the Uncertainty Matrix and the Tool Catalogue 26 Annex III: Uncertainty Matrix and Typology of Uncertainties 27
Introduction to the
Guidance
Without adequate attention for the implications of uncertainty, there is a risk of compromising the credibility of your research and/or study. We acknowledge that uncertainty evaluation and communication can be a challenge for policy assessors and policy report writers. This Guidance is intended as an instrument to guide you in this area, in order for you to reach thorough conclusions that reflect the underlying uncertainties and provide complete transparency.
This Guidance addresses the many aspects of the broad issues of uncertainty assessment and communication. After identifying the most critical uncertainties, it provides information on how to manage the choices to be made relating to these issues. We encourage you to reflect on the choices that need to be made during all phases of the study, which will lead to a better foundation for these choices and hence to an improved management of uncertainties.
The Guidance focuses on the following important issues which have to be addressed when performing a study:
q How to frame the problem studied?
q Who to involve in studying the problem, and to which degree? q How are central aspects of the problem indicated?
q Is the knowledge base sufficiently large? q What are the relevant uncertainties?
q How to communicate uncertainty information?
5
Introduction to the Guidance | explicitly deal with analysing and communicating these uncertainties. The Guidance indicates any difficulties that could potentially impede the management of uncertainties and, as a result, the areas that require additional effort will become apparent. The Guidance also provides advice on the methods and tools for managing uncertainties and on how to communicate them. Target audiences in this respect may include researchers, stakeholders, the general public, and the study’s end user(s). The end users may be the client(s) who have commissioned the study or those that form the main target audience; their view on the research issues or problems warrants specific attention, as the study is intended to shed light on these issues.
The Guidance can be used during all phases of a given project. At the start of a project, you can use it to design and elaborate how uncertainty should be dealt with during the project. During a project, the Guidance can be used when performing an uncertainty assessment and to communicate the results. At the conclusion of a project, it can be used in the process of project review and evaluation.
Components of the
Guidance
The complete Guidance consists of many components to support the process of uncertainty assessment and communication. These components have a layered structure that can be used in various ways. Further advice on component use is available in Annex Ia. The schematic below shows the structure. The present document
comprises the Mini-Checklist and the Quickscan Questionnaire with associated hints and advice to address certain research issues, and forms the basis for conscientiously dealing with uncertainty in policy-oriented scientific research.
Details per component
The Mini-Checklist is the central tool of the Guidance and may be used as a reminder list, an instrument offering reflection on how to deal with uncertainty when providing policy advice. It also provides a brief account of how uncertainty has been dealt with. It is also a portal into the Quickscan Questionnaire (if required).
The Quickscan Questionnaire can be used to reflect on, illustrate and document how uncertainty has been dealt with or will be dealt with in the future, providing hints and advice to address certain research issues.
The Detailed Guidance is an analysis tool for the further exploration of uncertainty. It also contains a glossary.
7
Components of the Guidance | The Tool Catalogue for Uncertainty Assessment offers information on the various uncertainty assessment tools.
The Spatial Uncertainty Checklist is an additional guide on visualising uncertainties in spatial information.
The Guide for Uncertainty Communication offers guidance, tips, and advice on how to communicate on uncertainties.
Uncertainty Communication: Issues and Good Practice is the background report to the Guide for Uncertainty Communication and contains extensive guidance on this topic. Figure 1
Guidance components
Mini-Checklist
Quickscan questionnaire including hints & actions
Detailed guidance
Uncertainty communication: Issues & good practice Tool catalogue for
uncertainty assessment Spatial uncertainty checklist Guide for uncertainty communication pbl.nl
Mini-Checklist -
Uncertainty Evaluation
1. Problem FramingIn our study we pay attention to: (i) existing frames of the problem, other than that of end users (including our own frame); (ii) the interconnections with other problems; (iii) any other relevant aspects of the problem not addressed in the research questions; (iv) the role of the study in the policy process; and (v) the way in which the study connects to previous studies on the subject.
Mostly
Partly
Hardly
Elaboration required (possibly on certain points)? ❍ No, because . . . ❍ Yes, because . . . à Go to Quickscan Question 1 2. Stakeholder Involvement
We have a clear picture of (i) the relevant stakeholders; (ii) their views, roles, stakes and involvement with respect to the problem; and (iii) the aspects of the problem on which they disagree. We have decided whether or not to involve stakeholders in the study, which of them are to be involved, why they should be involved, in which phase (problem definition, knowledge gathering, review), when (at the start, during the process, after completion), and how.
Mostly
Partly
Hardly
Elaboration required (possibly on certain points)? ❍ No, because . . . ❍ Yes, because . . . à Go to Quickscan Question 2 3. Indicator/Visualisation Selection
We can provide adequate support for the selection of indicators and/or visualisations. We also have considered alternatives, and our report discusses the limitations of using these indicators/visualisations. We are aware of the level of support among scientists and within society (including decision-makers/politicians) for the use of these indicators/visualisations.
Mostly
Partly
Hardly
Elaboration required (possibly on certain points)? ❍ No, because . . . ❍ Yes, because . . . à Go to Quickscan Question 3
9
Mini-Checklist - Uncertainty Evaluation | 4.Appraisal of Knowledge Base
We have determined the quality of the knowledge base by establishing any limitations to our knowledge regarding its intended use. We have specified (i) the quality that is required; (ii) the current state of knowledge; and (iii) the gap between these two. In consultation with the internal and external end user(s), we have decided how any deficiencies and limitations are to be dealt with, taking into account their impact on the quality of the results, the degree to which this could be remedied, and the resources needed to do so. If the available knowledge is limited, this will be duly reflected in our report.
Mostly
Partly
Hardly
Elaboration required (possibly on certain points)? ❍ No, because . . . ❍ Yes, because . . . à Go to Quickscan Question 4
5.Mapping and Assessing Relevant Uncertainties
We have a clear picture of (i) the relative importance of statistical uncertainty, scenario uncertainty and recognised ignorance with respect to the problem at hand; (ii) the
uncertainty sources that are most relevant to the problem; and (iii) the consequences of these uncertainties for the conclusions of this study. On the basis of all this, and in consultation with internal and external end user(s), we have mapped and assessed the uncertainties and established their relevance.
Mostly
Partly
Hardly
Elaboration required (possibly on certain points)? ❍ No, because . . . ❍ Yes, because . . . à Go to Quickscan Question 5
6. Communication of Uncertainty Information
We have a clear picture of (i) the context of the communication (what, why, to whom, on behalf of whom, when, where); and (ii) the robustness of the main messages. In a manner that is clear and tailored to the target audience(s), we will communicate on (a) policy-relevant uncertainties; and (b) their possible consequences for policy-making, politics, and society (in terms of potential effects or risks). For all the different forms of reporting (e.g. press release, summary, main text of report, appendices, background reports, scientific papers, lectures/presentations), we will provide traceable and consistent support for the uncertainty information presented.
Mostly
Partly
Hardly
Elaboration required (possibly on certain points)? ❍ No, because . . . ❍ Yes, because . . . à Go to Quickscan Question 6
Quickscan
Questionnaire
Question 1. How is the problem framed; which
contextual factors are included/excluded?
1a. Framing the Problem
Ø (i) How is the problem defined in the project?
Ø (ii) How does the end user frame the problem (provide a brief description)? ð How does (i) compare to (ii)?
Ø Are there other frames for the problem (e.g. from third parties)? What are these frames? (Provide a brief description per frame. Describe both political/societal and scientific aspects.)
ð To obtain a clear picture of the various frames of the problem, we
recommend you first answer Question 2.
ð Do you need to take these different problem frames into account? Discuss
this with the end user(s).
Ø How strongly is the problem interconnected with other problems? Describe those other problems.
ð If problems are approached in isolation, this may lead to below standard
policy advice. If the problem at hand will be studied independently then provide explicit reasons for doing so; discuss the potential consequences also with end user(s) and other people involved (e.g. project board, advisory panel, steering group, stakeholders) during the initial phase of the assignment. Pay attention to this issue in the final report of your study.
11
Quickscan Questionnaire | 1b. Knowledge requirement and research questions
Ø What knowledge of the problem does the end user need?
Ø In which research questions have these knowledge needs been described and what framing was chosen?
ð Formulate your questions as falsifiable hypotheses when possible and
appropriate, in order to obtain a sharp focus.
ð Document your choices and justifications, and discuss their potential
consequences with regard to the merit and scope of your study.
Ø Are there any possibly relevant aspects of the problem that will not be addressed in the research questions? If so, why are they not being dealt with?
ð Discuss the consequences of not dealing with these aspects (within the
project team and with the end-user(s)) in the initial phase of the project.
ð Would the study results and conclusions have been any different if these
aspects had been included? Answer this question in the discussion chapter of your final report.
1c. Policy context and problem history
Ø What is the role of the study in the policy process? (Tick the appropriate boxes)
q ad-hoc policy advice q to evaluate existing policy q to evaluate proposed policy
q to foster recognition of new problems q to identify and/or evaluate possible solutions q to provide counter-expertise
q other (describe)
ð To what extent is the study in accordance with the expected role of the
results in the policy process? Specify what this (expected) role means for dealing with uncertainty in the study.
Ø What has been said about this problem in the past?
ð You should use previous knowledge of this problem to plan and design your
study. Clearly indicate the added value and meaning of the present study.
Note
1 Indentations indicated by these arrows refer to hints and actions, which can be of help in answering the questions. These hints and actions stem from the Quickscan Hints & Actions List, P.H.M. Janssen, A.C. Petersen, J.P. van der Sluijs, J.S. Risbey, J. R. Ravetz, 1st Edition RIVM/ MNP, 2003.
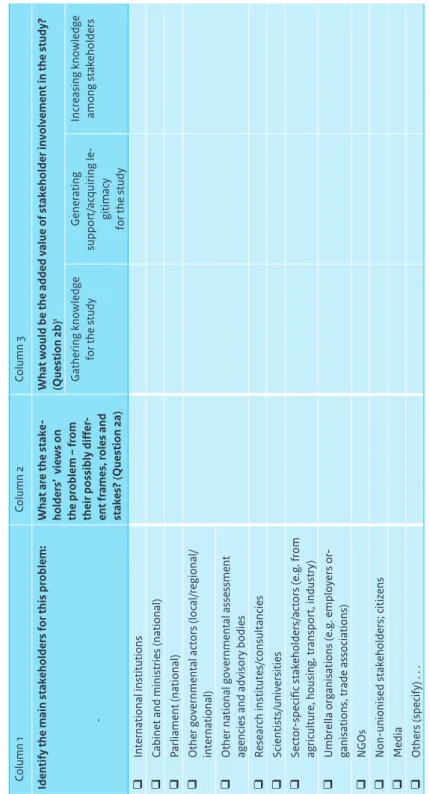
Question 2. What are the main parties (stakeholders/
actors) involved; what are their views, roles, stakes and
involvement with respect to the problem, and what would
be the added value of involving certain stakeholders in the
study?
2a. Inventory of stakeholders and their views on the problem
Ø What are the main parties (stakeholders/actors) involved in this problem? Considering their different frames, roles, stakes and involvement , what are their views on the problem? Do they recognise the problem as such? If so, how have they framed it?
(Fill out columns 1 and 2 of Table 1.)
ð Indicate controversies and plurality in views, and analyse them in more
detail, if necessary for a better policy advice.
A word of caution: if a problem is not important from the stakeholders’ perspective, you may be tempted to present results as more certain than they are. The study could backfire as a result of this. Openness and transparency about uncertainties and assumptions strengthen the credibility of the study.
2b. Required stakeholder involvement
Ø What would be the added value of stakeholder involvement in the study? What roles and contributions are you considering for stakeholders?
(Fill out column 3 of Table 1.)
ð Use the Checklist of the Stakeholder Participation Guidance (Hage and
Leroy, 2008b) to answer this question.
For a more extensive guidance, we refer to the Stakeholder Participation Guidance for the
13 Quickscan Questionnaire | Ta bl e 1 M ai n s ta ke ho ld er s, t he ir v ie w s o n t he p ro bl em a nd i nv ol ve m en t i n t he s tu dy Column 1 Column 2 Column 3
Identify the main stak
eholders for this problem:
¯
What are the stak
e-holders’ views on the problem – from their possibly differ
-ent frames, roles and stak
es? (Question 2a)
What would be the added value of stak
eholder involvement in the study?
(Question 2b)
1
Gathering knowledge
for the study
Generating
support/acquiring le
-gitimacy
for the study
Increasing knowledge among stak
eholders
q
International institutions
q
Cabinet and ministries (national)
q
Parliament (national)
q
Other governmental actors (local/regional/ international)
q
Other national governmental assessment agencies and advisory bodies
q Research institutes/consultancies q Scientists/universities q Sector -specific stak eholders/actors (e.g. from
agriculture, housing, transport, industry)
q
Umbrella organisations (e.g. employers or
-ganisations, trade associations)
q NGOs q Non-unionised stak eholders; citizens q Media q Others (specify) . . . 1
Question 3. What are the main indicators/visualisations
used in this study and how do these relate to the problem
definition?
Ø What are the main indicators/visualisations1 used in this study, and how well do these address the main aspects of the problem as it has been framed?
ð Map conceivable alternatives and discuss their shortcomings. ð Substantiate your choice of indicators/visualisations and discuss its
shortcomings and related potential controversies.
ð Consider involving stakeholders in the indicators/visualisations selection
process.
Ø How much support is there among scientists and within society (including decision-makers and politicians) for the use of these indicators/visualisations?
ð What could lead to a lack of support for your indicators/visualisations?
How would you deal with such a situation?
Note
1 Indicators play an important role in data- and/or model-based studies, while visualisations or images relate to studies where design is used as a basis for exploring the problem. Indicators and visualisations are both used for highlighting important aspects of the problem under
15
Quickscan Questionnaire |
Question 4. How adequate is the knowledge base that is
available for the study?
Ø What quality criteria are relevant for answering the research questions? ð These may vary per indicator/visualisation (e.g. accuracy, reliability,
plausibility, scientific support, robustness).
Ø What policy-relevant controversies exist with regard to the knowledge base? ð Consider controversies within the scientific arena as well as from
individuals who may approach the media in an attempt to play up some uncertain issues in the knowledge base. Pay specific attention to any scientific controversies that are policy relevant.
Ø Are there any major deficiencies and/or limitations, related to the knowledge base, to obtaining answers of the required quality, in the light of existing controversies and the strengths and weaknesses of the knowledge base? And, if so, what are these deficiencies and/or limitations?
ð Where are the crucial knowledge gaps? What are the causes (e.g. limited
availability and/or quality of (a) expertise, (b) empirical data, and (c) theoretical underpinning and models)? Why are they crucial?
Ø What are the implications of these deficiencies and/or limitations for the scope, quality, and acceptance of the findings of this study?
ð What are the expected obstacles when ‘filling’ these knowledge gaps?
What impact do you think these obstacles will have on the scope and quality of the study’s results?
ð Could the knowledge base be improved during the study?
ð Should the knowledge base prove insufficient for obtaining answers of
the required quality, then inform the end user(s) and the steering group as early as possible, and adjust the study accordingly. Document these decisions.
ð If you make assumptions to bridge a gap in knowledge, these must be
explicitly stated in the report, as well as any consequences for the policy advice.
Ø How can these deficiencies and limitations best be addressed; either during the study or after its completion?
ð Statements on a lack of knowledge may be included in the report to help
similar studies in the future. Peer review is a useful instrument to determine whether controversies have been adequately dealt with.
Question 5. What are the uncertainties relevant to this
problem and what is their nature and location?
Ø How do uncertainties need to be dealt with in the study?
(Tick the appropriate boxes; choices may vary per indicator/visualisation. Briefly indicate the reasons for your choices.)
q Uncertainties are not expected to play a significant role.
q The robustness of policy-relevant conclusions in the light of underlying uncertainties will be investigated and explicitly communicated. q The uncertainties most relevant to policy will be identified.
m The possible implications of these uncertainties will be discussed (e.g. in relation to achieving the policy targets).
m Information will be given on the nature of these uncertainties (e.g. whether they are primarily caused by limited knowledge1 or stem from the unpredictable and variable nature of the system at hand2). m Information will be given on the possibilities of reducing or controlling
these uncertainties and on their possible effects (e.g. Could knowledge uncertainty be reduced by gathering more knowledge in the future? Could the effects of intrinsic uncertainty be reduced by taking specific policy measures?).
q Uncertainties related to the main outcomes will be stated explicitly. m A quantitative description of policy-relevant uncertainties is required
(e.g. ranges, outcomes of scenario studies).
m A qualitative description of policy-relevant uncertainties will suffice. q The main ‘sources of uncertainty’ will be identified and their contribution to
the overall uncertainty determined.
m A quantitative analysis is required (e.g. on sensitivity). m A qualitative analysis will suffice or will be more appropriate. q Some uncertainties are not amenable to quantitative analysis. We will
employ appropriate methods to evaluate their possible roles in the analysis.
ð On completion of this list, you should determine whether sufficient information
is available to adequately deal with uncertainties in the policy advice.
ð If not, you must determine what would be required to fulfil these needs and
how you will act when this cannot be fully accomplished; for example, due to a lack of resources or the presence of uncertainties or unexpected issues that cannot be fully captured (e.g. ‘unknown unknowns’). In these types of cases, ‘what if’ gaming-simulations to explore potential consequences of the lack of information could be of benefit.
17
Quickscan Questionnaire | Ø Based on the following problem characteristics, which aspects of uncertainty
will require additional attention?
(Tick the appropriate boxes. Choices may vary per indicator/visualisation. The arrows suggest aspects that may require additional attention.)
q a. Various assumptions are critical.
ð Be explicit about the assumptions and the framing of the study. Evaluate critical
choices made. Discuss any consequences for the robustness of conclusions.
q b. The estimated indicator is close to the (legal) norm or to a (policy) target. q c. A small change in an estimated indicator may have a significant effect on
estimated costs, impacts, or risks.
ð For b and c, denote the nature of the uncertainties (e.g. knowledge limitations;
intrinsic variability), how these could be analysed and discussed, in terms of accomplishing policy goals, exceeding norms, and the potential size and seriousness of effects and risks. Could uncertainty be reduced? If more research is likely to lead to an increase in some uncertainties, describe any potential policy implications.
q d. There is dissensus about policy goals.
ð Describe the role of value-laden uncertainties and stakeholder views and
interests. Discuss implications for the sociopolitical arena.
q e. Decision stakes are high.
ð Describe the influence that views and values may have on both the selection of
indicators and the conclusions. Discuss implications for the sociopolitical arena.
q f. There is dissensus about the (type of) knowledge required to solve the problem.
ð Describe the issues on which views differ the most with respect to the (type of)
knowledge required. Discuss any related impacts on the conclusion(s).
q g. Major uncertainties exist regarding the behaviour of the natural and social systems under study.
ð Describe the consequences this has for the conclusions. Be explicit about
ignorance and controversies and what these mean for the conclusions.
q h. The research method used has typical uncertainties and limitations associated with it, which require additional attention (e.g. uncertainties around model structures).
ð Determine which uncertainties and limitations are associated with the chosen
Ø Where are the most important uncertainties expected to be found and what is known about their nature?
ð By using the uncertainty matrix of Annex III, the uncertainties can be classified
into various types, which aids a better analysis. See Annex IIa for further information.
ð Also pay particular attention to ‘unexpected issues and unknowns’; for example,
by asking ‘what if’ questions that force you to think outside the box and thus broaden your view of what is possible in thinking about the uncertainties. Such a question, for example, could be:
‘Suppose that in xx years the problem would be much worse than you imagined. Could you give a plausible explanation for why things may have gone wrong? If so, does that make you want to revisit any of your previous assessments of uncertainty and confidence?’
Ø What actions or methods would be required to better map the most important uncertainties and how feasible are they to execute, given the available resources? What uncertainty assessment activities will be carried out?
ð After application of the uncertainty matrix in Annex III, you can determine which
tools are necessary for the uncertainty assessment. You may also consult various experts in the field. See Annex IIb for further advice and follow-up actions.
Notes
1 For example, controversies; lack of insight; preliminary research; limited empirical basis (few measurements available or possible).
2 For example, limited predictability of human behaviour; socio-economic developments; degree to which policies and measures are implemented; degree of compliance.
19
Question 6. How is uncertainty information
communicated?
6a. Who?
Ø Who are the target audiences and what demands or needs do they have regarding uncertainty communication?
6b. What and when?
Ø What uncertainties are relevant to each of the target audiences?
ð Take into account the issues that apply to the target group, the policy phase
being studied, any situations rendering uncertainty relevant, and possible future relevant developments.
Ø What are the possible implications of uncertainty for the conclusions of the study and what policy consequences may be involved? (state all of these clearly in the communication)
ð Important aspects: the consequences for the solidity of results and the policy
recommendations derived from them; consequences for the merit, applicability, and representativeness of results; options for reducing uncertainties;
consequences for various strategies relating to risk management, policy, politics, and society.
6c. Where?
Ø What are the main messages of your study? What are the major assumptions on which these are based and how robust are the conclusions in the light of these assumptions and uncertainties related to the study?
ð Aim for policy-relevant conclusions that are robust with respect to the underlying
uncertainties. Clearly state these uncertainties and assumptions. Discuss main messages before publication with the management team, experts, and – where appropriate – with relevant target audiences.
21
Quickscan Questionnaire | Ø What layers can be distinguished in the publications surrounding the study
(e.g. press release, summary, main text, appendices, background report, scientific papers, lectures/presentations)? Taking into account the target audiences and the required/allowed level of detail of these layers, how can the uncertainty information best be distributed over these layers? How do you establish a clear, traceable and consistent account, as well as an underpinning of the presented results?
ð What is the purpose, target group, and the required level of detail of each layer?
Put crucial information in the layers that are most likely to be read (summary, introduction, conclusions). Make sure information is consistent over the layers.
ð Give a clear and traceable account and underpinning of the presented material,
by explaining the employed line (and logic) of reasoning and discussing the appropriateness of the applied knowledge and methods.
6d. How?
Ø In which way have certain aspects such as how readers will process and use uncertainty information (quantitative as well as qualitative) been taken into account in the communication?
ð Take into account: the possible impact of presentation and phrasing on the
manner in which end users will interpret the information, the possible strategic use of information, and the possibility of a report causing quite a stir.
Ø How have the various forms of presentation (verbal, numerical, graphical, combination), their advantages and disadvantages been dealt with, including any possible pitfalls?
ð Verbal information is easy to understand – suitable for ‘outer’ layers. Numerical
information, although more difficult to understand, is more informative – suitable for ‘inner’ layers. Graphics can contain much information, but may be difficult to understand; therefore, carefully consider how, when and where to use them.
For further guidance, refer to the Guide for Uncertainty Communication (Guidance vol. 6). The Checklist Spatial Uncertainty (Guidance vol. 5) contains specific guidance on communicating spatial uncertainties.
References
Hage M and Leroy P. (2008a). Stakeholder Participation Guidance for the Netherlands Environmental Assessment Agency: Main Document. Radboud University and Netherlands Environmental Assessment Agency, Nijmegen/Bilthoven. http://www. pbl.nl/en/publications/2008/StakeholderParticipationGuidancefortheNetherlandsEn-vironmentalAssessmentAgency_MainDocument.html
Hage M and Leroy P. (2008b). Stakeholder Participation Guidance for the Netherlands Environmental Assessment Agency: Checklist. Radboud University and Netherlands Environmental Assessment Agency, Nijmegen/Bilthoven. http://www.pbl.nl/en/ publications/2008/StakeholderParticipationGuidancefortheNetherlandsEnvironmen-talAssessmentAgency_Checklist.html
Hage M and Leroy P. (2008c). Stakeholder Participation Guidance for the Netherlands Environmental Assessment Agency: Practice Guide. Radboud University and Nether-lands Environmental Assessment Agency, Nijmegen/Bilthoven. http://www.pbl.nl/en/ publications/2008/StakeholderParticipationGuidancefortheNetherlandsEnvironmen-talAssessmentAgency_PracticeGuide.html
Janssen PHM, Petersen AC, Van der Sluijs JP, Risbey JS and Ravetz JR. (2005). A guidance for assessing and communicating uncertainties. Water Science & Technology 52: 125–131.
Kloprogge P, Van der Sluijs JP and Petersen AC. (2011). A method for the analysis of as-sumptions in model-based environmental assessments. Environmental Modelling & Software, 26 (3) 289–301.
Petersen AC. (2012). Simulating Nature: A Philosophical Study of Computer-Simulation
Uncertain-ties and Their Role in Climate Science and Policy Advice. Second Edition, Boca Raton, FL: CRC Press.
Van der Sluijs JP, Petersen AC, Janssen PHM, Risbey JS and Ravetz JR. (2008). Exploring the quality of evidence for complex and contested policy decisions. Environmental Research Letters, 3. 024008.
Walker WE, Harremoës P, Rotmans J, Van der Sluijs JP, Van Asselt MBA, Janssen PHM and Krayer von Krauss MP. (2003). Defining Uncertainty: A Conceptual Basis for Uncertain-ty Management in Model-Based Decision Support. Integrated Assessment, 2003, Vol. 4, pp. 5–17.
23
Annexes
Annex I: Additional Information on the Guidance
Ia. Further advice on using the Guidance components
The particular components of the Guidance that will be used in a study largely depend on the importance, nature, and level of the related uncertainties and on the available resources. The following scheme offers suggestions for the use of the main components1:
Importance of uncertainty Ü
Resources available
Ü
Small Average Large
Few MC MC(+QS+UC) MC+QS+UC
Average MC+QS MC+QS(+UC) MC+QS+UC(+DG)
Many MC+QS MC+QS+UC(+DG) MC+QS+UC+DG
Abbreviations MC Mini-Checklist
QS Quickscan Questionnaire
UC Guide for Uncertainty Communication DG Detailed Guidance
25
Annexes |
Ib. Authors of the Guidance
The following persons participated in the production of one or more volumes of the Guidance for Uncertainty Assessment and Communication (affiliations reflect the situation in 2003, when the ‘Detailed Guidance’ was published):
q Jeroen van der Sluijs, Penny Kloprogge, Arjan Wardekker, James Risbey (Utrecht University)
q Jerome Ravetz (Oxford University and Research Methods Consultancy, United Kingdom)
q Silvio Funtowicz, Serafin Corral Quintana, Ângela Guimarães Pereira (EC Joint Research Centre, Italy)
q Bruna De Marchi (Institute of International Sociology, Italy)
q Peter Janssen, Arthur Petersen, Hans Visser, Arthur Beusen, Peter Heuberger, Willemijn Tuinstra (PBL Netherlands Environmental Assessment Agency) q Rob Hoppe, Simône Huijs (University of Twente)
q Marjolein van Asselt (Maastricht University) q Hannah Martinson Hughes (United Kingdom)
We would like to thank the many colleagues and national and international experts who participated in any of the trial sessions and user-review and peer-review rounds of the Guidance documents.
Annex II: Advice on the Use of the Uncertainty Matrix and
the Tool Catalogue
IIa. Using the uncertainty matrix
The uncertainty matrix in Annex III may be used to indicate the most important uncertainties by stating their location and further characterising them – both quantifiable and unquantifiable – within the context of a particular application and/or any of the statements made. The uncertainty matrix is a suitable instrument to classify the uncertainties into various types, especially for model-based studies. Different types of uncertainty may require different uncertainty assessment approaches and may have different policy implications. For example, assessing uncertainties that result from statistically well-defined measurement errors requires very different tools than those needed in the assessment of uncertainties that are related to natural processes of which we have very limited knowledge.
Rank the uncertainties according to their importance. Depending on the state of research, this ranking could be an initial prioritisation based on general knowledge and experiences with the issue, or be a more advanced ranking based on extensive studies and/or sensitivity analyses. (Keep in mind that the latter would capture only some of the uncertainties that may be important; for example, they often do not include
uncertainties related to model structure or unquantifiable uncertainties.)
Mark the uncertainties for which further qualitative and/or quantitative uncertainty assessment absolutely would be needed.
Briefly justify the choices you have made when selecting, ranking and marking the uncertainties.
IIb. Using the tool catalogue
Once the uncertainties have been localised and characterised, you can determine which tools and techniques would be suitable for doing the actual uncertainty assessment. For this purpose, use the Tool Catalogue for Uncertainty Assessment and also Sections 4 and 5 of the Detailed Guidance, Volume 3 of the Guidance for Uncertainty Assessment and Communication series. By consulting experts on uncertainty analyses as well as on the specific problem, the usefulness and achievability of applying the proposed tools and analyses may be determined. Ensure the focus of the analysis is clear. Subsequently, specific uncertainty assessment activities may be formulated and included in the project plan. Describe any limitations to what can be achieved, given the available resources (money, expertise, tools, data, time, manpower), and analyse their potential effects on the quality of the study results. Discuss these issues with the end users at an early stage, and decide on how uncertainties will be dealt with (keeping in mind the responsibility of your institute for the scientific quality of the study).
27
Annexes |
Annex III: Uncertainty Matrix and Typology of
Uncertainties
Ta bl e 2 a. U nc er ta int y m at ri xUNCER
TAINTY MA
TRIX
Level of uncertainty(from ‘knowing for certain’
(deterministic knowledge) to ‘not even knowing what you do not know’ (total
ignorance))
Nature of uncertainty
Qualification of knowledge base
(backing)
Value-ladenness of
choices
Location
Ü
Statistical uncertainty (range+ chance) Scenario uncertainty (range
indicated as ‘what-if
’
option)
Recognised ignorance Knowledge- related uncertainty Variability- related uncertainty
W eak – Fair 0 Strong + Small – Medium 0 Large + Context
Assumptions on system boundaries and ecological, technological, economic, social and political context
Expert
judgement
Narrative; storyline; advice
M o d e l Model structure
Relations
Technical model
Software and hardware implementation
Model parameters
Model inputs
Input data; driving
forces; input scenarios
Data (in a general sense) Measurements; monitoring; surveys
Outputs
IIIa. Instructions for filling out the uncertainty matrix
1. Indicate in the uncertainty matrix (Table 2a) where the most relevant uncertainties or uncertainty sources are to be expected:
q First indicate in which row(s) of the matrix the uncertainty source is located (location dimension).
q Subsequently, further characterise the uncertainty source using the columns (representing four uncertainty dimensions other than location).
q In addition, use the ‘A, B, C’ codes below to indicate the relevance of the specific uncertainty sources (exclude sources that are considered hardly important or unimportant):
q A = of crucial importance q B = of average importance q C = of moderate importance
By attaching an index to this coding – such as A1, B1, C1, A2, B2, C2,and so on – the specific uncertainty source to which the coding refers (e.g., Index 1 refers to source 1, Index 2 to source 2, and so on) can be indicated. Notice that a specific source of uncertainty may appear at different points in the matrix, depending on how the source manifests itself and how it can be characterised (see sub [IIIb], below, for more explanation).
2. Use Table 2b to briefly describe each uncertainty source, and explain the specifications given in the uncertainty matrix (e.g. concerning the location and further uncertainty characterisation, and concerning the ABC code score), adding references to the literature, if appropriate.
Table 2b.
Background Information on uncertainty sources Brief description of the selected sources of
uncertainty
Explanation and justification of the specifications given in the matrix
Source 1: …. Source 2: …. …. ….
29
Annexes |
IIIb. Detailed information on purpose and function of the uncertainty matrix
The uncertainty matrix is an instrument – specifically for studies using modelling results – to generate an overview of where the main (policy-relevant) uncertainties may be located, and how these could be further characterised in terms of certain uncertainty dimensions. Using the matrix may serve as a first step towards a more elaborate uncertainty assessment; in particular of the magnitude of uncertainties and their impact on policy-relevant conclusions. The matrix2 features five principal dimensions of uncertainty: location, level of uncertainty, nature of uncertainty, qualification of knowledge base, and value-ladenness of choices. These dimensions are explained below: (i) The dimension ‘location’ indicates where uncertainty could manifest itself in the problem configuration at hand. It distinguishes five categories:
ð ‘Context’ This concerns the framing and delineation of the problem, including the choices that determine what is considered inside or outside system boundaries (‘delineation of the system and its environment’), as well as the completeness of this representation in view of the issues at hand. Some of these context-related choices may also be reflected in some of the other location categories, such as ‘data’ that are considered to play a role, ‘models’ that have been chosen, and ‘outcomes’ that may be of interest.
ð ‘Data’ This refers, for example, to measurements, monitoring and surveys used in the study; that is to say, information that is directly based on empirical research and data collection. Data used for calibration of the models involved also are included in this category.
ð ‘Model’3 This concerns the ‘model instruments’ used in the study. This category may encompass a broad spectrum of models, ranging from mental conceptualisations, in terms of mental and conceptual models, to more formally specified mathematical models (e.g. statistical models, causal process models) which are often implemented as computer models. Especially for the last type of models, subcategories were introduced, distinguishing between model structure (relations), model parameters (e.g., process parameters, initial and boundary conditions), model inputs (input data, external driving forces, input scenarios), and the technical model, which refers to the model’s implementation in hardware and software.
ð ‘Expert judgement’ This refers to the particular contributions to the study that are not fully covered by context, models or data, and that typically have a more qualitative, reflective and/or interpretative character. This input, alternatively, could also be viewed as part of the ‘mental model’.
ð ‘Outputs’ This refers to study outcomes, indicators, statements that are of interest within the context of the problem at hand.
Remark: Note that ‘scenarios’ in a broad sense were not included as a separate category along the location axis. In fact, they show up at different locations; for example, as part of the context, model structure, model input scenario and expert judgement.
The various uncertainties along the location axis may be further characterised in terms of four other uncertainty features/dimensions, described below.
(ii) The dimension ‘level of uncertainty’ expresses how a specific uncertainty source can be classified on a gradual scale, running from ‘known for certain’ to ‘unknown’. This dimension uses three distinct classes:
ð
‘Statistical uncertainty’ This concerns the uncertainties that adequately may be expressed in statistical terms; for example, as a range with associated probability (e.g. statistical expressions for measurement inaccuracies, uncertainties due to sampling effects, and uncertainties in model-parameter estimates). In the natural sciences, scientists generally refer to this category if they speak of uncertainty, thereby often implicitly assuming that the involved model relations offer adequate descriptions of the real system under study, and that the data or calibration data used are representative of the situation under study. However, when this is not the case, ‘deeper’ forms of uncertainty are in play, which may surpass the ‘statistical uncertainty’ in magnitude and seriousness and thus require adequate attention.ð
‘Scenario uncertainty’ This concerns uncertainties that cannot be adequately depicted in terms of chances or probabilities, but can only be specified in terms of (a range of) possible outcomes. For these uncertainties it is impossible to specify a degree of probability or belief, since the mechanisms that have led to the outcomes are not sufficiently known. Scenario uncertainties are often construed in terms of ‘what-if’ statements.ð
‘Recognised ignorance’: this concerns the uncertainties known to be there – in some way or another – but for which no useful estimate can be established; for example, due to limits to predictability and knowledge (‘chaos’) or due to unknown processes.Continuing on the scale beyond recognised ignorance, the area of complete ignorance is entered (‘unknown unknowns’). Any uncertainties here cannot be addressed, and here scientists inevitably are in the dark.
It should be noted that the uncertainties that manifest themselves in a specific location (e.g., uncertainties about model relations) may appear in each of the above-mentioned guises; some aspects can be adequately expressed in statistical terms, whereas others often can only be expressed in terms of ‘what-if’ statements. Moreover, there are also
31
Annexes | available. Determining which aspects manifest themselves and in what particular form, is often a subjective and uncertain matter.
(iii) The third characteristical dimension, ‘nature of uncertainty’, expresses whether uncertainty is primarily a consequence of the incompleteness and fallibility of knowledge (‘knowledge-related’, or ‘epistemic’ uncertainty) or that it is primarily due to the intrinsic indeterminate and/or variable character of the system under study (‘variability-related’, or ‘ontic’ uncertainty).
ð
Knowledge-related uncertainty can, although not necessarily, be reduced by means of more measurements, better models and/or more knowledge.4ð
Variability-related uncertainty is typically not reducible through more research (e.g. inherent indeterminacy and/or unpredictability, randomness, chaotic behaviour5).Remark: In many situations, uncertainty manifests itself as a mix of both forms; the delineation between ‘epistemic’ and ‘ontic’ cannot unequivocally be made in all cases. Moreover, a combination of preference, tradition, specific features related to the problem that are of interest, and/or level of knowledge or lack thereof with respect to the specific subject largely determines where the dividing line between the above two forms can be drawn. In practice, it is therefore the researcher who often determines the distinction between epistemic and ontic, rather than that this is an innate and fundamental property of reality itself. This choice, however, can be decisive for the outcomes and interpretations of the uncertainty assessment. Still, using the distinction between ‘epistemic’ and ‘ontic’ uncertainty may provide important information on the possibility or impossibility of reducing uncertainties; for example, through additional research, better measurements or better models. This distinction largely reflects the distinction between uncertainties that are ‘reducible’ by means of further research and those that are not.
(iv) The fourth dimension relevant for characterising uncertainty concerns the
‘qualification of the knowledge base’. This refers to the degree of underpinning of the established results and statements. The phrase ‘established results and statements’, as it is used here, may be interpreted in a broad sense. It may refer to policy advice as such (e.g. ‘the norm will still be exceeded after the proposed policy measures become effective’, ‘the total annual emission of substance A is X kilotonnes’), or to assertions about the uncertainty in this statement (e.g. ‘the uncertainty in the total annual emission of substance A is . . . (95% confidence interval)’). The degree of underpinning is divided into three qualitative classes: weak/fair/strong. If the underpinning is weak, this indicates that the statement of concern is surrounded by much (knowledge-related) uncertainty, and deserves further attention. This classification, moreover, offers suggestions about the extent to which uncertainty is reducible by providing a better underpinning.
Notice that this dimension, in fact, characterises the reliability of the information (e.g. data, knowledge, methods, argumentations) used in the study. Criteria, such as empirical, theoretical or methodological underpinning, and acceptance/support within and outside the peer community may be used for assessing and expressing the level of reliability. If required, a ‘pedigree analysis’ may be carried out, which results in a semi-quantitative scoring of the underpinning on the basis of a number of qualitative criteria, such as the ones mentioned previously (see the Tool Catalogue for Uncertainty Assessment).
(v) The final dimension for characterising uncertainties denotes whether a substantial amount of ‘value-ladenness’ and subjectiveness is involved in making the various – implicit and explicit – choices during the study. This concerns, among other things, the way in which (i) the problem is framed with regard to the various views and perspectives on the problem, (ii) the knowledge and information (data, models) is selected and applied, and (iii) the explanations and conclusions are expressed and formulated. If the value-ladenness is high for relevant parts of the study, then it is imperative to analyse whether or not the results of the study are highly influenced by the choices involved, and whether this could lead to a certain arbitrariness, ambiguity or uncertainty in the policy-relevant conclusions. This could then be a reason to explicitly address the different views and perspectives in the study and to discuss the scope and robustness of the conclusions in detail. In order to identify value-ladenness, for example, Sections 1 and 2 of the Detailed Guidance may be used (see also Kloprogge et al. (2011)).
33
Annexes |
Notes
1 The other components (e.g. Tool Catalogue, Spatial Uncertainty Checklist) are used when questions arise that are relevant to the specific topics.
2 The uncertainty matrix shown in Table 2a is based on material presented in Walker et al. (2003). The typology and the associated uncertainty matrix in that paper classify uncertainty according to three dimensions: ‘location’ (where it occurs), ‘level’ (where it manifests itself in the gradual spectrum between deterministic knowledge and total ignorance) and ‘nature’ (whether uncertainty primarily stems from knowledge imperfection or is a direct consequence of inherent variability). We extended this typology – and the associated uncertainty matrix – by adding two additional dimensions (presented in columns): ‘qualification of knowledge base’ and ‘value-ladenness of choices’. These additional characteristics were also briefly mentioned by Walker et al. (2003) as being specific features of knowledge-related uncertainty. Because of their importance to assessing and communicating uncertainties, we added these dimensions to the uncertainty matrix in two separate columns. Moreover, the location axis in Walker et al. (2003), which was specifically designed for model-based decision support studies, was also slightly modified. Two novel location categories were added: ‘expert judgement’ and ‘data’, since these can often be clearly distinguished from the other categories. Finally, the ‘model’ category was extended by classifying the originally separate categories of ‘inputs’ and ‘parameters’ as subcategories of ‘models’. See also Janssen et al. (2005), Van der Sluijs et al. (2008) and Petersen (2012).
3 ‘Models’ are defined in a broad sense: a model is a (material) representation of an idea, object, process or mental construct. A model can exist solely in the human mind (mental, conceptual model), but it can also be a physical representation of a larger object (physical scale model), or be a more quantitative description, using mathematical concepts and computers
(mathematical and computer model).
4 However, it is also possible that this knowledge-related uncertainty is increased by doing more research and by the progress of insight.
5 Although it is possible to know the characteristics of a system on a certain level of aggregation, e.g., knowing the probability distribution or the ‘strange attractor’, it is not always possible to predict the behaviour or properties of individuals/elements which form part of the system on a lower level.
GUIDANCE FOR UNCERTAINTY ASSESSMENT AND COMMUNICATION Second Edition
© PBL Netherlands Environmental Assessment Agency The Hague, 2013 ISBN 978-94-91506-59-8 PBL publication number: 712 Corresponding author arthur.petersen@pbl.nl Authors
Arthur C. Petersen and Peter H.M. Janssen (PBL), Jeroen P. van der Sluijs (Utrecht University, Copernicus Institute), James S. Risbey (CSIRO Marine and Atmospheric Research), Jerome R. Ravetz (James Martin Institute for Science
and Civilization, University of Oxford), J. Arjan Wardekker (Health Council of the Netherlands), Hannah Martinson Hughes
English-language editing Annemieke Righart Graphics PBL Beeldredactie Production coordination PBL Publishers Photo cover
Arnel Manalang, iStock Layout
VijfKeerBlauw, Martin Middelburg
This publication can be downloaded from: www.pbl.nl/en. A hard copy may be ordered from: reports@pbl.nl, citing the PBL publication number or ISBN.
Parts of this publication may be reproduced, providing the source is stated, in the form: Petersen A. et al. (2013), Guidance for uncertainty assessment and communication, Second edition, The Hague: PBL Netherlands Environmental Assessment Agency.
PBL Netherlands Environmental Assessment Agency is the national institute for strategic policy analyses in the fields of the environment, nature and spatial planning. We contribute to improving the quality of political and administrative decision-making, by conducting outlook studies, analyses and evaluations in which an integrated approach is considered paramount. Policy relevance is the prime concern in all our studies. We conduct solicited and unsolicited research
35
PBL Netherlands Environmental Assessment Agency Mailing address PO Box 30314 2500 GH The Hague The Netherlands Visiting address Oranjebuitensingel 6 2511VE The Hague T +31 (0)70 3288700 www.pbl.nl/en