The Emissions Gap Report 2015
A UNEP Synthesis Report
ISBN: 978-92-807-3491-1 United Nations Environment Programme
P.O. Box 30552 - 00100 Nairobi, Kenya Tel.: +254 20 762 1234 Fax: +254 20 762 3927 e-mail: uneppub@unep.org www.unep.org
www.unep.org
AdvAnce copy
2 The Emissions Gap Report 2015 – Scoping the 2015 report
Published by the United Nations Environment Programme (UNEP), November 2015 Copyright © UNEP 2015
ISBN: 978-92-807-3491-1 Job Number: DEW/1896/NA
This publication may be reproduced in whole or in part and in any form for educational or non-profit services without special permission from the copyright holder, provided acknowledgement of the source is made. UNEP would appreciate receiving a copy of any publication that uses this publication as a source.
No use of this publication may be made for resale or any other commercial purpose whatsoever without prior permission in writing from the United Nations Environment Programme. Applications for such permission, with a statement of the purpose and extent of the reproduction, should be addressed to the Director, DCPI, UNEP, P. O. Box 30552, Nairobi 00100, Kenya. disclaimers
Mention of a commercial company or product in this document does not imply endorsement by UNEP or the authors. The use of information from this document for publicity or advertising is not permitted. Trademark names and symbols are used in an editorial fashion with no intention on infringement of trademark or copyright laws.
The views expressed in this publication are those of the authors and do not necessarily reflect the views of the United Nations Environment Programme. We regret any errors or omissions that may have been unwittingly made.
© Images and illustrations as specified.
Citation This document may be cited as: UNEP (2015). The Emissions Gap Report 2015. United Nations Environment Programme (UNEP), Nairobi
A digital copy of this report along with supporting appendices are available at http://www.unep.org/emissionsgapreport2015/
UNEP promotes
environmentally sound practices
globally and in its own activities. This
report is printed on paper from sustainable
forests including recycled fibre. The paper is
chlorine free, and the inks vegetable-based.
Our distribution policy aims to reduce
UNEP’s carbon footprint
Based on a decision of the Parliament of the Federal Republic of Germany
Supported by: This project is part of the International Climate Initiative. The
Federal Ministry for the Environment, Nature Conservation and Nuclear Safely supports this initiative on the basis of a decision adopted by the German Bundestag.
The Emissions Gap Report 2015
A UNEP Synthesis Report
November 2015
UNEP
iv The Emissions Gap Report 2015 – Acknowledgements
Acknowledgements
The United Nations Environment Programme (UNEP) would like to thank the members of the steering committee, the lead and contributing authors, reviewers and the secretariat for their contribution to the preparation of this assessment report. Authors and reviewers have contributed to the report in their individual capacities. Their affiliations are only mentioned for identification purposes.
Project steering committee
Mónica Araya (Nivela), Pierre Brender (Ministry of Ecology, Sustainable Development and Energy, France), John Christensen (UNEP DTU Partnership), Navroz K. Dubash (Centre for Policy Research, India), Thelma Krug (National Institute for Space Research, Brazil), Simon Maxwell (Climate and Development Knowledge Network), Jacqueline McGlade (United Nations Environment Programme), Bert Metz (European Climate Foundation), Yacob Mulugetta (University College London), Klaus Müschen (Federal Environment Agency of Germany), Katia Simeonova (United Nations Framework Convention on Climate Change), Merlyn van Voore (United Nations Environment Programme)
Chapter 1
Lead authors: John Christensen (UNEP DTU Partnership), Paul Burgon (independent consultant)
Chapter 2
Section 2.2
Lead author: Joeri Rogelj (International Institute for Applied Systems Analysis)
Contributing authors: Kejun Jiang (Energy Research Institute), Jason Lowe (Met Office), Greet Maenhout (Joint Research Centre, European Commission), Steven Smith (Pacific Northwest National Laboratory)
Section 2.3
Lead authors: Taryn Fransen (World Resources Institute), Michel den Elzen (PBL Netherlands Environmental Assessment Agency), Hanna Fekete (NewClimate Institute), Niklas Höhne (NewClimate Institute)
Contributing authors: Mengpin Ge (World Resources Institute), Heleen van Soest (PBL Netherlands Environmental Assessment Agency)
Chapter 3
Lead authors: Michel den Elzen (PBL Netherlands Environmental Assessment Agency), Taryn Fransen (World Resources Institute), Niklas Höhne (NewClimate Institute), Harald Winkler (University of Cape Town), Roberto Schaeffer (Universidade Federal do Rio de Janeiro), Fu Sha (National Center for Climate Strategy and International Cooperation), Amit Garg (Indian Institute of Management Ahmedabad) Contributing authors: Guy Cunliffe (University of Cape Town), Hanna Fekete (NewClimate Institute), Mengpin Ge (World Resources Institute), Giacomo Grassi (Joint Research Centre, European Commission), Mark Roelfsema (PBL Netherlands Environmental Assessment Agency), Joeri Rogelj (International Institute for Applied Systems Analysis), Sebastian Sterl (NewClimate Institute), Eveline Vasquez (Universidade Federal do Rio de Janeiro)
Chapter 4
Lead author: Anne Olhoff (UNEP DTU Partnership)
Contributing author: John Christensen (UNEP DTU Partnership)
Chapter 5
Lead authors: Walter Vergara (UNEP DTU Partnership / World Resources Institute), Michiel Schaeffer (Climate Analytics), Kornelis Blok (Ecofys)
Contributing authors: Andrzej Ancygier (Climate Analytics), Skylar Bee (UNEP DTU Partnership), Philip Drost (United Nations Environment Programme), Lara Esser (Ecofys), Mark Roelfsema (PBL Netherlands Environmental Assessment Agency)
Chapter 6
Lead authors: Lera Miles (UNEP World Conservation Monitoring Centre), Denis Jean Sonwa (Center for International Forestry Research)
Contributing authors: Riyong Kim Bakkegaard (UNEP DTU Partnership), Blaise Bodin (UNEP World Conservation Monitoring Centre), Rebecca Mant (UNEP World Conservation Monitoring Centre), Lisen Runsten (UNEP World Conservation Monitoring Centre), Maria Sanz Sanchez (Food and Agriculture Organization of the United Nations), Kimberly Todd (United Nations Development Programme),
Francesco Tubiello (Food and Agriculture Organization of the United Nations), Arief Wijaya (Centre for International Forestry Research / Thuenen Institute Hamburg)
Reviewers
Maria Belenky (Climate Advisers), Duncan Brack (Chatham House), Pieter Boot (PBL Netherlands Environmental Assessment Agency), Michael Bucki (European Commission), Katherine Calvin (Pacific Northwest National Laboratory), Tim Christophersen (United Nations Environment Programme), Leon Clarke (Pacific Northwest National Laboratory), Michel Colombier (Sustainable Development and International Relations - IDDRI), Laura Cozzi (International Energy Agency), Joe Cranston Turner (London School of Economics and Political Science), Rob Dellink (Organisation for Economic Cooperation and Development), Harald Diaz-Bone (independent consultant), Steffen Dockweiler (Danish Energy Agency), Thomas Enters (United Nations Environment Programme), Thomas Hale (University of Oxford), Richard Houghton (Woods Hole Research Center), Inkar Kadyrzhanova (United Nations Framework Convention on Climate Change), Johan Kieft (United Nations Office for REDD+ Coordination in Indonesia - UNORCID), Ariane Labat (European Commission), Axel Michaelowa (Perspectives), Perry Miles (European Commission), Peter Minang (World Agroforestry Centre - ICRAF), Helen Mountford (New Climate Economy), Dirk Nemitz (United Nations Framework Convention on Climate Change), Ian Ponce (United Nations Framework Convention on Climate Change), Mark Roelfsema (PBL Netherlands Environmental Assessment Agency), James Rydge (New Climate Economy), Katja Schumacher (Institute for Applied Ecology, Germany), Rajendra Shende (Technology, Education, Research and Rehabilitation for the Environment - TERRE Policy Centre), Anne Siemons (Institute for Applied Ecology, Germany), VU University Amsterdam), Erin Sills (North Carolina State University), Thomas Spencer (Sustainable Development and International Relations - IDDRI), Jaime Webbe (United Nations Environment Programme), Oscar Widerberg (Institute for Environmental Studies (IVM)), Michael Wolosin (Climate Advisers), Zhao Xiusheng (Tshingua University)
Editorial team
Anne Olhoff (UNEP DTU Partnership), John Christensen (UNEP DTU Partnership), Paul Burgon (independent consultant), Riyong Kim Bakkegaard (UNEP DTU Partnership) Editorial Support: Cecilie Larsen (UNEP DTU Partnership), Marco Schletz (UNEP DTU Partnership)
Project coordination
Anne Olhoff (UNEP DTU Partnership), John Christensen (UNEP DTU Partnership), Cecilie Larsen (UNEP DTU Partnership), Paul Burgon (independent consultant), Riyong Kim Bakkegaard (UNEP DTU Partnership), Volodymyr Demkine (United Nations Environment Programme)
Media support
Shereen Zorba (United Nations Environment Programme), Fanina Kodre (United Nations Environment Programme), Michael Logan (United Nations Environment Programme), Kelvin Memia (United Nations Environment Programme), Tamiza Khalid (United Nations Environment Programme), Waiganjo Njoroge (United Nations Environment Programme), Mette Annelie Rasmussen (UNEP DTU Partnership)
Assessment webpage on UNEP Live
Simone Targettiferri (United Nations Environment Programme)
INDC assessment and gap calculations
Michel den Elzen (PBL Netherlands Environmental Assessment Agency), Hanna Fekete (NewClimate Institute), Niklas Höhne (NewClimate Institute)
External modelling data contributors
Alterra / Wageningen University and Research (Chapter 6) Centre for Policy Research, India (Chapter 3) (Navroz K. Dubash) Climate Action Tracker (Chapter 3)
Climate Advisers (Chapter 3)
Climate Interactive (Chapter 3) (Lori Siegel)
Danish Energy Agency (Chapter 3) (Steffen Dockweiler) Energy Research Institute, China (Chapter 3) (Chenmin He and Kejun Jiang)
Fondazione Eni Enrico Mattei (Chapter 3) International Energy Agency (Chapter 3)
International Institute for Applied Systems Analysis (Chapter 3) London School of Economics and Political Science (Chapter 3) (Joe Cranston Turner, Rodney Boyd and Bob Ward)
National Center for Climate Strategy and International Cooperation (Chapter 3)
National Institute for Environmental Studies, Japan (Chapter 3) (Tatsuya Hanaoka)
PBL Netherlands Environmental Assessment Agency (Chapter 3)
Potsdam Institute for Climate Impact Research (Chapter 3) The Energy Resources Institute (Chapter 3) (Manish Shrivastava) United States Environmental Protection Agency (Chapter 3) University of Melbourne (Chapter 3) (Malte Meinshausen) World Resources Institute (Chapter 3)
Thanks also to
Jørgen Fenhann (UNEP DTU Partnership), Christina Power (United Nations Environment Programme), Gemma Shepherd (United Nations Environment Programme), Lene Thorsted (UNEP DTU Partnership), Fabian Twerdy (Federal Environment Agency of Germany), United Nations Reducing Emissions from Deforestation and forest Degradation Programme (UN-REDD)
Design, layout and printing
Audrey Ringler (United Nations Environment Programme), Jennifer Odallo, UNON Publishing Services (ISO 14001:2004 certified), Caren Weeks (independent consultant)
vi
vi The Emissions Gap Report 2015 – Contents
Contents
Acknowledgements ...iv Glossary ...vii Acronyms ...xii Foreword ...xiv Executive Summary ...xvChapter 1: Scoping the 2015 report ... 1
1.1 Moving towards a new international climate change agreement ...1
1.2 Key questions ...1
1.3 Aim of the report and assessment principles ...2
1.4 INDC assessment process ...2
1.5 Organization of the report ...2
PART I THE EMISSIONS GAP Chapter 2: The importance of pre-2020 action ... 3
2.1 Introduction ...3
2.2 Global emission pathways and the importance of enhanced action ...3
2.3 Progress towards the 2020 pledges: a closer look at major economies ...7
Chapter 3: The emissions gap in 2025 and 2030 ...12
3.1 Introduction ...12
3.2 Broad characteristics of submitted INDCs ...14
3.3 Methodology for quantifying the effect of INDCs on global GHG emissions ...16
3.4 The effect of INDCs on global GHG emissions ...18
3.5 INDCs of G20 countries ...24
3.6 Concluding remarks ...27
PART II BRIDGING THE GAP Chapter 4: Opportunities for bridging the gap ...28
4.1 Introduction ...28
4.2 Ensuring coherence, synergy and complementarity between climate change, economic growth and sustainable development ...28
4.3 A robust, effective and transparent follow-up and review framework under the Paris Agreement is vital to narrow the emissions gap...29
4.4 Bridging the gap – realizing emission reduction potentials by 2020 and 2030 ...30
Chapter 5: International Cooperative Initiatives ...34
5.1 Introduction ...34
5.2 Quantitative impact of ICIs on emission reductions ...34
5.3 Non-state actors and the UNFCCC process ...36
5.4 Summary of initiatives ...36
5.5 The private sector and innovation in mitigation ...42
Chapter 6: Mitigation potential from forest-related activities and incentives for enhanced action in developing countries ...44
6.1 Introduction ...44
6.2 Global overview of forest-related mitigation engagement ...44
6.3 Forest-related mitigation opportunities ...46
6.4 Emission reduction potential of forest-related mitigation activities ...47
6.5 REDD+ as a key instrument to realize forest-related emission reductions in developing countries ...49
Annex 1: Country-specific findings ...51
Glossary
This glossary is compiled according to the Lead Authors of the report drawing on glossaries and other resources available on the websites of the following organizations, networks and projects: Center for International Forestry Research, Food and Agriculture Organization of the United Nations, Intergovernmental Panel on Climate Change, Non-State Actor Zone for Climate Action, United Nations Environment Programme, United Nations Framework Convention on Climate Change and World Resources Institute.
Adaptation: The process of adjustment to actual or expected climate and its effects. In human systems, adaptation seeks to moderate or avoid harm or exploit beneficial opportunities. In some natural systems, human intervention may facilitate adjustment to expected climate and its effects.
Additionality: A criterion sometimes applied to projects aimed at reducing GHG emissions. It stipulates that the emission reductions accomplished by the project must not have happened anyway had the project not taken place. Afforestation: Planting of new forests on lands that historically have not contained forests.
Agriculture, forestry and other land use: AFOLU plays a central role for food security and sustainable development. The main mitigation options within AFOLU involve one or more of three strategies: prevention of emissions to the atmosphere by conserving existing carbon pools in soils or vegetation or by reducing emissions of methane and nitrous oxide; sequestration—increasing the size of existing carbon pools and thereby extracting carbon dioxide (CO2) from the atmosphere; and substitution—substituting biological products for fossil fuels or energy-intensive products, thereby reducing CO2 emissions. Demand-side measures (for example, reducing losses and wastes of food, changes in human diet, or changes in wood consumption) may also play a role. FOLU (Forestry and Other Land Use)—also referred to as LULUCF (Land Use, Land-Use Change, and Forestry)—is the subset of AFOLU emissions and removals of GHGs resulting from direct human-induced land use, land-use change, and forestry activities excluding agricultural emissions.
Annex I Parties: The industrialized countries listed in Annex I to the Convention, which committed to returning their GHG emissions to 1990 levels by the year 2000 as per Article 4.2(a) and (b). They have also accepted emission targets for the period 2008-12 as per Article 3 and Annex B of the Kyoto Protocol. They include the 24 original OECD members, the European Union, and 14 countries with economies in transition (Croatia, Liechtenstein, Monaco and Slovenia joined Annex I at COP 3, and the Czech Republic and Slovakia replaced Czechoslovakia). See also Non-Annex I Parties. Annex II Parties: The countries listed in Annex II to the Convention which have a special obligation to provide financial resources and facilitate technology transfer to developing countries. Annex II Parties include the 24 original OECD members plus the European Union.
Baseline/reference: The state against which change is measured. In the context of transformation pathways, the term ‘baseline scenarios’ refers to scenarios that are based on the assumption that no mitigation policies or measures will be implemented beyond those that are already in force and/or are legislated or planned to be adopted. Baseline scenarios are not intended to be predictions of the future, but rather counterfactual constructions that can serve to highlight the level of emissions that would occur without further policy effort. Typically, baseline scenarios are then compared to mitigation scenarios that are constructed to meet different goals for GHG emissions, atmospheric concentrations or temperature change. The term ‘baseline scenario’ is used interchangeably with ‘reference scenario’ and ‘no policy scenario’. In much of the literature the term is also synonymous with the term ‘business-as-usual (BAU) scenario’, although the term ‘BAU’ has fallen out of favour because the idea of ‘business-as-usual’ in century-long socioeconomic projections is hard to fathom.
Biomass: The total mass of living organisms in a given area or volume, including products, by-products, and waste of biological origin (plants or animal matter) and excluding material embedded in geological formations and transformed to fossil fuels or peat.
viii
viii The Emissions Gap Report 2015 – Glossary
Biomass plus carbon capture and storage (BioCCS or BECCS): Use of energy produced from biomass where the combustion gases are then captured and stored underground or used, for example, in industrial processes. It excludes gases generated through, for example, a fermentation process (as opposed to combustion).
Black carbon: The substance formed through the incomplete combustion of fossil fuels, biofuels, and biomass, which is emitted in both anthropogenic and naturally occurring soot. It consists of pure carbon in several linked forms. Black carbon warms the Earth by absorbing heat in the atmosphere and by reducing albedo – the ability to reflect sunlight – when deposited on snow and ice.
Bottom-up model: In the context of this assessment, a model that represents a system by looking at its detailed underlying parts. Compared to so-called top-down models, which focus on economic interlinkages, bottom-up models of energy use and emissions can provide greater resolution with regards to sectors or mitigation technologies.
Business-as-usual: A scenario that describes future GHG emission levels in the absence of additional mitigation efforts and policies (with respect to an agreed set). In the 2014 EGR (page 5, para 2), BAU scenarios were based on an extrapolation of current economic, social and technological trends. They only took into account climate policies implemented up to around 2005-10 (that is, more recent country pledges and policies were not considered) and therefore served as a reference point for what would happen to emissions if planned climate mitigation policies were not implemented. See Baseline/reference.
Bunker fuels: A term used to refer to fuels consumed for international marine and air transport.
Cancun pledge: During 2010, many countries submitted their existing plans for controlling GHG emissions to the Climate Change Secretariat and these proposals were formally acknowledged under the UNFCCC. Developed countries presented their plans in the shape of economy-wide targets to reduce emissions, mainly up to 2020, while developing countries proposed ways to limit their growth of emissions in the shape of plans of action.
Carbon credits: An entitlement allocated by a government to a legal entity (company or other type of emitter) to emit a specified amount of a substance. These entitlements, which may be transferrable and tradable, can be used to reduce emissions of GHGs (by giving them a monetary value) or can be used for accounting of emissions.
Carbon dioxide emission budget: For a given temperature rise limit, for example a 1.5°C or 2°C long-term limit, the corresponding carbon budget reflects the total amount of carbon emissions that can be emitted to stay within that limit. Stated differently, a carbon budget is the area under a GHG emission trajectory that satisfies assumptions about limits on cumulative emissions estimated to avoid a certain level of global mean surface temperature rise.
Carbon dioxide equivalent: A way to place emissions of various radiative forcing agents on a common footing by accounting for their effect on climate. It describes, for a given mixture and amount of GHGs, the amount of carbon dioxide that would have the same global warming ability, when measured over a specified time period. For the purpose of this report, GHG emissions (unless otherwise specified) are the sum of the basket of GHG listed in Annex A to the Kyoto Protocol, expressed as carbon dioxide equivalents assuming a 100-year global warming potential.
Carbon intensity: The amount of emissions of carbon dioxide released per unit of another variable such as gross domestic product (GDP), output energy use or transport.
Carbon market: A popular (but misleading) term for a trading system through which countries may buy or sell units of GHG emissions in an effort to meet their national limits on emissions, either under the Kyoto Protocol or under other agreements, such as that among member states of the European Union. The term comes from the fact that CO2 is the predominant GHG, and other gases are measured in units called ‘CO2 equivalents’.
Carbon offset: See Offset.
Carbon price: The price for avoided or released CO2 or CO2-equivalent emissions. This may refer to the rate of a carbon tax or the price of emission permits. In many models that are used to assess the economic costs of mitigation, carbon prices are used as a proxy to represent the level of effort in mitigation policies.
Carbon sequestration: The process of removing carbon from the atmosphere and depositing it in a reservoir.
Carbon sink: A pool (reservoir) that removes carbon from the active part of the carbon cycle.
Carbon stock: The quantity of carbon contained in a carbon pool.
Carbon tax: A levy on the carbon content of fossil fuels. Because virtually all of the carbon in fossil fuels is ultimately emitted as carbon dioxide, a carbon tax is equivalent to an emission tax on CO2 emissions.
Co-benefits: The positive effects that a policy or measure aimed at one objective might have on other objectives, without yet evaluating the net effect on overall social welfare. Co-benefits are often subject to uncertainty and depend on, among others, local circumstances and implementation practices. Co-benefits are often referred to as ancillary benefits.
Conditional INDCs: INDCs proposed by some countries that are contingent on a range of possible conditions, such as the ability of national legislatures to enact the necessary laws, ambitious action from other countries, realization of finance and technical support, or other factors.
Conference of the Parties (COP): The supreme body of the Convention. It currently meets once a year to review the Convention’s progress.
Current policy trajectory: This trajectory is based on estimates of 2020 emissions considering projected economic trends and current policy approaches including policies at least through 2012. Estimates may be based on either official data or independent analysis.
Decarbonization: The process by which countries or other entities aim to achieve a low-carbon economy, or by which individuals aim to reduce their carbon consumption. Deforestation: The direct human-induced conversion of forested land to non-forested land (Marrakesh Accords). The conversion of forest to another land use or the long-term reduction of the tree canopy cover below the minimum 10 per cent threshold.
Degradation (forest): Changes within the forest that negatively affect the structure or function of the forest stand or site, and thereby lower its capacity to supply products and services. Delayed-action scenarios: See Later-action scenarios. Double counting: In the context of this assessment, double counting refers to a situation in which the same emission reductions are counted towards meeting two countries’ pledges. Emissions gap: The difference between the GHG emission levels consistent with having a likely chance (>66 per cent) of limiting the mean global temperature rise to below 2°C or 1.5°C in 2100 above pre-industrial levels and the GHG emission levels consistent with the global effect of the INDCs, assuming full implementation from 2020.
Emission pathway: The trajectory of annual GHG emissions over time.
Forest: Land spanning more than 0.5 ha with trees higher than 5 m and a canopy cover of more than 10 per cent, or trees able to reach these thresholds in situ. It does not include land that is predominantly under agricultural or urban land use.
Forest landscape restoration: A process which aims to regain ecological integrity and enhance human wellbeing in deforested or degraded forest landscapes to meet present and future needs and accommodate multiple uses over time. Global warming potential: An index representing the combined effect of the differing times GHGs remain in the atmosphere and their relative effectiveness in absorbing outgoing infrared radiation.
Greenhouse gases (GHGs): The atmospheric gases responsible for causing global warming and climatic change. The major GHGs are carbon dioxide (CO2), methane (CH4) and nitrous oxide (N2O). Less prevalent, but very powerful, GHGs are hydrofluorocarbons (HFCs), perfluorocarbons (PFCs) and sulphur hexafluoride (SF6).
Grid parity: This occurs when an alternative energy source can generate power at a levelized cost of electricity (LCOE) that is less than or equal to the price of purchasing power from the electricity grid.
Gross domestic product (GDP): The sum of gross value added, at purchasers’ prices, by all resident and non-resident producers in the economy, plus any taxes and minus any subsidies not included in the value of products in a country or geographic region for a given period, normally one year. GDP is calculated without deducting for depreciation of fabricated assets or depletion and degradation of natural resources. ‘Hot air’: Refers to the concern that some governments will be able to meet their targets for GHG emissions under any formal agreement with minimal effort and could then flood the market with emission credits, reducing the incentive for other countries to cut their own domestic emissions. Integrated assessment models: Models that seek to combine knowledge from multiple disciplines in the form of equations and/or algorithms in order to explore complex environmental problems. As such, they describe the full chain of climate change, from production of GHGs to atmospheric responses. This necessarily includes relevant links and feedbacks between socio-economic and biophysical processes.
Intended nationally determined contribution (INDC): Submissions by Parties which identify actions each national government intends to take under the future UNFCCC climate agreement, due to be negotiated in Paris in December 2015. INDCs are, in effect, the basis of post-2020 global emission reduction commitments that will be included in the future climate agreement.
International cooperative initiatives (ICIs): Initiatives outside the United Nations Framework Convention on Climate Change aimed at reducing emissions of climate forcers by, for example, promoting actions that are less GHG intensive, compared to prevailing alternatives. Cooperative initiatives also involve national and sub-national partners (they are often referred to as, simply, ‘cooperative initiatives’). Kyoto Protocol: An international agreement, standing on its own, and requiring separate ratification by governments, but linked to the UNFCCC. The Kyoto Protocol, among other things, sets binding targets for the reduction of GHG emissions by industrialized countries.
Land use, land-use change and forestry (LULUCF): A GHG inventory sector that covers emissions and removals of GHGs resulting from direct human-induced land use, land-use change and forestry activities.
Later-action scenarios: Climate change mitigation scenarios in which emission levels in the near term, typically up to 2020 or 2030, are higher than those in the corresponding least-cost scenarios.
Leakage: That portion of cuts in GHG emissions by developed countries – countries trying to meet mandatory limits under
xx The Emissions Gap Report 2015 – Glossary
the Kyoto Protocol – that may reappear in other countries not bound by such limits. For example, multinational corporations may shift factories from developed to developing countries to escape restrictions on emissions. Least-cost scenarios: Climate change mitigation scenarios assuming that emission reductions start immediately after the model base year, and are distributed optimally over time, sectors and regions, such that aggregate costs of reaching the climate target are minimized.
Likely chance: A likelihood greater than 66 per cent chance. Used in this assessment to convey the probabilities of meeting temperature limits.
Lock-in: Lock-in occurs when a market is stuck with a standard even though participants would be better off with an alternative.
Medium chance: A likelihood of 50–66 per cent chance. Used in this report to convey the probabilities of meeting temperature limits.
Mitigation: In the context of climate change, a human intervention to reduce the sources, or enhance the sinks of GHGs. Examples include using fossil fuels more efficiently for industrial processes or electricity generation, switching to solar energy or wind power, improving the insulation of buildings and expanding forests and other ‘sinks’ to remove greater amounts of CO2 from the atmosphere.
Monitoring, reporting and verification: A process/concept that potentially supports greater transparency in the climate change regime.
Montreal Protocol: The Montreal Protocol on Substances that Deplete the Ozone Layer is an international treaty that was designed to reduce the production and consumption of ozone-depleting substances in order to reduce their abundance in the atmosphere, and thereby protect the Earth’s ozone layer.
Mosaic restoration: This integrates trees into mixed-use landscapes, such as agricultural lands and settlements, where trees can support people through improved water quality, increased soil fertility, and other ecosystem services. This type of restoration is more likely in deforested or degraded forest landscapes with moderate population density (10-100 people/km2).
Net negative emissions: A situation of net negative emissions is achieved when, as a result of human activities, more GHGs are sequestered or stored than are released into the atmosphere.
No-policy scenario: See Baseline/reference.
Non-Annex I Parties: The countries that have ratified or acceded to the UNFCCC that are not included in Annex I of the Convention.
Non-state actor: In the context of climate action, ‘non-state actor’ includes companies, cities, subnational regions and
investors. More broadly, non-state actors have been defined as entities that participate or act in international relations. They are organizations with sufficient power to influence and cause a change even though they do not belong to any state institution.
Offset (in climate policy): A unit of CO2-equivalent emissions
that is reduced, avoided, or sequestered to compensate for emissions occurring elsewhere.
Party: A state (or regional economic integration organization such as the EU) that agrees to be bound by a treaty and for which the treaty has entered into force.
Pledge case: This case identifies the maximum level of GHG emissions that each country or Party could emit in 2020 and still meet its pledge – without considering the use of offsets. Readiness: REDD+ country actions – including capacity building, policy design, consultation and consensus building, and testing and evaluation of a REDD+ national strategy – that are taken prior to the comprehensive implementation of REDD+. REDD+: Reducing emissions from deforestation and forest degradation in developing countries; and the role of conservation, sustainable management of forests and enhancement of forest carbon stocks in developing countries.
Reference scenario: See Baseline/reference.
Reforestation: Planting of forests on lands that have previously contained forests but that have been converted to some other use.
Rehabilitation (forest): Restoration of the capacity of degraded forest land to deliver forest products and services. Forest rehabilitation re-establishes the original productivity of the forest and some, but not necessarily all, of the plant and animal species thought to be originally present at a site. Restoration forest: Restoration of a degraded forest to its original state – that is, to re-establish the presumed structure, productivity and species diversity of the forest originally present at a site.
Results-based payments: Payments for fully measured, reported and verified emission reductions (or removals), also conditional upon the country having a national strategy/action plan for REDD+, a national forest monitoring system, national forest reference emission level and/or forest reference level, a safeguard information system and a summary of information on how safeguards have been addressed and respected.
Scenario: A description of how the future may unfold based on ‘if-then’ propositions. Scenarios typically include an initial socio-economic situation and a description of the key driving forces and future changes in emissions, temperature or other climate change-related variables.
Sink: Any process, activity or mechanism which removes a GHG, an aerosol or a precursor of a GHG from the
atmosphere. Forests and other vegetation are considered sinks because they remove CO2 through photosynthesis. Source: Any process, activity or mechanism that releases a GHG, an aerosol or a precursor of a GHG or aerosol into the atmosphere.
Sustainable development: Development that meets the needs of the present without compromising the ability of future generations to meet their own needs.
Technology transfer: A broad set of processes covering the flows of know-how, experience and equipment for mitigating and adapting to climate change among different stakeholders. Temperature overshoot: An emission pathway that temporarily exceeds target temperature limits (2°C or 1.5°C) before falling below the limits again by 2100 with a given percentage chance.
Tipping point: A level of change in system properties beyond which a system reorganizes, often abruptly, and does not return to the initial state even if the drivers of the change are abated. For the climate system, it refers to a critical threshold when global or regional climate changes from one stable state to another stable state. The tipping point event may be irreversible.
Top-down model: A model that applies macroeconomic theory, econometric and/or optimization techniques to aggregate economic variables. Using historical data on consumption, prices, incomes, and factor costs, top-down models assess demand and emissions for goods and services from main sectors, such as energy conversion, transportation, buildings, agriculture and industry.
Transient climate response: Measure of the temperature rise that occurs at the time of a doubling of carbon dioxide concentration in the atmosphere.
Transient climate response to cumulative carbon emissions: Measure of temperature rise per unit of cumulative carbon emissions.
Uncertainty: A cognitive state of incomplete knowledge that can result from a lack of information or from disagreement about what is known or even knowable. It may have many types of sources, from imprecision in the data to ambiguously defined concepts or terminology, or uncertain projections of human behaviour. Uncertainty can therefore be represented by quantitative measures (for example a probability density function) or by qualitative statements (for example reflecting the judgement of a team of experts).
Unconditional INDCs: INDCs proposed by countries without conditions attached.
Wide-scale restoration: Aims to restore closed forests to the landscape. This type of restoration is more likely in deforested or degraded landscapes with low population density (<10 people/km2) that are also areas where closed
forests formerly dominated the landscape. 2020 pledge: See Cancun pledge.
20th–80th percentile range: Results that fall within the 20–80
per cent range of the frequency distribution of results in this assessment.
xii
xii The Emissions Gap Report 2015 – Acronyms
Acronyms
AFOLU agriculture, forestry and other land use AR5 fifth Assessment Report of the
Intergovernmental Panel on Climate Change BAU business as usual
BC black carbon
BECCS biomass plus carbon capture and storage (or BioCCS)
BELC Business Environmental Leadership Council BRT Bus Rapid Transit
cAIT Climate Analysis Indicators Tool cAT Climate Action Tracker
CBD Convention on Biological Diversity cCR carbonn Climate Registry
CCS carbon capture and storage
cdKn Climate and Development Knowledge Network
cdM Clean Development Mechanism cdp Carbon Disclosure Project (now ‘CDP’) CER certified emission reduction
cFc chlorofluorocarbon CH4 methane
CISL Cambridge Institute for Sustainability Leadership
co2 carbon dioxide
co2e carbon dioxide equivalent CoM Covenant of Mayors
cop Conference of the Parties to the UNFCCC CRF common reporting format (of the UNFCCC) C-ROADS Climate Rapid Overview and Decision
Support
CSI Cement Sustainability Initiative CSP concentrating solar power deA Danish Energy Agency
EDGAR Emissions Database for Global Atmospheric Research
eeA European Environment Agency EHCC Earth Hour City Challenge ERI Energy Research Institute
ER-PIN Emission Reductions Program Idea Note (in FCPF)
ERU emission reduction unit
EU-ETS European Union Emissions Trading System FAo Food and Agriculture Organization of the
United Nations
FcpF Forest Carbon Partnership Facility FF&I fossil fuels and industry
FIA Federation Internationale de l’Automobile FLR forest landscape restoration
FS-UNEP Frankfurt School - UNEP Collaborating Centre for Climate and Sustainable Energy Finance
GDP gross domestic product GEA Global Energy Assessment GFEI Global Fuel Economy Initiative GHG greenhouse gas
GLOBIOM global biosphere management model GPC Global Protocol for Community-scale GHG
Emissions Gt gigatonne
GWP global warming potential G4M global forest model HFC hydrofluorocarbon
IAM integrated assessment model
IcAo International Civil Aviation Organization IcI international cooperative initiative IcLeI International Council for Local
Environmental Initiatives
ICRAF World Agroforestry Centre (formerly International Centre for Research in Agroforestry)
IDDRI Institut du Developpement Durables et des Relations Internationales
IeA International Energy Agency
IIASA International Institute for Applied Systems Analysis
IIMA Indian Institute of Management, Ahmedabad
IMo International Maritime Organization Indc Intended Nationally Determined
Inpe National Institute for Space Research Ipcc Intergovernmental Panel on Climate Change IPPU industrial processes and product use (IPCC
sector)
IRENA International Renewable Energy Agency IUCN International Union for Conservation of
Nature
JRC Joint Research Centre (European Commission)
LIMITS Low climate IMpact scenarios and the Implications of required Tight emission control Strategies
LSE London School of Economics and Political Science
LULUCF land use, land-use change and forestry McpA Mayors’ Climate Protection Agreement
(USA)
MRV monitoring, reporting and verification Mtco2e million metric tons of CO2 equivalent nAMA Nationally Appropriate Mitigation Action nAp National Adaptation Plan
nAZcA Non-State Actor Zone for Climate Action NCSC National Center for Climate Strategy and
International Cooperation nF3 nitrogen trifluoride
NGO non-governmental organization
NIES National Institute for Environmental Studies nydF New York Declaration on Forests
n2o nitrous oxide oc organic carbon
ODS ozone-depleting substances
oecd Organisation for Economic Cooperation and Development
opIc Overseas Private Investment Corporation pAM policies and measures
pFc perfluorocarbon
pIK Potsdam Institute for Climate Change Research
PRIMAP potsdam Real-time Integrated Model for probabilistic Assessment of emission paths pv photovoltaic
REALU reducing emissions from all land uses REDD+ Reduced Emissions from Deforestation
and forest Degradation Plus in developing countries (includes sustainable management and enhancement of forest carbon stocks) SBT science-based targets
SDG Sustainable Development Goal SE4ALL Sustainable Energy for All SEAP Sustainable Energy Action Plan SF6 sulphur hexafluoride
SIDS small island developing states SLCF short-lived climate forcers SOC soil organic carbon TCR transient climate response UCL University College London
UCLG United Cities and Local Governments ULCOS ultra-low CO2 steelmaking
UNCCD United Nations Convention to Combat Desertification
UNEP United Nations Environment Programme UNEP-DTU UNEP-Technical University of Denmark UNEP-WCMC UNEP-World Conservation Monitoring
Centre
UNFCCC United Nations Framework Convention on Climate Change
UNGA United Nations General Assembly UNORCID United Nations Office for REDD+
Coordination in Indonesia
WBCSD World Business Council for Sustainable Development
WHRC Woods Hole Research Center
WMccc World Mayors Council on Climate Change WRI World Resources Institute
The Emissions Gap Report 2015 – Chapter Name xiv
xiv The Emissions Gap Report 2015 – Foreword
Achim Steiner
UN Under-Secretary-General, UNEP Executive Director
Foreword
Following the historic signing of the 2030 Agenda for Sustainable Development, this sixth edition of the UNEP Emissions Gap Report comes as world leaders start gathering in Paris to establish a new agreement on climate change. The report offers an independent assessment of the mitigation contributions from the Intended Nationally Determined Contributions (INDC) committed to by 1 October 2015, by the 146 countries that account for around 90 per cent of global emissions. It compares the 2030 emission levels that would result from these commitments with what science tells us would keep average temperature increases on track to stay below 2°C by the end of the century; it provides data for an aspirational target of keeping that increase below 1.5°C; and it evaluates the INDCs in relation to progress on the 2020 pledges made in Cancun.
The INDCs demonstrate a significant increase in ambition and their successful delivery could reduce emissions by around 25 per cent compared to the level expected from current policies and pledges. However, this would still put long-term temperatures on track for an increase and lead to serious climate impact, so more action is required.
Therefore, the Emissions Gap Report also explores how available financial, technical and capacity building solutions can be scaled up, or even accelerated, to close the gap between the expected and required levels of emissions. This includes detailed assessments that look beyond the INDCs to identify the further gains being identified by the International Cooperative Initiatives and by Reducing Emissions from Deforestation and Forest Degradation (REDD+).
With many new emission reduction initiatives also generating substantial economic, social and environmental benefits, the INDC preparation process in most countries encouraged greater exploration of the links between development and climate. This is an important first step in a possible transition towards more low carbon economies.
The Emissions Gap Report makes it very clear that while reaching a meaningful global agreement in Paris is essential, it is not the end of the climate change story: it is a stepping stone on a much longer journey that requires us to stay alert to the science and remain dynamic in our response. The world has already tripled the expected performance on scaling up clean energy and been able to start reversing damage to the ozone layer.
I firmly believe that if we act on the findings of this report, there is nothing to stop us closing the emissions gap and creating a more inclusive and sustainable future for both the developed and the developing world.
Executive Summary
The year 2015 has the potential to become a turning point in global efforts to transform the prevailing social and economic development paradigm into a more sustainable one.The global community reached agreement in September 2015 on a set of 17 sustainable development goals to be achieved by 2030, including climate change. Countries will meet again at the United Nations Framework Convention on Climate Change (UNFCCC) 21st Conference of the
Parties (COP 21) in Paris with the aim of establishing a new global agreement on climate change, hereafter the ‘Paris Agreement’, with the ambition of limiting changes in global temperatures to below 2°C or 1.5°C warming in 2100 compared to pre-industrial levels. The Paris Agreement will also aim to establish a framework to provide technological and financial support for developing countries to accelerate the transition towards low carbon and climate resilient development paths.
The architecture of a new climate agreement has many facets with an array of issues under negotiation that have become significantly more complex since the Framework Convention on Climate Change entered into force in 1994. The core structure of the Paris Agreement will comprise the “Intended Nationally Determined Contributions” (INDCs) as well as the process by which implementation of the agreement will proceed over time to advance the objectives of the UNFCCC. In addition, a number of key decisions will be required covering issues like adaptation, finance, technology, and capacity building.
1. What is covered in the 2015 Emissions
Gap Report?
This sixth UNEP Emissions Gap Report provides a scientific assessment of the mitigation contributions from the submitted INDCs. As in the previous reports, it then compares the resulting emission levels in 2030 with what science tells us is required to be on track towards the agreed target of a global average temperature increase below 2°C
by 2100. The Report also provides data for the aspirational target of keeping the temperature increase below 1.5°C. In addition, the Report presents selected areas where enhanced action can be taken, accelerated and scaled up to close the emissions gap.
The 2015 Emissions Gap Report addresses the following key questions:
• What are the latest estimates of 2025 and 2030 total global emissions levels consistent with the goal of holding the global average temperature rise below 2°C or 1.5°C above pre-industrial levels by 2100? • What is the progress on implementation of the
Cancun pledges for the period to 2020?
• Will the combined INDC commitments for 2030 (if fully implemented) be sufficient to stay within the range consistent with the 2°C temperature goal? • What are possible contributions in selected key
areas, where action can be accelerated to enhance the ambition of national pledges both in the period before and after the expected entry into force in 2020 of the Paris Agreement? This year the detailed assessment is on possible mitigation contributions from International Cooperative Initiatives (ICIs) and enhanced forest-related mitigation activities with a focus on Reducing Emissions from Deforestation and Forest Degradation (REDD+).
By 1 October 2015, a total of 119 INDCs had been submitted to the UNFCCC. Fifteen INDCs included only mitigation, while most included both adaptation and mitigation components. The report only presents qualitative information about the adaptation component of the INDCs submitted.
The report has been prepared by an international team of leading scientists assessing all available information, including that reviewed by the IPCC in its fifth assessment report, as well as more recent scientific studies. The assessment production process has been transparent and participatory. The assessment methodology and preliminary findings were made available to governments and stakeholders concerned
xvi
xvi The Emissions Gap Report 2015 – Executive summary
during relevant international fora as well as on the UNEP Live website. The governments of the countries with specific mention in the report have been invited to comment on the assessment findings.
2. What are current emissions and what
emission levels in 2030 are consistent
with the 2°C and the 1.5°C targets?
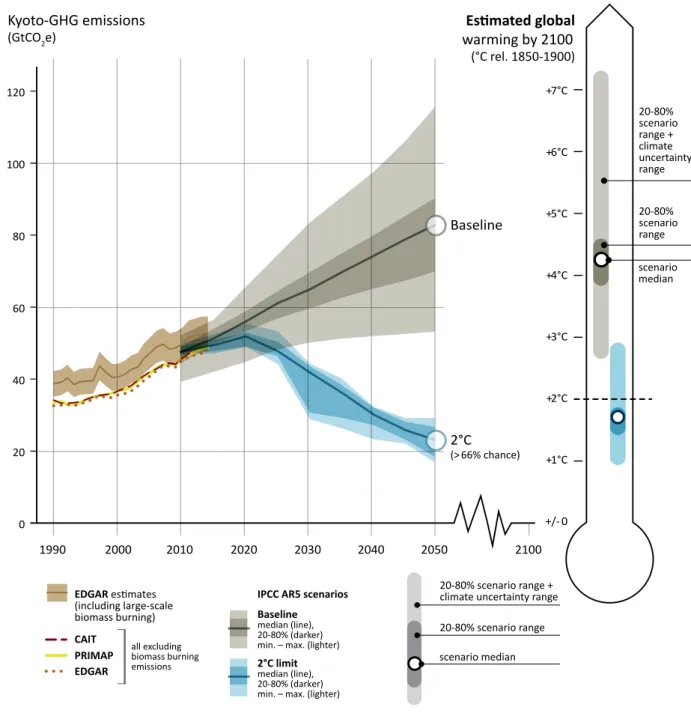
Over the past decades global GHG emissions have been increasing steadily, with small variations around a longer-term trend.
The most recent global emission estimates1 are available for
the year 2014. In that year, total global Kyoto-GHG emissions2
amounted to about 52.7 GtCO2e (range: 47.9-57.5). Global
carbon-dioxide (CO2) emissions from fossil-fuel and industry were estimated at 35.5 GtCO2 for 2014 (range: 32.5-38.5). Staying below 2°C temperature rise implies that CO2 emissions are reduced to net zero by 2060-2075.
The IPCC in its fifth assessment report concluded that to limit global warming to below 2°C, the remaining cumulative CO2 emissions – the so-called carbon budget – are in the order of 1 000 GtCO2. This remaining budget can be utilized in different ways, but given the most recent assessment of current trends, net global carbon emissions will eventually need to be reduced to zero between 2060 and 20753. For
a detailed discussion of the carbon budget, see the 2014 Emissions Gap Report.
____________________
1 Data for 2014 are available from EDGAR and PRIMAP, see Chapter 2.
2 The six greenhouse gases covered by the UNFCCC/Kyoto Protocol — carbon dioxide, methane, nitrous oxide, hydrofluorocarbons, perfluorocarbons and sulphur
hexafluoride. Here aggregated with 100-year Global Warming Potentials (GWPs) of the IPCC Second Assessment Report.
3 Based on the final released IPCC AR5 scenarios database data.
1990 2000 2010 2020 2030 2040 2050 2100 120 100 80 60 40 20 0 + 7°C + 6°C + 5°C + 4°C + 3°C +2°C + 1°C +/- 0 Kyoto-GHG emissions (GtCO2e) scenario median 20-80% scenario range 20-80% scenario range + climate uncertainty range warming by 2100 (°C rel. 1850-1900) scenario median 20-80% scenario range + climate uncertainty range 20-80% scenario range Baseline 2°C (>66% chance) EDGAR estimates (including large-scale biomass burning)
IPCC AR5 scenarios Baseline
median (line), 20-80% (darker) min. – max. (lighter)
2°C limit
median (line), 20-80% (darker) min. – max. (lighter) all excluding biomass burning emissions PRIMAP CAIT EDGAR
The 2015 Report presents an updated set of possible pathways to stay within this budget, and also includes an updated assessment of the pathways and requirements to stay within the more ambitious 1.5°C temperature goal. The median emission level in 2030 in scenarios that have a >66 per cent chance of keeping temperature increase to below 2°C by the end of the century is 42 GtCO2e (range: 31-44). The similar level for a 1.5°C pathway is 39 GtCO2e4.
The trajectories for the two target levels are similar in many aspects, but earlier and much stronger action is necessary for the 1.5°C target to be kept.
As reflected in last year’s report, the focus for the gap assessment has shifted from 2020 to 2030, reflecting that the underlying scenarios assume emission levels that are consistent with the Cancun pledges until 2020. Least-cost enhanced emission reduction pathways are only assumed from 2020. Earlier analysis assumed the world would move onto a least-cost pathway by 2010. Current trends indicate that this will not be the case, and accordingly the new set of scenarios from the IPCC, which are referenced in this report, include only those that assume least-cost pathways starting from 2020.
3. What are the implications of the
scenarios that are consistent with the
temperature goals?
The scenarios used in this Report as reference for meeting the 2°C and 1.5°C goals are all characterized by modest emissions reductions compared to current policies until 20205 that are in line with the ambition of Cancun pledges.
This implies a need for deep and stringent emission reductions over later decades. Enhanced action before 2020 that would bring emission levels below the projected 2020 Cancun pledge level would ease the challenge and reduce overall cost of transitioning to least-cost pathways after 2020. It should be noted that in order to move to such pathways after 2020, the necessary policies and investment will need to be prepared well in advance.
The assessment of the pathways and target levels point at three key issues that have also been raised in previous gap reports:
• All scenarios analyzing 2°C pathways that follow the Cancun pledges until 2020 and with a least-cost starting point in 2020, require strong reductions after 2020. They also rely on so-called ‘negative emission technologies’ such as bioenergy combined with carbon capture and storage
• For scenarios analyzing the 1.5°C target, the reduction rates will need to be steeper
• The feasibility of large scale deployment of negative emission technologies is still a contentious issue.
Enhanced early action (such as moving below the 2020 pledges) is associated with the following economic and technological advantages:
• Softening the requirement for very steep emission reductions over the medium term
• Facilitating mitigation in the medium to long term by reducing lock-in of carbon and energy intensive infrastructure in the energy system and society as a whole
• Encouraging near-term learning and development of technologies that will be essential in the long term • Providing early policy signals which are needed for
action later in the coming decades
• Reducing the overall costs and economic challenges in terms of, for example, upscaling of energy investments, during the transitional period
• Reducing the dependence on unproven technologies and increase the options society can choose from in terms of means to achieve stringent emission reductions in the long term.
Delaying stringent mitigation efforts until 2030 (in other words, not following a least-cost reduction trajectory after 2020) would with high confidence make the transition to longer-term emissions levels in line with the 2°C goal significantly more difficult. A significant number of models are not able to produce 2°C scenarios consistent with global emission levels in 2030 above 55 GtCO2e, while other scenarios which delay enhanced mitigation action until after 2030 would imply massive cost increases coupled with a need for unprecedented political action.
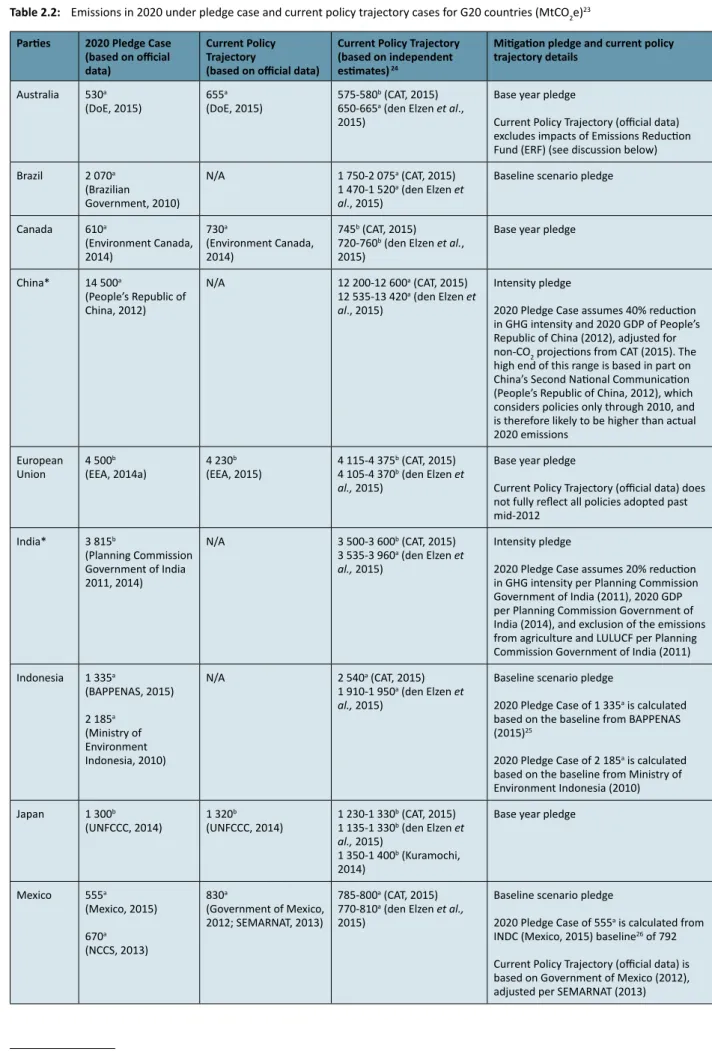
4. Are G20 countries making progress on the
implementation of 2020 pledges?
Among the G20 there are thirteen countries with pledges for 2020 (counting the EU members France, Germany, Italy and UK as one) and three countries without pledges. Six of these are assessed as being on track to meet pledges or extremely close, four are not, and three cannot be assessed, because there is insufficient evidence.
Pledges are self-determined. A country being on track does not necessarily mean that it undertakes more stringent action on mitigation than a country that is not on track – it depends on the ambition of the pledge.
The report presents an assessment of progress by G20 countries on the national pledges presented in the context of the Cancun agreement, and referred to here as the Cancun pledges. The assessment compares projected 2020 emissions under three cases:
• Pledge case – projecting the maximum amount of emissions for 2020 compatible with the pledge • Current policy trajectory – official national estimate • Current policy trajectory – independent analysis. Despite progress towards implementing policies in line with pledges, it is evident that work remains to be done to bring all G20 countries into pledge attainment.
4 As there are fewer than 10 scenarios available for the 1.5°C pathways, the
20th to 80th percentile range is not provided. However, the minimum and
maximum values are 37 GtCO2e and 40 GtCO2e respectively.
5 Global emissions in 2020 under various pledge cases are estimated to be
about 52-54 GtCO2e. The least-cost 2020 scenarios used here have global
xviii
xviii The Emissions Gap Report 2015 – Executive summary
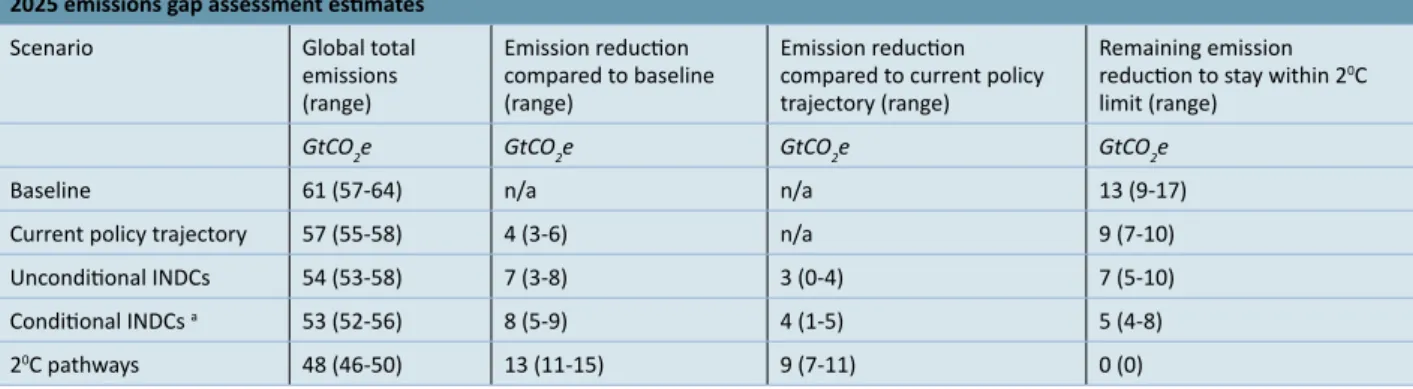
5. What is the emissions gap in 2025 and
2030 assuming full implementation of the
INDCs?
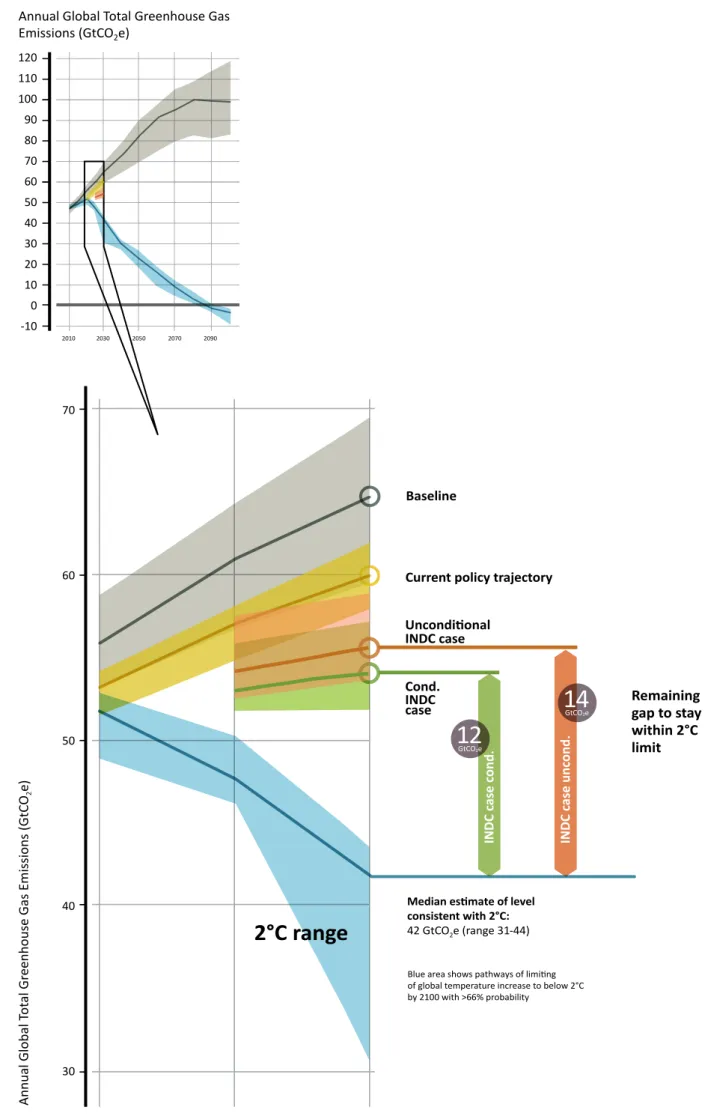
The emissions gap between what the full implementation of the unconditional INDCs contribute and the least-cost emission level for a pathway to stay below 2°C, is estimated to be 14 GtCO2e (range: 12-17) in 2030 and 7 GtCO2e (range: 5-10) in 2025. When conditional INDCs are included as fully implemented, the emissions gap in 2030 is estimated to be 12 GtCO2e (range: 10-15) and 5 GtCO2e (range: 4-8) in 2025. If countries that have not yet submitted an INDC were to reduce their emissions at the same percentage below current policy trajectories as those that have already submitted, the projected global emissions would be further reduced, and the gap narrowed, by a further 0.5 GtCO2e in 2025 and 1 GtCO2e in 2030.
Full implementation of unconditional INDC results in emission level estimates in 2030 that are most consistent with scenarios that limit global average temperature increase to below 3.5°C until 2100 with a greater than 66 per cent chance. INDC estimates do, however, come with uncertainty ranges. When taking this into account the 3.5°C value could decrease to 3°C or increase towards 4°C for the low and high unconditional INDC estimates, respectively. When including the full implementation of conditional INDCs, the emissions level estimates become most consistent with long-term scenarios that limit global average temperature increase to <3-3.5°C by the end of the century with a greater than 66 per cent chance.
These numbers essentially tell two stories. Firstly the INDCs do present a real increase in the ambition level compared to a projection of current policies; all global modelling groups that have been assessed reached this conclusion. Secondly the submitted contributions are far from enough and the emissions gap in both 2025 and 2030 will be very significant. The Report presents an assessment of the 119 INDCs submitted by 1 October 2015, covering 146 countries and 85-88 per cent of global GHG emissions in 2012. A final update of the assessment including later submissions will be presented on the UNEP Live website before the start of COP 21.
In the absence of agreed formats for reporting on mitigation contributions, including on the units in which those might be expressed, Parties have chosen a wide variety of forms and contributions: for example, targets used include:
• Economy-wide absolute reduction from historical base year emissions
• Emissions reduction relative to a baseline projection for the emissions associated with energy consumption • Trajectory target for specific sectors or gases • Specifying a peaking year
• Emissions intensity of GDP • A fixed level target.
This has increased the analytical challenge of ensuring consistency when comparing and aggregating different mitigation contributions. The assessment builds on a
combination of global and country-specific modelling studies from independent research teams, and official country-specific data sources.
The global emission levels in 2030 consistent with having a likely chance (>66 per cent) of staying below the 2°C goal in 2100, following a least-cost pathway from 2020 with only modest improvement of the GHG intensity until then, is 42 GtCO2e (range: 31-44). In 2025 this level is 48 GtCO2e (range: 46-50).
In comparison, global GHG emissions, based on assessment of the INDCs submitted by 1 October 2015, are for the unconditional INDCs projected to be at 54 GtCO2e (range: 53-58) in 2025, and 56 GtCO2e (range: 54-59) in 2030. If conditional INDCs are included, the global emissions projection is 53 GtCO2e (range: 52-56) in 2025 and 54 GtCO2e (range: 52-57) in 2030. The emission levels resulting from submitted INDCs are 4 to 6 GtCO2e lower than the current policy trajectory in 2030 of 60 GtCO2e (range: 58-62). They are 9 to 11 GtCO2e lower than the baseline of 65 GtCO2e (range: 60-70), which is based on IPCC AR5 scenarios and assumes no additional climate policies are put in place after 2010.
6. Can the INDC process become a
foundation for enhancing ambition?
It is clear from the assessment of the mitigation contributions from the INDCs that much more needs to be done. This round of INDCs should therefore be considered as the first step in building foundations for a successful global climate agreement. The social and political effects of the INDCs and the processes undertaken at national level transcend the aggregate effect they are estimated to have on total global GHG emission levels in 2025 and 2030. The preparation of the INDCs has in many countries incentivized exploration of linkages between development and climate, as well as development of new national climate polices, and can be seen as an important step in a transition towards low carbon economies.
The Paris Agreement can support these national transitions and provide the framework for mobilization of the enhanced mitigation effort that is required to align national efforts with the global mitigation ambition indicated by the 2°C pathways. Establishing a robust, effective and transparent follow-up and review framework as part of the Paris Agreement will be critical in this context.
The INDCs and options for enhanced mitigation action must be seen in the broader context of economic growth and sustainable development. The Sustainable Development Goals (SDGs) recently adopted in New York by Heads of State of all member states of the United Nations explicitly recognise the interdependence between the achievement of climate, development and sustainability goals and recommends prioritizing coherence, co-benefits, and complementarity between the SDGs and a climate change agreement under the UNFCCC.
The SDG Goal 13 “Take urgent action to combat climate change and its impacts” specifically acknowledges that the
2020
Baseline
Median estimate of level consistent with 2°C:
42 GtCO2e (range 31-44)
Blue area shows pathways of limiting of global temperature increase to below 2°C by 2100 with >66% probability Remaining gap to stay within 2°C limit 2030
Current policy trajectory
Cond. INDC case
2°C range
2010 2030 2050 2070 120 110 100 90 80 70 60 50 40 30 20 10 0 -10Annual Global Total Greenhouse Gas Emissions (GtCO2e) 2090 70 60 50 40 30 INDC case Unconditional