EYE TRACKING
IN B2B DIGITAL SELLING
ONLINE VIEWING BEHAVIOUR, WEB DESIGN PREFERENCE,
AND PURCHASE INTENTION
Aantal woorden/ Word count: 19.391
Frédérick Mainil
Studentennummer/ Student number: 01504741
Promotor/ Supervisor: Prof. dr. Steve Muylle
Commissaris/ Commissioner: Nils Van den Steen
Masterproef voorgedragen tot het bekomen van de graad van:
Master’s Dissertation submitted to obtain the degree of:
Master of Science in Business Engineering
Main subject: Data Analytics
Deze pagina is niet beschikbaar omdat ze persoonsgegevens bevat.
Universiteitsbibliotheek Gent, 2021.
This page is not available because it contains personal information.
Ghent University, Library, 2021.
ABSTRACT
Since consumerisation is predominant in the current business-to-business landscape, customer experience expertise could be a key differentiator reshaping the B2B e-commerce market. While prior studies mainly adopt self-reported traditional methods to examine conscious behaviour in the human-computer interaction, they lack to measure unconscious behaviour quantitatively. In this master’s dissertation, we conduct an exploratory eye tracking experiment to observe and evaluate human attention objectively, enabling us to give recommendations that increase the impact of visual design. By visually improving web design, one might enhance the user experience, and therefore the overall customer experience.
In our research, we simultaneously conduct a questionnaire survey and an eye tracking experiment, consisting of two cases that each show three different B2B e-marketplaces offering the same product. Our convenient sample was asked to rate the websites in terms of their web design preference and purchase intention. The online viewing behaviour was evaluated through the eye tracking experiment.
As a result, we came up with an initial exploratory relationship diagram. In this diagram, it becomes clear that web design preference is affected by the web design’s performance in terms of product description, structure, and contrast. The web design and current task influence online viewing behaviour. Further, web design preference and online viewing behaviour both have an impact on purchase intention. This impact is moderated by the prior experience and the professional look of the marketplace. A great level of consistency was found between web design preference and purchase intention for participants with significant working experience.
PREFACE
This master’s dissertation is written in order to obtain the degree of Master of Science in Business Engineering: Data Analytics at the University of Ghent.
First of all, I would like to thank Prof. dr. Steve Muylle for giving me a ‘wild card’ to study a topic in the domain of digitization in B2B sales. Due to the freedom of choice within this research topic, I was able to broaden my horizon in the B2B research field. As a result, I conducted an exploratory eye tracking experiment in B2B digital selling. This is something that I never heard from before I started this master’s dissertation journey. So, thank you Prof. dr. Steve Muylle for giving me the opportunity to study a topic of my own choice in the B2B research field.
Secondly, I would like to express my gratitude towards Nils Van den Steen for being such an awesome mentor. From the moment that I pitched my first ideas about conducting an eye tracking study, you were supportive and enthusiastic in a way that no other teaching assistant has ever been to me. On top of that, you were always available to give feedback on the most recent developments, and more importantly, you were there to take some pressure off in rather stressful situations. Moreover, I wish you all the best with the pursuit of your PhD and I hope we can crack a ‘cold one’ with your other thesis students after our defenses.
Thirdly, I would like to thank my family and my ‘family-in-law’ for helping and encouraging me during this journey. More specifically, I would like to thank Pieter Rottiers for lending me his laptop for more than three months. Without this device I would never be able to conduct my experiments so smoothly. In addition, I would also like to thank my girlfriend, Sarah Rottiers, for listening to my nagging and for supporting me during crucial moments.
Lastly, I would like to show my gratitude to the department of geography for lending me their eye tracker. On top of that, I would like to thank one particular person, Merve Keskin. Thank you for all your help and time during my quest for the optimal eye tracking set-up. I believe the result truly pays off.
To conclude this preface, I hope to inspire fellow students to be creative and to reinvent themselves in a field that they are not familiar with. Eye tracking is really cool, and I hope my work provides a great source of help.
IMPACT OF CORONA
The impact of the corona measures on this master’s dissertation is twofold.
First of all, conducting an eye tracking experiment on a ‘normal’ scale (i.e. 35 participants) was made impossible. Our initial subject intention that consisted of the employees of Crunch Analytics and some fellow students was impossible to reach due to the corona measures that were effective from the 16th of March on. Due to these restrictions, we had to come up with a convenient sample that mainly
consisted of people that are in my ‘bubble’. Luckily, these were mainly people with significant working experience, some even in the B2B industry. As a result, we conducted our experiment with a convenient sample of eight persons. More information about the pre-corona subject intention and the intra-corona subject reality can be found in the fourth section of the research methodology part.
Secondly, the feedback sessions with Nils Van den Steen were also organised differently due to the corona measures. In normal circumstances, we were invited to his office to discuss the latest developments. During the corona crisis, these feedback sessions were organised online. Skype was used in our case. Nevertheless, performing the feedback sessions online did not influence this master’s dissertation substantially. In addition, I would like to thank Nils Van den Steen once again for supporting us constantly, even in hard times like these. Thank you for your persistent effort.
This master’s dissertation was finalised on basis of the data collected before and during the corona crisis.
This preamble is drawn up in consultation between the student and the supervisor and is approved by both.
TABLE OF CONTENTS
Part 1: Introduction ... 1
1. Context ... 1
2. Research question ... 3
Part 2: Literature Review ... 4
Chapter 1: Eye tracking (as a part of neuro-marketing) ... 5
1. Situation within neuro-marketing ... 5
2. Eye tracking ... 6
Chapter 2: Web design ... 12
1. Strategies & Models ... 12
2. Webpages vs. Printed ads ... 14
Chapter 3: B2B vs. B2C ... 16
1. ‘The human touch’ ... 16
2. B2B website effectiveness ... 17
Part 3: Research Methodology ... 20
1. Research objective & aim ... 20
2. Nature of the research ... 20
3. Data collection journey ... 21
3.1 Eye tracking experiment ... 21
3.2 Questionnaire survey ... 30
4. Research participants ... 32
4.1 Pre-corona subject intention ... 32
4.2 Intra-corona subject reality ... 32
5. Data analysis ... 34
5.1 ‘Eye tracking data’ ... 34
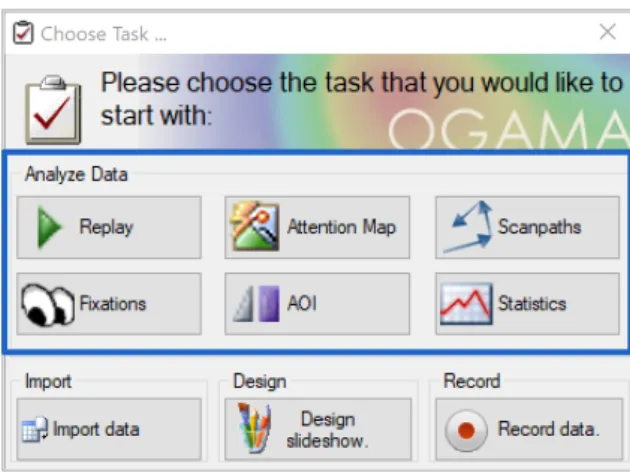
5.2 OGAMA’s data analysis submodules ... 34
6. Reliability and validity ... 39
Part 4: Results ... 41
1. Eye tracking experiment ... 41
2. Questionnaire survey ... 46
Part 5: Discussion & Conclusion ... 47
1. Online viewing behaviour ... 47
2. Web design preference ... 49
3. Purchase intention ... 50
4. Exploratory relationship diagram ... 52
5. Managerial & academic implications ... 53
6. Limitations & further research ... 55 BIBLIOGRAPHY ... I APPENDIX A ... VII
LIST OF ABBREVIATIONS
§ AOI: Area of Interest § B2B: Business-to-Business § B2C: Business-to-Consumer § LED: Light-Emitting Diode § PPC: Pay-per-Click
§ SERP: Search Engine Result Page § TTFF: Time to First Fixation
LIST OF FIGURES
Figure 1 Situation of this master’s dissertation within the literature ... 2
Figure 2 Venn diagram literature ... 4
Figure 3 Neuroscientific methods for B2B neuromarketing, obtained from ©Lim (2018) ... 5
Figure 4 Scan path consisting of fixations and saccades ... 8
Figure 5 Example of a heatmap ... 8
Figure 6 Emerging models of e-commerce Web site design, obtained from ©Wen, Chen & Hwang (2001) ... 13
Figure 7 Customer and end-user touchpoints, obtained from ©Angevine et al. (2018) ... 17
Figure 8 Ender-3 3D Printer Product Landing Page, obtained from ©Amazon.com (2020) ... 28
Figure 9 Recording Module OGAMA ... 29
Figure 10 Flowchart experiment ... 31
Figure 11 Data Analysis Submodules OGAMA ... 34
Figure 12 Output Fixations Module OGAMA ... 35
Figure 13 Output Scanpaths Module OGAMA ... 36
Figure 14 Output Attention Map Module OGAMA ... 36
Figure 15 OGAMA's workflow with the supporting modules ... 38
Figure 16 Attention Maps Amazon.com (both cases) ... 41
Figure 17 Attention Maps Bol.com (both cases) ... 42
Figure 18 Attention Maps Alibaba.com (both cases) ... 42
Figure 19 AOI Analysis Amazon.com (both cases) ... 44
Figure 20 AOI Analysis Bol.com (both cases) ... 44
Figure 21 AOI Analysis Alibaba.com (both cases) ... 45
Figure 22 Example of the spotted pattern ... 47
Figure 23 Example of the different AOIs ... 48
Figure 24 Assessment of the three websites in terms of description, structure, and contrast, followed by the overall ranking in terms of web design preference ... 50
PART 1: INTRODUCTION
1. CONTEXT
According to Statista, the global B2B e-commerce market was valued at 10.6 trillion USD in 2019, a fourfold of its B2C counterpart which was worth about 2.6 trillion USD in the same year. The B2B e-commerce market concerns the exchange of goods and services between businesses through an online platform. Amazon Business and Alibaba are two of the leading players in this market, where they serve as a marketplace for companies. From office supplies like post-its and staplers, to industrial supplies like 3D printers and hydraulic pumps, companies can practically purchase everything online, and in bulk. These two e-commerce giants even possess their own B2B mobile application, named Amazon Seller and Alibaba.com B2B Trade App.
Clearly, a lot of the innovation that has been happening in the consumer world is currently entering the business world and this may totally change the way businesses buy their supplies. These electronic marketplaces support all trade processes within the e-business process framework developed by Basu and Muylle (2011). Corporate customers are able to search for products, read product reviews, compare multiple offers, pay easily and check when the package will arrive. The actions mentioned can respectively be linked to the following trade processes: search, authentication, valuation, payment and logistics.
According to McKinsey & Company, “marketers have long drawn a bright line between consumer shoppers and business purchasers” (Lingqvist et al., 2015). Both of them clearly differ in terms of advertisement influences, product research thoroughness, purchase impulsivity, switching costs, formality of the buying process, etc. But, the snowballing of communication instruments and channels have increased the business purchaser’s expectations. Modern procurement procedures involve influencers and decision makers, additional to the corporate purchasers. However, each of them affected by their own consumer shopping experience. Therefore, “their behaviour has become more consumer-like” (Lingqvist et al., 2015). This phenomenon is often referred to as the consumerisation of B2B buying behaviour.
2 Since consumerisation is key in the current B2B landscape, customer experience expertise can be very valuable. According to an Accenture report1 on B2B customer experience, new entrants in the
industry use customer experience as their main differentiator. The report states that “two-thirds of executives said their company is considering or already acting as a new entrant in a different industry outside of its ‘traditional’ scope” (Wollan et al., 2015, p. 4). Customer experience insights can be seen as an enabler to disrupt or reshape markets – particularly by the newcomers. Further, the paper declares that “for a large majority of companies, digital – including web and mobile sales and service channels, and intelligent devices – will play an increasingly important role in their ability to act as disruptors” (Wollan et al., 2015, p. 4).
In order to understand how customers experience their human-computer interaction with a company, looking through your customer’s eyes may be a great opportunity. While doing so, it’s possible to focus on what really matters for the customer, because eyes don’t lie. A valuable tool in order to improve the user experience – a specific part of the customer experience that focusses on the website functionality and usability – are eye tracking studies. “The goal of eye tracking studies in marketing is to understand attention processes to marketing stimuli in real-life settings, and their determinants and consequences” (Wedel & Pieters, 2006, p. 295). Eye tracking makes it possible to observe and evaluate human attention objectively and non-intrusively, enabling you to increase the impact of your visual design and communication (Williams, 2015). Thus, by (visually) improving your web design, you might be able to enhance the user experience, and therefore the overall customer experience.
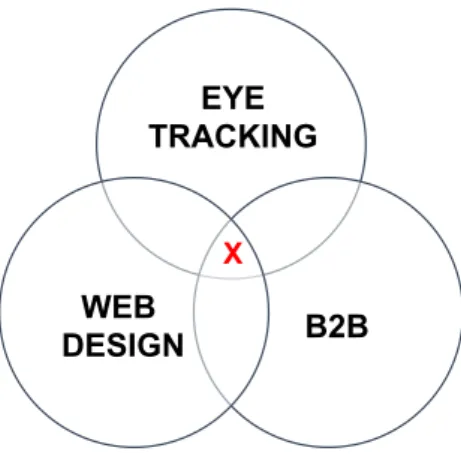
During our literature study, it became clear that there are three literature streams relevant for this master’s dissertation. As you can see in Figure 1, the different streams are eye tracking, web design and online B2B transactions. Consequently, our literature review will discuss the different aspects individually, but will also elaborate elements at the intersection of two streams. As one may notice, this master’s dissertation is situated at the red cross in the middle of Figure 1, since there is (almost) no literature covering the junction of these three literature streams.
1 Accenture surveyed 1350 respondents that represented companies from 10 countries and 16 industries, with the vast majority reporting annual revenues of more than 1 million USD
EYE TRACKING
WEB
DESIGN B2B
X
Figure 1 Situation of this master’s dissertation within the literature
2. RESEARCH QUESTION
Since this master’s dissertation will examine a domain that is currently under-investigated, we assume that this research is exploratory in nature. According to Yin (2014) and Saunders et al. (2016), exploratory research questions are mostly open questions that start with the question words ‘what’ or ‘how’. Yin (2014) also argues that (exploratory) experiments should have a research question starting with ‘how’. As a result, we came up with the following research question:
u How does website design impact online viewing behaviour, web design preference, and purchase intention in a B2B setting?
Important to notice here is that this research question only emerged during the process of data collection and analysis. In exploratory research, this approach is commonly accepted as the researcher only discovers the explicit focus of his/her study and refines the direction at that stage of the research (Saunders et al., 2016).
PART 2: LITERATURE REVIEW
In order to give the reader of this master’s dissertation a clear and concise overview of the academic work done in this field; the following breakdown structure will be applied:
• Chapter 1: Eye tracking (as a part of neuro-marketing) • Chapter 2: Web design
• Chapter 3: B2B vs. B2C
In Table 1, we will give some examples of key references for each zone (1-6) of the Venn diagram in Figure 2. As there is (almost) no research covering the junction of these three literature streams, it is clear that there is a gap in the literature. Therefore, it becomes understandable to the reader why exploratory research at the intersection of these three subjects can be valuable for both researchers and practitioners.
ZONE EXAMPLES OF KEY REFERENCES
1 (Wedel & Pieters, 2006); (Duchowski, 2017); (Pieters & Wedel, 2007)
2 (Wen et al., 2001); (Salehi et al., 2012); (Chen et al., 2010)
3 (Chakraborty et al., 2002); (Chakraborty et al., 2005) 4 (Pan et al., 2004); (Drèze & Hussherr, 2003);
(Wang et al., 2014); (Josephson & Holmes, 2002) 5 (Lim, 2018)
6 (McLean, 2017)
Table 1 Examples of key references
EYE TRACKING WEB DESIGN B2B 1 2 3 4 5 6 ?
CHAPTER 1: EYE TRACKING
(AS A PART OF NEURO-MARKETING)
1. SITUATION WITHIN NEURO-MARKETING
“The application of neuroscientific methods to understand human behaviour in applied settings has led to the emergence of a new branch of knowledge in marketing science popularly known as ‘neuro-marketing’” (Lim, 2018, p. 1). In Figure 3, neuroscientific methods are divided into two subgroups: neuroimaging and non-neuroimaging neuroscientific methods. The former registers neural activity inside the brain, whereas the latter registers neural activity outside the brain. According to Lim (2018), eye tracking fits into the non-neuroimaging group of neuroscientific methods. This is pretty straightforward as eye trackers only record eye movement data and not brain activity.
In consumer research, neuroscientific approaches should be complementary to self-reported traditional methods, like individual interviews, focus groups and surveys. By merging neuroscience and conventional consumer research, improvements in terms of precision, resolution and validity of the customer insights can be attained, compared to the long-established measures. These insights are essential in order to create customer-centric strategies. Furthermore, this merger will result in a superior understanding of the customer (experience) (Hsu, 2017). Since the action of looking is very natural and instinctive, eye tracking can be an interesting tool for both quantitative and qualitative research, as it enables research workers to get an idea of unconscious processes that are controlled by our preferences and biases.
In the following section about eye tracking, customer attention will be discussed in a more elaborated way but in order to make a first association between neuromarketing and customer attention, we would like to refer to (Hsu, 2017).
“Consumer attention is one of the most valuable commodities in current competitive landscape but remains difficult to measure. Moreover, existing marketing theories either assume no constraints on consumer attention or lack the ability to make specific quantitative predictions necessary for practical use” (Hsu, 2017, p. 9). In order to detect and analyse human attention in an objective way, eye tracking can be applied. Thus, by measuring eye movement, no assumptions, nor constrains have to be made in terms of attention. In addition to this, it will become clear where customers draw attention to and where not, during their online buying journey.
2. EYE TRACKING
2.1 INTRODUCTION
Eye tracking or gaze tracking can be defined as “the recording and study of the movements of the eyes in following a moving object, lines of printed text, or other visual stimulus, used as a diagnostic procedure or a means of evaluating and improving the visual presentation of information”, according to Oxford Dictionary. The tools used in conducting such studies are known as eye trackers. Eye tracking can be divided in the following subgroups:
1. Remote eye tracking (also called screen-based, stationary, or desktop eye tracking) 2. Mobile eye tracking (mostly with eye tracking glasses)
3. Virtual reality eye tracking (mostly with a VR headset)
Since an explanation of the third category is out of the scope of this master’s dissertation, no further attention will be given to VR eye tracking.
The main difference between remote and mobile eye tracking is basically the mobility of the person that is participating in the experiment. In the remote tracking case, the subject is not able to move around, he/she has to remain seated during the whole experiment. Stationary eye tracking set-ups may also differ in terms of head mobility; in some cases the head is free to move, whereas in other cases the head is fixed in order to improve the experiment’s accuracy. In the mobile tracking case, the subject is able to walk around and move its head freely. As a consequence, mobile eye tracking experiments can capture real-world data in more complex and natural environments. Therefore, companies mainly use mobile eye tracking experiments to optimize the design of packages, shelves,
billboards, etc. Contrarily, screen-based eye tracking mainly happens in a research laboratory. But since all e-commerce purchases happen on the internet, desktop eye tracking can perfectly simulate online purchasing behaviour. In the following, we will mainly focus on remote eye tracking, since this technique will be used to gather eye movement data for this dissertation.
Since eye tracking will be used as a means in this master’s dissertation to attain certain insights concerning B2B e-commerce web design, a more extended description of the historical, technological and biological part of eye tracking will not be included in this work. The interested reader is referred to the work of Wedel and Pieters (2006) for more information about these parts. Thus, eye tracking will be used as a research technique and is not the final goal of this master’s dissertation.
2.2 EYE TRACKING TERMINOLOGY
In the following subsection, most important terms and metrics regarding eye tracking will be elaborated in order to give the reader a terminological framework for the pursuit of this master’s dissertation. The framework is mainly based on the work of Farnsworth (2018).
Gaze (point)
A momentary eye-fixation at a particular point or word. There is no duration associated to a gaze.
Fixation
A prolonged eye-fixation at a particular point or word. The aggregation of consecutive gazes at proximal locations is called a fixation. Contrary to a gaze, a fixation is associated with a certain duration. In Figure 4, fixations are represented as orange circles, which are proportional to the fixation duration.
Saccade
A very quick movement of the eyes among two fixations. In Figure 4, the saccades are represented by the orange lines between the circles.
Scan path
Heatmap or Attention Map
Static or dynamic aggregation of gaze points and fixations that show the general distribution of visual attention. Heatmaps use a straightforward colour code where red areas suggest a high amount of gaze points, yellow and green areas are considered to have less gaze points. As the colour scheme suggests, red areas tend to have an increased level of interest, whereas yellow and green areas suggest less visual engagement. Regions without any colour are hardly noticed by the respondents. Heatmaps are generally presented as colour gradient that covers the presented image or stimulus (see Figure 5).
Figure 5 Example of a heatmap
Area of interest (AOI)
These are pre-defined subregions of the presented stimulus. Obtaining metrics for different AIOs on a website interface, might be interesting when evaluating the performance of the various e-commerce web design building blocks. Comparing the AIO metrics over different B2B websites can be valuable in order to compare the different website designs among each other.
Time spend
The time spend indicates how long a particular respondent is looking to a pre-specified AOI. Because other (equally) interesting stimuli in the visual periphery of the AOI are faded out by the respondent, time spend usually reveals motivation and conscious attention. Farnsworth (2018) states that extended visual attention at a particular region implies a high level of interest. A shorter time spend suggests that other regions in the environment might be more captivating.
Time to first fixation (TTFF)
From stimulus onset, the time to first fixation specifies the amount of time a respondent takes to look at a specific AOI. In eye tracking, TTFF is seen as a basic but very useful metric because it can reveal both bottom-up stimulus driven searches as well as top-down attention driven searches (Farnsworth, 2018). An example of the former is an eye-catching company logo capturing immediate attention. An illustration of the latter are respondents that are looking for specific elements or areas on a website, like the menu tab.
Respondent count
This metric counts the number of respondents that actually directed their gaze towards a particular AIO.
Other common metrics are first fixation duration, average fixation duration, and the number of revisits per AOI. As these metrics are quite straightforward to understand, no further explanation will be given.
In order to conclude the subsection about eye tracking terminology, some major benefits of using eye tracking – and its metrics – as objective measure are worth mentioning. First of all, by using eye tracking devices, researchers will be able to extract the elements that immediately attract the participants’ visual attention (cfr. TTFF). Secondly, elements that receive above-average attention will also be identified (cfr. time spend). A third important feature that eye tracking reveals, is which elements are overlooked or ignored (cfr. heat maps). Lastly, eye tracking indicates in which sequence the
elements are perceived (cfr. scan paths). These are just some of the main advantages that the use of eye tracking as an objective measure for unconscious attentional behaviour bears.
2.3 RELEVANT EYE TRACKING EXAMPLES AND APPLICATIONS
In the following subsection, some literature examples will be given in order to show the reader how eye tracking has successfully been used in academic work.
One of the first researchers that used eye tracking technology to study human-computer interaction was Robert Jacob (1991). While this article was written more than a quarter-century ago, it served as the fundamentals for a lot of the human-computer interaction endeavours perceived today (Farnsworth, 2017).
Another important work that involved eye tracking technology, is written by Gerald Lohse (1997). This article in market research deals with eye movement patterns on yellow pages (‘gouden gids’) advertising. The findings of this paper can be generalised to other types of advertisements too. Especially, it reported that most of the content was just overlooked by the participants. As yellow pages merely exist today, this kind of ignorance towards advertisement is nowadays known as banner blindness (Hervet et al., 2011), a well-known phenomenon where website visitors ignore banner-like information on webpages.
As mentioned before, one of the most common applications for eye tracking is to explore how visitors interact with websites, or with the internet in general. A greater comprehension of this may help companies to maximise their impact towards the visitor and make the user experience as smooth as possible. Granka, Joachims, and Gay (2004) used eye tracking technology to conduct a research about how users interact with Google’s search engine results page (SERP). The paper revealed that search engine users mainly focus on the first two links that appeared on the results page. This article inspired many other researchers to analyse eye movements of search engine users (Dupret & Piwowarski, 2008; Lorigo et al., 2008). Notice that these findings led to for example Google’s pay-per-click (PPC) advertising solution, which is a widely used internet advertising model for companies.
Aside from the use of eye tracking technology in consumer and market research, it is also a common research technique in cognitive psychology and cognitive cartography. The interested reader is referred to the work of Rayner (2009) and Keskin et al. (2018), for an example in each of the previously mentioned domains. In addition to these domains, eye tracking can be found in many other areas of
science. For a more extensive overview, the reader is referred to the work of Duchowski (2002). Furthermore, eye tracking is also commonly used by behavioural research companies like ‘EyeSee’, one of the fastest-growing market research companies operating globally.
CHAPTER 2: WEB DESIGN
The content of this chapter is mainly based on both general research on B2C web design and eye tracking studies in a B2C e-commerce environment, as there is almost no literature available about B2B web design. Due to the lack of literature on the B2B side, a huge opportunity arises to explore B2B website design. Nevertheless, it is useful to discuss the main topics of B2C web design in order to give the reader a basic academic framework on (B2C) website design.
1. STRATEGIES & MODELS
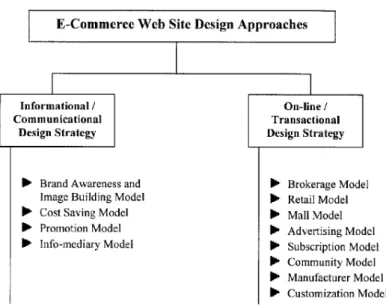
As electronic commerce or e-commerce is becoming more and more compulsory in the current business environment, Wen et al. (2001) elaborated a framework to classify e-commerce web design models, based on two website design strategies. These two generic strategies are the following:
1. Information or communicational strategy 2. Online or transactional strategy
In the former strategy, the companies’ website is perceived as a complement to traditional marketing. The website is used to provide the customers with extra benefits and information like online catalogues. Additionally, the first strategy helps to develop further relationships with customers through this ‘new’ communication channel. A common result of this strategy is an increase in brand awareness and image.
In the latter strategy, companies use their website to develop a ‘virtual business’, which provides a larger or more specified selection of products than competitors can offer. In addition to the online catalogue of strategy one, strategy-two-websites provide online transactions between the company and the customer. These transactions are exclusively facilitated by the companies’ website. As such, the website is used as an interactive medium between company and client.
Figure 6 enumerates the different models that are used within the two different e-commerce strategies. As a detailed explanation of the different informational/communicational models falls out of the scope of this master’s dissertation, the reader is referred to the paper of Wen et al. (2001) for more information. This work will primarily cover websites that are subject to the online/transactional design strategy, as B2B digital buying behaviour will be analysed throughout. These models are explained in the following paragraphs.
Brokerage Model
In the brokerage model, brokers can be seen as match-making intermediators between buyers and sellers, facilitating transactions between the two parties. These transactions can be B2C, B2B or C2C. Generally, brokers charge a fee in order to enable the transaction.
Retail Model
In the retail model, e-tailers can be seen as the online alternative of physical retailers and wholesalers, providing goods and services based on list prices or through auction. In some cases, these e-tailers don’t have any physical presence (e.g. brick-and-mortar store) anymore, but exclusively provide online transactions.
Mall Model
In the mall model, e-malls hosts various e-tailers. This service typically comes with certain costs for the e-tailers like transaction fees. In some cases, a generalized portal is foreseen in order to effectively realise the virtual mall model.
Manufacturer Model
In the manufacturer model, manufacturers can directly reach out to their buyers. By skipping the wholesalers and retailers, manufacturers are able to shorten the distribution channel. The major disadvantage of this model is the potential channel conflict between the manufacturer and its established supply chain network.
Customisation Model
In the customisation model, online customers are provided with personalised content. According to Wen et al. (2001), this model was quite novel and innovative. Nowadays, personalised content is incorporated in almost every companies’ website in order to draw attention to the companies’ brand and to set itself apart from its competitors. This topic will be elaborated more intensively in the next chapter of our literature review.
Advertising Model, Subscription Model & Community Model
Since these models focus on the transaction of informational content, the reader is referred to the paper of Wen et al. (2001) for more information.
Since the research about this topic is very limited, the paper of Wen et al. (2001) serves as the key source of e-commerce web design strategies and models.
2. WEBPAGES VS. PRINTED ADS
To continue the chapter about web site design, a short comparison between webpages and printed advertisements might be interesting in order to underline the advantage webpages have over printed ads. This may seem a little weird, but since printed advertisement obtained a lot of attention in eye tracking research, this difference is worth mentioning.
According to Pan et al. (2004), the main difference between webpages and other visual stimuli is the combination of textual, pictorial and multimedia content. Wedel and Pieters (2000) make a similar distinction between brand, text and pictorial in their research about print advertisements. Later, Pieters and Wedel (2007) divided the design elements of printed ads in the following categories: brand, headline, body text and pictorial. As we notice here, they subdivided the text element into headline and body text. It is clear that the main difference between webpages and printed ads is the existence of multimedia content. The best examples of multimedia content are slideshows and videos. The former enables you to highlight different images (‘still’ pictorial content), videos and even audio. A simple example of a slideshow are different product photos on an e-commerce website. The latter can be described as ‘moving’ pictorial content. It is obvious that multimedia content is a big enrichment that websites have over print advertisement. Mixed media content enables web designers to create strong visual impact, which results in visitors that are fully engaged since people have become extremely visual nowadays.
As a result of this difference, Pan et al. (2004) suggest dividing web content into one of the nine different ‘lookzones’. These nine ‘lookzones’ can be used to categorize the content of a webpage. The following zones are included:
1. title 2. navigation 3. link 4. content 5. search 6. still advertisement 7. moving advertisement 8. still picture 9. moving picture
This categorization of webpage building blocks can be useful in order to determine the different areas of interest (AOIs) during our eye tracking study. Since the meaning of these ‘lookzones’ is somewhat straightforward, no further explanation is included.
CHAPTER 3: B2B VS. B2C
In the following chapter, some major findings of (online) B2B transactions will be elaborated in order to give the reader a greater understanding of the main differences between B2B and B2C relationships. Note that only those differences that are relevant for this dissertation will be given.
1. ‘THE HUMAN TOUCH’
In the context of an assignment during a B2B marketing course, where B2B buyers and suppliers had to be interviewed, it became clear that trust is vital in B2B buyer-supplier interactions. Trust can be seen as one of the main differences between B2B and B2C relationships. Two important reasons can be cited that induce this difference. First of all, business relationships between companies tend to have a rather long-term perspective, aiming to satisfy a continuing need that is crucial for the success of the business. Secondly, enterprises are strongly dependent on the products and services of their suppliers in order to run their own business. This difference will also impact the online relationships between companies.
The title of a McKinsey & Company consulting paper by Angevine et al. (2018) summarizes the main idea of this section: “The secret to making it in the digital sales world: The human touch”. Going digital is undoubtedly beneficial for sales organizations. The paper states that “B2B sales leaders using digital effectively enjoy five times the growth of their peers who are not at the cutting edge of digital adoption”. But, according to one of McKinsey’s recent studies (Lingqvist et al., 2015) with B2B practitioners, the reality knows more nuance. Corporate customers have a strong wish for positive digital interactions with a human touch. We could state that the importance of the human touch is inherent to online B2B relationships because, generally speaking, B2B relationships are more built on trust compared to their B2C counterpart.
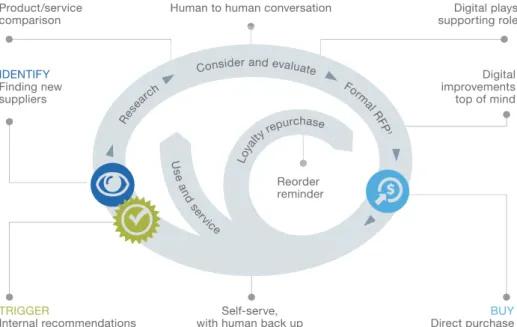
The paper (Angevine et al., 2018) also states that “though B2B buyers use digital and analogue channels at each stage of the typical decision journey, they tend to have specific preferences”. Figure 7 summarizes the main buyer journey stages and the importance of digitization in each stage. As one may notice, digitization starts playing a more important role as customers move to the evaluation and consideration stages. Supportive digital tools, like comparison engines and online configurators, are used to inform the potential customers. Nevertheless, human interactions remain very important is these stages. After the direct purchase, when negotiations are about renewal, up- and cross-sell, digitization is preferred over human interaction, according to the paper of McKinsey & Company. The main message of their research is that context matters more than customer type or industry. Which means that
companies should try to optimize their human-digital mixture depending on the stage of the decision journey in which their (potential) buyers are. Another important finding of this research is that companies that are uniquely digital, should opt to reintroduce a human touch at the start of the buyer journey, in order to improve their growth. The inverse holds for companies that are solely based on human-to-human interactions.
2. B2B WEBSITE EFFECTIVENESS
Now that we know the main building blocks of B2C webpages and the difference between B2B and B2C relationships, it seems a good idea to have a look at the different factors that influence customer’s perceptions of the effectiveness of B2B websites. In this section, we will rather focus on broader perceptual constructs - like personalization and informativeness - than on website specific design features – like background colour and font size. In the research of Chakraborty et al. (2002), a conceptual framework is suggested that consists of eight factors. In the following paragraphs, each of these factors will be explained shortly. A more elaborated explanation of these constructs and the related issues can be found in the paper.
Personalisation
In an online context, personalisation refers to treating each visitor as an individual by recognising them when they revisit a website and by providing information that is relevant for them, based on their implicit or explicit preferences (Peppers & Rogers, 1999). Mostly, this is achieved by using a registration tool together with cookie technology.
Interactivity
Interactivity refers to the ability of online customers to actively participate in the exchange of information. A great example in the current online landscape is the presence of chatbots, which facilitate real-time dialogic communication between website visitors and the company. By some researchers, interactivity is seen as a crucial element in converting ‘lookers’ to buyers. A further distinction can be made between transactional and non-transactional related interactivity, both of them count as a factor.
Informativeness
This construct is closely related to the ‘information or communicational strategy’, as elaborated in the first section of chapter two of this literature review. Informativeness refers to the primary purpose of a company’s website, namely providing valuable information to prospects, customers and other stakeholders. Informativeness and interactivity may seem similar constructs. But the main difference lays in the fact that interactivity is dynamic and informativeness is static. The former can be seen as two-way communication, while the latter is a form of one-way communication.
Organisation
Chakraborty et al. (2002, p. 57) define organisation as “the ability of a website to arrange content, information, images, graphics, etc., in a manner that increases clarity of information and makes it easy for a visitor to find the needed information”.
The three other constructs or factors were privacy/security, accessibility, and entertainment. But the researchers found no empirical evidence for these factors to have a significant impact on the website’s effectiveness. The only constructs that significantly predict website effectiveness in a positive way are personalisation, transaction-related interactivity, informativeness, and organisation. It is important to notice that different studies in the B2C landscape identified entertainment, accessibility, and privacy/security as significant factors for B2C website performance/effectiveness. Thus, it seems that utilitarian or functional website elements are more important towards B2B customers.
CLOSING REMARK
Now that the main topics in each zone of the Venn diagram of Figure 2 are discussed, it becomes even more apparent that there is a research gap in the literature. The gap situates itself at the intersection of the three chapters that were used in this literature review. Since this area has not yet been explored, an exploratory research will be conducted in order to gain a better understanding of how online B2B customers perceive the web design of e-commerce platforms. Hopefully, this research may first of all contribute to the academic world, since this area was under-explored. Furthermore, it may also serve as a guideline for B2B web developers in order to improve the user experience and therefore the overall customer experience. Thus, this research is theoretically relevant and practically useful.
PART 3: RESEARCH METHODOLOGY
1. RESEARCH OBJECTIVE & AIM
As stated in the closing remark of our literature review, there seems to be a gap in the academic research where eye tracking, web design and (online) B2B (transactions) criss-cross each other. As the junction of these three literature streams is heavily under-explored, an exploratory research will be conducted in order to gain a better understanding of the interplay between these three subjects. The objective of this research is to get a first impression of how B2B customers perceive the web design of several e-commerce platforms by focussing on their eye movements and by questioning them afterwards. Eye tracking studies enable us to augment the (rather subjective) findings of self-reported traditional research methods, like questionnaire surveys, with objective data of attentional behaviour. By incorporating an eye tracking experiment in conventional consumer research, we will be able to attain insights in both unconscious and conscious behaviour.
Consequently, we are convinced that this exploratory research may contribute to the academic world, by exploring an area that is currently under-investigated by the scientific community. In addition, this master’s dissertation will also assist B2B practitioners in optimising their user experience by providing guidelines for B2B web design. Conclusively, this master’s dissertation aims to add value in both a theoretical and a functional way.
2. NATURE OF THE RESEARCH
First of all, we can describe the nature of this master’s dissertation as exploratory. Like mentioned before, this kind of research is conducted when there is no prior academic research done about a certain topic. Exploratory work is characterised by a high level of flexibility as the researcher may adapt to changes as the exploration proceeds. It provides the foundations for follow-up academic work, if the topic is worth investigating. In conclusion, it is evident that exploratory research may serve as a first step in investigating an under-explored research topic more deeply, if it is worth pursuing.
Furthermore, the research methods used in this exploratory research are quantitative in nature. According to the work of Creswell (2007), both experimental and survey designs belong to the class of quantitative research methods. This master’s dissertation will blend an eye tracking experiment together with a questionnaire survey, that is conducted simultaneously. Moreover, two small cases will be introduced to the participants, during this experiment. As our research design combines an experimental design with a questionnaire survey based on two short case studies, it may be seen as a multiple
methods or multi-methods research design. According to the editors of the Journal of Mixed Methods Research, “multiple methods research refers to all the various combinations of methods that include in a substantive way more than one data collection procedure” (Fetters & Molina-Azorin, 2017, p. 5). These researchers also state that it is important to notice that mixed methods research is a subcategory of multi-methods research because a mixed methods approach combines both qualitative and quantitative research methods. It is clear that the mixed methods procedure is not applicable to our research design since we only use quantitative methods (Saunders et al., 2016).
Consequently, we may conclude that this master’s dissertation adopts a quantitative multi-methods exploratory research design.
3. DATA COLLECTION JOURNEY
As previously mentioned, we used two quantitative research methods in order to obtain our data: 1. Eye tracking experiment (consisting of two cases)
2. Questionnaire survey (after each case)
In this section, we will try to give the reader a clear overview of how the idea of conducting an eye tracking experiment became real. As this transition from 'dream’ to reality was certainly not a piece of cake, it is absolutely worth mentioning.
3.1 EYE TRACKING EXPERIMENT
PREFACE
Our journey began with gathering some initial information about eye tracking experiments at the University of Ghent. By doing so, we indirectly got in touch with a Turkish PhD student, who is occupied with conducting eye tracking experiments in the interest of her doctoral research about cognitive cartography at the faculty of sciences (department of geography). During our first meeting, she explained the eye tracking basics and recommended an open-source eye tracking software called OGAMA (Open Gaze and Mouse Analyzer).
EYE TRACKING HARDWARE: webcam vs. laptop-mounted tracker
After this meeting, it became quite clear that conducting an eye tracking experiments was not as easy as we thought: finding a mobile and low-cost eye tracking set-up would not be an easy task. The mobility of the tracking device was key, since we wanted to conduct the experiment in the participant’s natural environment. Nobody working in the B2B sector likes to come to a central laboratory in order to
participate in an experiment. A possible solution that met our – financial and geographical – requirements, was conducting a webcam-based eye tracking experiment. In this case, either the webcam of the participant’s own computer can be used, or the webcam of the researcher.
In the paper of Semmelmann and Weigelt (2018), this eye tracking technique is perceived as having a high potential in becoming the future’s golden standard in online (eye tracking) data collection. For further information, the reader is referred to their paper. Afterall, we did not choose for this alternative for two different reasons. First of all, we did not find an all-in-one software solution for designing and conducting the experiment and analysing the data afterwards. Secondly, this technique still needs to take a long road ahead in terms of reliability and accuracy – as elaborated in one of the consecutive paragraphs. So, we may conclude that we did not opt for webcam-based eye tracking as this technology is still too much in its infancy.
As our quest for the optimal eye tracking software and hardware persisted, we came to the realization that mounting a screen-based eye tracker on a laptop might be a mobile alternative to laboratory experiments. We became aware of the fact that this kind of set-up might be in the middle of two previous mentioned eye tracking subgroups, namely remote and mobile eye tracking. As these two subcategories of eye tracking were already discussed in the first chapter of the literature review, the reader is referred to subsection 2.1 for a detailed description. However, it is important to notice that fixing an eye tracker to the researcher’s laptop would overcome the immobility issue of desktop eye tracking (synonym for remote eye tracking). By using the term immobility, we refer to the immobility of the researcher, who is clustered to his/her research laboratory. In our case, the researcher is able to relocate the eye tracking set-up to the natural environment of the subject. Nevertheless, the participant still won’t be able to move around as he/she has to remain seated during the whole experiment. This set-up simulates a situation that is close to reality, as the experiment can be conducted in the subject’s natural environment. We notice that a laptop-mounted eye tracker serves as an interim/transitional solution between remote and mobile eye tracking since the system is able to capture real-world data from the subject’s day-to-day (online buying) environment, namely behind his/her laptop at work or at home.
In order to obtain a screen-based eye tracker, we contacted the PhD researcher once again. Gratefully, she had ‘The Eye Tribe Tracker’ at home and she was not using it at that moment of time. After the department of geography accepted the request for using the eye tracker for our research, ‘The Eye Tribe’ tracking device was handed over during a second meeting with the PhD researcher. She also recommended to use OGAMA in combination with this eye tracker and showed how easy it was to
connect the software to the hardware. After we got introduced on how the design, recording and analysis modules of OGAMA functioned, the set-up was tested on the researcher’s laptop with an experiment that was designed for a conference. As everything worked out fine and all our requirements were met by this set-up, we were eager to start designing and conducting the experiment, and so did we.
FINAL HARDWARE SET-UP
In order to give the reader a detailed description of how the data was collected, it can be interesting to briefly explain the final hardware set-up. During our experiment, participants were seated about 65 centimetres from the 12.3-inch display of a Microsoft Surface Pro 7 laptop with a screen resolution of 2736 x 1824 pixels. The main components of ‘The Eye Tribe Tracker’ are a camera and a high-resolution infrared light-emitting diode (LED). The camera is used to track the eye movement of the participants by tracking the most minuscule pupil movements through taking images and pushing them over computer-vision algorithms. In order to trace the user’s pupil movements, an infrared beam is projected toward the face and reflected in the user’s pupil. Afterwards, the algorithms reads the “on-screen gaze coordinates” and supports the internal software to detect where on the “on-screen the subject is looking (Etherington, 2013). As we will remain on a rather high-level about the technological part of eye tracking, the interested reader is referred to the work of Wedel and Pieters (2006) for more information.
ACCURACY & TRACKING AREA
Still, one technical specification will be elaborated in order to stress the difference in accuracy and tracking area between ‘The Eye Tribe Tracker’ and webcam-based eye tracking. Our tracker has an accuracy of 0.5 degrees of visual angle, while an average webcam offers an accuracy of 2 to 5 degrees of visual angle (if the participant is not moving). In order to make this more comprehensible, we will explain this technicality in plain language. In simple terms, when you are seated about 65 cm from your laptop’s display, 5 degrees of visual angle represents about 6.5 cm on the laptop’s screen. This means that the actual eye location could be anywhere within a range of 6.5 cm from the eye location traced with a webcam-based tracker. Contrary, ‘The Eye Tribe Tracker’ has an accuracy of 0.5 degrees of visual angle, which “corresponds to an on-screen average error” around 0.6 cm, at a distance of 65 cm from the screen (Basics | eyetribe-docs, n.d.). In addition, ‘The Eye Tribe Tracker’ offers the possibility to move your head about 15 cm up or down, and about 20 cm left or right. This implies that our tracker uses a tracking area of 40 cm x 30 cm at a 65 cm distance. On the other hand, webcam-based eye tracking almost does not allow you to move your head. Thus, in terms of accuracy and tracking area, our eye tracker performs way better than a webcam-based alternative.
‘THE EYE TRIBE’: company background
Now that we know a little bit more about the hardware set-up, it might be interesting to give some background information about the company behind this technology. ‘The Eye Tribe’, formerly known as ‘Senseye’, was a Danish start-up, founded in 2011 by four former PhD students of the IT University of Copenhagen. Their ambition was to make eye tracking more affordable, as it was a very expensive research method at that time. In 2012, they acquired one of the six spots in the ‘Cool Vendors in Human-Machine Interface’ report by Gartner, a S&P 500 global research company. In that year, they also raised more than 3 million USD for the development of their technology. According to Crunchbase, a fourth of this seed funding was provided by private investors. The remaining part was the result of a Danish government research grant of about 2.3 million USD. The previously mentioned ‘actions’ clearly prove the great belief in eye tracking technologies’ upside potential. By October 2013, they started with the shipment of their first ‘eye tracking software development kits’, called ‘The Eye Tribe Tracker’, which included the eye tracking hardware and its own software, at an affordable price of 99 USD. The eye tracking device in this kit is the one that we used for conducting our experiment. By December 2016, The Eye Tribe was acquired by Oculus, also known as Facebook Technologies, as it was interested in applying The Eye Tribe’s technology into its VR headsets. This acquisition once again demonstrates the value of eye tracking technology and can be seen as an extension to previously mentioned applications. As already mentioned in subsection 2.3 of the first chapter of the literature review, eye tracking is clearly not only a valuable tool for researchers, but it also knows great value due to its applicability in other technologies, like VR headsets.
EYE TRACKING SOFTWARE: background information
Next to the eye tracking hardware, the software used for conducting this experiment is also of great importance in order to collect valuable data. As suggested during the meeting with the PhD researcher, we used ‘The Eye Tribe Tracker’ in combination with the open-source software OGAMA. This program was created in 2007 by Adrian Voßkühler, a German PhD student at the FU Berlin, and his colleagues. For more information about this first version of OGAMA, the interested reader is referred to the work of Voßkühler et al. (2008). In the following years, dr. Voßkühler continued working on this program and several improved and more advanced versions of OGAMA were released during the years. In May 2016, he quit his project as he already left university for five years and OGAMA had just become a hobby to him. This also implies that there was no active support anymore. The only way to pose questions about OGAMA was on an online forum where dr. Voßkühler replied from time to time. The latest version, version 5.0, dating from May 2015, is used in this master’s dissertation in order to conduct our experiment.
OGAMA consists of three different modules: a design, a recording and an analysis module. The analysis module consists of six separate submodules, but these will be explained in the data analysis section, as they were not used in order to collect our data. As one may notice, OGAMA is really the all-in-one solution that we were searching for from the beginning: it enables stimulus creation and presentation, real-time recording, and data analysis. For the moment, only the design and recording module will be considered. As their names already reveal, the former was used in order to create slides to be presented during our experiment, while the latter is used to capture the subject’s eye movement during the presentation of the experiment’s slideshow (Voßkühler, 2009).
DESIGN MODULE
In this part, we will elaborate and motivate the different decisions that we had to make during the slideshow creation. It is meaningful to mention that the design module enables different kinds of stimulus types to be inserted in the slideshow: text instructions, images, shapes, audio, video and web browsers. The slideshow creation process will be explained slide-by-slide in bullet points.
§ First of all, an introduction slide was inserted that welcomes the participants and informs them that before the real experiment will start, some guidelines and a training task will be provided. The slide notifies the participants to press spacebar in order to continue to the next slide. For the remaining slideshow, the reader can assume that pressing spacebar is the default in order to continue to the next slide. If the procedure to move to the next slide differs from the default procedure, this will be mentioned.
§ The second slide gives the participants some general guidelines. The researcher points out that not the participant is tested, but the system. The participants are also warned that if they get stuck, they have to continue as if they were on their own: no questions can be asked and the participants have to pretend that the researcher is not there. These guidelines ensure that the experiment simulates the reality as much as possible.
§ The third slide announces that there will be a training task in the following slide. This training task was inserted based on the advice of the PhD student during our first meeting. There are two main reason for this. First of all, a training task was inserted in order to get the subjects more familiar with the eye tracking software. A second reason that training tasks are inserted, is not to start the experiment too abruptly, because this would maybe put the participants less at ease. The training task ensures that the subjects get familiar and at ease with the software. § The training task itself was a multiple-choice question in which the subjects had to press the right answer on their keyboard. A sequence of different figures was provided to the participants and they had to identify answer D as the correct answer. As they pressed D on their keyboard, the slideshow advanced to the next slide.
§ The fifth slide announces that, from there on, the real experiment starts. It states that two different cases are prepared and that for each case there will be a short introduction and some guidelines. The subjects were also asked to really pay attention from that moment on.
Each case consists of six similar types of slides, the only differences are due to case’s context. The following slide sequence was used in each case:
1. Case introduction (different per case) 2. Guidelines (same for both cases) 3. Product landing page Amazon.com
4. Product landing page Bol.com 5. Product landing page Alibaba.com 6. Questionnaire
First of all, we would like to give the reader an introduction to the two cases. This is the same introduction as we gave to the participants as the first slide of each case (cfr. case introduction).
§ First slide Case 1: “You are a product designer and your boss ask you to buy several 3D printers for you and your colleagues. After doing some research, you come up with the Ender-3 Ender-3D printer. In the following slides, you will encounter three different websites that offer this 3D printer. Please carefully explore the different sites.”
§ First slide Case 2: “During the Corona-crisis, you are working as a HR technical specialist in a big consultancy firm. These days, tele-working is becoming the norm. One of your supervisors asks you to buy a large volume of conference speakers. These speakers can be connected to your laptop and provide better audio quality while video conferencing from home. After doing some research, you came up with the Jabra SPEAK 510. In the following slides, you will encounter three different websites that offer this conference speaker. Please carefully explore the different sites.”
So, for each case, this introduction was given to the participants as a first slide. The reason why we created a little story behind every case, was in order to give the participants some business context in which they were visiting the different websites. A context was created in which the initial product screening was already done, but the participant had to compare the same product on three different B2B e-marketplaces. For both cases, we opt for an electronic device that people typically not buy for private affairs but rather in a working environment. We may assume that a 3D printer and a conference speaker can be considered as products that are rather bought in a B2B than in a B2C setting.
§ The second slide of the two cases provided some more specific guidelines about the real experiment. The participants were asked to let their eyes explore the three different websites. It was also announced that after some time, the slideshow would automatically continue to the next website. The exact amount of time was not mentioned.
In fact, the exact amount of time was 20 seconds. We selected this timing as a consequence of a little experiment that we conducted with ourselves. The researcher exposed himself to the webpages for different time periods: from 15 to 30 seconds with a stepwise increment of 5 seconds. After our little empirical study, we concluded that 15 seconds was too short and that 30 seconds was way too long. We choose a 20-second time period over a 25-second time period for two reasons. First of all, the research of Dahal (2011), states that visitors need 2.66 seconds on average to settle their gaze on the area of the website that influenced their first impression the most. Secondly, the paper of Tuch et al. (2012), declares that webpage visitors form an opinion about a web design in about 50 milliseconds. This opinion will determine whether they like a website or not. As visitors only need an ‘eyeblink’ to settle their gaze and form their opinion, we choose the shortest alternative. Thus, the 20 seconds of exposure time was the result of academic research and our own empirics.
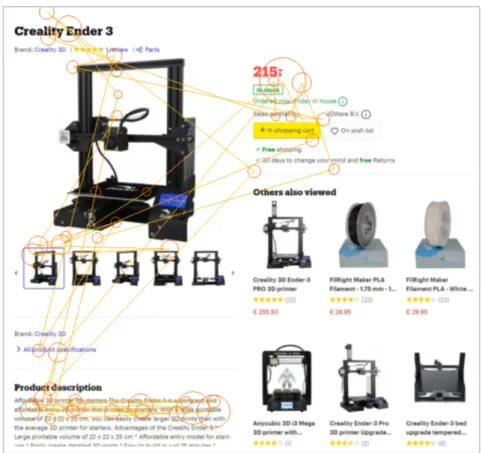
The following three slides each included a screenshot of the upper part of the different website’s product landing page. Initially, we wanted to show to whole webpage to the participants and enable them to scroll on the webpage. But, using the whole webpage as stimulus only worked for one of the three websites. So, we decided to email the developer of OGAMA, Adrian Voßkühler, and asked him if we could fix this bug. He replied that “most of the actual websites do not support the internal mechanism that OGAMA uses to create screenshots of the webpage, OGAMA is outdated for this purpose" (A. Voßkühler, personal communication, April 1, 2020). As a result, we determined to simply take a screenshot of the upper part of the product landing page of each website. First of all, we removed the website logo, header and menu. Afterwards, we also retouched the places where the name of the website was mentioned in the body part of the webpage. Both actions were undertaken in order to make the websites less recognisable. By doing so, the participants would be less biased in terms of personal experience with and brand image of the different e-marketplaces. An example of one of these screenshots can be found in Figure 8.
As one may notice, not the entire product landing page is visible. This is one of the drawbacks of not being able to use the entire webpage as stimulus. Nevertheless, we assume that there is enough content to be explored by the participants in order to form a decent opinion about the web design and the product offer. Next to Amazon.com, the two following B2B e-marketplaces were presented: Bol.com
and Alibaba.com. One may argue that Bol.com is not a real B2B online marketplace, but we ensured that the products in both of our cases were provided by an external company. By doing so, we assured that Bol.com functioned as an intermediate between the two businesses. Thus, we may state that this is a transaction on a B2B marketplace. Amazon.com and Alibaba.com are established B2B e-marketplaces.
§ The third slide included a screenshot of the product landing page of Amazon.com. § The fourth slide included a screenshot of the product landing page of Bol.com. § The fifth slide included a screenshot of the product landing page of Alibaba.com. These screenshots can be retrieved in Appendix A.
After the different webpages were shown to the participants, they were asked to fill out a questionnaire. More details about this questionnaire will be provided later on.
§ The sixth slide asked the subjects to fill in questionnaire one after the first case, and questionnaire two after the second case. This slide also asked the participants not to move their head too much while filling in the first questionnaire.
After both cases were finished, there was only one final slide left.
§ The eighteenth and final slide was used to thank the subjects for participating in our experiment.
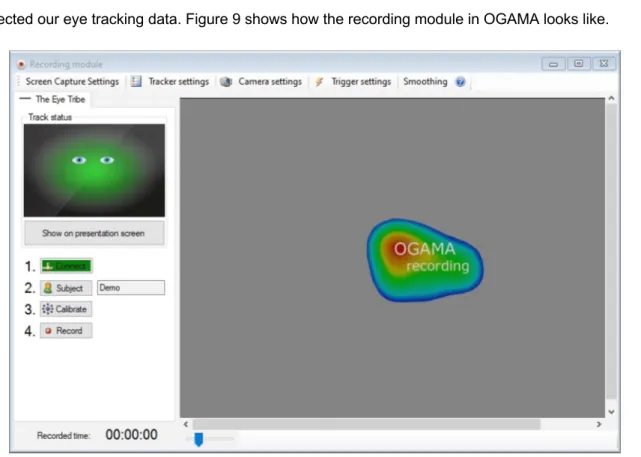
RECORDING MODULE
As mentioned before, the recording module was used to capture the subject’s eye movements during the presentation of the experiment’s slideshow. To be honest, this is the module that really collected our eye tracking data. Figure 9 shows how the recording module in OGAMA looks like.
Based on Figure 9 , we can identify four steps that are required before we can start a recording (Voßkühler, 2009):
1. Connect: starts the communication between the eye tracker and OGAMA 2. Subject: opens the dialog box to enter subject information (e.g. name, age, …) 3. Calibration: starts the eye tracker calibration process
4. Record: starts data recording and shows slideshow on the presentation screen
All these steps are quite straightforward. Only the calibration step needs some extra explanation. In our experiment we opted for a 9-point calibration method. In this step, the participants have to follow a red-coloured calibration dot that follows a random pattern in a square grid that consists of 9 points. The 9-point calibration method may be seen as a standard in eye tracking experiments (Duchowski, 2017).