Can soil-improving cropping systems
increase rice production while reducing
greenhouse gas emission?
A STUDY ON SUSTAINABLE RICE PRODUCTION IN THE
VIETNAMESE MEKONG DELTA
Eva De Mits
Student number: 01306897
Promotors: prof. dr. ir. Wim Cornelis, prof. dr. ir. Steven Sleutel Tutor: Van Qui Nguyen
A dissertation submitted to Ghent University in partial fulfilment of the requirements for the degree of Master of Science in Bioscience Engineering: Agricultural Sciences
Deze pagina is niet beschikbaar omdat ze persoonsgegevens bevat.
Universiteitsbibliotheek Gent, 2021.
This page is not available because it contains personal information.
Ghent University, Library, 2021.
ii
2. ACKNOWLEDGEMENTS
Forsan et haec olim meninisse iuvabit.
As Virgil once wrote, one day I will remember this and smile.
Because I pushed myself harder than ever before, because I met fantastic people along the way, because I learned innumerable things about scientific research conduct and about myself, and maybe mostly because it will all be in the past. I am grateful for the opportunities I have received conducting this fascinating research. Completing my thesis was a bumpy road, but every challenge was overcome with the help of the people surrounding me.
First and foremost, I wish to express my gratitude towards my promotors, prof. dr. ir. Wim Cornelis and prof. dr. ir. Steven Sleutel, for their patience and guidance whenever I needed either of those. The biggest thank you to my tutor Qui for enthusiastically answering my every question, but mostly for his sincere friendship. To Qui, good luck with your PhD, I am looking forward to drinking a ca phe sue da together when I return to Vietnam. My appreciation also goes to ir. Heleen Deroo, who was unexpectedly and unofficially promoted to my tutor when I got back to Belgium and I, frankly, needed someone to show me how to write a thesis.
Secondly, I would like to thank every friend and colleague in Vietnam. Special thanks to Khanh and Thuong for involving me in the project so quickly and teaching me everything about field work. Nor will I ever forget the hospitality of Dung and Trong; I would like to thank them for letting us farm their land, for helping us harvest and for treating me like a daughter. To the staff of the Department of Agriculture of Can Tho University, for being my rock during my stay and welcoming me as their longtime friend as soon as I landed in Vietnam: thank you, I miss you. I am also grateful to Prof. dr. Le Van Khoa, who immediately helped me with any required documents for my travels and showed a touching interest in my person when we finally got to meet in person. Also many thanks to the staff in the lab in Belgium, in particular to my friend Tran, to Sophie, Samuel and Katja, for helping me analyze my samples. Special appreciation goes to VLIR-UOS for enabling this project and to ASEM-DUO for making traveling abroad affordable.
Lastly, I want to thank my friends, for providing enumerable occasions to let my focus drift, even when I could not afford the fun. But most of all, thank you to my family, as this seems to be the first occasion I can put it in official writing. Thank you to my brothers, but especially to my parents. For always being there, for supporting my decisions, for visiting me in Vietnam, for always asking questions at the wrong moments and for listening when I finally do want to tell my stories. Dank u.
iii
3. TABLE OF CONTENTS
INTRODUCTION ... 1 1. Background ... 1 2. Objectives ... 2 LITERATURE REVIEW ... 3 1. Introduction to rice ... 32. Greenhouse gas emission from rice PADDY FIELDS ... 5
2.1. Global warming potential of GHGs………5
2.2. Biogeochemistry of paddy soils………6
2.3. CH4 emissions from rice paddy soils….………7
2.4. CO2 emission from rice paddy soils………..…8
2.1. Factors regulating CH4 and CO2 emissions from rice paddy soils……….11
3. Incoporation of upland crops in the rice based cropping system ... 16
RESEARCH SETTING ... 18
1. Introduction to the upland crop: sesame ... 18
2. The Vietnamese Mekong Delta (VMD) ... 20
MATERIALS AND METHODS ... 21
1. Study site ... 21
2. Field experiment ... 23
3. Sampling and measurements ... 27
4. Analysis ... 30
RESULTS ... 32
1. Environmental soil variables ... 32
2. Soil solution iron and manganese levels ... 38
3. gaseous soil C emission ... 43
4. Yield and rice straw ... 49
DISCUSSION ... 51
iv 2. Carbon balance ... 53 3. Yield ... 60 CONCLUSION ... 61 REFERENCES ... 62 APPENDICES ... 71
v
4. LIST OF ABBREVIATIONS
ANOVA Analysis of variance
CA Amended with cow manure+rice straw compost
CH4 Methane
CO2 Carbon dioxide
CO2-eq. CO
2-equivalents
DAS Days after sowing
DM Dry matter Eh Redox potential Fe2+ Ferrous iron Fe2+-eq. Fe2+-equivalents Fe3+ Ferric iron GC Gas chromatography
GDP Gross domestic product
GHG Greenhouse gas
GWP Global warming potential N2O Nitrous oxide
NA Not amended
OM Organic matter
R-R-R Rice-Rice-Rice crop rotation system R-Se-R Rice-Sesame-Rice crop rotation system SO42- Sulfate
SOC Soil organic carbon SOM Soil organic matter
vi
5. ABSTRACT
Rice agriculture heavily impacts global warming by the emission of greenhouse gasses (GHGs) due to prevailing anaerobic soil conditions inherent to paddy rice production. Particularly in the Vietnamese Mekong Delta, current rice cropping systems are highly non-sustainable due to soil degradation resulting from intensive rice monocultures with three crops per year and to the emission of GHGs. Improving crop productivity while adapting to climate change and restructuring agriculture are among the top priorities of the agricultural sector in Vietnam. This study aims to determine if a combination of shift to a rice-upland crop rotation and addition of organic amendments positively affects rice yield and keeps greenhouse gas emissions under control, in order to achieve a sustainable farming system. We measured methane (CH4) and carbon dioxide (CO2)
emissions and agronomic parameters over 1 year, using sesame as upland crop during the dry season in an otherwise triple rice rotation in the Vietnamese Mekong Delta. The organic amendments considered are composted cow manure and rice straw. Results showed statistically equal yields in all seasons. We observed surprisingly high CO2
emission flux rates (up to 2300 mg m2 h-1), and low CH
4 emission flux rates (<2 mg m2 h -1) for all treatments in all seasons, and. We observed a high organic carbon
concentration (approx. 2,5%) in the paddy soil, which serves as explanation for the high CO2 effluxes, and we suspect a considerable amount of sulfate reduction in the soil,
which could have inhibited methanogenesis. Effect of OM amendment on any parameter was insignificant, probably because the applied dose (2 ton ha-1) was too small to
contribute to the already high soil organic matter content. Although the rice-sesame rotation showed few significant effects on GHG emission, yield and other agronomic parameters, it was obvious that the rice-sesame rotation emitted more carbon than the rice monoculture (26% more SOC emission in the Summer- Autumn and Autumn-Winter seasons). CO2 emission was also the main controlling factor of total GHG emissions and
by contributing approximately 90% to the global warming potential (GWP). Thus, the rice-sesame rotation resulted in a GWP of on average 9669 kg CO2-eq. ha-1, while the rice
monoculture generated a GWP of on average 7240 kg CO2-eq. ha-1. These results
demand an affirming study on sulfate concentrations in this experimental site and, in a wider context, imply that CO2 emissions from rice paddy soils should definitely not be
1
INTRODUCTION
1. BACKGROUND
Vietnam’s economy largely depends on the growth of agricultural production and 52% of its population is engaged in the agricultural sector which contributes to 22% of the country’s GDP. Rice is the major economic crop and more than 53% of the Vietnamese rice fields is located in the Mekong Delta, where more than 90% of the land is under rice. However, several recent studies demonstrate that even though farmers add yearly more mineral fertilizer and use improved varieties, the productivity of rice and hence farmer’s income is declining. This is primarily due to soil degradation resulting from intensive rice monocultures with three crops per year, sea level rise and declined river flow with associated saline water intrusion, and floods and droughts (MARD, 2013). Moreover, the increase of nitrogen application has been subject to critique because overuse causes environmental problems, such as global warming and eutrophication. Nitrogen fertilization has to be reduced and rice has the lowest nitrogen use efficiency of all cereal crops, so it will have an impact on yields. This means there is a need to develop more nitrogen use-efficient varieties and integrated managerial practices that can overcome the yield losses caused by lesser nitrogen fertilization (Mahapatra et al., 2011; Chauhan et al., 2017). The integration of upland crops into the crop rotation is one of the practices currently studied to improve yields and insure income.
The flooded rice fields are also a major source for atmospheric methane (CH4) and
nitrous oxide (N2O), and can be a source for carbon dioxide (CO2), three major
greenhouse gasses (GHGs). The high CH4 emissions from paddy fields are the result of
the decomposition of organic matter under anaerobic conditions in permanently flooded soils (Witt et al., 2000; Janz et al., 2019). To our knowledge, there are few emission records published on GHG emissions from fields in the Vietnamese Mekong Delta (VMD). Farmers in the VMD have begun to integrate other crops in the crop rotation, such as maize, chili, sesame and soybean in the dry season, to ensure an income and to help save water in the more frequent droughts (“Plans to Grow Other Crops”, 2019). An important effect of this trend, is the possible decrease in CH4 emissions from the rice
2
2. OBJECTIVES
Several recent studies have shown that cultivation of rice in rotation with upland crops can significantly improve rice yield compared to rice monoculture (Linh et al., 2015a; Linh et al., 2015b; Xuan et al., 2012; Filizadeh et al., 2007; Mandal et al., 2014). Introducing such a more diversified cropping system can also reduce soil GHG emissions (Breidenbach et al., 2016; Weller et al., 2016, 2015). In addition, use of organic amendments have become an effective practice to improve soil fertility in terms of physical, chemical and biological aspects and maintain rice yield (Xu et al., 2008; Bi et al., 2009; Diacono et al., 2011; Thangarajan et al., 2013). However, despite the potential in improving soil quality and crop productivity, organic amendments could induce GHG emissions in flooded soils (Liu et al., 2011; Thangarajan et al., 2013; Pandey et al., 2014).
In this thesis we set out to study if a combination of shift to a rice-upland crop rotation and addition of organic amendments positively affects rice yield and keeps greenhouse gas emissions under control, in order to achieve a sustainable farming system. We also seek to explore the interactive effect of both factors: crop rotation and addition of organic matter. We used sesame as upland crop during the dry season in an otherwise triple rice rotation in the Vietnamese Mekong Delta. The organic amendments considered here are cow manure and rice straw. We hypothesize that the introduction of sesame as an upland crop in the crop rotation improves soil conditions by affecting the chemical properties of the soil solution, leading to rice grain yield increase and a reduction in greenhouse gas emissions. Secondly, we expect that use of rice straw and cow manure compost helps increase rice production without increasing GHG emission.
3
LITERATURE REVIEW
1. INTRODUCTION TO RICE
2.1. Economic importance and geographical distribution
Rice is the third most produced cereal crop in the world (770 million tonnes in 2017; FAOSTAT, 2017) and is the most important staple crop for half the world’s population (Chauhan et al., 2017). A total area of 167 million ha of paddy rice was harvested in 2017, or 12% of the world’s cultivated land. About 87% of the paddy fields were situated in Asia, and 30% in South-Eastern Asia alone. In the same year, 92% of all rice was produced in Asia (FAOSTAT, 2017).
Rice is of major importance to many Asian populations, providing food and livelihood, especially in rural regions (Mahapatra et al., 2011). It is the most nutritious cereal crop in the world: it provides 20% of the world population’s total caloric requirement and 15% of its protein needs, and it is a cheap source of minerals and fiber (Zain et al., 2014). The rice straw and husk residues can be used as compost, animal feed, renewable energy sources and construction material (Linh, 2016).
2.2. Ecology
The environment dictates rice yields by influencing the physiological processes involved in plant growth and grain production, but also by influencing prevalence of pests and diseases (Sheehy et al., 2007). Drought has become a severe problem for rice production, since the crop’s production quantity and quality are often severely decreased under limited water supply at critical growth stages (Zain et al., 2014). Every variety demands different growing conditions, so choosing the right cultivar is essential for reaching high yields.
2.3. Physiology
The duration of the life cycle of direct seeded rice is 90 to 160 days, depending on variety. A rice plant goes through three major growth stages: a vegetative, a reproductive and a ripening phase. The vegetative stage begins with the germination of the seed and lasts until the initiation of the panicle primordia (Yoshida, 1981). The formation of spikelets determines the start of the reproductive phase. The plant is said to be heading when the panicle is fully visible. The ripening stage starts after fertilization and dictates the final yield potential of the rice plant. Rice usually
4
performs well in different environments, but environmental stress can drastically reduce crop productivity by affecting growth and production stages throughout the plant life (Nawaz et al., 2017; Yoshida, 1981).
2.4. Cultivation practices for wetland rice
Wetland rice requires various specific practices for land preparation. The land is usually diked and levelled, then tilled and finally puddled. The dikes retain water on the field and prevent runoff. Levelling ensures a uniform distribution of water on the field and is a form of weed control. Tilling breaks soil compactions, ventilates the soil, stimulates the early germination of weeds, minimizes residual plant material, distributes organic matter in the soil and increases soil permeability. Puddling happens in wet soil conditions, shortly before sowing or planting, and in repetition. It destroys weeds, incorporates amendments, fertilizers and plant residues in the soil, creates favorable sowing and planting conditions and results in the formation of an impenetrable soil layer underneath the puddle layer. This layer restricts water and plant nutrient losses during submergence of the field. After puddling, rice can be either directly seeded or transplanted (Linh, 2016; Sanchez, 2019). Farmers irrigate and usually apply a range of fertilizers and pesticides during crop growth
5
2. GREENHOUSE GAS EMISSION FROM RICE PADDY FIELDS
2.1. Global warming potential of GHGsA GHG is an atmospheric gas that contributes to the greenhouse effect by absorbing and re-emitting infrared radiation (thermal radiation). The primary GHGs in earth's atmosphere are water vapor (H2O), carbon dioxide (CO2), methane (CH4) and nitrous
oxide (N2O). The planet’s atmosphere naturally contains GHGs, but human activity
has strongly raised GHG emission into the atmosphere leading to atmospheric CO2,
CH4 and N2O levels well beyond pre-industrial concentrations. This has caused
global warming and climate change, which has had widespread impacts on human and natural systems (IPCC, 2014).
GHGs have been attributed a global warming potential (GWP) value. CO2 is given the
GWP reference index value of 1, and other GHGs received a value that is expressed as a factor of the reference value, according to how much more heat a gas mass traps compared to an equal mass of CO2 (IPCC, 2007). GWP for the most important
greenhouse gasses are given in Table 1. The 100-year GWP of CH4 demonstrates
that CH4 is a 28 times stronger GHG than CO2 in a time horizon of 100 years.
Table 1. Greenhouse gases and their global warming potentials (GWP) over time horizons of 20 and 100 years. (IPCC, 2013).
Greenhouse gas 20-year GWP 100-year GWP
CO2 1 1
CH4 84 28
N2O 264 265
Agriculture accounts for approximately 10 to 12% of total global anthropogenic emissions of greenhouse gases (Smith et al., 2007). Each year, over 36 billion tonnes of CO2 is emitted globally, a number that continues to grow (Roser, 2019).
Agricultural practices, inculding rice cultivation, contribute 14% to the total CO2
emission. Around 60% of global CH4 emissions originate from anthropogenic
activities (Karakurt et al., 2012). Rice paddies are one of the largest sources of atmospheric CH4 and make up for 5 to 19% of total global CH4 (IPCC, 2007). So
while the unique semiaquatic nature of the rice plant allows it to grow productively in places no other crop could exist, it is also the reason for its emissions of CH4, as will
be explained further on. Since rice is a staple food for the growing population in Asia and it is becoming a more popular food in the world, rice production is increasing and the contribution of rice paddies to global CH4 emissions is growing as well (Van
6 2.2. Biogeochemistry of paddy soils
Paddy soils are soils used for cultivating rice and other semiaquatic crops. They can originate from any type of soil, but are highly modified by the management practices, altering the soils original character. Management practices can include artificial or natural flooding, maintaining a layer of standing water, draining and drying, puddling, hoeing, plowing and fertilizing (Kögel-Knabner et al., 2010; Ponnamperuma, 1972). During flooding, the oxygen supply to the soil is closed off. The trapped oxygen is depleted from the upper soil layer 24 to 72 hours by aerobic organisms and the soil becomes virtually oxygen free (except in a thin surface layer) (Boivin et al., 2002; Ponnamperuma, 1972). Afterwards, anaerobic and facultative organisms reduce the soil by using a series of oxidized soil components as electron acceptors for their respiration. Draining and drying reverse these reduction processes. The soil reduction results in important chemical and physiochemical processes, such as (Ponnamperuma, 1972):
- the decrease in soil redox potential (Eh) - pH changes
- reduction of Fe3+ and Mn4+ contained in various soil minerals (mainly
pedogenic (hydr)oxides) into Fe2+ and Mn2+
- accumulation of CO2
- production of organic acids, which can be further converted into CH4
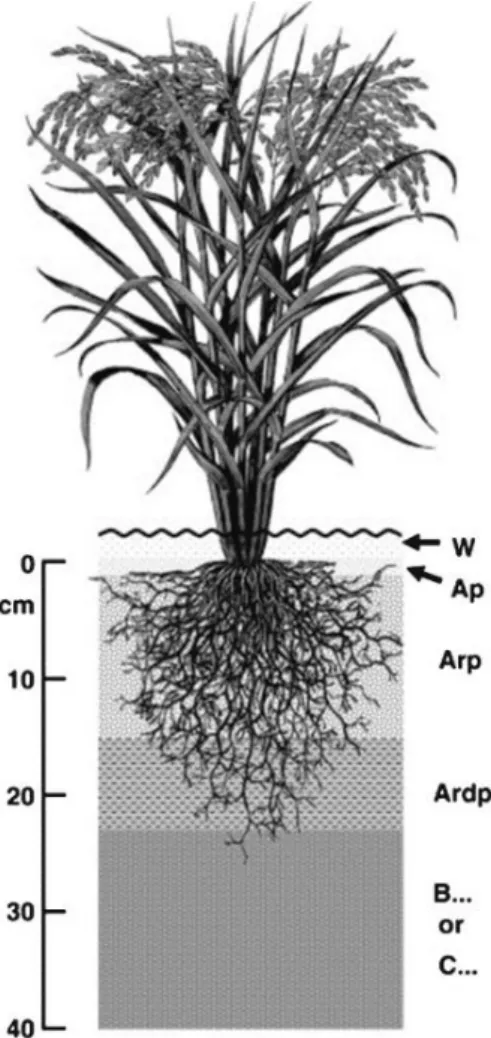
The paddy management practices result in the formation of the typical paddy soil pedogenic horizons (Kögel-Knabner et al., 2010) (Fig. 1):
1) A thin layer of standing water (W). This layer is mainly oxic and hosts bacteria, phytoplankton, macrophytes and small fauna.
2) A (partly) oxic horizon (Ap). The depth of this horizon may range from several millimeters to several centimeters and deepens throughout the growing season until the plants start releasing oxygen from their roots.
3) The upper part of the anthraquic horizon (Arp). This zone lacks free oxygen in the soil solution and is the reduced layer.
4) The lower part of the anthraquic horizon (Ardp) or plough pan. This horizon is more than 7 cm thick, it is compacted (by puddling the Arp) and has a platy structure. It has high mechanical strength and low hydraulic conductivity, obstructing water drainage to the underlying B or C horizons, in which either oxic or reducing conditions may occur.
7
Fig 1. Horizons in paddy soils (source: Kögel-Knabner et al., 2010).
2.3. CH4 emission from rice paddy soils
2.3.1. Methanogenesis in rice paddy fields
Methane is an end product of organic matter decomposition under anaerobic soil conditions (Conrad, 2002). The CH4 is produced by methanogens, an obligate
anaerobe group of archaea microorganisms. Methanogenesis is a lower energy yielding metabolic pathway process compared to aerobic respiration and iron, manganese and sulfate reduction. Methanogens require depletion of these preferred oxidants and a low redox potential for CH4, which is usually present in flooded rice
paddies after several weeks of submergence (Dalal et al., 2008). Soil organic matter (SOM), organic amendments and carbon containing plant exudates are the electron donors for methanogenesis. Two pathways of methanogenesis can occur, depending on the substrate source. The first is the hydrogenotrophic pathway, in which H2 and
CO2 are used as substrates, the second is the acetoclastic pathway, in which acetate
(CH3COO-) is used as a substrate (Conrad, 1999). They contribute about 30% and
8
archaea usually dominate in flooded rice paddy soils (Conrad, 2009, 2005). The methanogenic reactions in paddy soils are (Wassmann et al., 2000):
CO2 + 4 H2 → CH4 + 2 H2O
CH3COO- + H+ → CO2 + CH4
2 (CH2O) → CO2 + CH4
2.3.2. Methanotrophy and CH4 leaching in rice paddy fieds
Not all produced CH4 is emitted to the atmosphere. Firstly, CH4 can be used as an
energy source by methanotrophs, mostly unicellular microorganisms which are active in oxic zones. Methanotrophy occurs in paddy soils in the rhizospheres and when the soil is oxidized by draining and drying. Thus, the CH4 in paddy soils produced from
methanogenesis, is partly oxidized for methanotrophy, resulting in a lesser net CH4
emission into the atmosphere (Serrano-Silva et al., 2014). Secondly, in well drained rice fields, part of the produced CH4 leaches from the plow layer to the subsoil layer
by percolating water. The amount of leached CH4 also increases as more rice straw
is applied to the field (Kimura et al., 2004). Hence, measured CH4 emission fluxes do
not represent CH4 production.
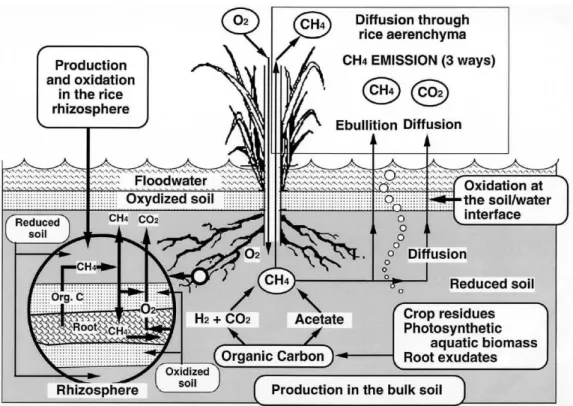
2.3.3. Methane emission processes in rice paddy soils
CH4 enters the atmosphere by three possible mechanisms: i) diffusion of dissolved
CH4 through soil and water, ii) ebullition, which is the release of CH4-containing gas
bubbles through water, and iii) plant-mediated transport, in which CH4 is transported
via the aerenchyma of vascular plants (Fig. 2). Diffusion is generated by a concentration gradient from deeper soil layers, where CH4 production is large and
CH4 oxidation is small, to upper layers where CH4 production is limited and CH4
oxidation is large. Diffusion is a slow process and makes up for less than 1% of total CH4 emissions from rice fields, but it is important because it promotes CH4 oxidation
in upper layers by facilitating contact between CH4 and methanotrophs. Ebullition, the
formation of gas bubbles, is a fast process. It is common in paddy fields and contributes 10% of total CH4 emission during crop growth. Plant mediated transport is
the major mechanism for CH4 emission in rice paddies, in which CH4 is transported
through the plant via the aerenchyma. CH4 transport is generated by a concentration
gradient inside the aerenchyma, which causes CH4 to diffuse from soil into the roots,
and by a pressure gradient, which leads the CH4 to migrate along the plant through
the aerenchyma (bulk flow). Plant-mediated transport is a very efficient and fast emission mechanism and is responsible for over 90% of total CH4 emissions from
9
Fig. 2 Methane production, oxidation and emission from rice paddy soils (Holzapfel-Pschorn et al., 1986).
2.4. CO2 emission from rice paddy soils
2.4.1. CO2 production processes in rice paddy soils
Emitted CO2 from rice paddies originates from one of six processes (Kuzyakov, 2006;
Oertel et al., 2016):
1) Photorespiration of the rice plants, sometimes referred to as “above ground respiration”
2) root respiration
3) rhizomicrobial respiration, which is the microbial decomposition of rhizodeposits from living roots
4) microbial decomposition of plant residues
5) the “priming effect” induced by root exudation or by addition of plant residues, which is the microbial decomposition of SOM in soil that is affected by roots or plant residues
6) basal respiration by microbial decomposition of soil organic matter (SOM) in root free soil without undecomposed plant remains
These CO2 sources can be grouped in plant-derived CO2 (1, 2, 3, 4) and
SOM-derived CO2 (5, 6). The evaluation of SOM-derived CO2 concentrations permits the
10
soils, fermenting bacteria start anaerobically degrading soil organic matter, in which soil organic carbon (SOC, sugars) is used as a substrate (Fig. 3) (Liesack et al., 2000). Theoretically, CO2 emission from paddy soils is limited during the submerged
period of rice growth, because the heterotrophic respiration in the deoxidized soil decreases and because of carbon fixation by algae (Dossou-Yovo et al., 2016). Nishimura (2008) found a soil carbon accumulation in paddy rice fields in Japan of +79 to +137 g C m2 y-1, while upland rice lost 343 to 275 g C m2 y-1. However,
drainage of paddies can turn these soils into carbon sources, because of increased soil aeration. Fertilization also boosts CO2 emission (Maljanen et al., 2010; Joosten
et al., 2002). Soil CO2 emissions strongly vary between cropping seasons: dry
seasons will result in higher CO2 emissions as a result of more soil oxidation and
more aerobic decomposition of the soil organic matter (Smith, 1980).
2.4.2. CO2 assimilation and leaching in rice paddy soils
Not all produced CO2 is emitted to the atmosphere. Firstly, algae and submerged
weeds assimilate part of the CO2 present in the in the floodwater by means of
photosynthesis, although they also produce CO2 through respiration. Secondly, CO2
is present in the soil as bicarbonate ions (HCO3-). Water from the plow layer
percolates to subsoil layers and thus leaches HCO3-, along with a variety of cations
11
Fig. 3 CO2 producing decomposition processes of soil organic matter. (Inglett et al., 2004)
2.5. Factors regulating CH4 and CO2 emissions from rice paddy soils
2.5.1. Soil redox conditions
Methane formation usually requires redox potentials of -150 to -190 mV. The Eh in flooded rice soils can be as low as -250 to -300 mV (Neue et al., 1996; Pacey et al., 1986). According to Yagi et al. (1997), methane fluxes are highest near the late stages of the cropping season, when the Eh drops to -200 mV. It is important to keep in mind that the measured Eh is not always a correct representation of the soil reducing conditions, because the Eh in different soil zones can vary due to aerobic and anaerobic microsites around the rhizosphere and in the bulk soil (Shine et al., 1990). The magnitude of redox changes in paddy soils can vary from one soil to another. After draining and drying the paddy soil, the redox potential also increases rapidly from negative to positive values of 300-600 mV, thus decreasing CH4
emissions (Moormann et al., 1978).
Submergence and soil drying are obviously dominant determinants of soil redox potential and therefore occurrence of methanogenesis. Several authors logically reported a positive correlation between CH4 emissions and the water table depth
(Serrano-Silva et al., 2014; Linquist et al., 2012). In conclusion, the irrigation management of a rice field is one of the most important factors influencing CH4 emissions.
12
2.5.2. Soil pH
The pH range of most methanogens is 6.0–8.0, so a neutral pH is favorable for CH4
production (Garcia et al., 2000). The exact optimum for methanogenesis, however, is influenced by the type of soil (Minami, 1995). CH4 production is inhibited when the pH
drops below 6 (Pacey & DeGier, 1986). Soil pH is variable during rice cultivation as soil reduction is accompanied by pH changes. Acid soils can obtain a higher pH due to the consumption of protons, and in alkaline soils a lower pH can be observed because of the increase in partial pressure of CO2 (Kögel-Knabner et al., 2010;
Sahrawat, 2005). As a result in submerged paddy fields soil pH normally evolves towards neutral conditions, i.e. favorable for methanogenesis.
2.5.3. Soil temperature
Soil temperature influences the rate of microbial activity, thus the CH4 and CO2
production in the soil. Most methanogens function in a temperature range of 20 to 40 °C, with an optimum of 30 °C, but methanogens can be found in the range from 4 to 110 °C (Garcia et al., 2000; Neue et al., 1996). Pacey and DeGier (1986) showed a major reduction of CH4 emissionwhen temperatures decreased to 10 - 15 °C, and a
stop in CH4 emissions above a temperature of 60 °C.
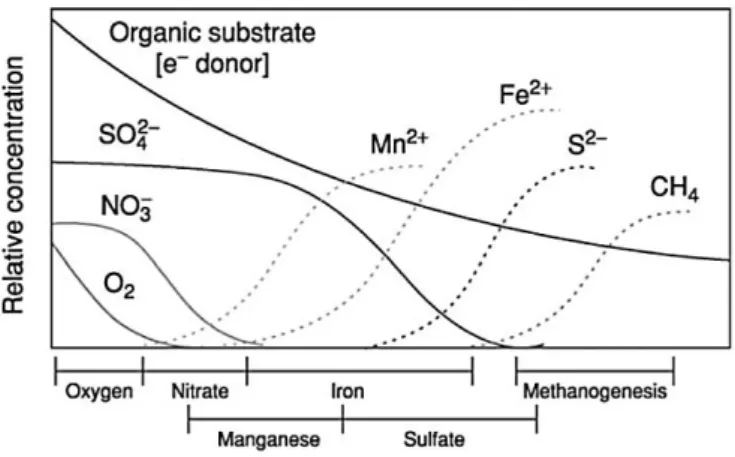
2.5.4. Fe and Mn
The oxidation-reduction potential (Eh) of the electron accepting soil components determines which soil component is depleted first when soil is becoming increasingly reduced. The sequence is determined by thermodynamics and includes, from high Eh to low Eh: aerobic respiration, nitrification, denitrification, Mn+4 reduction, Fe+3
reduction, SO4-2 reduction and methanogenesis (Fig. 4) (Ponnamperuma, 1972;
13
Fig. 4 Sequential reduction of oxidants and accumulation of reductants ( -— oxidized com-pounds, - - - reduced
compounds) in rice paddy fields. (Inglett et al., 2004)
Theoretically, CH4 is not produced before all reducible Fe3+ and Mn4+ is depleted,
which happens at a higher Eh (around -100 mV) than methanogenesis (around -200 mV). Fe3+ is by far the most important oxidant in rice paddies in terms of quantity
(Yao et al., 1999). In soils with high Fe and SOM concentrations, the Eh first rapidly falls to -50 mV and then slowly declines to -200 mV over a period of a month. On the other hand, in soils low in Fe concentrations with high SOM concentration, an Eh value of -200 to -300 mV is attained within only two weeks after submergence (Ponnamperuma, 1972). Thus the amount of reducible forms of Fe and Mn present in the soil, determines the duration period in which soil organic matter is oxidized to CO2 , and CH4 production does not yet begin. The CO2 / CH4 ratio
depends on the soil oxidizing capacity, which is expressed by the amount of O2,
NO3-, Mn4+ and Fe3. It should be kept in mind though that as explained above the Eh
throughout the soil puddle layer is heterogeneous and iron reduction and methanogenesis can co-exist. Also, while Fe3+ is abundantly present in soil, the rate
at which it is available for reduction may also be too slow and so methanogens use SOM for respiration before all Fe3+ is depleted.
2.5.5. Fertilization
a) Application of nitrogen fertilizers
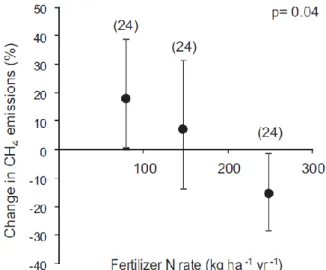
The net effect of N-fertilizer application on CH4 emission seems to be N-dosage
dependent. Linquist et al. (2012) in a meta-analysis found that on average at low N rates (averaging 79 kg N ha−1) CH4 emissions increased significantly by 18% (95%
CI: 0.01–39%) (Fig. 5). At moderate N rates, there was no significant effect of N additions on CH4 emissions but at high N rates (averaging 249 kg N ha−1) CH4
14
(2012) hypothesized that these results can be explained by the various effects of N fertilization on CH4 production, oxidation and transport. Nitrogen generally limits rice
growth in flooded soils; therefore, at low N rates plant growth increases more per unit of N applied than at high N rates. Compared to unfertilized smaller plants, fertilized larger plants provide more carbon substrate for methanogenesis as roots and root exudates serve as a major carbon source for CH4 production. In contrast, the relative
effect of N rate on plant productivity diminishes at higher N rates, leaving more NH4+
in the soil solution to stimulate CH4 oxidation. Excess soil NH4+, as would be
expected at high N rates, has the net effect of promoting CH4 oxidation rather than
inhibiting CH4 consumption, thereby reducing CH4 emissions at the field scale
compared to low N rates and the control. The type of N-fertilizer also results in different CH4 emissions. In a 3-year field experiment by Zou et al. (2005), CH4
emissions decreased after urea (CH4N2O) application, and when ammonium sulfate
was applied, CH4 emissions were lower compared to when urea was used as a
fertilizer. This was explained by the competition of methanogens and sulfate-reducing bacteria. Linquist et al. (2012) also found that replacing urea with ammonium sulfate at the same N rate, CH4 emissions were reduced significantly by 40%.
Fig. 5 The effect of inorganic N additions on CH4 emissions relative to when no fertilizer was applied. The
numbers between parentheses indicate the number of observations used in the meta-analysis of Linquist et al. (2012). The 95% confidence intervals are presented by the error bars. (Linquist et al., 2012).
Fertilization also has shown contradictory effects on soil CO2 flux. N-fertilization can
result in suppression of CO2 emission, enhancement or no effects. However, many
experiments observed a positive effect of N-application on CO2 emission.
Theoretically, use of N-fertilizers increases crop production, which results in a higher residue input in the soil, which means an increased SOM content. N-addition can also boost decomposition rates of soil organic matter, by enhancing the efficiency of
15
C-mineralization for microbial growth. This results in higher CO2 emissions. (Iqbal,
2016).
b) Application of organic amendments
Organic amendments such as crop residues, compost and livestock manure are frequently applied to paddy soils worldwide. As amendments increase SOM concentrations, which serve as carbon substrates for soil microorganisms, microbial fermentation activity increases and so do CO2 and CH4 emissions (Jeong et al.,
2018). Thus, high SOM levels result in high CH4 and CO2 production rates. Biochar and composted organic sources, such as Azolla compost, have less effect on methanogenesis than fresh organic materials, resulting in a smaller CH4 emission
increase caused by applying amendments (Serrano-Silva et al., 2014; Jeong et al., 2018). However, it should be noted that the composting processes in se can release high amounts of GHGs and the effect of compost application on total GHG emission from rice cultivation is uncertain. A study by Pandey et al. (2014) found an increase in CH4 emissions of 230%, 150% and 38%, when applying farmyard manure, straw
compost and straw biochar, respectively. Application of poultry manure on the other hand, increases CO2 emission because of the carbon supply, but reduces CH4
emission as its high sulfur content inhibits methanogenic microorganisms (Serrano-Silva et al., 2014). Generally per unit dry matter (DM) applied, the emission of CH4 is
stronger for green manures than composts or farmyard manure as the former are better biodegradable.
16
3. INCORPORATION OF UPLAND CROPS IN THE RICE BASED
CROPPING SYSTEM
Rice is usually cultivated as a monoculture. The soil conditions required for rice cultivation are created by specific management practices. In rice monocropping, the soil is puddled before the start of every growing season, which creates a plow layer, through which water cannot easily percolate, resulting in enhanced water and nutrient efficiency of rice (Mousavi et al., 2009). However, puddling also deteriorates soil physical properties forming hardpans at shallow depths, which has potential negative effects on the next rice crop, and has significant negative effects on any upland crop that may follow the rice crop (Gathala et al., 2011).
The use of upland crops in a rice rotation system is an alternative strategy to control unfavorable aspects of rice monoculture, which also improves soil characteristics and diversifies agricultural activities (Lima et al., 2002). The impending water scarcity and Asia’s rapid economic and social development is driving farmers to incorporate upland crops into their crop rotation (Janz et al., 2019). Often drought tolerant upland rice is chosen as an upland crop, but more and more farmers use maize in their crop rotation, due to the increasing demand for livestock and biomass for biofuel production (Timsina et al., 2010). The rice-upland crop rotation is the most applied agricultural production system in Bangladesh, China and India, the rice-wheat rotation system in particular (Timsina et al., 2001). In conclusion, the traditional paddy rice cropping system is being transitioned towards the integration of upland cropping practices, at least during the dry season (Janz et al., 2019).
When shifting from long-term monocropping to a rice-upland crop rotation, the soil properties of the rice paddy fields change. Among others, the introduction of an upland crop into the cropping system, brings a transition in microbial C and N cycling through changes in soil aeration (Janz et al., 2019). During the upland crop season, there is no water basin and soil is kept aerated during the entire season. Soil microorganisms then decompose SOM aerobically, inhibiting methanogenesis. Moreover, the frequent cycling between aerobic (upland crop season) and aerobic (rice crop season) soil conditions result in a greater decomposition of SOC in general, resulting in higher CO2 emissions (Xu et al., 2007; Motschenbacher et al.,
2011). Weller et al. (2015) found that a shift from a rice-rice system to a rice-maize system significantly mitigated CH4 emissions due to higher soil aeration. However,
N2O emissions were increased and soil carbon stocks were mobilized. The benefits
17
al. (2015) is in fact one of the only investigations of the impact of upland crop introduction in rice-based rotations on soil greenhouse gas balance. It cannot represent all possible combinations of crop rotations/climates/soil types and further work is needed to see if introduction of upland crops is indeed a sound CH4 emission
strategy.
The introduction of upland crops in rice cropping systems moreover does not only create a shift in GHG emission pattern, it also affects soil fertility. According to Witt et al. (2000), the cultivation of high yielding rice and maize hybrids requires increased nutrient supplies in intensified crop rotations. This often results in imbalanced fertilizer use, soil nutrient mining and a decline in SOC content. Consequently, such cropping systems often have low productivity. However, improved crop and nutrient management may negate these negative effects (Timsina et al., 2010). Xuan et al. (2012) has reported the positive effect of crop rotation in the Vietnamese Mekong Delta (VMD) on the rice yield and the soil bacterial community structure. A 10-year field experiment by Linh et al., (2015b) in the VMD with maize and mung bean in the crop rotation, resulted in a rice yield that was 32–36% higher compared to the control, due to improved physical quality and consequently deeper rooting depth and root mass density of the rice crops. It was concluded that crop rotation increased rice yield and promotes sustainable agriculture because soil-damaging excessive puddling and tillage are limited in upland crop management (Filizadeh et al., 2007; Mandal et al., 2014).
18
RESEARCH SETTING
1. INTRODUCTION TO THE UPLAND CROP: SESAME
1.1. Geographical distribution and economic importanceSesame is mostly grown in arid and semi-arid tropics (Islam et al., 2016; Boureima et al., 2011). Global yield was 5.53 million tonnes in 2017, grown on an area of 9.98 million ha. From 2007 to 2017, global production increased by 52%, mostly by African production (FAOSTAT, 2017). Whereas Asia used to provide the largest share of sesame seed in the world, Africa is becoming increasingly important to anticipate growing demand.
Sesame seeds are primarily used as food or food flavoring. They are especially valued for their high oil content, being around 50% of the seed weight (Ashri, 1998; Boureima et al., 2011; Islam et al., 2016). Because of its taste and chemical composition, the extracted oil is considered to be of superior quality compared to other edible oils (Bedigian et al., 1986). Sesame oil serves as edible oil used for culinary purposes, as lamp oil or as an ingredient in soaps, lubricants, pharmaceuticals and cosmetics. The expression process leaves the press cake as a waste product, which can be used as a protein rich animal feed (Bedigian, 2004; Anastasi et al., 2017).
1.2. Ecology
Sesame grows well under many circumstances. The crop adapts well to high temperatures and tropical climates. It is sensitive to chilling stress and its seeds need sufficient soil moisture to emerge (Boureima et al., 2011; Ashri & Singh, 2007), but otherwise the crop is well-known for its tolerance to drought stress and its susceptibility to waterlogging. Due to the excessive root system, the soil becomes more permeable, which makes sesame a good candidate for crop rotation. The crop can grow in a range of soil types, but prefers well-drained, moderate fertile soils at a neutral pH (5.4 to 7.7). Since sesame requires low nutrient inputs, it can be grown after more soil-exhaustive crops (Ashri et al., 2007; Bedigian et al., 1986; Islam et al., 2016). However, these low requirement conditions promise low to very low yields compared to what the crop could achieve in fertile soils with high inputs.
19 1.3. Physiology
The sesame plant has a vegetative, reproductive, ripening and a drying phase. The duration of the phases is highly variable. Because sesame is an indeterminate species, the reproductive, ripening and drying phase overlap, causing the capsules to be mature at different times. The vegetative stage reaches from germination until 50% of flowers have opened. The reproductive phase ends when 90% of the flowers have terminated flowering At the ripening phase, the seeds mature in the capsule. The drying phase starts when the seed of ¾ of the capsules on the main stem have their final color and a dark tip. The crop is ready for harvest when 99% of the plants have completely dried capsules. It might be difficult to determine the best time for harvest since sesame capsules finish the drying period at different times, especially when the field soil is not uniform, which is very often the case (Langham, 2007). Depending upon the variety, sesame can be harvested 75-150 days after sowing (Ashri & Singh, 2007)
1.4. Cultivation practices
To prepare for the sesame crop, the land should be levelled to prevent waterlogging, and irrigated or watered by rains to ensure germination. Shortly before planting, the soil is harrowed to stop weed growth, since sesame has slow initial seedling growth and weed control is difficult at the seedling stage (Weiss et al.,1983). Fertilizer is added commensurate to the ground moisture and depending on the residual nitrogen from previous crops (Langham, 2008)
20
2. THE VIETNAMESE MEKONG DELTA (VMD)
The Mekong Delta is the world’s third largest delta (Li et al., 2017). It stretches through the south of Cambodia and Vietnam and is fed by river branches and canals originating from the Mekong River (Reiner Wassmann et al., 2004). About 65% of the delta is located within Vietnamese borders, covering 3.9 million ha (39,000 km2) of
which 2.9 million ha are cultivated. In 2000, rice production constituted 78% of the land use in the VMD. (Reiner Wassmann et al., 2004). Nearly 18 million people (20% of the Vietnamese population) are living in the VMD and the region has the largest agricultural activity in Vietnam (Renaud et al., 2012; Kontgis et al., 2019). Depending on a region’s ecology, rice is cultivated in two or three cropping seasons per year (Linh, 2016). The VMD’s agricultural practices have intensified the past few decades (Renaud et al., 2012).
Vietnam produced 29,754 tonnes of sesame seed in 2017 on an area of 37,038 ha. The average seed yield was 803 kg ha-1, which is higher than the global average of
554 kg ha-1. Vietnam is a net-import country (75,107 tons in 2016) (FAOSTAT, 2017).
In the VMD, sesame is mostly cultivated by smallholder farmers (Le, 2018).
The VMD is nearly at sea level (<2m, Wassmann et al., 2004). The region has a tropical monsoon climate and is characterized by a dry (November-May) and a wet (June-October) season (Lu & Sieuw, 2006). The crops are irrigated by the Mekong river or rainfed in the wet season. The average monthly temperature varies between 25 and 28°C. Fluvisols are the most prevalent soil type in the delta, covering 31% of the land, mostly along the Mekong river banks (Linh, 2016).
21
MATERIALS AND METHODS
1. STUDY SITE
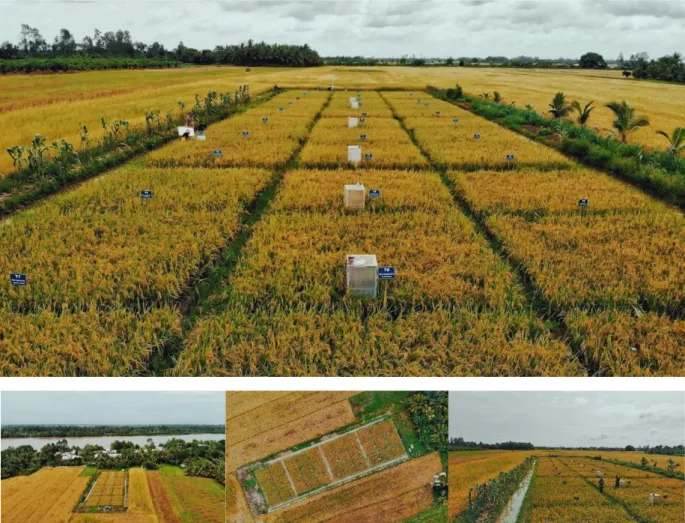
To tackle this MSc-thesis’ research objectives, greenhouse gas emissions and yield parameters were followed in a field experiment established and managed by Can Tho University in the Vietnamese Mekong Delta. More specifically this trial was laid out at the My Loi hamlet, Thien My commune, Tra On district, Vinh Long province (9°57'13.07" N, 105° 55' 58.01" E) (Fig. 6 , Fig. 7). The paddy fields were located within a 150m distance of the Song Tra On river, a tributary of the Song Hau river.
Fig. 6 Photos of the field experiment during Summer-Autumn season in Vinh Long province in the Vietnamese Mekong Delta (2019).
22
Fig. 7 Location of the field experiment in Vinh Long province in the Vietnamese Mekong Delta.
The study area had a tropical monsoon climate and is characterized by a dry season (November-May) and a wet season (June-October). The mean daily temperature was 27°C. The soil of the study site was a young alluvial soil, more specifically Rhodi-Gleyic Luvisols (FAO/Unesco). This soil type is representative for a large part of the Mekong delta. Soil horizon details are given in Table 2.
Table 2 Details of the soil horizons at the field expemriment in Vinh Long province in the Vietnamese Mekong Delta.
Soil horizon
Texture % OM
% sand % silt % clay USDA/Taxonomy
Ap (0-15 cm) 1,36 53,54 45,10 Silty clay 5,52
Bg1 (15-45 cm) 0,89 48,37 50,74 Silty clay 0,60
Bg2 (45-100 cm) 1,09 45,68 53,23 Silty clay 0,60
23
2. FIELD EXPERIMENT
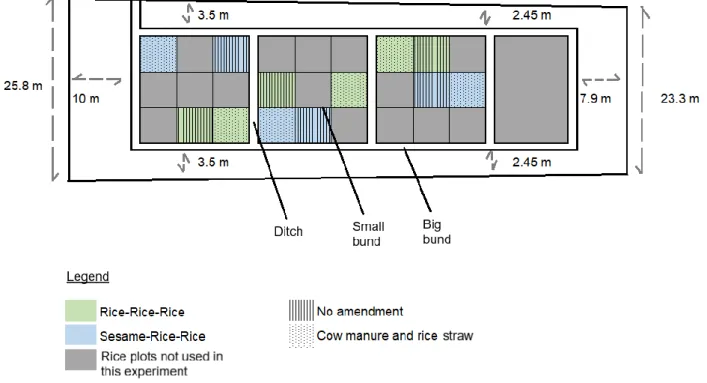
1.5. Experimental design
The field experiment involved the comparison of a rice monoculture cropping system (R-R-R) and a rice-sesame-rice rotation (R-Se-R) as principal factor. In addition a second factor was amendment of exogenous organic matter. For this thesis, plots amended with a mixture of cow manure and rice straw (CA) were compared with no applied amendment (NA) as control. The field was laid out in a split-plot design with the crop rotation system as the main factor and amendment application as a subfactor, with three replications.
The original experiment also included a third crop rotation treatment with soybean and a third amendment treatment with sugar cane compost, which fell beyond the scope of this thesis. The experimental site thus consisted of 27 plots, of which 12 under investigation in this thesis research. The size of the subplots was 5.5m x 5.5m each. Main plots were separated by big bunds (50 cm wide, 40 cm high), while subplots were separated by small bunds (40cm wide, 30cm high). In addition, ditches (50cm wide and 30cm deep) between replicate blocks were made for irrigation and for discharge purposes (Fig. 8 ). In order to limit lateral movement of water between rice and upland crop plots, plastic sheets were installed along the center of the bunds to a depth of 10-15 cm.
24
The field experiment was carried out during three cropping seasons in 2018-2019 (Spring-Summer, Summer-Autumn and Autumn-Winter), covering all agricultural practices across a single year (Fig. 9). The described treatments had already been applied on the same plots the previous year. The experiment started in February 2017, but only samples of the second year, starting in February 2018, were considered in this thesis. This means that all results in this thesis could have been influenced by the effects of the treatments in the previous year.
Fig. 9 Cropping schedule from February 2018 until January 2019.
2.2 Land preparation
In order to prepare the land for rice cultivation, rice straw and stubble of the previous season were removed from the field. The land preparation practices included hoeing, puddling under shallow flooded condition and leveling under wet condition prior to seeding. For sesame cultivation, rice straw and stubble were also removed from the field. The soil was never plowed.
2.3 Crop variety and plant establishment
The rice variety used for the field experiments is a local short-duration variety (OM50404) with a growing season of 90-95 days. This variety is distributed by the Cuu Long Rice Research Institute in the Mekong Delta. Pre-germinated seeds were broadcasted uniformly on wet soil surface with an amount of 200 kg per ha. The sesame variety Me Den was used with a density of 333 plants ha-1. Its growing
season lasts 80-85 days. Holes of 20 cm depth and 20 cm spacing were made before sowing. Row spacing was 30 cm and two seeds were placed in each hole.
2.4 Fertilizer management
2.4.1 Inorganic fertilizer
Inorganic fertilizer doses were adjusted to the crop and organic amendment treatment combination (Table 3). Nitrogen, phosphorus and potassium were applied in the form of pellet urea (46% N), superphosphate (16% P2O5) and potassium
Feb Mar Apr May Jun Jul Aug Sep Oct Nov Dec Jan Crop 1 Spring-Summer Rice + Sesame Crop 2 Rice Autumn-winter Rice Summer-Autumn Crop 3
25
chloride (KCl, 60% K2O). The fertilizer recommendations for rice and sesame were
given by the Department of Soil Science and the Department of Genetics and Plant Breeding of Can Tho University, and the Department of Agricultural and Development of Vinh Long province, respectively. These doses match common practice in the area.
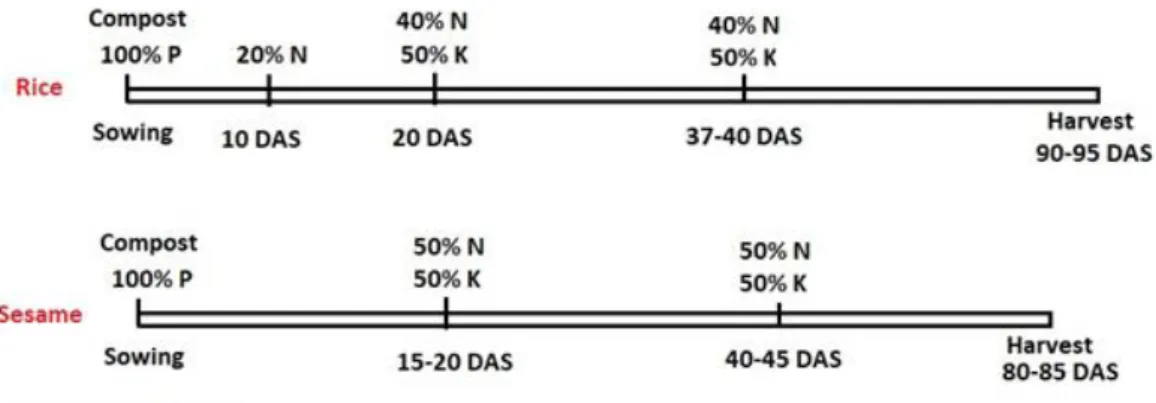
For rice, urea was applied at 10, 20 and 40 days after sowing (DAS), as 20%, 40% and 40% of the total N dose, respectively. KCl was applied at 20 and 40 DAS in equal doses. All superphosphate was applied at once prior to sowing (Fig. 10). For sesame, urea was applied in equal amounts 15 and 30 DAS. KCl was applied in equal amounts 15 DAS and 40 DAS. All superphosphate was applied once prior to sowing (Fig.)
Table 3 Fertilizer doses for rice and sesame.
Crop N (kg) P (kg) K (kg)
Rice 100 45 30
Sesame 60N 60 45
Fig. 10 Timing of fertilization for the field experiment in 2017 Spring-Summer season. (DAS = days after sowing)
2.4.2 Composts
Cow manure was collected from the local farmer's cow farm next to the field trial and rice straw was collected from the field experiment. The rice straw-cow manure mixture consisted of equal fresh matter amounts of both components (i.e. a 50:50 mixture). The manure and rice straw were mixed and incubated at the experimental site (Fig. 11). The amount of fresh compost applied was 2 ton ha-1 at a 25% moisture
level for both rice and sesame, based on local recommendations. The compost was spread on the soil surface prior to sowing for both crops (Fig. 10).
26
Fig. 11 Mixing of rice straw and cow manure for composting.
2.5 Irrigation and water management
Surface irrigation was applied as basin irrigation in both rice and sesame. This irrigation method is suitable for upland crops grown in rice-based soils according to Moridis and Alagcan (1992). The field was irrigated by pumping water from a pond located next to the field. In the rice plots, standing water was maintained at a level of 5-10 cm until about 1 to 2 weeks before harvest, while sesame was irrigated periodically.
2.6 Weed and pest management
Weeds and pests were controlled with herbicides and pesticides according to local recommendations as well as to the procedures of the International Rice Research Institute (IRRI) described by Chauhan (2012). Weed control in the rice plots was done before sowing by hoeing and puddling. Two or three DAS, pre-emergence herbicides were applied. During crop growth, weed control was done by manually removing weeds and/or by using post-emergence herbicides. Furthermore, the maintenance of field water level helped to suppress weed emergence. For sesame, pre-emergence herbicides were used at the beginning of the cropping season. In later stages, weeds were controlled by hand and/or by using post-emergence herbicides. In addition, fungicides and insecticides were applied when necessary. 2.7 Meteorological data collection
Daily climatic data were collected on site with a meteorological station. The station measured rainfall, daily maximum and minimum temperature, relative humidity, sunshine hours, solar radiation (if any) and wind speed.
27
3. SAMPLING AND MEASUREMENTS
Sampling schedules for Spring-Summer, Summer-Autumn and Autumn-Winter season are presented in Appendix A.
3.1. Redox potential
Soil redox potential was monitored in all treatments with soil redox probes (MVH Consult, the Netherlands) consisting of nylon rods outfitted with multiple Pt-electrodes. A single Ag/AgCl-reference electrode was inserted into the paddy field shortly prior to Eh measurements and Eh was measured as the potential (in mV) by connecting both electrodes with a Fluke 175 TRUE-RMS digital multimeter (Fig. 12a). The measured Eh was corrected for the Ag/AgCl-reference electrode’s offset vs. a standard hydrogen electrode. Permanent Eh probes were installed at the center of the three soil horizons: 7.5 cm, 22.5 cm and 37.5 cm.
a) b)
Fig. 12 a) Digital voltmeter with permanently installed Pt-electrode and the Ag/AgCl-reference electrode. b) Thermocouple thermometer for soil temperature measurement.
3.2. Soil Temperature
Soil temperature was measured in-situ at each gas sampling event using a K-thermocouple thermometer (Eijkelkamp, The Netherlands) at the same depths as redox potential measurement: 7.5 cm, 22.5 cm and 37.5 cm (Fig. 12b).
28 3.3. Soil pH
Soil pH was also measured at each gas sampling event and at depths of being 7.5, 22.5 and 37.5 cm. For lack of an in-situ soil pH meter, soil was taken with an auger at two depths (0-15) and (15-30) and brought to the lab, where pH was measured. 3.4. Soil pore solution
The soil pore solution was sampled in every treatment after gas sampling in order to track progressive dissolution of Fe and Mn, indicative of Fe3+ and Mn4+/3+ reduction.
Solution samples were collected by connecting permanently installed porous macro rhizon samplers (Rhizosphere products, The Netherlands) with pre-evacuated 10 ml plastic vacutainers (Fig. 13). Soil solution was collected at depths of 15, 30 and 45 cm. The samples were only taken in frequently flooded plots, meaning in all seasons for the rice treatments, but only in rice growing seasons for the sesame treatments, i.e. Summer-Autumn and Autumn-Winter season.
Fig. 13 Permanently installed macro rhizon samplers for soil solution sampling at the base of a gas chamber.
3.5 Yield components
The above-ground biomass was estimated after harvest. For both rice and sesame, plant samples were collected within an area of 5 m2. The grains and pods were
separated and the remaining straw was oven-dried at 105 °C for 48 hours until constant weight. The dried straw samples were weighed and the estimated above-ground biomass (straw, without rice grains or sesame seeds) per ha was calculated. 3.6 Soil greenhouse gas effluxes
Gas samples were collected periodically from non-steady-state closed chambers installed in the field in order to analyze carbon dioxide (CO2) and methane (CH4)
29
emissions (Fig. 14). The chambers consisted of a base collar, which was permanently installed in the field, and a lid, which was only used during sampling. The bases measured 50 cm long x 50 cm wide x 20 cm high and were made of stainless steel, while the chamber lids measured 100 cm or 50 cm in height and were made of acrylic glass. The acrylic glass was covered with reflective aluminum foil to prevent a temperature build-up inside the chambers during sampling. The lids were equipped with a circulating fan to ensure gas mixing inside the chamber and a valve through which the sample could be collected. During gas sampling, the lid was placed over the base and partially contained either the rice or sesame plants inside as well. Each of the bases was outfitted with a water-filled ditch to ensure airtight sealing between lid and collar. A 50 ml gas sample was taken from the chamber headspace with a syringe by piercing the rubber septum on top. These gas samples were then directly injected into 12 ml pre-evacuated glass exetainer vials.
a) b)
Fig. 14 Gas sampling with a closed chamber and a syringe in a rice plot. a) Chamber of 50 cm height, b) Chamber of 100 cm height.
Gas samples were taken from all treatments before sowing, one day before and three days after every N fertilization, every two weeks before harvesting and at harvest. At sampling, 6 collars were used simultaneously, and these were then rotated across the remaining treatment plots. First all rice treatments were measured, afterwards all sesame treatments. On the date of sampling, four samples were collected with an interval of 15 minutes between 9h00 and 12h00, to allow derivation of the soil gas efflux based on change in concentration of either CO2 or CH4 inside the chamber. At
each gas sampling, air temperature around the chambers was measured by a thermometer.
30
4. ANALYSIS
4.1. CH4 and CO2 concentration
All headspace gas samples were analyzed for CH4 and CO2 concentration (in ppmV)
simultaneously through gas chromatography (GC). Samples were injected with a 1 mL gas tight glass syringe with needle with a conical tip with a side hole, in splitless mode at 90°C. The oven temperature was 70 °C and the carrier gas was helium. The system had two packed columns, coupled in series, with a length of 0.25 m and 2 m successively. Total flow was 22 ml min-1 and after 0.8 minutes (when all CO2 and
CH4 had passed the first column), the first column was removed from the series in
order to rinse the H2O and other slowly eluting components out of the column in the
opposite direction. Meanwhile, the flow passed the second column, at 22 ml min-1.
The gas chromathographer was equipped with a thermal conductivity detector (TCD), used for CO2 concentration detection, and a flame ionization detector (FID), for CH4
concentration detection.
After GC, the amount of GHG inside the gas chamber (µL) was calculated by multiplying the measured GHG concentration (ppm) by the chamber volume (L). The GHG mass inside the gas chamber was then calculated by means of the ideal gas law as follows:
[𝑔𝑎𝑠] = 𝑃𝑎𝑡𝑚∗ 𝑉𝑔𝑎𝑠∗ 𝑀𝑔𝑎𝑠 𝑅 ∗ (273𝐾 + 𝑇) With
- [gas] = the mass of GHG inside the gas chamber [mg] - Patm = atmospheric pressure = 1 atm
- Vgas = calculated volume of the GHG inside the gas chamber [L]
- Mgas = molar mass of the GHG [mg mol-1]
- R = gas constant = 0.082058 L atm (K mol)-1
- T = the air temperature around the chamber recorded during gas sampling Then GHG flux rate was calculated by evaluating the change in GHG concentration inside the gas chamber through time (evaluation of four samples taken within the hour with 15 minutes apart).
31 4.2. Dissolved Fe and Mn
Soil solution samples were analyzed for dissolved Fe, Mn, Ca and Mg concentrations by ICP-OES analysis. When samples showed any precipitate, drops of concentrated HNO3 were added to redissolve any re-oxidized Fe and Mn. Because
oxidized Fe3+ and Mn4+ have very low solubility at normal pH, virtually any detected
Fe and Mn could be assumed to be Fe2+ and Mn2+. Furthermore, build-up of Ca2+and
Mg2+ in soil solution was taken into account because part of initially dissolved Fe2+ is
readily exchanged for Ca and Mg on the surface of soil colloids. One mole of additionally dissolved Ca2+ or Mg2+ on top of initial soil solution levels was taken
equal as one mole of Fe2+.
4.3. Statistical data-analysis
Statistical analysis was applied to investigate the effects of not only the cropping systems and compost amendments, but also of the interaction effects of these practices on the GHG emissions and crop yields. The experimental data was preliminary checked for normality and homoscedasticity. The data was then analyzed using a t-test when studying the effect of one factor, and a two-way analysis of variance (ANOVA) was used when studying the effect of two factors. To investigate significant effects, a Tukey’s test was applied. All statistical analysis was done with the R software.
32
RESULTS
1. ENVIRONMENTAL SOIL VARIABLES
1.1. Soil temperatureThe soil temperature was measured in every treatment plot at a depth of 10cm at gas sampling events. Fig. 15 shows the evolution of the soil temperature in the Spring-Summer, Summer-Autumn and Autumn-Winter season. In the Spring-Summer season, soil temperature evolution differed between R-R-R and R-Se-R rotations. The temperature in R-R-R increased from 27°C to 32°C, with local maxima around 9, 44 and 75 days after sowing (DAS), while in case of R-Se-R, temperature increased the first 46 DAS from 27°C to 29°C and decreased thereafter to 27°C. In the Summer-Autumn season and in the Autumn-Winter season, all treatments exhibited similar trends. In the Summer-Autumn season, soil temperature decreased from 29°C to 27°C, with a temperature peak of 33°C at 20 DAS. The soil temperature in the Autumn-Winter season gradually decreased from around 30°C to 26°C in all treatments.
Air temperature at the experimental field during all three seasons is given in Appendix B.
1.2. Soil pH
Soil from every treatment was taken at two depths (0-15) and (15-30) and brought to the lab, where pH was measured. The pH measurements mainly ranged from 5 to 6,5 throughout the cropping season. Since reduction reactions usually consume protons the ambient pH in the field normally reaches higher values. It seems very likely that measurements in the laboratory did not represent ambient pH in the field because of fast re-oxidation (and release of protons) in sampled soil slurries. The interpretation of pH as measured here is therefore not very helpful for interpretation of soil biochemical processes and not elaborated upon in the discussion. The pH evolution in the Spring-Summer season is shown in Fig. 16 and graphs of the Summer-Autumn and Autumn-winter season are presented in Appendix C.
33
Fig. 15 Evolution of the seasonal soil temperature variation at a depth of 10 cm under different cropping and OM amendment treatments. 25 27 29 31 33 35 -2 0 10 20 30 40 50 60 70 80 88 Te m pe ra tur e (° C) DAS Spring-Summer R-R-R(CA) R-R-R(NA) R-Se-R(CA) R-Se-R(NA) 25 27 29 31 33 35 -1 10 20 30 40 50 60 70 80 91 Soil t e m pe ra tur e (° C) DAS Summer-Autumn 25 27 29 31 33 35 -1 10 20 30 40 50 60 70 80 90 94 So il te m p e ratu re (° C) DAS Autumn-Winter
34
Fig. 16 Evolution of the soil pH under different cropping and OM amendment treatments in the Spring-Summer season in the upper soil layer (0-15cm depth) and lower soil layer (15-30 cm depth).
1.3. Soil redox potential
Soil redox potential (Eh) was measured in the rice treatments in the Spring-Summer season and in all treatments in the Summer-Autumn and Autumn-Winter season. Note that in the figures the scales of Eh figures were adjusted in order to compare treatments rather than progression of Eh among seasons.
During the Spring-Summer season (Fig. 17), sesame was grown in the plots of the R-Se-R treatments. Because the fields were not flooded for sesame cultivation and Spring-Summer is the dry season, with no standing field water level and no anaerobic microbial activity expected, we did not measure Eh in the R-Se-R treatments. The Spring-Summer
4,5 5,0 5,5 6,0 6,5 7,0 7,5 -9 0 10 20 30 40 50 60 70 80 88 pH DAS 0-15cm (Spring-Summer) R-R-R(CA) R-R-R(NA) R-Se-R(CA) R-Se-R(NA) 4,5 5,0 5,5 6,0 6,5 7,0 7,5 -9 0 10 20 30 40 50 60 70 80 88 pH DAS 15-30cm (Spring-Summer)