DECARBONISATION OPTIONS
FOR THE DUTCH STARCH
INDUSTRY
G. Bazan, R. Koelemeijer, D. van Dam
07 December 2020
Decarbonisation options for the Dutch starch industry
© PBL Netherlands Environmental Assessment Agency; © TNO The Hague, 2020
PBL publication number: 3656
TNO project no. 060.33956 / TNO 2020 P11629
Authors
G. Bazan, R. Koelemeijer, D. Van Dam
Acknowledgements
The authors received valuable input from Jelle de Wilde (Cargill Sas van Gent), Peter Bruinenberg (Avebe) and Barbara Huneman (Avebe), as well as useful advice and contribution by Hans Eerens (PBL).
MIDDEN project coordination and responsibility
The MIDDEN project (Manufacturing Industry Decarbonisation Data Exchange Network) was initiated and is also coordinated and funded by PBL and TNO. The project aims to support industry, policymakers, analysts, and the energy sector in their common efforts to achieve deep decarbonisation. Correspondence regarding the project may be addressed to: D. van Dam (PBL), Dick.vanDam@pbl.nl or S. Gamboa Palacios (TNO), Silvana.Gamboa@tno.nl.
This publication is a joint publication by PBL and TNO Energy Transition and can be
downloaded from: www.pbl.nl/en. Parts of this publication may be reproduced, providing the source is stated, in the form: Bazan, G., Koelemeijer, R., Van Dam, D. (2020).
Decarbonisation options for the starch industry. PBL Netherlands Environmental Assessment Agency & TNO Energy Transition Studies, The Hague.
PBL Netherlands Environmental Assessment Agency is the national institute for strategic policy analysis in the fields of the environment, nature and spatial planning. PBL contributes to improving the quality of political and administrative decision-making by conducting outlook studies, analyses and evaluations in which an integrated approach is considered paramount. Policy relevance is the prime concern in all of PBL’s studies. PBL conducts solicited and unsolicited research that is both independent and scientifically sound.
TNO Energy Transition Studies has a twofold mission: to accelerate the energy transition and to strengthen the competitive position of the Netherlands. TNO conducts independent and internationally leading research and we stand for an agenda-setting, initiating and supporting role for government, industry and NGOs.
This report has been reviewed by Avebe and Cargill Sas van Gent. PBL and TNO remain responsible for the content. The decarbonisation options and parameters are explicitly not verified by the companies.
Contents
Summary 4
INTRODUCTION
5
1
STARCH PRODUCTION IN THE NETHERLANDS
6
1.1 Potato starch production: Coöperatie Avebe U.A. 7
1.2 Wheat and maize starch production: Cargill B.V. 10
1.3 Maize starch production: Tate & Lyle 12
2
STARCH MANUFACTURING PROCESSES
13
2.1 Potato starch manufacturing 13
2.2 Wheat starch manufacturing 18
3
STARCH PRODUCTS AND APPLICATION
25
3.1 Potato starch manufacturing 25
3.2 Wheat starch manufacturing 27
4
OPTIONS FOR DECARBONISATION
30
4.1 Towards decarbonising the production process 30
4.2 Alternatives for steam production 32
4.3 Low-carbon electricity generation 36
4.4 Options for using the biomass waste 36
5
DISCUSSION
38
FINDINGS
Summary
Starch is a product which is used in numerous applications. Examples of use include food additives (e.g. sweeteners, thickeners, and other) and non-food applications (e.g. adhesives in the paper and textile industry).
In The Netherlands, three companies are representative for the starch production industry: Avebe, Cargill and Tate & Lyle. These three companies are registered by the Dutch Emission Authority (NEa) for a total of about 506 kilotonnes (kt) of direct (scope 1) CO2 emissions
(2019). The three companies manufacture three types of starch. Avebe manufactures potato starch, Cargill manufactures starch from wheat and maize, and Tate & Lyle manufactures maize starch. This report discusses only the production of starch from potatoes and from wheat in detail. In this respect, Avebe operates two locations in the northeast of The Netherlands and Cargill has two locations in the southwest of The Netherlands.
The CO2 emissions are caused by the burning of natural gas in combined heat and power
plants (CHPs) or steam boilers to create heat, which is mainly used for dewatering and drying steps in the manufacturing processes. In particular, for potato starch most of the energy is used for evaporation of water to obtain native starch and Protamylasse. For wheat starch most of the energy is used to evaporate water for obtaining starch, sweeteners and pentosanes.
The decarbonisation options for the starch industry include application of biomass-fired CHPs and boilers, hydrogen boilers, electric boilers, geothermal energy, biogas production, heat pumps, vacuum drum filters, and electro-osmosis dehydration.
FULL RESULTS
Introduction
This report describes the current situation for starch production in the Netherlands and the options and preconditions for its decarbonisation. The study is part of the MIDDEN project (Manufacturing Industry Decarbonisation Data Exchange Network). The MIDDEN project aims to support industry, policymakers, analysts, and the energy sector in their common efforts to achieve deep decarbonisation. The MIDDEN project will update and elaborate further on options in the future, in close connection with the industry.
Scope
This study contributes to MIDDEN by analysing the case of the Dutch starch industry. It provides a general overview for the specific firms registered in the CO2 emission database of
the Dutch emission registration authority NEa (NEa, 2020). We choose reference year 2017 since most energy and emission data is available for that year. Wherever relevant,
developments after 2017 are included in this report.
The total CO2 emissions of the 48 companies that encompass the Dutch Food Industry within
the emission registered by NEa account for approximately 2.25 Mt of CO2 emissions per year
and 23% of this amount (0.5 Mt) is emitted by the starch industry (2018). The Dutch starch industry is represented by three main companies: Avebe U.A., Cargill, and Tate & Lyle. These companies are specialized in potato starch, wheat and maize starch, and maize starch, respectively. The emissions addressed in the study are those falling under scope 1 (direct emissions on-site) and scope 2 (mostly due to electricity generation).
This study focuses on analysing Avebe and Cargill. Cargill’s analysis focuses on the
manufacturing of wheat starch as it represents the biggest share of their operations. Avebe manages two potato starch manufacturing plants located in Ter Apelkanaal and
Gasselternijveen. The products of the manufacture of potato starch include potato starch, protein, food ingredients and Protamylasse for cattle feed. Cargill operates two plants located in Sas van Gent and Bergen op Zoom. The products of the manufacture of wheat starch include sweeteners, vital gluten, bran, and ethanol.
Reading guide
The main goal of this report is to map decarbonisation options for the Dutch starch industry, in particular for the potato and wheat starch industry. To do so, this study has been focused on the current and alternative firm-scale production processes within Dutch starch
manufacturing. This report proceeds as follows.
Section 1 gives a general introduction to the starch industry production in the Netherlands. Section 2 describes the current situation of the starch production processes implemented in the Netherlands. Section 3 describes the relevant products aligned to the processes
described in Section 2. Section 4 presents options for decarbonisation and Section 5 discusses the listed options.
1 Starch production in
the Netherlands
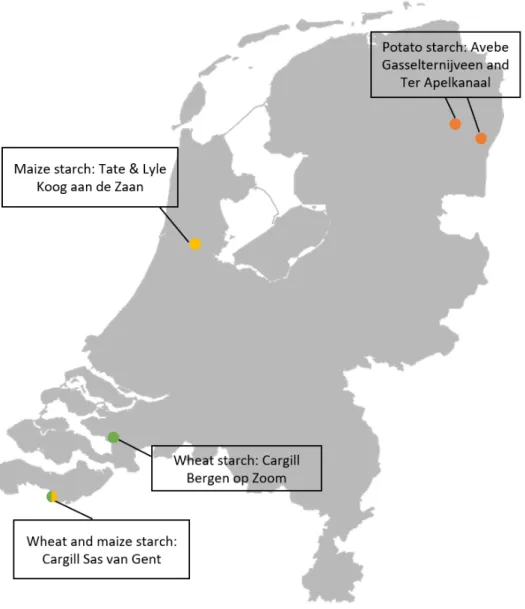
The Dutch starch industry registered with the NEa encompasses three companies: Avebe U.A., Cargill, and Tate & Lyle. Although the overview includes the three companies, this report focuses on the manufacturing processes of Avebe (two plants) and Cargill (two plants). The reason is that the three companies produce starch from different raw materials, in which each manufacturing process is specific and complex. Given the time constraint for this work, we focussed on the processes at Avebe and Cargill, as they represent the biggest share of CO2 emissions within the Dutch starch industry. A map of the EU-ETS starch
production locations of starch as registered in the NEa emissions database is shown in Figure 1.
Figure 1 Map of the EU-ETS starch production locations registered by the NEa. Brown means potato starch, green means wheat starch and yellow means maize starch.
1.1 Potato starch production: Coöperatie Avebe U.A.
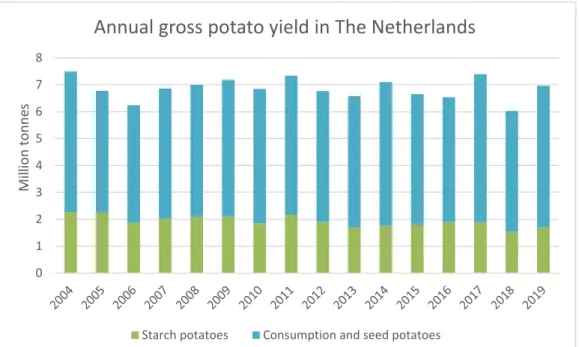
The main producer of potato starch in the Netherlands is Coöperatie Avebe U.A., further abbreviated as Avebe. Avebe is a cooperation of starch-potato growers focused on extracting starch and proteins from starch potatoes. It started its operations in 1919 as a potato sales agency arranging the sales for several independent cooperatives. Currently, it specialises in selling products for different markets such as food, paper, construction, textiles, adhesives, and animal feed.Avebe is active throughout the complete supply chain. It is a company without a real profit objective focusing in obtaining the highest price for the raw material of its members, the potato growers. Avebe has production locations in The Netherlands, Germany and Sweden (Avebe, 2020). About 25% of the potatoes harvested in The Netherlands are used for the production of starch, as is shown in Figure 2. The total amount of harvested starch potatoes in The Netherlands in recent years has fluctuated between 1.89 million tonnes in 2017 and 1.55 million tonnes in 2018 (CBS Statline, 2020).
Figure 2 Annual gross yield of starch potatoes and other potatoes (consumption and seed potatoes). 2019 numbers are preliminary (CBS Statline, 2020)
Avebe has its headquarters in Veendam, and manufactures potato starch at two plants within the Netherlands. Avebe also owns a factory in Foxhol (Avebe, 2019b) which used to be an EU-ETS registered site, but no potatoes are processed there anymore. There is only a factory for non-food starch derivatives left in Foxhol.
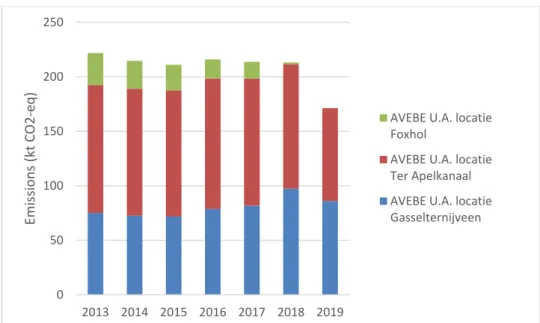
Avebe reports its GHG emissions in the Integrated Annual Report, but these include the two plants in Germany and one in Sweden (Avebe, 2019c). Therefore, we use the emissions report by NEa (NEa, 2020). The emission development per location is shown in Figure 3 and Table 1. 0 1 2 3 4 5 6 7 8
M
illi
on
to
nn
es
Annual gross potato yield in The Netherlands
Figure 3 Emission development Avebe per location (NEa, 2020) Table 1 CO2 emissions of the Avebe locations (NEa, 2020)
CO2 emissions (tonnes)
2013 2014 2015 2016 2017 2018 2019
Avebe Ter Apelkanaal 117,382 116,471 115,800 119,805 116,642 114,262 85,212 Avebe Gasselternijveen 75,164 72,620 71,855 78,802 81,842 97,350 86,081 Avebe Foxhol 29,225 25,560 23,402 17,279 15,241 1,602 0
1.1.1 Avebe plant Ter Apelkanaal
The plant in Ter Apelkanaal is Avebe’s biggest plant in terms of potato processing capacity. Ter Apelkanaal processed about 1,000 kt potatoes in 2012 (Bruinenberg, 2012), but has a capacity of about 1,200 kt potatoes in 2019 (Avebe, 2019a). This facility manufactures potato starch, food ingredients, feed protein and dextrines. The CO2 emissions of this plant
are shown in Table 1.
Avebe Ter Apelkanaal receives some of its required heat from a combined heat and power plant (CHP) which is nowadays owned by Avebe and previously known as Dobbestroom VOF (ACM, 2014). The CHP is integrated in Avebe’s operations and includes three GT10 gas turbines with waste heat boiler (‘afgassenketel’) and a steam turbine (EEA, 2019). According to Bruinenberg (2012), Avebe delivers all their generated electricity to the grid and rebuys the necessary amount for its operations. This is because natural gas used for electricity production within a CHP is exempted from energy taxes as long as the installations have an electrical efficiency of at least 30% (CODE2, 2014). The CHP in Ter Apelkanaal operates during the whole year, although its production is lower outside the potato campaign.
The total emission according to NEa is 116.6 kt CO2 in 2017; assuming a natural gas
emission factor of 56.6 kg/GJ, this amounts to 2.1 PJ natural gas consumption. Based on the European Large Combustion Plants (LCP) database (EEA, 2019), the CHP natural gas input of the CHP was 1.0 PJ in 2017, resulting in a steam or heat output of 0.5 PJ and an electricity output of 0.3 PJ (efficiencies estimated according to the PBL SAVE model (Van Hout, Wetzels, & Daniels, 2019)). 0 50 100 150 200 250 2013 2014 2015 2016 2017 2018 2019
Em
issi
on
s (
kt
C
O2
-eq
)
AVEBE U.A. locatie Foxhol
AVEBE U.A. locatie Ter Apelkanaal AVEBE U.A. locatie Gasselternijveen
The remaining natural gas is used for boilers and dryers, assuming a boiler efficiency of 90% this results in additional steam and heat production of (2.1-1.0)*90%=0.95 PJ1. The total
steam and heat consumption is thus estimated at about (0.95+0.5=) 1.5 PJ.
From the rate between heat and electricity (Section 3.1) as published by Avebe (Avebe, 2019c), we estimate the electricity use of Avebe Ter Apelkanaal to be about 0.5 PJ.
1.1.2 Avebe plant Gasselternijveen
The Avebe plant Gasselternijveen has a capacity of 1,200 kt of potatoes (Avebe, 2019). This facility manufactures potato starch as well as proteins for food and feed use. The CO2
emissions of this plant are shown in Table 1.
Avebe Gasselternijveen receives its required heat from a CHP which is nowadays owned by Avebe and was previously known as Hunzestroom VOF (ACM, 2014a). The CHP is a gas turbine with waste heat boiler (EEA, 2019). Similar to the location of Ter Apelkanaal and following the same exemption of energy taxes, this plant delivers all of its generated electricity to the grid and rebuys the necessary amount for its operations. The CHP in Gasselternijveen only operates during the potato campaign.
The total emission according to NEa amounts to 81.8 kt CO2 in 2017; assuming a natural gas
emission factor of 56.6 kg/GJ, this amounts to 1.4 PJ natural gas consumption. Based on LCP data (EEA, 2019), the CHP natural gas input was 1.2 PJ in 2017, resulting in a steam or heat output of 0.64 PJ and an electricity output of 0.45 PJ (efficiency estimated according to the PBL SAVE model (Van Hout, Wetzels, & Daniels, 2019)).
The remaining natural gas is used for boilers and dryers, assuming a boiler efficiency of 90% this results in additional steam and heat production of (1.4-1.2)*90%=0.22 PJ1. The total
steam and heat consumption is thus estimated at about (0.64+0.22=) 0.86 PJ.
From the rate between heat and electricity (Section 3.1) as published by Avebe (Avebe, 2019c), we estimate the electricity use of Avebe Gasselternijveen to be about 0.3 PJ.
1.1.3 Production Avebe
The total amount of consumed heat for the two sites is estimated to be 2.3 PJ. Using heat consumption per tonne of product (as calculated in Section 3.1), the total production can be estimated from this number.
If heat losses and processes not described in the report are not taken into account, the production would amount to about 0.8-0.9 million tonnes of starch, which means that 3-4 million tonnes of potato were processed. The actual amounts are lower. Avebe itself indicates that about 2.5 million tonnes potatoes are processed annually (Nieuwe Oogst, 2018),
including the Avebe sites abroad. This would mean on average a starch production of about 550 to 600 kt.
Avebe aims for lowering the carbon footprint of its products (including growth and transport of potatoes) by 12% from 2018 to 2023 (Avebe, 2019d), at least by implementing
innovations to its production process (more in Chapter 4).
1 All numbers are rounded.
1.2 Wheat and maize starch production: Cargill B.V.
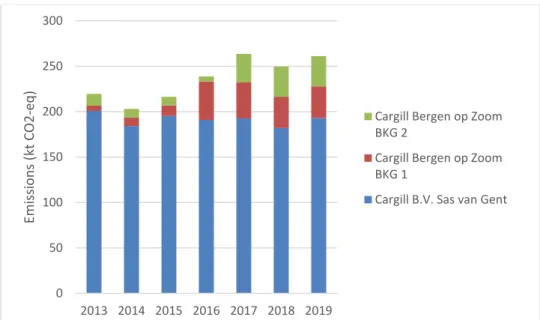
The main producer of wheat starch in the Netherlands is Cargill. This firm is an international corporation of U.S. origin with 155,000 employees in 70 countries. Cargill has different lines of production specializing in food ingredients, bio-industrial, animal nutrition, protein and salt, agricultural supply chain, and metals and shipping. Its major businesses are trading, purchasing, and distributing grain and other agricultural commodities. In the Netherlands, Cargill has its headquarters in Amsterdam and owns 8 plants. These are committed to the production of sweeteners, malt, cocoa and chocolate, oils, and texturizing solutions (Cargill, About Cargill, 2020). Cargill started operations in the Netherlands in 1959. Nowadays, Cargill Netherlands has approximately 2,200 employees and its two plants dedicated to theproduction of sweeteners are the only ones involving the starch manufacturing process. The Cargill starch plant in Bergen op Zoom started in 1979. Cargill acquired Cerestar (starch and starch derivatives manufacturer) in 2002. Cerestar included the plant in Sas van Gent. The emission development per starch manufacturing location is shown in Figure 4 and Table 2.
Figure 4 Emission development per Cargill starch manufacturing location (NEa, 2020)
Table 2 CO2 emissions of Cargill per location (NEa, 2020)
CO2 emissions (tonnes)
2013 2014 2015 2016 2017 2018 2019
Cargill Sas van Gent 200,881 184,177 195,185 190,930 192,518 182,022 192,968 Cargill Bergen op Zoom
BKG 1 5707 9348 11,519 42,410 39,606 34,405 34,892 Cargill Bergen op Zoom
BKG 2 12,981 9475 9619 5461 31,513 33,131 33,246
1.2.1 Cargill Plant Sas van Gent
The plant at Sas van Gent is Cargill’s biggest plant in terms of wheat and maize processing capacity. It processes an annual average of 230,000 and 500,000 tonnes of maize and wheat, respectively (Cargill, 2018). This report only discusses the manufacture of wheat
0 50 100 150 200 250 300 2013 2014 2015 2016 2017 2018 2019
Em
issi
on
s (
kt
C
O2
-eq
)
Cargill Bergen op Zoom BKG 2
Cargill Bergen op Zoom BKG 1
starch for this location. The main products include wheat and maize starch. The co-products differ according to the raw material. The manufacture of wheat starch produces also
sweeteners, vital gluten, bran, and ethanol. The manufacture of maize starch produces also bran, gluten feed, gluten meal, ethanol, and germ’s oil and meal. The CO2 emissions of this
plant are shown in Table 2.
Cargill Sas van Gent receives some of its required energy from four combined heat and power plants (CHP) with a total electric capacity of 26 MW (10+6+5+5) (Cargill, 2018). Following the same exemption of energy taxes as Avebe, this plant delivers 30% of its generated electricity to the grid and rebuys the necessary amount for its operations. The electricity delivered to the grid amounts to 6-11 MWe (average 10 MWe). 11 MWe is the maximum defined by the grid connection (Cargill, 2018).
The overall CHP efficiency is 95% (30% electric, 65% thermal) which is high due to the recirculation of heat gases. There is a high ratio of heat recovery as the exhaust gases (absence of oxygen due to combustion of natural gas) from the CHP are used to dry the starch to avoid the risk of explosions. 95% of the natural gas is used for energy production. The remaining 5% is used within gas boilers as a support for heating air in the units of operation that require drying. The pressure ranges between 40 bar and 0.7 bar. Likewise the temperature ranges between 60 °C and 220 °C. The average maximum temperature
accounts for 225 °C with medium pressure. Cargill utilizes a high-pressure system that serves as a storage system for energy. They can release or store whenever they need depending on the capacity (Cargill, 2018).
The total emission according to NEa amounts to 192.5 kt CO2 in 2017; assuming a natural
gas emission factor of 56.6 kg/GJ, this amounts to 3.5 PJ natural gas consumption. Based on LCP data (EEA, 2019), the CHP natural gas input was 1.0 PJ in 2017, resulting in a steam or heat output of 0.65 PJ and an electricity output of 0.30 PJ (corresponding to about 17 kt of emissions or 9% of the emissions of this site).
The remaining natural gas is likely used for boilers and dryers, assuming a boiler efficiency of 90% this results in additional steam and heat production of (3.5-1.0)*90%=2.2 PJ. The total steam and heat consumption is thus estimated at about 2.9 PJ (2017).
1.2.2 Cargill Plant Bergen op Zoom
The Bergen op Zoom plant processes an annual average of 600 kt of wheat. Its main product is native wheat starch and the co-products include sweeteners, vital gluten, bran, and ethanol. In 2012 a dedicated bio-ethanol factory was opened in Bergen op Zoom, which produces 40,000 m3 (32 kt) ethanol per year from the starch waste (Persson, 2012). The
CO2 emissions of the plant in Bergen op Zoom are shown in Table 2.
The two different registrations of Bergen op Zoom (BKG 1 and BKG 2) at the NEa have no distinction on plant level. The division was made due to administrative reasons and as a measure to obtain more CO2 allocations for further use in Sas van Gent (Cargill, 2018).
Cargill Bergen op Zoom employs a gas-fired steam boiler and also receives energy in the form of steam (45 tonnes per hour) from a nearby plant owned by Sabic Innovative Plastics. This accounts for an annual average of 30 kt of indirect (scope 2) CO2 emissions
(RegioinBedrijf, 2014).
The emissions registered at NEa in 2017 correspond to 1.3 PJ of natural gas (assuming a natural gas emission factor of 56.6 kg/GJ). Together with the heat from Sabic, we assume that the plant consumes 1.6 PJ of heat (assuming a 90% boiler efficiency).
Cargill Bergen op Zoom used to employ a CHP, but not anymore. The plant receives part of its steam from nearby facilities such as Sabic. Nonetheless, the boilers could be unplugged anytime as Cargill is aiming to once again use the CHP located onsite (Cargill, 2018).
1.3 Maize starch production: Tate & Lyle
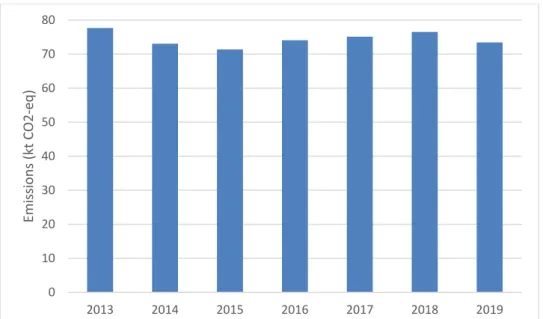
Although the production of maize starch at Tate & Lyle Netherlands B.V. in Koog aan de Zaan is not discussed in detail in this report, we have listed their CO2-emissions in Table 3 and
depicted the development in Figure 5. Table 3 CO2 emissions of Tate and Lyle
CO2 emissions (tonnes)*
2013 2014 2015 2016 2017 2018 2019
Tate & Lyle Netherlands B.V. 77,679 73,067 71,379 74,075 75,128 76,519 73,439 * Annual CO2 emissions according to NEa.
The site in Koog aan de Zaan was established in 1867 and employs 240 people. Tate & Lyle Netherlands produces polydextrose, functional starch and sweeteners (Tate & Lyle, 2018). The facility is capable of processing about 1500 tonnes of maize per day, or 550,000 tonnes per year (Welink, 2015, p. 16; Provincie Noord-Holland, 2011).
The emissions at Tate & Lyle in 2018 correspond to the use of about 1.3 PJ of natural gas (assuming a natural gas emission factor of 56.6 kg/GJ).
Figure 5 Development of emissions at Tate & Lyle Netherlands B.V. (NEa, 2020) 0 10 20 30 40 50 60 70 80 2013 2014 2015 2016 2017 2018 2019
Em
issi
on
s (
kt
C
O2
-eq
)
2 Starch
manufacturing
processes
To understand the processes related to the starch production, a general description of the manufacture processes per specific crop is presented in this chapter.
2.1 Potato starch manufacturing
The potato starch manufacturing process is based on publicly available sources and may therefore deviate from the specific process in use at the Avebe facilities.
The authors rely on Avebe’s public information. Generic and industry average data are also used. Data from the European Starch Industry Association (Starch Europe, 2018), the Reference Document on Best Available Techniques in the Food, Drink and Milk Industries (European Commission, 2019), scientific literature, industry organisations and commercial suppliers of process technology for the potato starch industry were utilised.
In comparison to cereals, potatoes cannot be stored for a long period of time. Therefore, the starch potato processing timespan is short running a few months a year depending on the potato season (European Commission, 2019). Avebe operates during a typical potato processing campaign that runs from August to April/May (Zwijnenberg et al., 2002).
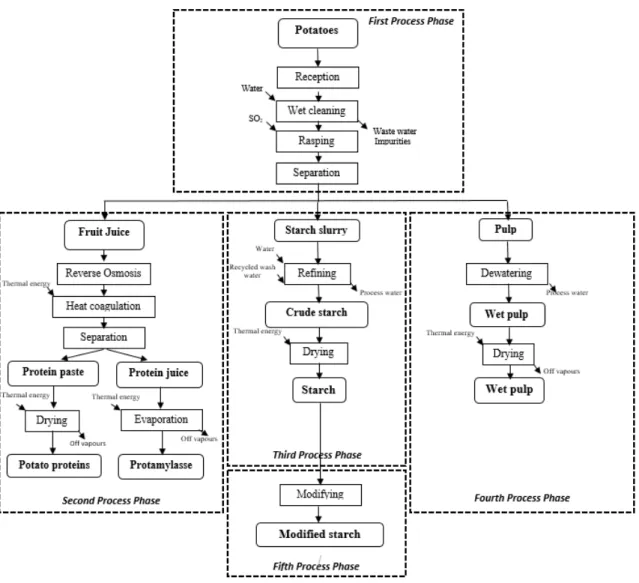
The manufacturing process of potato starch is characterised by mechanical separation of the starch from the remaining components within the potato. Following the separation, there are three separate, parallel process parts; one relates to the starch extraction, one to the protein extraction (with Protamylasse as by-product) and one to the pulp drying. The outline of the process is seen in Figure 6. This detailed outline is based on public sources and, although it can be seen as a typical or average starch production process, does not represent the process at Avebe at full detail. Also, the processes at different Avebe locations are not identical. The processes at the Avebe locations are integrated with the CHPs, which results in a more complicated situation that the one described below.
Figure 6 Diagram of the starch production process (European Commission, 2019; Starch Europe, 2018)
The production process divided in five main phases based on the main obtained products and co-products, which have been described below.
2.1.1 Phase 1 - Potato milling
The manufacturing process of potato starch starts with a quality evaluation of the received potatoes. The samples with suitable sizes for the overall process are separated through automatic sampling systems. Then, the starch content is calculated by measuring the so-called under water weight. In addition, there is an estimation of dirt load and identification of possible impurities such as stones (Bergthaller, 1999), amount of rotting, hollow heart and greening. In comparison to cereals, potatoes cannot be stored for a long period of time. Potatoes consume their starch slowly and proper storage is thus very important.
The stones are removed via traps. This follows a counter current process to the potato flow. The potatoes are moved through a stone trap that uses the difference of weights between stones and potatoes. As the potatoes are carried over the stone trap, the heavier stones are collected on a stone conveyor (ISI, 2018). Likewise, floating impurities such as rotted
potatoes, pumice and coke are also removed through specific devices. Generally, this process is followed by rotary drum washers. This machine is a drum with an internal helix to tumble and convey the parts forward through one or more cleaning stages.
The washing technical systems are selected according to local needs and the soil’s properties of the production area. Sandy soils require a light treatment while heavy loamy soils need sophisticated washing systems. Following the rotary drum washer, the potatoes are carried to a washing drum. The resulting stream of waste water is characterized by typical amounts of 15 kg of stone and sand, 40 kg of soil, 10 litres of straw and floating material and 300 l of washing water per tonne of washed potatoes (ISI, 2018).
The washed potatoes are transported to a buffer bin that feeds a rasper or grater. Starch is made accessible by carefully grinding the potato and opening a maximum of potato pulp (ISI, 2018). A common rasping method is a saw-tooth grater that is fitted with saw blades mounted in the periphery of a rotating steel cylinder. The potato is rasped within a periphery section between the rasp blades and rasp block (SiccaDania, 2020). This is a one-pass operation only if high-efficiency graters are being used. The freed starch granules by the rasping are equal to 98% of the total content of starch. Moreover, 0.1 kg of sulphur dioxide or sodium bisulfite is added per tonne of processed potato during the rasping process to exclude oxidation and to prevent the discoloration of rasped potatoes. The obtained product after the grinding is called slurry (semi-liquid mixture) (Bergthaller, 1999).
The slurry obtained from the potato rasping process is a semi-liquid mixture of pulp, potato juice (proteinaceous water) and starch. These components need to be separated either through powerful washing and rotating conical sieves, or decanters and /or hydrocyclones. Basically, the purpose is to separate solids (starch and fibres) from the juice containing valuable proteins through many different variants and combinations of the techniques mentioned. Solids may be separated by sieves and/or hydrocyclones, starches are washed with pure water, dewatered and dried. Fibres are dewatered by press filters. The potato juice enters the protein factories. Starch granules are extracted from the pulp by using centrifugal conical sieves or jet extractors (ISI, 2018). Nonetheless, the final starch slurry contains approximately 1.2% of the total input of kg of fibre (Grommers & van der Krogt, 2009). The rotating sieve permits the starch to pass but not the pulp because of their particles sizes difference. The starch granules diameters are usually between 1 and 120 μm while the pulp has an average diameter between 80 and 500 μm (Grommers & van der Krogt, 2009). The extracted pulp contains approximately a 95% moisture content (Lisinska & Leszczynski, 1989). Starch is then discharged along with potato juice. This stream is generally separated in a closed system by a decanter centrifuge (ISI, 2018). A decanter centrifuge separates solid materials from liquids based on their different densities via the centrifugal force of a high rotational speed. The average density of starch granules is 1.6 kg/l while the potato juice has a density of 1 kg/l (Grommers & van der Krogt, 2009). The stream of potato juice obtained as output has a mass fraction of total protein up to 3% in a wet basis (Zwijnenberg et al., 2002). The obtained streams are known as crude starch milk (suspension of starch with minor impurities), wet pulp and potato juice (proteinaceous water).
2.1.2 Phase 2 - Production of proteins and protamylasse
The potato juice stream is sometimes treated via membranes filtration such as a reverse osmosis (RO) and ultrafiltration (UF). UF removes a large majority of contaminants from the stream by pushing it under pressure through a semi-permeable membrane. The process of reverse osmosis works by using a high pressure pump to increase the pressure of the potato juice passing across a semi-permeable membrane. The applied pressure should be higher than the natural occurring osmotic pressure (OP). OP is the pressure that would have to be applied to a pure solvent to prevent it from passing into a given solution by the effect of osmosis. The RO divides the original stream of potato juice into a stream with the majority of the solids and a pure water stream. The first one is known as concentrate whilst the second one is called permeate or product water. The treated potato juice is divided approximately
equally in permeate and concentrate (Wang, Chen, Hung, & Shammas, 2011, p. 256). The permeate can be for other purposes such as cleaning the potatoes. The amount of pressure required depends on the concentration of solids within the water to be treated. Nonetheless, more pressure is required if the concentration is higher. Likewise, the energy consumption of a RO plant depends on the solid’s content. In average this type of plant requires 3600 kJ of electricity per cubic meter of water treated (GlobalGreenhouseWarming, 2020).
The concentrate stream can be processed through a direct heat steam injection (Kemme-Kroonsberg et al., 1997). This is a type of heat exchanger that injects precisely metered amounts of steam into the potato juice that needs to be heated. The injection of steam to the concentrate stream causes then proteins to coagulate and precipitate at different temperatures. This coagulation produces a high yield with lower quality having discoloration and off-flavour produced by the harsh-treatment. The initial temperature is in the average of 22 °C whilst the final one is approximately 115 °C. These values are within the average range used in the method of heat coagulation for protein extraction (Lokra & Straetkvern, 2009). Generally, the protein obtained from this method is used as feed ingredient for animal consumption (Lokra & Straetkvern, 2009).
The coagulated potato juice stream is separated in two main streams by a decanter centrifuge (Kemme-Kroonsberg et al., 1997). The coagulated flocculent potato protein material is separated from the remaining liquid phase (Zwijnenberg et al., 2002). The separated protein contains 70-90% protein, 3-10% lipids, 2-4% carbohydrates and 1-3% inorganic components (dry matter). Moreover, the final stream of protein contains 40-80% by weight of moisture (Kemme-Kroonsberg et al., 1997). The coagulated stream of proteins is dried to a value between 5 and 15% moisture. This step requires the use of a pneumatic flash dryer. This type of dryer uses elevated temperatures around 105 to 120 °C in which the flashing off of surface moisture instantly cools the drying without noticeably increasing the product temperature which may damage its quality. The protein stream is dispersed into a heat stream that conveys it through a drying duct. The protein dries as it is conveyed to be separated using cyclones, and/or bag filters (GEA, 2018).
The deproteinated juice is concentrated via water evaporation to obtain an average of 58% dry matter and is called ProtamylasseTM (Zwijnenberg et al., 2002). A mechanical vapour
recompression (MVR) heat pump was installed as early as 1990 at Avebe Ter Apelkanaal in the first phase of a three phase evaporator, which reduces the required steam. The heat pump runs 5000-6000 hours per year in 65% load (IEA Industrial Energy-Heated
Technologies and Systems (IETS), 2014, pp. 10-209). At Avebe, the production process does not use boiling of the potato juice to 100 oC.
2.1.3 Phase 3 - Production of Native Starch
The crude starch milk is purified from all residues and impurities. This step focuses on a continuous dilution and concentration of starch until it is introduced to a combination of hydro-cyclone and centrifuge. An amount of about 2 tonne of water is used per tonne of refined starch (Fecske, 1983).
The dewatering and drying of starch are designed to avoid the use of high temperatures. These could provoke the starch gelatinisation2 which destroys the starch’s granular structure
and thus quality (AlfaLaval, 2010). The crude starch milk is conveyed to a rotary vacuum dryer to be dewatered (ISI, 2018). A rotary vacuum dryer is a cylindrical jacketed vessel with a central agitator having specially designed blades. The blades sweep the entire internal
2 A process that breaks down the intermolecular bonds of starch molecules in the presence of water and heat. This irreversibly dissolves the starch’s granule in water (Wang et al., 2016).
surface. The vacuum helps control the atmospheric pressure which can reduce the boiling point (or vaporisation temperature) required for removing the liquid (Fuller & Abbe, 2011). The dewatered starch is conveyed to a pneumatic flash dryer type following similar
conditions to the protein’s production. The moisture of the starch is dried to a 20% content. This is the necessary amount to comply with commercial standards (ISI, 2018).
2.1.4 Phase 4 - Production of wet pulp
The stream of pulp is dewatered through a roller press. This machine uses pressure via two cylindrical rolls with a small gap between them through which the pulp is transported. This process presses out the water. This method is preferred over other technological options as it has a comparatively low energy use and the equipment is simple and cheap to produce. The dewatered pulp can be conveyed to a pneumatic flash dryer type to be dried further. At Avebe most of the pulp is sold as cattle feed before being dried (completely) (Avebe, 2020a).
2.1.5 Phase 5 - Production of modified starch
Some of the starch both in dried and wet form is being modified, in order to produce starch derivatives which specific properties. There are many different modifications of potato starch known (Grommers & van der Krogt, 2009). The use of modified starch is divided in food additives (e.g. thickeners, texturisers, and others) and non-food applications (e.g. adhesive, paper and textile industry).
2.1.6 Energy consumption: potato starch manufacturing
Potato starch production is associated with high heat consumption (mainly during drying the starch, protein isolation and Protamylasse production). Furthermore, the energy consumption varies according to three main factors. First, the amount of processed potatoes per year. Second, the starch and water content within the potato. Third, the length of the seasonal processing campaign. Furthermore, the energy consumption depends whether or not starch derivatisation is included in the starch factories. Considering these factors, it is realised that the energy consumption of starch production sites varies significantly. Annual variations in supply and market demand lead to many variants of set up of starch plants.
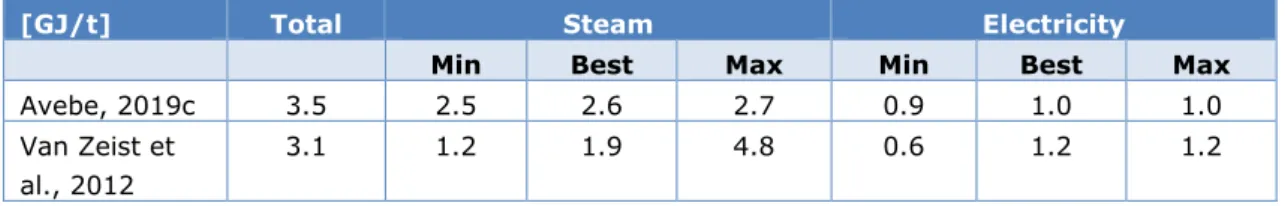
According to Van Zeist et al. (2012) in the report “LCI data for the calculation tool Feedprint for greenhouse gas emissions of feed production and utilization: wet milling industry”, the manufacture of potato starch requires between 0.32 and 1.27 MJ of natural gas as fuel per kg of processed potatoes, and 0.04-0.08 kWh electricity. According to Van Zeist et al., the processing of a kilogram of potato produces 0.238 kg of starch. These numbers correspond to 1.2-4.8 GJ steam and 0.6-1.2 GJ electricity per tonne starch. These numbers includes estimations for the Dutch industry obtained from Avebe.
Avebe itself has published information about the energy consumption of its production. The amount of electricity consumed during production according to Avebe is 0.25-0.28 MWh per tonne of product (0.90-1.00 GJ/t) and the amount of natural gas (HHV) 0.85-0.92 MWh/t (2.8-3.0 GJ/t (LHV)) (Avebe, Integrated Annual Report 2018/2019, 2019c). These numbers exclude the natural gas used for generation of electricity by the CHPs. Assuming a steam generation efficiency of 90%, we obtain 2.5-2.7 GJ steam per tonne of product.
Table 4 Comparison of energy use in GJ/t starch produced
[GJ/t] Total Steam Electricity
Min Best Max Min Best Max
Avebe, 2019c 3.5 2.5 2.6 2.7 0.9 1.0 1.0
Van Zeist et al., 2012
3.1 1.2 1.9 4.8 0.6 1.2 1.2
2.2 Wheat starch manufacturing
The wheat starch processing season runs during the whole year. As specified in the
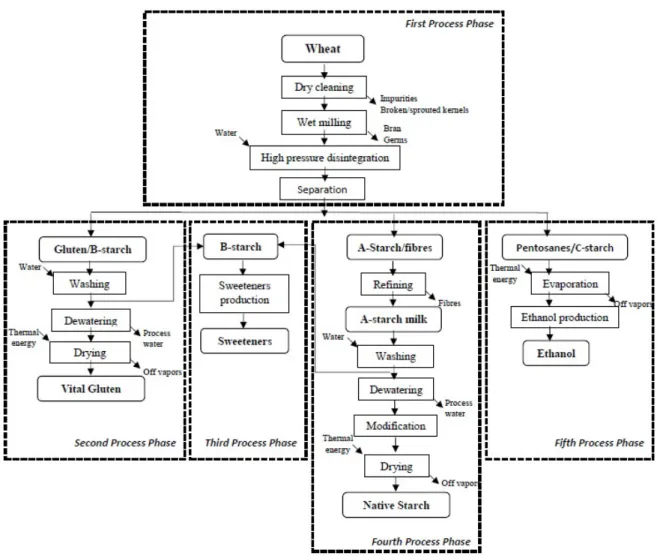
introduction chapter, Cargill processes maize and wheat into starch. This part of the report is focused on the manufacture of wheat starch. This involves all the technical methods for wet milling the wheat kernel and separating its components into the desired products. As seen in Figure 7, the current manufacturing process of wheat starch produces starch and sweeteners as the main products. In addition, there are three co-products: vital gluten, ethanol and bran.
Figure 7 Simplified manufacturing process of wheat starch
As previously mentioned, the main producer of wheat starch in the Netherlands is Cargill. Each of its two Dutch plants follow different manufacturing processes. The process is described based on Cargill’s primary data and public information, as well as specific information obtained from Cargill Sas van Gent. The collected data is used to provide estimates for Cargill’s processes at the remaining plant in Bergen op Zoom. Like the potato starch manufacture, generic and industry average data are also considered. Data from the European Starch Industry Association (Starch Europe, 2018), the Reference Document on Best Available Techniques in the Food, Drink and Milk Industries (European Commission, 2019) and commercial suppliers of process technology for the wheat starch industry were addressed.
The manufacturing process of wheat starch is characterized by mechanical separation of the starch from the remaining components within the wheat followed by a chemical process to obtain sweeteners and ethanol. Cargill’s manufacturing process follows a single pass operation to avoid the risk of dust explosions (Cargill, 2018). Moreover, the quality of the material for food applications is improved.
Figure 8 Diagram of the wheat starch production process (European Commission, 2019; Starch Europe, 2018; Cargill, 2018).
The operations are divided in five main phases according to the main obtained products and co-products, which have been described below.
2.2.1 Phase 1 - Wheat wet milling
The imported wheat has a 10% moisture content (Cargill, 2018). The kernels are cleaned throughout an equipment that separates them from seeds and other grains, eliminates foreign materials such as metal, sticks, stones and straw; and scours each kernel of wheat. Typically this process can include up to the following six specific steps (Hashmi, 2011). First, a magnetic separator is used to remove iron and metal particles that could be mixed with the received wheat kernel. Second, a separator removes bits of wood, straw and bigger and smaller particles than an average wheat kernel through vibrating screens. Third, an aspirator removes dust and lighter impurities by using air currents. Fourth, a de-stoner separates the heavier particles such as stones that have a similar size than wheat kernels. Its basic operation is based on gravity and thus the cleaning occurs due to the difference of weights between the stones and wheat kernels. Fifth, a cockle cylinder identifies the shape of the kernels and rejects any particle that differs from it. Sixth, a scourer removes outer husks, crease dirt and polish the outer surface with an intense scouring action. The loosened impurities are taken out by currents of air. After the cleaning, the obtained wheat is known as whole pure wheat. Dry cleaning is mainly used in large flour milling enterprises due to its smaller water consumption and small pollution (Zheng & Chen, 2015). Generally a 6% of the
received wheat kernels is defined as sprouted and broken kernels (Posner & Hibbs, 2004). About 2% of the weight of the remaining wheat kernels is considered as sand and smaller particles and thus removed. The use of the previous machines is specific to the plant’s operations and thus a general value for electrify consumption is addressed within a Dutch context. The energy requirements of these machines are based on the book “The chemistry and technology of edible oils and fats and their high fat products” (Hoffmann, 1989). The total electrical consumption for processing 1 tonne of wheat is about 6.2 MJ of electricity. The whole pure wheat is further treated by wet milling. The wheat kernels are gradually reduced in size by a process that involves successive passing of tempered wheat kernel through a system of break rolls, reduction rolls, sifters and purifiers to produce flour (Patwa, 2016). The first-break opens the wheat kernel and releases the endosperm. The endosperm is separated from the bran and germ layers. These are totally extracted. The endosperm is then reduced in a uniform particle size to be used as flour (Posner & Hibbs, 2004). The kernel is tempered to toughen the bran layer. The wet bran holds together rather than creating bran powder that could affect the quality of the flour. In addition, mellowing the endosperm requires a lower power consumption by the roller mills to break the kernels. Nonetheless, different wheat types require varying moisture contents. The soft wheat type requires a 15% moisture content to be successfully treated by wet milling. A soft type wheat kernel with a moisture content of 15% will have an average hardness and mass of 19.4 and 36.2 mg respectively (Patwa, 2016). Moreover, the energy requirements of this step are focused on the operation of breaking and reducing rolls. Their working principle is based on compressive and shearing forces as well as the specific grinding energy. Generally, the rolls’ gap accounts for about 0.76 mm (Patwa, 2016). Additionally, the fast roll speed is 240 rpm and the speed differential is 2.5 m/s (Patwa, 2016).
The wheat flour is disintegrated by a combination of four steps: a flour dosing system, dough mixing, agglomeration and a maturation tank (GEA, 2018). Nonetheless, the dough mixing and agglomeration are the main focus as these activities are responsible for the highest energy consumption. The dough mixing mixes the wheat flour with water by 0.85 to 0.95 parts at approximately 35° Celsius (Rosicka-Kaczmarek et al., 2017). The basic principle of the dough mixing is that the powerful spiral mixing increase the water absorption by the dough. A continuous dough mixer achieves a smooth batter type mixture. This mixture is then treated by a high pressure homogenization process. This machine follows a purely mechanical process evoked by forcing the wet wheat flour (batter) through a narrow gap at high pressure called the homogenizing nozzle. Typical pressures are up to 100 kPa for high pressure and between 350 and 400 MPa for ultra-high pressure. The high shear forces help release the starch granules from the hydrated endosperm particles and cause the gluten threads to agglomerate into micrometre-sized particles. A high shearing force is vital to achieve high yields of quality starch and gluten with low freshwater usage in the process (Bemiller & Whistler, 2009). Typically, the final slurry has approximately 47% solids (wet basis) (Rosicka-Kaczmarek et al., 2017).
The sheared batter from the high-pressure pump is fed into a three-phase decanter centrifuge or tricanter. This machine works through a three-phase separation of two liquid phases from one solid phase at the same time based on density differentiation. A tricanter centrifuge share the same technical background of mechanical separation achieved by high velocities (3650 rpm) as a decanter centrifuge. The liquid phases are divided in a heavy phase (higher density and discharged under pressure) and a light phase (lower density and discharged without pressure) (Flottweg, 2018).
The obtained streams consists of different mixtures of A-starch, B-starch, C-starch,
pentosanes, fibres, gluten and the rest of the components as it can be seen in Table 5. The A-starch is concentrated and separated in a high-dense stream including fibres. The gluten is
separated in a medium density stream including B-starch. The viscous pentosanes and other solubles including C-starch are separated in the least dense and top-flow fraction stream (Bemiller & Whistler, 2009).
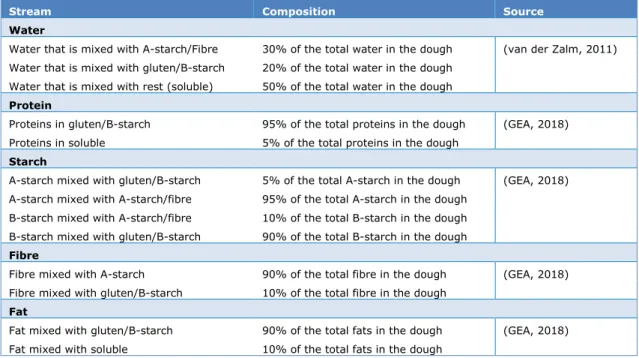
Table 5 Composition of the main components within the streams processed by the separation step
Stream Composition Source
Water
Water that is mixed with A-starch/Fibre 30% of the total water in the dough (van der Zalm, 2011) Water that is mixed with gluten/B-starch 20% of the total water in the dough
Water that is mixed with rest (soluble) 50% of the total water in the dough Protein
Proteins in gluten/B-starch 95% of the total proteins in the dough (GEA, 2018) Proteins in soluble 5% of the total proteins in the dough
Starch
A-starch mixed with gluten/B-starch 5% of the total A-starch in the dough (GEA, 2018) A-starch mixed with A-starch/fibre 95% of the total A-starch in the dough
B-starch mixed with A-starch/fibre 10% of the total B-starch in the dough B-starch mixed with gluten/B-starch 90% of the total B-starch in the dough Fibre
Fibre mixed with A-starch 90% of the total fibre in the dough (GEA, 2018) Fibre mixed with gluten/B-starch 10% of the total fibre in the dough
Fat
Fat mixed with gluten/B-starch 90% of the total fats in the dough (GEA, 2018) Fat mixed with soluble 10% of the total fats in the dough
* This amount addresses the fact that gluten is formed by the proteins within the flour. The amount of proteins in commercial gluten is up to 80% (GEA, 2018).
2.2.2 Phase 2 - Production of vital gluten
The stream of gluten including B-starch is washed in a gluten finisher. This machine ruptures the gluten once again and washes it with water to remove the last starch granules.
Nevertheless, this machine is specific to the process as it could use plates and knifes for an efficient cell rupture (GEA, 2018). Therefore, the washing of gluten is defined to be done by a hydro-cyclone with an average speed of 1000 rpm (Herbold, 2013). The principle of the gluten finisher is the similar to a hydro-cyclone as both use water to separate the main stream in two. As a result, a higher protein content is obtained. The gluten stream is further processed in this phase whilst the B-starch is conveyed to another phase. Approximately, 80% of input water is mixed with the washed B-starch (Serna-Saldivar, 2010). The gluten stream is fed to bent screens and a roller press for dewatering. The roller press squeezes and extrudes the gluten allowing final traces of water to be separated over a screen. The amount of moisture content in the gluten is reduced by a 65%. Moreover, it is defined that the gluten has a temperature increase of 1 °C. The protein is then extruded in a continuous film to the drying section (GEA, 2018). The dewatered gluten is dried in a pneumatic flash dryer to a 7% moisture powder (Cargill, 2018).
2.2.3 Phase 3 - Production of sweeteners
The production of sweeteners is defined through a black box approach. Starch-based sweeteners are produced either by a chemical or acid-enzymatic hydrolysis reaction. This reaction breaks the chemical bonds linking the glucose molecules of starch. The glucose units’ breakdown might require an initial hydrolysis reaction or combination of these. The degree of starch hydrolysis is described by the product’s dextrose equivalence (DE) which measures the percentage of glucosidic bonds hydrolysed. The acid-catalysed hydrolysis is the
most traditional method for producing sweeteners. The hydrolysis can be divided in the steps of liquefaction and saccharification to produce glucose. The first one is the partial hydrolysis of starch whilst the second one is the production of glucose and maltose by further
hydrolysis (breaking into its sugar molecules) (Chaplin, 2014). The slurry containing 35-45% starch solids is acidified to a pH of 2.0 which produces a syrup in the 25 to 45 DE range. A further conversion up to a desired DE level can be carried out by the use of enzymes. This is known as an acid-enzyme process (Hobbs & Thomas, 2009). It is defined that Cargill uses an acid-enzyme process. In it, the hydrolysis uses the enzymes α-amylase and glucoamylase under high temperature (50-90 °C) conditions. During its liquefaction, starch is gelatinized and then liquefied to dextrin and small molecules by α-amylase at a temperature of 95-105 °C and a pH of 6-6.5. During its saccharification, the liquefied slurry is cooled and the pH is adjusted to 4-4.5 (Xu, Yan, & Feng, 2016). A mixture of A-type (75% of the total A-starch extracted from the wheat) and B-type (100% of all the B-starch extracted from the wheat) starch is used for the production of sweeteners (Cargill, 2018). In many plants the refined A-starch slurry is not dried into native A-starch but further processed into A-starch sweeteners (ISI, 2018). The following chemical reaction is defined for the steps of liquefaction and
saccharification to produce glucose:
(𝐶𝐶6𝐻𝐻10𝑂𝑂5)𝑛𝑛+ (𝐻𝐻2𝑂𝑂)𝑛𝑛 → (𝐶𝐶6𝐻𝐻12𝑂𝑂6)𝑛𝑛
𝑆𝑆𝑆𝑆𝑆𝑆𝑆𝑆𝑆𝑆ℎ + 𝑊𝑊𝑆𝑆𝑆𝑆𝑊𝑊𝑆𝑆 → 𝐺𝐺𝐺𝐺𝐺𝐺𝑆𝑆𝐺𝐺𝐺𝐺𝑊𝑊
where n refers to the number of glucose residues in the starch. The energy balance is based on the amount of energy used to convert wheat grain to ethanol. According to the European Commission report “Assessing GHG default emissions from biofuels in EU legislation”
(Edwards et al., 2011), 1.45 MJ and 9.75 MJ per produced kilogram of ethanol are needed in the form of electricity and steam respectively. Moreover, the energy input for starch
liquefaction and saccharification represents a 40% of the total energy used during starch-based ethanol production (Xu, Yan, & Feng, 2016).
2.2.4 Phase 4 - Production of starch
The stream of A-starch/Fibre is refined in a centrifugal conical sieve. The fibres and small impurities are separated from the A-starch due to the particle size differences based on the action of the centrifugal force (GEA, 2018). A kilogram of water is added per kilogram of A-starch refined. This accomplishes a 65% moisture content at the A-A-starch output (Tomasik, 2003). The total weight of fibres are washed out by the action of screening. A decanter centrifuge with an average speed of 3600 rpm is used for dewatering the fibres stream up to a 40% moisture content (Cargill, 2018). The stream of A-starch is known as starch milk and it is further processed whilst the fibres are treated as a waste stream.
The starch milk is washed by a hybrid method combining a nozzle separator and a hydro-cyclone. The nozzle separator can operate in one, two or three phases. A two-phase type is a vertical centrifuge with a disc stack as clarification area, nozzles for discharging the
concentrate and the discharge of the overflow with an installed centripetal pump. The starch milk is distributed to the outer area of the disk stack by means of centrifugal acceleration. Therefore, the starch granules are separated from the liquid phase to be discharged passing the fitted nozzles (Witt & Goldau, 2000). The quality and value of the starch-end product is determined in high extent by the effectiveness of this step. A high quality A-starch can only be obtained if the remaining small fibre fragments, lipids, proteins, and dissolved substances are efficiently washed out by using water. The water required equals to 2600 m3 per tonne of
starch (GEA, 2018). Generally, the moisture content in the A-starch output is equal to 60% (Tomasik, 2003). The washing effect helps to recover a portion of B-starch which is
processed in phase three (GEA, 2018). A 75% of the washed A-starch is destined to the production of sweeteners. The remaining 25% of starch milk is conveyed to a rotary vacuum
dryer to be dewatered (GEA, 2018). The A-starch is dewatered to an average of 40% moisture content (Cargill, 2018). The initial temperature is defined as 20 °C. The vacuum pressure equals to 96.35 KPa (Tomasik, 2003). Therefore, 33°C is considered as the
saturation temperature. The native starch modification occurs before the unit of operation of drying. Nonetheless, this requires a small amount of energy as it corresponds to the addition of chemicals and enzymes. This is done to increase the added value of the final product. Starch is divided by batches in order to be treated by different chemicals and enzymes to fulfil different industrial aims (Cargill, 2018). The dewatered starch milk is introduced to a pneumatic flash dryer. The A-starch is dried to an average of 12% moisture content to comply with commercial standards (GEA, 2018).
2.2.5 Phase 5 - Production of ethanol
The stream of pentosanes is concentrated via water evaporation to obtain an average of 40% dry matter (GEA, 2018). The ethanol production from the stream of pentosanes and C-starch is defined through a black box approach. Cargill uses the C-C-starch within the
pentosanes’ stream as feedstock for its ethanol plants. The conventional process for
transforming the C-starch into ethanol in industry encompasses the energy-intensive use of enzymes in starch hydrolysis (Xu, Yan, & Feng, 2016). This involves the steps of liquefaction and saccharification previously explained in the sweeteners production. Nonetheless, the obtained product is further processed by fermentation. This is a metabolic process that consumes the sugar molecules in the absence of oxygen to produce alcohol by using a type of yeast (Xu, Yan, & Feng, 2016). The same chemical reaction for the steps of liquefaction and saccharification in the sweeteners production is considered. The following chemical reaction is defined for the step of fermentation to produce ethanol:
𝐶𝐶6𝐻𝐻12𝑂𝑂6 → 2(𝐶𝐶2𝐻𝐻5𝑂𝑂𝐻𝐻) + 2(𝐶𝐶𝑂𝑂2)
𝐺𝐺𝐺𝐺𝐺𝐺𝑆𝑆𝐺𝐺𝐺𝐺𝑊𝑊 → 𝐸𝐸𝑆𝑆ℎ𝑆𝑆𝑎𝑎𝐺𝐺𝐺𝐺 + 𝐶𝐶𝑆𝑆𝑆𝑆𝐶𝐶𝐺𝐺𝑎𝑎 𝑑𝑑𝑑𝑑𝐺𝐺𝑑𝑑𝑑𝑑𝑑𝑑𝑊𝑊
Therefore and according to the molecular weights, the amount of ethanol and carbon dioxide produced from 1 kilogram of glucose are 0.51 kilograms and 0.49 kilograms respectively. The energy balance is based on the amount of energy used to convert wheat grain to ethanol. 1.45 MJ and 9.75 MJ per produced kilogram of ethanol is needed in the form of electricity and steam respectively (Edwards et al., 2011).
The CO2 generated from this process is biogenic and therefore not considered in the total
GHG emissions.
2.2.6 Energy consumption: wheat starch manufacturing
Wheat starch production is associated with high heat consumption (mainly during the step of sweeteners and ethanol production). Similar to the case of potato starch, the energy
consumption at Cargill’s plants vary according to two main factors. First, the amount of processed wheat and maize per year. Second, the moisture content of the received wheat. There was no information found of the energy consumption per phase level or in a complete manufacture overview. The energy requirements are too specific as Cargill is using C-starch to produce ethanol and converting a defined amount of starch into sweeteners. Therefore, calculations of the minimum theoretical energy requirements were done. These consider the previous information and are assumed to represent the minimum energy required for the manufacture of wheat starch.
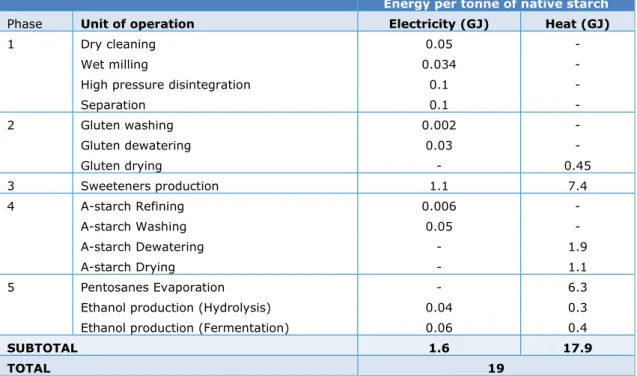
Table 6 offers an overview of the energy requirements per phase. The results were briefly reviewed by Cargill and thus modified accordingly to the context of Sas van Gent. The BAT Reference report describes a range of between 0.4-1.75 MWh per tonne of maize/wheat
(European Commission, 2019), which corresponds to 12-51 GJ/t of native starch produced. The value in Table 6 is well within this range.
The calculations based on the information above data were validated by comparing them to the total emissions of CO2 registered in the NEa for each plant. In the case of Sas van Gent,
Cargill generates the required heat onsite mainly using a CHP and thus there are no indirect heat-related emissions to be addressed. In contrast, Cargill Bergen op Zoom utilises steam boilers and offsite steam generation to fulfil its energy requirements.
Table 6 Overview of the energy required per tonne of native wheat starch
generated, including production of by-products (additions may deviate because of rounding)
Energy per tonne of native starch
Phase Unit of operation Electricity (GJ) Heat (GJ)
1 Dry cleaning 0.05 -
Wet milling 0.034 -
High pressure disintegration 0.1 -
Separation 0.1 - 2 Gluten washing 0.002 - Gluten dewatering 0.03 - Gluten drying - 0.45 3 Sweeteners production 1.1 7.4 4 A-starch Refining 0.006 - A-starch Washing 0.05 - A-starch Dewatering - 1.9 A-starch Drying - 1.1 5 Pentosanes Evaporation - 6.3
Ethanol production (Hydrolysis) 0.04 0.3
Ethanol production (Fermentation) 0.06 0.4
SUBTOTAL 1.6 17.9
TOTAL 19
For Sas van Gent, the wheat starch production according to the analysis above covers 50% of the emissions registered by the NEa (2017). The energy required for the maize starch production can be estimated based on the average specific energy consumption for maize starch reported in the BAT Reference Document for Food, Drink and Milk Industries (European Commission, 2019, p. 578). This document shows and average consumption of 3.2 GJ per tonne maize (ranging between 1.4 to 6.3 GJ/t). Based on this number, processing 230,000 tonnes of maize into starch and its co-products is responsible for 33% of the total generated CO2 emissions. If added to the 50%, the total covered emissions at Sas van Gent
correspond to 83% of the emissions registered at NEa. The electricity production by the CHP also leads to emissions included in the NEa data, but is not included in the analysis above. This is estimated to be about 9% in 2017 (see Section 1.2.1), which explains most of the difference.
For Bergen op Zoom, the results from the analysis related to wheat starch above covers 82% from the emissions reported by the NEa (imported steam from Sabic included).
3 Starch products and
application
The manufacture of starch addresses significant differences based on the selected raw material. Therefore different inputs and co-products are respectively needed and obtained depending on the processed crop.
3.1 Potato starch manufacturing
The main inputs in the manufacture of potato starch are potatoes, fresh water and sulphur dioxide (SO2). The Dutch potato crop is divided in fresh or ware potatoes for processing
(46.3%), potato for starch extraction (27.3%), and potatoes for seed (26.4%) (CBS, 2018). The composition of the starch potatoes (as far as harvested by Avebe) is shown in Table 7.
Table 7 Typical composition of Avebe’s potatoes (Bruinenberg, 2019)
Component % Water 75 Starch 20 Protein 2 Fibres 1 Sugars <1
Nitrates, amino acids 1
Organic acids <1
The specific products obtained when processing potato starch potatoes are the following: • Native potato starch
• Potato proteins and Protamylasse • Wet pulp.
Native potato starch
Potato starch is a functional biopolymer for food and materials science due to its specific chemical properties. Beside small granules potato starch these include very large and smooth granules, a high content of covalently linked phosphate, long amylopectin chains, and high-molecular weight amylose giving potato starch specific valuable properties in comparison with other starches. It has a low gelatinization temperature and a high paste consistency. Processed potato starch is considered to be pure. This is the most important parameter for being competitive (ISI, 2018). This type of starch has a higher quality in comparison to the rest of starch types. The applications are in the food, paper, adhesives and textile industries. The food industry prefers this type of starch as its pastes have a good clarity and a neutral flavour. They are widely implemented in the field of texturing food systems and are particularly suited for clear soups, meat, Asian style noodles, confections, fillings and extruded snacks (Semeijn & Buwalda, 2018). The paper industry prefers this starch because of its purity, good solubility and high amylopectin and amylose molecular weight. The textile industry prefers this starch due to its film properties, paste penetration depth and adhesive power. The adhesive industry prefers this starch because of its good remoisten ability and a desirable rheology resulting in a perfect direct tack (Grommers & van der Krogt, 2009).
Potato proteins and Protamylasse
The juice stream is of high value known as a proteinaceous water or potato juice. This is further processed in order to obtain the co-product of potato proteins. The amount of potato juice obtained per tonne of processed potatoes depends on the technology used. Potato juice is a complex mixture making it a challenging feedstock for protein isolation. In average, undiluted potato juice contains up to 5% dry matter and approximately 20 to 25% of it corresponds to protein. The processing strategy determines whether a protein can be utilized for feed or for food. A gentle isolation method can preserve functional properties crucial for food use whereas protein intended for cattle feed can be often isolated by harsher and less expensive methods (Lokra & Straetkvern, 2009).
The processing of potato juice into proteins produces a second co-product known as
Protamylasse. This is considered to be a residual compound containing a variety of nutrients. It is used for various feed applications and bioenergy, and is known as fertiliser because of its high potassium content.
Wet pulp
Another co-product of potato starch manufacturing is potato pulp. This consists of cellulose, hemicellulose, starch (loss due to grinding efficiency), pectin, and a very high moisture content (up to 90% of the mass) (Klingspohn, Papsupuleti, & Schuegerl, 1993). This is a product available through the normal campaign of potato starch processing (approximately from August to April/May). It is mainly sold as wet or sometimes partially dried pulp to feed cattle (Avebe, 2020a). The pulp may be dried up to 20%.
The production volume of the previous co-products is highly dependent on the unit of operations at each of the assessed plants. Table 8 offers an overview of the amount of co-products that are obtained from the processing of a tonne of potatoes.
Table 8 Amount of co-products that are obtained from a tonne of potatoes processed and estimated production by potato starch producers, based on the processes described in Chapter 2
Main products and co-products t/t potatoes Estimated production by potato
starch producers in The Netherlands (kt)3
Native starch (0% moisture) 0.19 4804
Wet pulp (20% moisture) 0.02 40
Protamylasse (42% moisture) 0.01 20
Protein (10% moisture) 0.02 40
Table 9 shows approximate commercial prices of each of the co-products.
Table 9 Approximate commercial value of the different (co-)products of potato starch manufacturing
Commercial price Source
Starch 600 EUR per tonne (2017, export price) (Eurostat, 2019)
Pulp (cattle feed) 10 EUR per tonne (2009) (Meyer, Dam, &
Laerke, 2009) Potato Protein
(animal feed)
800 EUR per tonne (2013) (Mulder, 2013)
Potato Protein (food) 3000 EUR per tonne (2013) (Mulder, 2013)
3 Estimate uses 2.5 Mt of potatoes processed. Rounded to nearest value multiple of 10 kt. 4 600 kt starch with on average 20% moisture content.
3.2 Wheat starch manufacturing
The main inputs in the manufacture of wheat starch are wheat kernels and freshwater. In contrast to potato starch, there is no specially grown wheat crop for starch extraction in the Netherlands. Approximately 1 million tonnes of wheat is produced per year in the
Netherlands (CBS, 2018). Of this, 20% of national production is used by milling companies to produce flour for bread, 55% is used in the production of animal feed, and the remaining 25% is destined for the starch and bio-ethanol industry. In addition to the domestic
production of wheat, the Netherlands imports it. Almost 80% of the imports are from Germany and France (Trejo, 2015). Cargill imports wheat kernel to produce wheat starch (Cargill, 2018). Its composition is described in Table 10.
Table 10 Breakdown of the composition of wheat kernel, endosperm and starch used for the manufacture of wheat starch
Wheat Kernel composition (Cargill, 2018), (Hashmi, 2011) Endosperm composition (Rosicka-Kaczmarek et al., 2017) Starch composition (Rosicka-Kaczmarek et al., 2017)
Component % Component % Component %
Endosperm 72 Starch 79.9 A-type 87
Bran 13 Protein 13 B-type 10
Germ 0-3 Fat (lipids) 2.3 C-type 3
Water 10 Fibre 2.8 - -
Impurities 2 Ash (non-starch polysaccharide)
2 - -
Total 100 Total 100 Total 100
The products obtained at the manufacture of wheat starch are the following: • Native wheat starch
• Bran and germs • Vital gluten • Sweeteners • Ethanol • Fibres.
Native wheat starch
This type of starch have almost the same characteristics as the potato starch. Therefore its uses also include the food and non-food industry. This type is mostly used as thickener, filler, and texturizer, among others (van der Zalm, 2011).
Bran and germs
Bran is produced as co-product in the milling of grains. Bran is composed by fibre and fatty acids containing starch, protein, vitamins and dietary minerals. It is removed from the grain in order to prevent the rancidity of the kernel. Bran is mainly used to enrich breads and breakfast cereals due to its dietary fibres’ composition. The germs are the part of the wheat that sprouts and grows into a new plant. It has a high content of vitamin and mineral and thus is used as a source of fibre (Kretschmer, 2018). Nonetheless, Cargill does not produce wheat germs as a commercial co-product (Cargill, 2018). In comparison to the manufacture of maize into starch, the wheat’s germ is removed from the endosperm during the
dry milling. Therefore, it is not a co-product from the industrial wet milling of wheat (ISI, 2018).
Vital gluten
Gluten is a cohesive, visco-elastic proteinaceous material prepared as a by-product of the isolation of starch from wheat flour (Day, Augustin, Batey, & Wrigley, 2006). The albumins,