Assessing Intended
Nationally Determined
Contributions to the
Paris Climate Agreement
–
what are the projected
global and national emission
levels for 2025–2030?
Assessing Intended Nationally Determined
Contributions to the Paris Climate Agreement
Assessing Intended Nationally
Determined Contributions to the
Paris Climate Agreement – what are
the projected global and national
emission levels for 2025–2030?
Assessing Intended Nationally Determined Contributions to the Paris Climate Agreement – what are the projected global and national emission levels for 2025–2030?
© PBL Netherlands Environmental Assessment Agency The Hague, 2015
PBL publication number: 1879
Authors:
Annemiek Admiraal (PBL), Michel den Elzen (PBL), Nicklas Forsell (IIASA), Olga Turkovska (IIASA), Mark Roelfsema (PBL), Heleen van Soest (PBL)
Corresponding author
annemiek.admiraal@pbl.nl
Graphics
Beeldredactie PBL
Production coordination and English-language editing
PBL Publishers; Christien Ettema, Shades of Green
Layout
Textcetera, The Hague
Acknowledgements
The project was financed by the European Commission, Directorate General Climate Action (DG CLIMA), and the Dutch Ministry of Infrastructure and the Environment. The report and the calculations have benefited from comments by Ariane Labat and Miles Perry (both from DG CLIMA), and Marcel Berk and Paul van Dam (both from the Dutch Ministry). We also thank all colleagues involved, in particular Pieter Boot, Andries Hof and Detlef van Vuuren (all PBL), and Mykola Gusti and Michael Obersteiner (both IIASA), with a special thanks to Allard Warrink (PBL) for all his work on the infographics (www.pbl.nl/indc).
This report has been prepared by PBL/ IIASA under contract to DG CLIMA (Service Contract no. 071303/2011/662342/SER/CLIMA.A4 – Renewal (Ares (2013)3407741)) renewed in November 2013.
The information and views set out in this study are those of the authors and do not necessarily reflect the official opinion of the Commission. The Commission does not guarantee the accuracy of the data included in this study. Neither the Commission nor any person acting on the Commission’s behalf can be held responsible for the use of any information from this study.
This publication can be downloaded from: www.pbl.nl/en. Parts of this publication may be reproduced, providing the source is stated, in the form: Admiraal A et al. (2015), ‘Assessing Intended Nationally Determined Contributions to the Paris climate agreement – what are the projected global and national emission levels for 2025–2030?’, The Hague: PBL Netherlands Environmental
Assessment Agency.
PBL Netherlands Environmental Assessment Agency is the national institute for strategic policy analyses in the fields of the environment, nature and spatial planning. We contribute to improving the quality of political and administrative decision-making, by conducting outlook studies, analyses and evaluations in which an integrated approach is considered paramount. Policy relevance is the prime concern in all our studies. We conduct solicited and unsolicited research that is both independent and always
Contents
MAIN FINDINGS Main findings 8 Executive summary 9 FULL RESULTS 1 Introduction 182 Overview of the mitigation contribution of submitted INDCs 20
2.1 What are the announced emission reduction proposals of the INDCs submitted to date? 20
3 Global impact of the INDCs 26
3.1 What are the projected global greenhouse gas emission levels by 2030 if all INDCs are implemented? 26 3.2 What is the projected impact of the INDCs on reducing the global 2 ˚C emission gap by 2030? 28
3.3 What is the projected impact of the INDCs on emissions and removals from land use, land-use change and forestry (LULUCF) in the context of high uncertainties? 30
4 Assessment of national emission levels resulting from INDC implementation: the G20 countries 36
4.1 How do emission reductions as projected for national INDCs compare to different historical base years? 36 4.2 How do emission reductions as projected for national INDCs compare to PBL business-as-usual projections? 36 4.3 Are national INDCs in line with below-2 °C pathways? 37
4.4 What do INDCs imply for the timing and level of greenhouse gas emission peaks? 41
4.5 Are per capita emissions and emission intensities, as projected from national INDCs, converging between countries? 42
References 46
Main findings
By 29 October 2015, 156 Parties (representing approxima-tely 90% of global greenhouse gas emissions in 2012) had submitted their Intended Nationally Determined Contributions (INDCs) to the UNFCCC in preparation for the adoption of the Paris Agreement in December 2015 (UNFCCC, 2015). In this report, we assess the mitigation components of the INDCs of 102 of these Parties (representing approximately 89% of global greenhouse gas emissions in 2012), including the EU28 Member States. The main findings of this assessment are: Findings regarding global emissions: The collective ambition of the INDCs put forward in 2030 falls short of what is needed to put the world directly on a cost-effective pathway to keep the global temperature increase below 2 °C; however, if fully implemented, the INDCs will deliver significant emission reductions from business-as-usual trends.
– Full implementation of all unconditional INDCs is projected to reduce yearly global greenhouse gas emissions by approximately 9 (5–10) GtCO2eq by 2030,
relative to the PBL business-as-usual scenario of about 65 GtCO2eq in 2030.
– Additional implementation of all conditional INDCs (which would require some form of international climate finance or international cooperation mechanisms) would increase this projected reduction to about 11 (7–13) GtCO2eqin 2030 below
PBL business-as-usual levels.
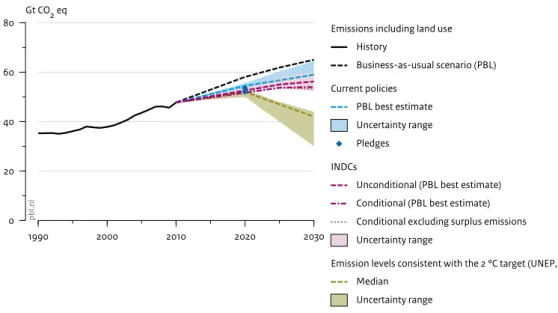
– Despite these projected reductions relative to business-as-usual levels, global emissions are projected to increase until at least 2030, to about 56 (54–60) GtCO2eq if the unconditional INDCs are
implemented, or to about 54 (52–58) GtCO2eq if
the conditional INDCs are implemented as well. The median estimates for 2030 are 13% to 18% above 2010 emission levels.
– Implementation of the unconditional INDCs would still leave an emission gap of 14 (13–18) GtCO2eq
relative to the global emission level needed for keeping the temperature increase below 2 °C with a likely chance (42 GtCO2eq in 2030, as estimated in the
UNEP Gap Report of 2014). Implementation of the conditional INDCs would further reduce this gap to 12 (10–16) GtCO2eq.
Findings regarding national INDCs (G20 members): the presented analysis of individual INDCs shows how INDC implementation could enable a transition from business-as-usual trends to lower emission levels, lower emissions per capita and lower emission intensities at both national and global levels.
– Based on national INDCs, emissions in middle-income countries such as Mexico, Indonesia, Brazil and South Korea are expected to peak before 2025. Emissions in China, India and South Africa are expected to peak by 2030 or later. Emissions in most high-income countries have already peaked in the past.
– The largest emission reductions in 2030 relative to the PBL business-as-usual scenario (which assumes that no new climate policies will be implemented) are projected for Australia, Brazil and Canada. – Full implementation of submitted INDCs
(uncondi-tional and condi(uncondi-tional) would decrease global net land-use (LULUCF) emissions by 2.6 GtCO2eq in 2030
compared to national business-as-usual projections, which is approximately one third of the total global emission reduction that would result from the full implementation of all unconditional INDCs.
The largest absolute reductions in land-use emissions are expected for Brazil and Indonesia, followed by the United States, China, Ethiopia, Gabon and Democratic Republic of the Congo.
– Based on the submitted INDCs, per capita emission levels are projected to decline between 2010 and 2030 in all G20 countries except Argentina, China, India, the Russian Federation and Turkey.
– Similarly, emission intensities (emissions per GDP) are projected to decline between 2010 and 2030 in all G20 countries except Turkey, indicating a relative decoupling of economic growth and greenhouse gas emissions. Decoupling – implying absolute emission reductions in a growing economy – is projected for 13 to 15 of the G20 countries, depending on the conditionality of their INDCs.
– While the aggregate effect of submitted INDCs is projected to be insufficient to close the global emission gap, INDCs of some countries are nevertheless consistent with national cost-optimal below-2 °C pathways (EU28, United States) and/or below-2 °C pathways based on converging per capita emissions (United States).
Executive summary
From March 2015 all Parties to the UNFCCC could submit their Intended Nationally Determined Contributions (INDCs) to the UNFCCC Secretariat in preparation for the adoption of the Paris Agreement in December 2015. This report provides an overview of the INDCs submitted by 29 October 2015 and analyses their level of ambition. The INDCs are compared to emission projections based on i) implementation of current climate policies and ii) business-as-usual developments (not taking into account climate policies that have been put in place after 2004). The results of this study are presented below according to the following nine questions:
Global assessment
Q1) What are the announced reduction proposals of the INDCs submitted to date?
Q2) What are the projected global greenhouse gas emission levels by 2030 if all submitted INDCs are implemented?
Q3) What is the projected impact of the INDCs on reducing the global 2 °C emission gap by 2030? Q4) What is the projected impact of the INDCs on
emissions and removals from land use, land-use change and forestry (LULUCF) in the context of high uncertainties?
National assessment (G20 members)
Q5) How do emission reductions as projected for national INDCs compare to different historical base years? Q6) How do emission reductions as projected for national
INDCs compare to PBL business-as-usual projections? Q7) Are national INDCs in line with below-2 °C pathways? Q8) What do national INDCs imply for the timing and level
of greenhouse gas emission peaks?
Q9) Are per capita emissions and emission intensities, as projected from national INDCs, converging between countries?
Q1: What are the announced emission reduction proposals of the INDCs submitted to date?
– By 29 October 2015, 156 Parties out of 195 Parties to the UNFCCC had submitted their INDCs to the UNFCCC
Secretariat (see Figure ES.1). Together, these Parties
were responsible for approximately 90% of global greenhouse gas emissions in 2012. Our analysis focuses on 74 INDCs (representing 102 Parties, including the 28 EU Member States1), covering all
major emitting countries and including all Parties with a 2012 emission share of more than 0.1%. Some smaller countries for which adequate data was available for calculating the effect of their INDC targets were also included. The selected Parties together were responsible for 89% of global greenhouse gas emissions in 2012. Table ES.1 summarises the announced mitigation efforts of the G20 countries.
Q2: What are the projected global greenhouse gas emission levels by 2030 if all submitted INDCs are implemented?
– Under full implementation of all unconditional INDCs, global greenhouse gas emissions are projected to be reduced by
approximately 9 (5–10) GtCO2eq by 2030, relative to the PBL
business-as-usual scenario of 65 GtCO2eq (which assumes no
new policies after 2004, see Box 3.1). If all conditional
INDCs are implemented as well, this reduction would increase to approximately 11 (7–13) GtCO2eqin 2030.
Compared to the current policies scenario (emission development under current and planned pre-2020 policies), projected reductions are 3 (0–5) GtCO2eq for
the unconditional INDCs and 5 (1–7) GtCO2eq for the
conditional INDCs. The uncertainty ranges are a result of uncertainties in the INDC projections for Australia, the Russian Federation, the United States, China and India.
– Global emissions are projected to increase until at least 2030. Based on the unconditional INDCs the global emission level for 2030 is projected at about 56 (55–60) GtCO2eq. If the conditional INDCs are implemented
as well, this level would be about 54 (52–58) GtCO2.
The median estimates are 13% to 18% above 2010 emission levels (Figure ES.2).
– Global emissions could be reduced by an additional 1 (0–2)
GtCO2eq by 2030 if, for some countries, current policies are
assumed rather than INDCs. In some countries, INDC
implementation could result in higher emission levels than projected under current policies (according to our analysis, e.g. in Argentina, Chile, Ghana, Kazakhstan, Lebanon, Peru, Russian Federation, Turkey, Ukraine and Vietnam). If emission levels of these countries are projected under current policies rather than INDCs, the global emission projection for 2030 under the conditional INDC scenario (53 (52–57) GtCO2) would be 1 (0–2) GtCO2eq lower.
– The above-mentioned estimates are subject to large
uncertainties (in the range of 5 GtCO2eq), as a result of
uncertainties in the projections for some of the INDCs. A large uncertainty is due to the dependence of several INDCs on economic growth. For instance, a 1% change in China’s average annual economic growth would already result in a change in the emission target of approximately 2.5 GtCO2eq in the estimates
of China’s INDC. There are major uncertainties on the projections of land-use emissions and removals (see relevant section).
Q3: What is the projected impact of the INDCs on reducing the global 2 °C emission gap by 2030?
– According to the UNEP Gap Report (2014), global emission levels consistent with a likely chance of staying within the 2 °C
limit are projected at 42 (30–44) GtCO2eq in 2030 (median
and 20th – 80th percentile range).
– This leaves a gap of 14 (13–18) GtCO2eq between the global emissions projected to result from the unconditional INDCs
(56 (55–60) GtCO2eq) and the median emission level in the
below-2 °C scenario of UNEP. If the conditional INDCs are
implemented as well, this gap would be 2 GtCO2eq
smaller.
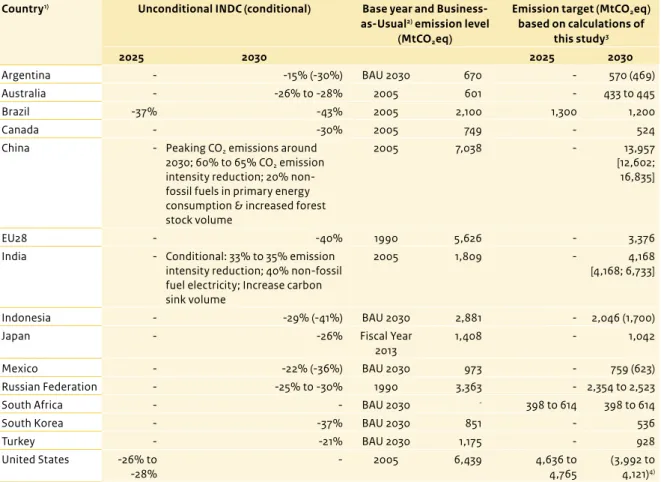
Table ES.1
Summary of the unconditional and conditional mitigation targets for 2025 and 2030, as proposed in the INDCs of the G20 countries
Country1) Unconditional INDC (conditional) Base year and
Business-as-Usual2) emission level
(MtCO2eq)
Emission target (MtCO2eq)
based on calculations of this study3 2025 2030 2025 2030 Argentina - -15% (-30%) BAU 2030 670 - 570 (469) Australia - -26% to -28% 2005 601 - 433 to 445 Brazil -37% -43% 2005 2,100 1,300 1,200 Canada - -30% 2005 749 - 524
China - Peaking CO2 emissions around
2030; 60% to 65% CO2 emission
intensity reduction; 20% non-fossil fuels in primary energy consumption & increased forest stock volume
2005 7,038 - 13,957
[12,602; 16,835]
EU28 - -40% 1990 5,626 - 3,376
India - Conditional: 33% to 35% emission intensity reduction; 40% non-fossil fuel electricity; Increase carbon sink volume
2005 1,809 - 4,168
[4,168; 6,733]
Indonesia - -29% (-41%) BAU 2030 2,881 - 2,046 (1,700)
Japan - -26% Fiscal Year
2013
1,408 - 1,042
Mexico - -22% (-36%) BAU 2030 973 - 759 (623)
Russian Federation - -25% to -30% 1990 3,363 - 2,354 to 2,523
South Africa - - BAU 2030 - 398 to 614 398 to 614
South Korea - -37% BAU 2030 851 - 536
Turkey - -21% BAU 2030 1,175 - 928
United States -26% to
-28% - 2005 6,439 4,636 to 4,765 (3,992 to 4,121)4)
1) The country-specific emission levels stated above include all greenhouse gas emissions from energy, industry and services, as well as emissions and removals from activities related to land use, land-use change and forestry (LULUCF) for the following countries: the United States, Turkey, Mexico, Indonesia, Brazil, India, China, Australia, and Argentina. The land-use emissions and removals from the remaining countries were aggregated as part of the global estimates of effects on land-use emissions and removals.
2) Projected business-as-usual emission levels, as reported by the submitted INDCs (UNFCCC, 2015).
3) Successful implementation of the INDCs is contingent upon an ambitious global agreement including additional means of implementation to be provided by developed country parties, technology transfer and capacity building following Articles 3.1 and 4.7 of the Convention.
4) The US INDC target for 2025 may be extrapolated to 2030 by assuming a linear pathway to the national long-term target (83% reduction below 2005 levels by 2050).
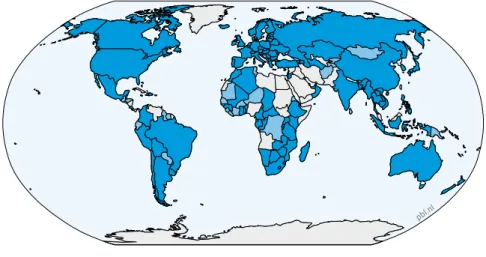
Figure ES.1
Countries that have submitted INDCs to the UNFCCC
pbl.nl
Situation 29 October 2015 INDC submitted, analysed INDC submitted, not analysed No INDC submitted Source: PBL Figure ES.2 1990 2000 2010 2020 2030 0 20 40 60 80 Gt CO2 eq
Source: PBL FAIR/TIMER model; IIASA GLOBIOM/G4M model; UNEP 2014
pb
l.n
l
Emissions including land use History Business-as-usual scenario (PBL) Current policies PBL best estimate Uncertainty range Pledges INDCs
Unconditional (PBL best estimate) Conditional (PBL best estimate) Conditional excluding surplus emissions Uncertainty range
Emission levels consistent with the 2 °C target (UNEP, 2014) Median
Uncertainty range
Impact of INDCs and climate policies on global greenhouse gas emissions
The global 2 °C emission gap is defined as the difference between the 2030 emission levels that would be consistent with keeping global warming below 2 °C (UNEP, 2014) and the 2030 emission levels that would result from implementation of the INDCs. Emission levels in the PBL business-as-usual scenario (which assumes that no new policies will be implemented after 2004) are based on PBL/IIASA model calculations; emission levels in the current policies scenario are based on Den Elzen et al. (2015). Historical global greenhouse gas emissions (excluding LULUCF) are based on EDGAR (JRC/PBL, 2015); historical LULUCF emissions on FAOSTAT (2015).
Q4: What is the projected impact of the INDCs on emissions and removals from land use, land-use change and forestry (LULUCF) in the context of high uncertainty?
– Of the 156 Parties that had submitted an INDC by 29 October 2015, 95 Parties explicitly state that emissions and removals from LULUCF are included in their mitigation targets. However, only 36 of them provide quantifiable details of measures or
specific targets for the LULUCF sector. Of the remaining
INDCs, 42 INDCs explicitly state that LULUCF emissions and removals are not included in their mitigation targets but nevertheless propose measures or policies to reduce net LULUCF emissions. The other 19 INDCs state that LULUCF emissions and removals are not covered and do not propose measures or policies for reducing net LULUCF emissions.
– There is high uncertainty on the historical levels of emissions and removals, as well as on the projections of future emissions and removals. There is also only partial information in the INDCs on how INDCs will address these emission sources. – Taking into account these uncertainties, we could estimate
that the full implementation of all unconditional and conditional INDCs would decrease net LULUCF emissions in 2030 compared to national business-as-usual projections. By contrast, under national business-as-usual scenarios and independent baseline scenarios, it is expected that net LULUCF emissions would increase by 2030. This shows that implementing INDCs is important for addressing these emission sources. However, the quantified impact of the INDCs on these emissions and removals is sensitive to the data and methodologies used. This study used national business-as-usual projections based on data provided by countries in their INDCs, complemented with information from National Communications or other published information sources where needed. – The largest absolute reductions in net LULUCF emissions are
expected in Brazil and Indonesia, followed by the United States, China, Ethiopia, Gabon and Democratic Republic of the Congo.
Q5: How do emission reductions as projected for national INDCs compare to different historical base years?
– The national INDCs can be converted into reduction targets
for 2030, compared to various historical years. For example,
the EU28’s target of 40% reduction relative to 1990 levels is equivalent to 29% reduction relative to 2010 levels, due to the fact that emissions in the EU declined between 1990 and 2010. The target of the United States (26%–28% reduction relative to 2005 levels, by 2025) may be extrapolated to a 36% to 38% reduction by 2030, assuming a linear pathway towards the country’s long-term goal of 83% reduction by 2050. Relative to 2010 levels, however, the reduction estimated for 2030 would be 30% to 32%.
Q6: How do emission reductions as projected for national INDCs compare to PBL business-as-usual projections?
– The INDCs of the G20 countries are projected to reduce emissions relative to PBL business-as-usual levels by
approximately 9 to 10 GtCO2eq by 2030. The INDCs of
other (non-G20) countries are projected to reduce emissions
by an additional 0 to 1 GtCO2eq. Among the G20,
substantive absolute emission reductions from PBL business-as-usual levels can be expected for the United States, followed by China, the EU28, India and Brazil. Together, these five countries would achieve approximately 80% of the total global emission reduction projected (Figure ES.3).
– The largest relative emission reductions compared to PBL business-as-usual emission levels in 2030 are projected for Australia, Brazil, Canada and the United States.
Q7: Are national INDCs in line with below-2 °C pathways?
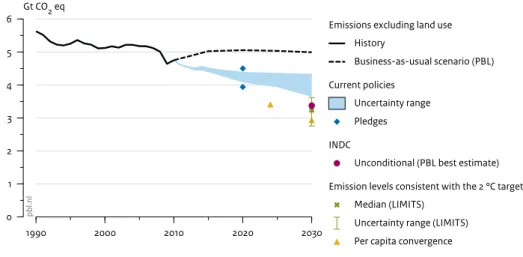
– While the aggregate effect of the submitted INDCs is projected to be insufficient to close the global emission gap, INDCs of some countries are nevertheless consistent with below-2˚C emission pathways based on either cost-effectiveness or per capita emission convergence. – The INDC of the EU28 is projected to reduce emissions to a
level close to the domestic reduction of 40% to 45% required
in a least-costs below-2 ˚C scenario. However, the
projected reduction is not consistent with a below-2 °C pathway based on convergence of per capita emissions from 2010 levels to 2.4 tonnes CO2eq
per capita by 2050 (Figure ES.4).
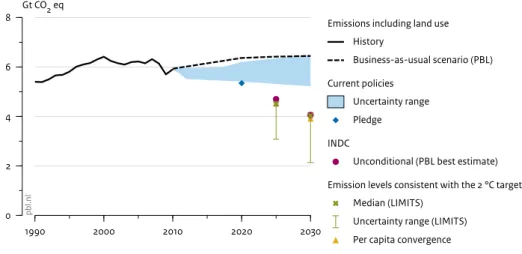
– The INDC of the United States is projected to reduce
emissions to well below current policies levels. If the
reduction target for 2025 is extrapolated to 2030 (based on the national long-term 2050 target), the resulting emission reduction would be in line with both the least-costs below-2 °C emission pathway and the per capita emissions convergence trajectory for this country. The latter is particularly noteworthy, considering the relatively high per capita emissions in the United States in 2010 (22 tonnes CO2eq per capita,
more than twice the level of the EU in that year). However, both pathway estimates (least-costs and per capita convergence) are subject to large uncertainties related to LULUCF CO2 emission
projections for this country (Figure ES.5). – The INDCs of China and India are projected to result in
emissions well above levels required for below-2 °C scenarios. However, the INDC projections for these countries are subject to many uncertainties, including uncertainties related to GDP growth rate projections and the implementation of policies announced in the submitted INDCs (Figures ES.6 and ES.7).
Figure ES.3
Unconditional INDCs Conditional INDCs
-2 0 2 4 6 8 10 12
Reduction compared to business-as-usual scenario (Gt CO2 eq)
Source: PBL FAIR/TIMER model
pb l.n l South Korea South Africa Australia Japan Mexico Canada Indonesia Brazil India EU28 China United States Argentina Russian Federation Turkey
National emission reductions in G20 countries based on their INDCs, 2030
Absolute reductions relative to the PBL business-as-usual emission level in 2030 (positive numbers indicate emission reductions, negative numbers indicate emission increases). For countries with a reduction target range, projected reductions were based on the average of the range.
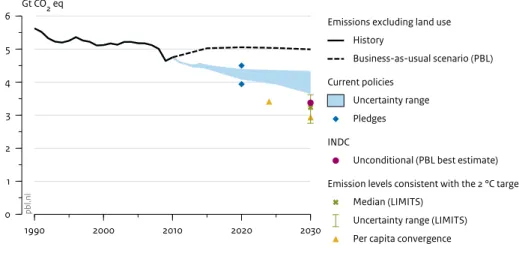
Figure ES.4 1990 2000 2010 2020 2030 0 1 2 3 4 5 6 Gt CO2 eq
Source: PBL FAIR/TIMER model
pb
l.n
l
Emissions excluding land use History Business-as-usual scenario (PBL) Current policies Uncertainty range Pledges INDC
Unconditional (PBL best estimate) Emission levels consistent with the 2 °C target
Median (LIMITS) Uncertainty range (LIMITS) Per capita convergence
Impact of the EU28’s INDC and climate policies on its greenhouse gas emissions
Historical greenhouse gas emissions are based on national inventories submitted to the UNFCCC. Current policy projections are based on Den Elzen et al. (2015). The per capita convergence (2 °C) target is based on a convergence from 2010 levels to 2.4 tCO2eq per capita by 2050, consistent with the global
2050 levels required for meeting the below-2 °C target (UNEP, 2014). The least-costs 2 °C target is based on the LIMITS study (‘Low climate Impact scenarios and the Implications of required Tight emission control Strategies’) (Tavoni et al., 2014).
Figure ES.5 1990 2000 2010 2020 2030 0 2 4 6 8 Gt CO2 eq
Source: PBL FAIR/TIMER model
pb
l.n
l
Emissions including land use History Business-as-usual scenario (PBL) Current policies Uncertainty range Pledge INDC
Unconditional (PBL best estimate) Emission levels consistent with the 2 °C target
Median (LIMITS) Uncertainty range (LIMITS) Per capita convergence
Impact of the US’ INDC and climate policies on its greenhouse gas emissions
Historical greenhouse gas emissions are based on national inventories submitted to the UNFCCC. LULUCF emission history and projections are based on the Sixth National Communication (US Department of State, 2014). Current policy projections are based on Den Elzen et al. (2015). The per capita convergence (2 °C) target is based on a convergence from 2010 levels to 2.4 tCO2eq per capita by 2050, consistent with the global 2050 levels required for meeting the
below-2 °C target (UNEP, 2014). The least-costs 2 °C target is based on the LIMITS study (Tavoni et al., 2014). The INDC emission projection for 2025 is calculated using the 2005 base year from the national inventories; the 2030 emission level is based on a linear extrapolation between the projection for the 2025 target and the national long-term target for 2050.
Figure ES.6 1990 2000 2010 2020 2030 0 4 8 12 16 20 Gt CO2 eq
Source: PBL FAIR/TIMER model; IIASA GLOBIOM/G4M model
pb
l.n
l
Emissions including land use History Business-as-usual scenario (PBL) Current policies Uncertainty range Pledges INDC
Unconditional (PBL best estimate) Uncertainty range
Emission levels consistent with the 2 °C target Median (LIMITS)
Uncertainty range (LIMITS) Per capita convergence
Impact of China’s INDC and climate policies on its greenhouse gas emissions
Uncertainties in the numbers presented are related to the peak emission level, GDP and population growth rates, and the final emission intensity levels by 2030. Historical greenhouse gas emissions (including LULUCF) are based on energy-related emissions (IEA, 2013a), non-energy-related emissions (EDGAR 4.2) (JRC and PBL, 2012) and LULUCF emissions (FAOSTAT). LULUCF emission projections are based on IIASA model calculations. Current policy projections are based on Den Elzen et al. (2015). The per capita convergence (2 °C) target is based on a convergence from 2010 levels to 2.4 tCO2eq per capita
by 2050, consistent with the global 2050 levels required for meeting the below-2 °C target (UNEP, 2014). The least-costs 2 °C target is based on the LIMITS study (Tavoni et al., 2014). The INDC emission projection for 2030 assumes a GDP growth rate of 5% between 2021 and 2030. The uncertainty range for this projection reflects a range in GDP growth of 4.3% to 6.3% (IEA, 2014; 2021–2030 GDP assumption with +1% and -1%).
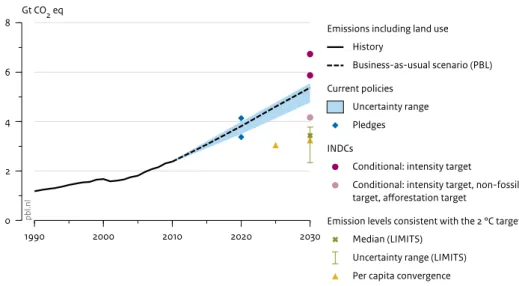
Figure ES.7 1990 2000 2010 2020 2030 0 2 4 6 8 Gt CO2 eq
Source: PBL FAIR/TIMER model; IIASA GLOBIOM/G4M model
pb
l.n
l
Emissions including land use History Business-as-usual scenario (PBL) Current policies Uncertainty range Pledges INDCs
Conditional: intensity target Conditional: intensity target, non-fossil target, afforestation target
Emission levels consistent with the 2 °C target Median (LIMITS)
Uncertainty range (LIMITS) Per capita convergence
Impact of India’s INDC and climate policies on its greenhouse gas emissions
Historical greenhouse gas emissions (including LULUCF) are based on energy-related emissions (IEA, 2013a), non-energy-related emissions (EDGAR 4.2) (JRC and PBL, 2012) and LULUCF emissions (FAOSTAT). LULUCF emission projections are based on IIASA model calculations. Current policy projections are based on Den Elzen et al. (2015). The per capita convergence (2 °C) target is based on a convergence from 2010 levels to 2.4 tCO2eq per capita by 2050,
consistent with the global 2050 levels required for meeting the below-2 °C target (UNEP, 2014). The least-costs 2 °C target is based on the LIMITS study (Tavoni et al., 2014). The range in INDC projections is based on the range in GDP growth rates taken from WEO (IEA, 2014) and PBL model estimates of respectively 6.8% and 7.4% annual growth between 2005 and 2030.
Figure ES.8
0 10 20 30 40 50 60
thousand USD2005 per capita per year (ppp) 0 5 10 15 20 25 30
t CO2 eq per capita per year
Source: PBL FAIR/TIMER model; SSP database
pb l.n l 2010 2020 2030 EU28 United States Mexico Russian Federation South Africa India Turkey Canada Brazil China South Korea Indonesia Australia Japan Argentina
Emissions per capita
Greenhouse gas emissions versus GDP per capita
0 10 20 30 40 50 60
thousand USD2005 per capita per year (ppp) 0 500 1000 1500 2000 2500
t CO2 eq per million USD2005 per year
pb
l.n
l
Emissions per GDP
Symbols represent emissions per capita and per GDP (y-axis) as a function of per capita GDP (PPP) (x-axis) in 2010, 2020 and 2030. Population and GDP data are from PBL business-as-usual calculations, based on the SSP2 scenario database (SSP database, 2015). The SSP database uses the population and GDP history until 2008 from The World Bank (2015) with SSP growth projections onwards. The 2020 emission levels are based on PBL projections for current policies; 2030 emission levels are based on PBL projections for the submitted INDCs.
Q8: What do national INDCs imply for the timing and level of greenhouse gas emission peaks?
– Based on national INDCs, emissions in middle-income countries such as Mexico, Indonesia and Brazil are expected to peak before 2025.
– Emissions in China, India and South Africa are expected to
peak by 2030 or later. These countries have relatively
high emission intensities due to carbon intensive economies. Based on China’s INDC, CO2 emissions in
this country are projected to peak by 2030 at the latest, but its total greenhouse gas emissions are projected to peak after 2030.
– Emissions in most high-income countries have already
peaked in the past. Emissions in the EU peaked around
1980; of the Russian Federation (then Soviet Union), around 1990; of Australia, Canada, Japan and the United States, around 2005; and of South Korea, around 2010.
Q9: Are per capita emissions and emission intensities, as projected from national INDCs, converging between countries?
– Based on national INDCs, per capita emission levels are projected to decline between 2010 and 2030 in all G20 countries, except Argentina, China, India, the Russian
Federation and Turkey. Furthermore, the positive
correlation between income and emissions per capita will largely disappear by 2030, as emissions per capita are converging between countries with different income levels (Figure ES.8, left panel).
– Similarly, emission intensities (emissions per GDP) are projected to decline substantially between 2010 and 2030 in all G20 countries (except Turkey), with levels converging by
2030. The largest reductions are projected for
countries with the highest emission intensities in 2010, such as Indonesia, China and Brazil. Emission intensities are converging to levels between 250 and 750 tonnes CO2eq per million USD in all G20 countries
by 2030, independent of their emission intensity levels in 2010 and income levels in 2030 (Figure ES.8, right panel).
– The convergence of both emission intensities and emissions per capita between G20 countries, despite their different income levels, reflects a decoupling of economic growth and greenhouse gas emissions.
Note
1 In our analysis, the EU28 is considered as a single Party, and EU Member States are not considered individually. To ease reading, this report uses ‘countries’ and ‘national’ to refer to all ‘Parties’, including the EU28.
FULL RESUL
TS
FULL RESUL
ONE
Introduction
During the international climate negotiations under the umbrella of the United Nations Framework Convention on Climate Change (UNFCCC), Parties have agreed to collectively reduce greenhouse gas emissions with the aim to limit global mean temperature increase to less than 2 ˚C above pre-industrial levels, in order to avoid dangerous anthropogenic climate change (UNFCCC 2009; UNFCCC 2010). In this context, many countries have formulated emission reduction proposals (pledges) for the year 2020, which are anchored in the Cancun Agreements. These pledges focus on mitigation, and a distinction is made between the effort level required from Annex I countries versus non-Annex I countries. Assessments of these pledges have shown that the associated emission reductions fall short of those consistent with the 2 ˚C climate target (Hof et al., 2013; UNEP, 2014).
The Conference of the Parties (COP) therefore invited all Parties to initiate or intensify domestic actions before 2020 and submit post-2020 goals, in order to achieve the below-2˚C objective of the Convention. Parties were asked to submit their post-2020 goals, formally known as Intended Nationally Determined Contributions (INDCs), well in advance of the COP21 in Paris in December 2015, where a legal agreement is planned to be adopted. These post-2020 INDCs differ from the 2020 pledges in that they do not only cover mitigation: Parties are also requested to address adaptation, fairness and ambition. Where necessary, INDCs may also include a call for financial support for mitigation and adaptation measures. Among the 156 Parties that had submitted an INDC by 29 October 2015, most Parties have included both adaptation and mitigation targets (UNFCCC, 2015). Another difference with the pre-2020 pledges is that, in order to encourage ambition among all Parties, the distinction between Annex I and non-Annex I countries has been abandoned.
In this report, we provide an assessment of a selection of the INDCs submitted to the UNFCCC by 29 October 2015 (Figure 1.1). We analyse the aggregate effect of these selected INDCs on projected global greenhouse gas
emissions up to 2030, and compare the result to emission projections based on implementation of current climate policies and on business-as-usual developments. Furthermore, we assess the emission gap between the global emission levels required for keeping global temperature increase within 2°C, and those that would result from implementation of the submitted INDCs, by 2025 and 2030. Uncertainties in emission projections are also discussed. For G20 countries (including the EU28), we present several emission indicators to compare the ambition levels of their INDCs. We address the following questions:
Global assessment
1. What are the announced reduction proposals of the INDCs submitted to date? (Chapter 2) 2. What are the projected global greenhouse gas
emission levels by 2030 if all submitted INDCs are implemented? (Section 3.1)
3. What is the projected impact of the INDCs on reducing the global 2 °C emission gap by 2030? (Section 3.2)
4. What is the projected impact of the INDCs on emissions and removals from land use, land-use change and forestry (LULUCF) in the context of high uncertainties? (Section 3.3)
National assessment (G20 members)
5. How do emission reductions as projected for national INDCs compare to different historical base years? (Section 4.1)
6. How do emission reductions as projected for national INDCs compare to PBL business-as-usual emission projections? (Section 4.2)
7. Are national INDCs in line with below-2 °C pathways? (Section 4.3)
8. What do national INDCs imply for the timing and level of greenhouse gas emission peaks? (Section 4.4) 9. Are per capita emissions and emission intensities,
as projected from national INDCs, converging between countries? (Section 4.5)
ONE ONE
Figure 1.1
Countries that have submitted INDCs to the UNFCCC
pbl.nl
Situation 29 October 2015 INDC submitted, analysed INDC submitted, not analysed No INDC submitted Source: PBL
TWO
Overview of the
mitigation contribution
of submitted INDCs
2.1 What are the announced emission
reduction proposals of the INDCs
submitted to date?
By 29 October 2015, 128 INDCs had been submitted to the UNFCCC in preparation for the adoption of the Paris Agreement in December 2015. These INDCs (including the INDC submitted by the EU, on behalf of its 28 Member States) cover emissions from 156 out of 195 Parties to the UNFCCC1. Together, these 156 Parties were responsible for
approximately 90% of global greenhouse gas emissions in 2012 (Figure 1.1 and Table 2.1). In this report, we provide a quantitative assessment of the INDC mitigation targets of Parties with a 2012 global emission share of more than 0.1%. Some smaller countries for which adequate data were available for calculating the effect of their INDC targets were also included. Based on this selection we analysed a total of 102 Parties (including the EU28 Member States), which together were responsible for 89% of global greenhouse gas emissions in 2012 (see Table 2.1).
Table 2.1 presents an overview of the mitigation targets of all 128 INDCs submitted. Almost all parties committed to an unconditional reduction target. Among countries with emissions exceeding 100 MtCO2eq in 2012, India is the only
country whose INDC targets are conditional, whereas targets set by Algeria, Argentina, Bangladesh, Chile, Colombia, Indonesia, Kazakhstan, Mexico, Philippines, Turkmenistan and Thailand are partially conditional. Conditional means that the implementation of reduction measures is conditional on international support, economic and technological developments, or other factors. Most countries defined their INDC targets for the year 2030, except for some countries (for example Brazil and the United States), who defined targets for 2025. Table 2.2 quantifies the mitigation components of the INDCs submitted by G20 members2, showing their
reduction targets, the base year relative to which these targets are defined, and the calculated absolute emission
targets. The latter emission levels were calculated using either national data from the INDC submission (if provided by the submitting party) or the national inventories (historical data or business-as-usual projections depending on how the INDC reduction targets were defined). More specifically, the base year and historical emissions for Australia, Canada, the EU28, Japan, the Russian Federation and the United States were based on UNFCCC national inventories, whereas base year emissions for Argentina, Brazil, Indonesia, Mexico, South Korea and Turkey were provided in the INDC submissions of these countries. It should be noted that our calculations do not account for credits or debits from land use, land-use change and forestry (LULUCF), surplus emission units, and double counting and additionality of offsets.
Among the G20, China and India are the only countries that did not propose an emission reduction target; instead, they propose a combination of climate policies and emission intensity reduction targets. The combined effect of their emission intensity targets, non-fossil targets and afforestation targets was calculated using the PBL TIMER energy model (Van Vuuren et al., 2014) for energy-related emissions and the IIASA GLOBIOM/G4M model (Havlik et al., 2014; Kindermann et al., 2008) for the LULUCF emissions. Based on these calculations, greenhouse gas emission levels in 2030 (including LULUCF) are projected at 13,955 MtCO2eq for China and
4,170 MtCO2eq for India (for details on China, see
Den Elzen et al., 2015).
Notes
1 In our analysis, the EU28 is considered as a single Party, and EU Member States are not considered individually. To ease reading, this report uses ‘countries’ and ‘national’ to refer to all ‘Parties’, including the EU28.
2 Except Saudi Arabia, as this country submitted an INDC after 29 October 2015. France, Italy, Germany and the United Kingdom are covered by the INDC of the EU.
TWO TWO
Table 2.1
Overview of the mitigation targets of the 128 INDCs submitted by 29 October 2015, including the share of each party in 2012 global greenhouse emissions (parties listed in alphabetical order)
Country/party Share GHG
emissions 20121)
Included in the analysis2
GHG emission reduction target3
Afghanistan 0.03% Conditional: 13.6% By 2030 Below BAU
Albania 0.02% 11.5% By 2030 Below BAU
Algeria 0.33% X Conditional: 7% to 22% By 2030 Below BAU
Andorra <0.01% 37% By 2030 Below BAU
Antigua and Barbuda <0.01% List of policies and measures By 2030 Below 2006
Argentina 0.71% X 15% (conditional: 30%) By 2030 Below BAU
Armenia 0.02% 189 tonnes per capita, 633 million tons carbon in
2015–2050 By 2050 Reduction of per
capita emissions
Australia 1.42% X 26% (conditional: 28%) By 2030 Below 2005
Azerbaijan 0.11% X 35% By 2030 Below 1990
Bangladesh 0.34% X 5% (conditional: 15%) By 2030 Below BAU
Barbados <0.01% 44% (23% below 2008) By 2030 Below 2008
Belarus 0.20% X 28% By 2030 Below 1990
Belize <0.01% No explicit target for emission reduction -
-Benin 0.06% X 3.5% (conditional: 17.9%) By 2030 Below BAU
Bhutan 0.01% Intends to remain carbon neutral -
-Bolivia 1.16% X No explicit target for emission reduction -
-Bosnia-Herzegovina 0.05% 2% By 2030 Below BAU
Botswana 0.15% X 15% By 2030 Below 2010
Brazil 5.58% X 37% below 2005 in 2025 (indicative: 43% below
2005 levels in 2030) By 2025 (By 2030) Below 2005
Burkina Faso 0.08% 6.6% (conditional: 11.6%) By 2030 Below BAU
Burundi 0.01% X 3% (conditional 20%) By 2030 Below BAU
Cape Verde <0.01% 30% renewables, 10% energy savings (conditional
100% renewables, 20% energy savings) By 2025 Increasing the share of renewable energy and energy savings Cambodia 0.24% X Conditional 27% and a LULUCF contribution of 4.7
tCO2eq/ha/year
By 2030 Below BAU
Cameroon 0.19% X Conditional: 32% By 2035 Below BAU
Canada 1.92% X 30% By 2030 Below 2005
Central African
Republic 0.96% X Conditional: 5% by 2030, 25% by 2050 By 2030 (By 2050) Below BAU
Chad 0.21% X 18.2% (conditional: 71%) By 2030 Below BAU
Chile 0.23% X Reduce carbon intensity by 30% per unit of GDP
(conditional: 35% to 45% per unit of GDP) By 2030 Below 2007 China 23.27% X CO2 peaking around 2030; 60% to 65% CO2 intensity
improvements, 20% non-fossil fuels in primary energy consumption, increase the forest stock volume; list of policies and measures.
TWO
Country/party Share GHG
emissions 20121)
Included in the analysis2
GHG emission reduction target3
Colombia 0.40% X 20% (conditional: 30%) By 2030 Below BAU
Comoros <0.01% 84% (conditional: reductions beyond 10% of implementation costs)
By 2030 Below BAU
Congo 0.07% Conditional: at least 48% (55%) By 2025
(By 2035) Below BAU
Costa Rica 0.02% X 44% By 2030 Below BAU
Côte d’Ivoire 0.06% 28% By 2030 Below BAU
DR Congo 1.50% X Conditional: 17% By 2030 Below BAU
Djibouti 0.01% X 40% (conditional: 60%) By 2030 Below BAU
Dominica <0.01% 45% By 2030 Below 2014
Dominican Republic 0.06% X Conditional: 25% By 2030 Below 2010
Ecuador 0.09% 40% in per capita emissions and 20.4% to 25% in
the energy sector By 2025 Below BAU
Equatorial Guinea 0.01% 20% (with a view to 50% by 2050). Conditional on (unspecified) technical & financial support
By 2030 (By 2050)
Below 2010
Eritrea 0.01% 39.2% (conditional: 80.6%) By 2030 Below BAU
Ethiopia 0.35% X 64% (conditional on agreement enabling support and investments)
By 2030 Below BAU
EU28 8.74% X At least 40% domestic By 2030 Below 1990
Former Yugoslav Rep. of Macedonia
0.02% X 30% to 36% from CO2 fossil fuels combustion By 2030 Below BAU
Gabon 0.06% X 50% By 2025 Below BAU
Gambia 0.01% 45.4% (44.4% by 2025) By 2030 Below 2010
Georgia 0.03% 15% (conditional: 25%) By 2030 Below BAU
Ghana 0.20% X 15% (conditional: 45%) By 2030 Below BAU
Grenada <0.01% 30% (indicative: 40% below 2010 levels by 2030) By 2025
(By 2030) Below 2010
Guatemala 0.06% 11.2% to 22.6% By 2030 Below BAU
Guinea 0.19% X 13% By 2030 Below 1994
Guinea Bissau 0.01% No explicit target for emission reduction -
-Guyana 0.01% Up to 52Mt CO2 (20% renewables) By 2025 Below BAU
Haiti 0.02% 5% to 26% By 2030 Below BAU
Honduras 0.04% 15% By 2030 Below BAU
Iceland 0.01% X 40% By 2030 Below 1990
India 5.61% X Conditional: 33% to 35% emission intensity
improvement; renewable energy to increase to 40% of total power capacity and an additional carbon sink of 2.5 to 3 Mt CO2eq through additional forest
and tree cover
By 2030 Below 2005
Indonesia 1.46% X 29% (conditional: 41%) By 2030 Below BAU
Israel 0.16% X 26% By 2030 Below 2005
Japan 2.76% X 26% By 2030 Below
Fiscal year 2013
Jordan 0.05% X 1.5% (conditional: 14%) By 2030 Below BAU
TWO TWO
Country/party Share GHG
emissions 20121)
Included in the analysis2
GHG emission reduction target3
Kenya 0.10% X Conditional: 30% By 2030 Below BAU
Kiribati <0.01% 12.8% (13.7% by 2025) By 2030
(By 2025)
Below BAU Kyrgyzstan 0.03% 11.49% to 13.75% (conditional: 29% to 30.89%) (also
includes 2050 goals) By 2030 Below BAU
Lao People’s
Democratic Republic 0.30% X No explicit target for emission reduction -
-Lebanon 0.04% X 15% (conditional 30%) By 2030 Below BAU
Lesotho 0.01% X 10% (conditional 35%) By 2030 Below BAU
Liberia 0.01% Conditional 15% By 2030 Below BAU
Liechtenstein <0.01% 40% By 2030 Below 1990
Madagascar 0.22% X 14% emission sinks enhanced by 32% By 2030 Below BAU
Malawi 0.04% X No explicit target for emission reduction -
-Maldives <0.01% 10% (conditional: 24%) By 2030 Below BAU
Mali 0.14% X 27% (29% from agriculture, 31% from energy and
21% from LULUCF)
By 2030 Below BAU Marshall Islands <0.01% 32% (indicative: 45% below 2010 levels by 2030) By 2025 Below 2010 Mauritania 0.02% 22.3% (33.6 MtCO2eq) of which 88% conditional By 2030 Below BAU
Mauritius 0.01% Conditional: 30% By 2030 Below BAU
Mexico 1.24% X 22% (conditional: 36%), emissions peaking after 2026
By 2030 Below BAU
Monaco <0.01% 50% By 2020 Below 1990
Mongolia 0.05% List of policies and measures -
-Montenegro <0.01% 30% (preliminary target; could revisit after AFOLU rules agreed)
By 2030 Below 1990
Morocco 0.20% X 13% (conditional: 32%) By 2030 Below BAU
Mozambique 0.71% X No explicit target for emission reduction -
-Myanmar 0.99% X REDD+ goals otherwise not quantified -
-Namibia 0.07% X Conditional: 89% By 2030 Below BAU
New Zealand 0.15% X 30% By 2030 Below 2005
Niger 0.02% 3.5% by 2030 and 2.5% by 2020.
Conditional: 25% by 2020, 34.6% by 2030.
By 2030 Below BAU
Norway 0.12% X At least 40% By 2030 Below 1990
Oman 0.12% X 2% By 2030 Below BAU
Papua New Guinea 0.02% No explicit target for emission reduction -
-Paraguay 0.09% 10% to 20% By 2030 Below BAU
Peru 0.14% X 20% (conditional: 30%) By 2030 Below BAU
Philippines 0.31% X Conditional: 70% By 2030 Below BAU
Republic of Korea
(South Korea) 1.25% X 37% By 2030 Below BAU
Republic of Moldova 0.02% X 64% to 67% (conditional: 78%) By 2030 Below 1990
Russian Federation 5.24% X 25% to 30% By 2030 Below 1990
Rwanda 0.01% No explicit target for emission reduction -
-TWO
Country/party Share GHG
emissions 20121)
Included in the analysis2
GHG emission reduction target3
San Marino <0.01% 20% By 2030 Below 2005
Sao Tome and Principe
<0.01% 24% By 2030 Below 2005
Senegal 0.09% 5% (conditional: 21%) (with targets for 2020 and 2025)
By 2030 Below BAU
Serbia 0.13% X 9.8% By 2030 Below 1990
Seychelles <0.01% X 29% (21.4%) By 2030
(2025) Below BAU
Sierra Leone 0.02% No explicit target for emission reduction -
-Singapore 0.10% X Reduce emission intensity by 36%, emissions peaking around 2030
By 2030 Below 2005
Solomon Islands 0.01% 45% (27%) By 2030
(2025) Below BAU South Africa 0.84% X By 2025 and 2030, emissions will be in a range
between 398 and 614 MtCO2eq, peaking between
2020 and 2025
By 2030 Below BAU
Sri Lanka 0.06% No explicit target for emission reduction By 2030 Below BAU
Suriname <0.01% No explicit target for emission reduction By 2025 Below BAU
Swaziland 0.01% No explicit target for emission reduction By 2030
-Switzerland 0.10% X 50% By 2030 Below 1990
Tajikistan 0.03% 10% to 20% By 2030 Below 1990
Thailand 0.82% X 20% (conditional: 25%) By 2030 Below BAU
Togo 0.04% 11.14% to 31.14% By 2030 Below BAU
Trinidad and Tobago 0.11% X 30% in public transport; plus conditional 15% in power generation, transport and industrial sectors
By 2030 Below BAU Tunisia 0.07% 13% decrease in carbon intensity (conditional: 41%;
for energy sector 46%) By 2030 Below 2010
Turkey 0.83% X 21% By 2030 Below BAU
Turkmenistan 0.17% X No explicit target for emission reduction -
-Uganda 0.15% X Conditional 22% By 2030 Below BAU
Ukraine 0.76% X 60% By 2030 Below 1990
United Arab Emirates
0.38% X List of policies and measures, including an increase of renewable energy to 24% of the total energy mix by 2021
By 2021 and 2030
Below BAU
United Republic of
Tanzania 0.44% X Conditional 10% to 20% By 2030 Below BAU
Uruguay 0.06% X A list of sectorial targets sorted by GHG gas -
-United States of America
11.85% X 26% to 28% By 2025 Below 2005
Vanuatu <0.01% Conditional: 30% reduction in energy sector, 15% in all other sectors except agriculture and forestry (100% renewables for electricity)
By 2030 Below BAU
Vietnam 0.58% X 8% (conditional: 25%) By 2030 Below BAU
Zambia 0.60% X Conditional: 47% By 2030 Below 2010
Zimbabwe 0.13% X 33% By 2030 Below BAU
Total share 90% 89%
1) Including emissions from international transport. Source: EC-JRC EDGAR (JRC & PBL, 2012).
2) Covered in the analysis of this report (together representing 89% of global 2012 emissions). Other countries are not included in this analysis because of too much uncertainty in the quantification of their INDCs, or because their 2012 emission share was less than 0.1%. 3) As submitted to http://www4.unfccc.int/submissions/indc/Submission%20Pages/submissions.aspx (UNFCCC, 2015)
TWO TWO
Table 2.2
Summary of the unconditional and conditional mitigation targets for 2025 and 2030, as stated in the INDCs of the G20 countries
G20 Country/party* Unconditional INDC target
(Conditional INDC target)
base year/emission level (MtCO2eq)
Emission target (MtCO2eq)8,9
based on calculations of this study
2025 2030 2025 2030
Argentina - -15% (-30%) BAU 2030 6701 - 570 (469)
Australia - -26% to -28% 2005 6012 - 433 to 445
Brazil -37% -43% 2005 2,1001 1,300 1,200
Canada - -30% 2005 7492 - 524
China - CO2 emission peak
around 2030; 60% to 65% CO2 emission intensity
reduction; 20% non-fossil fuels in primary energy consumption & increase of the forest stock volume
2005 7,0383 - 13,9574 [12,602; 16,835]5 EU28 - -40% 1990 5,6262 - 3,376 India - Conditional: 33% to 35% emission intensity reduction; 40% non-fossil fuel electricity; Increase of carbon sink volume
2005 1,8093 - 4,1684
[4,168; 6,733]7
Indonesia - -29% (-41%) BAU 2030 2,8811 - 2,046 (1,700)
Japan - -26% Fiscal Year
2013
1,4082 - 1,042
Mexico - -22% (-36%) BAU 2030 9731 - 759 (623)
Russian Federation - -25% to -30% 1990 3,3632 - 2,354 to 2,523
South Africa - - BAU 2030 - 398 to 6141 398 to 6141
Rep. of Korea - -37% BAU 2030 8511 - 536
Turkey - -21% BAU 2030 1,1751 - 928
United States -26% to
-28% - 2005 6,439
2 4,636 to 4,765 (3,992 to 4,121)6
*) The country-specific emission levels stated above include all greenhouse gas emissions from energy, industry and services, as well as emissions and removals from activities related to land use, land-use change and forestry (LULUCF) for the following countries: the United States, Turkey, Mexico, Indonesia, Brazil, India, China, Australia, and Argentina. The land-use emissions and removals from the remaining countries were aggregated as part of the global estimates on effects of land-use emissions and removals.
1) Source:http://www4.unfccc.int/submissions/indc/Submission%20Pages/submissions.aspx. 2) Source:national inventories, UNFCCC, including Common Reporting Formats (2015).
3) Source:energy-related CO2 emissions from IEA (2013a), non-energy-related emissions from EDGAR 4.2 (JRC and PBL, 2012) and
LULUCF. emissions from FAOSTAT data (http://faostat3.fao.org/faostat-gateway).
4) For China and India the combined effect of emission intensity targets, non-fossil targets and afforestation targets was calculated using the PBL TIMER energy model and the IIASA GLOBIOM/G4M models. Based on these calculations, greenhouse gas emissions in 2030 (including LULUCF) are projected at 13,957 MtCO2eq for China and 4,168 MtCO2eq for India (for China, see details in
Den Elzen et al., 2015).
5) The effect of China’s CO2 intensity target was calculated using annual GDP growth rates of 4.3% to 6.3% between 2021 and 2030
(as based on WEO 2014 and PBL model estimates). Hence the range in projected emissions.
6) The emission target for the United States for 2030 was estimated by extrapolating the 2025 emission level (calculated from the INDC) towards the 2050 emission level as based on the national long-term target (reducing emissions by 83% below 2005 levels by 2050, as is also described in the INDC).
7) The lower end of the range includes the effects of India’s greenhouse gas intensity target, the non-fossil electricity target, as well as the carbon sink target. The upper end of the range only includes the effect of the greenhouse gas intensity target.
8) Calculated emission levels do not account for LULUCF carbon credits.
9) Successful implementation of the INDCs is contingent upon an ambitious global agreement including additional means of implementation to be provided by developed country parties, technology transfer and capacity building following Articles 3.1 and 4.7 of the Convention.
THREE
Global impact of the INDCs
3.1 What are the projected global
greenhouse gas emission levels
by 2030 if all INDCs are
implemented?
To estimate the aggregate effect of INDCs on global emission levels, we distinguished two scenarios: one in which only the unconditional targets are implemented (‘the unconditional INDC scenario’), and one in which both unconditional and conditional targets are implemented (‘the conditional INDC scenario’). For countries whose INDC included unconditional targets only, we assumed that their emission level would be the same in both the unconditional and conditional scenarios. For countries whose INDC included only conditional targets, we assumed current policies emission levels (based on Den Elzen et al., 2015; Roelfsema et al., 2013), or, if not available, PBL business-as-usual levels when calculating total global emissions in the unconditional scenario.
Secondly, we assumed that emission levels of countries that had not submitted an INDC by 29 October 2015 would either follow current policies emission levels (Den Elzen et al., 2015; Roelfsema et al., 2013) or PBL business-as-usual levels based on the OECD Environmental Outlook (OECD, 2012). Total global emissions were calculated by adding international aviation emissions (ICAO, 2013) and international shipping emissions (IMO, 2014) (both harmonised to EDGAR 2010 emissions) and LULUCF emissions based on various sources (including FAOSTAT, national communications and model projections)1 for
those countries whose INDC did not address LULUCF. The resulting global emission level in 2010 is estimated at 45.9 GtCO2eq, which is about 2 GtCO2eq lower than the
47.8 GtCO2eq estimated from the total sum of global
greenhouse gas emissions (excluding LULUCF CO2) from
the EDGAR database (JRC/PBL, 2012) and the global LULUCF CO2 emissions from FAOSTAT. Both sources were
used for historical greenhouse gas emissions. Therefore,
global emission projections were harmonised to the 2010 emission level of 47.8 Gt CO2eq, using a constant
harmonisation factor over time from 2010 onwards. The difference between the global emission estimates is completely due to differences in the estimates for LULUCF emissions: the EDGAR data base reports higher LULUCF emissions than the estimates from FAOSTAT and national communications (see Chapter 11, IPCC Fifth
Assessment Report).
Table 3.1 presents global and national greenhouse gas emissions in 2030, as projected from the submitted INDCs. As these projections show, global emissions will keep increasing until at least 2030, even if all INDCs are fully implemented. The projected global emission level in 2030 is about 56 (55–60) GtCO2eq if all unconditional
INDCs are implemented, and about 54 (52–58) GtCO2eq
if the conditional INDCs are implemented as well. The median estimates are 13 – 18% above 2010 emission levels. The range in these estimates is a result of the uncertainties in the INDC projections for Australia, the Russian Federation, South Africa, the United States, China and India.
The aggregate effort proposed by the INDCs is shown by comparing the 2030 global emission level projected for the INDCs with the 2030 global emission level projected for the PBL business-as-usual scenario (Box 3.1) and the current policies scenario2, based on Den Elzen et al. (2015)
and Roelfsema et al. (2013). The first comparison gives an indication of the total effort proposed relative to business-as-usual scenarios. This effort is projected at 9 to 11 GtCO2eq globally by 2030. The second comparison
gives an indication of the effort proposed in addition to already implemented climate policies; this additional effort is projected at 3 to 5 GtCO2eq globally by 2030.
Although most of the individual INDCs are projected to lead to a decrease in national emission levels before 2030, compared to their current policies scenario (largely due to accelerated decarbonisation after 2020), total
THREE THREE
Table 3.1Greenhouse gas emissions in G20 countries and global emission levels, projected for 2030 for the PBL
business-as-usual scenario, the current policies scenario, the unconditional INDC scenario and the conditional INDC scenario (the effect of INDCs of non-G20 countries is covered in the category ‘other countries’)
Greenhouse gas emissions, including LULUCF (MtCO2eq)1
PBL BAU scenario PBL current policies scenario3 Unconditional INDC scenario Conditional INDC scenario G20 countries 19902 20102 2030 2030 2030 2030 Argentina6 320 374 479 479 570 469 Australia7 555 560 708 666 43910 [433; 445] 439 10 [433; 445] Brazil6 1,611 1,688 2,062 1,524 1,200 1,200 Canada 613 707 796 671 524 524 China6 3,254 10,130 15,914 14,646 13,95710 [12,602; 16,835] 13,957 10 [12,602; 16,835] EU28 5,626 4,751 4,992 3,992 3,376 3,376 India6 1,180 2,379 5,374 4,739 4,739 [4,168; 6,733] 4,168 10 [4,168; 6,733] Indonesia6 1,063 2,059 2,516 2,094 2,046 1,700 Japan 1,234 1,258 1,310 1,105 1,042 1,042 Mexico7 559 748 976 843 759 623 Russian Federation 3,363 2,221 2,342 2,174 2,43810,13 [2,354; 2,523] 2,438 10,13 [2,354; 2,523] South Africa 380 515 747 700 50610 [398 ; 614] 50610 [398 ; 614] South Korea 289 629 673 545 536 536 Turkey7 144 346 675 545 928 928 United States7 5,402 5,907 6,447 5,572 4,05610 [3,992; 4,121] 4,05610 [3,992; 4,121] Other countries5 6,223 9,172 14,766 14,895 14,861 13,769
Remaining LULUCF CO2 emissions8 2,596 1,385 657 657 657 657
International marine & aviation emissions4 678 1,117 1,792 1,792 1,792 1,792 Harmonisation factor9 173 1,811 1,811 1,811 1,811 1,811 World, harmonised11 35,265 47,757 65,032 59,339 56,235 [54,613; 60,091] 53,990 [52,368; 58,416] Excluding the impact of new
surplus emissions12
-1,083 -797
World, harmonised
excl. hot air [53,614; 58,214]55,152 [51,655; 56,825]53,193
1) The country-specific emission levels stated above include all greenhouse gas emissions from energy, industry and services, as well as emissions and removals from activities related to land use, land-use change and forestry (LULUCF) for the following countries: the United States, Turkey, Mexico, Indonesia, Brazil, India, China, Australia, and Argentina. The land-use emissions and removals from the remaining countries were aggregated as part of the global estimates on effects of land-use emissions and removals. Only including LULUCF CO2 emissions in countries with a high share of land-use emissions in their total emissions
(including emissions from peatlands) and countries that explicitly addressed LULUCF in their INDC.
2) Source: Historical emissions in China, India and Indonesia are based on energy-related emissions (IEA, 2013), non-energy-related emissions (EDGAR 4.2, http://edgar.jrc.ec.europa.eu/overview.php?v=42FT2012#) (JRC/PBL, 2012) and LULUCF emissions (FAOSTAT). Historical emissions from other countries are based on UNFCCC national inventory submissions or the INDC submissions. Business-as-usual emissions are based on the OECD Environmental Outlook (OECD, 2012) as calculated by the IMAGE modelling framework.
3) Emission projections for the current policies scenario are based on Roelfsema et al. (2013) and Den Elzen et al. (2015).
4) Source: EDGAR 4.2 history, http://edgar.jrc.ec.europa.eu/overview.php?v=42FT2012#, and ICAO and IMO projections from 2010 through 2030.
5) Source: EDGAR 4.2 history, http://edgar.jrc.ec.europa.eu/overview.php?v=42FT2012#, and IMAGE projections from 2010 through 2030. This category covers the INDCs of non-G20 countries.
6) LULUCF source: FAOSTAT history, http://faostat3.fao.org/download/G2/*/E, and IIASA projections from 2010 through 2030. 7) LULUCF source: national communications as reported in the UNFCCC national inventory submissions.