ASSESSMENT OF US CITY
REDUCTION COMMITMENTS,
FROM A COUNTRY PERSPECTIVE
Note
Mark Roelfsema
ASSESSMENT OF US CITY REDUCTION COMMITMENTS, FROM A COUNTRY PERSPECTIVE
© PBL Netherlands Environmental Assessment Agency The Hague, 2017 PBL publication number: 1993 Corresponding author mark.roelfsema@pbl.nl Author Mark Roelfsema Graphics PBL Beeldredactie Acknowledgements
I would like to thank Michel den Elzen and Pieter Boot for their review.
Production coordination and English-language editing PBL Publishers
This publication can be downloaded from: www.pbl.nl/en. Parts of this publication may be reproduced, providing the source is stated in the form: Roelfsema M. (2017), Assessment of US city reduction commitments, from a country perspective. PBL Netherlands Environmental Assessment Agency, The Hague.
PBL Netherlands Environmental Assessment Agency is the national institute for strategic policy analysis in the fields of the environment, nature and spatial planning. We contribute to improving the quality of political and administrative decision-making by conducting outlook studies, analyses and evaluations in which an integrated approach is considered paramount. Policy relevance is the prime concern in all of our studies. We conduct solicited and
Contents
1
INTRODUCTION
4
2
IMPACT OF US CITY REDUCTION COMMITMENTS ON NATIONAL
GREENHOUSE GAS EMISSION LEVELS
8
3
INTERACTION BETWEEN NATIONAL AND CITY CLIMATE ACTION
12
4
DISCUSSION AND CONCLUSION
14
REFERENCES
16
FINDINGS
The 25 largest US cities are projected to reduce between 95 and 125 MtCO2eq of greenhouse gas emissions by 2030, from a business-as-usual level of 360 MtCO2eq, depending on the climate action implemented by cities without greenhouse gas reduction commitments.
These cities are projected to add 5 to 30 MtCO2eq to the national NDC reduction target by 2030. The 2030 target is based on interpolation of the 2025 NDC1 target and the 2050 long-term target of the US long-term strategy.
This projection is based on 14 of these cities that have committed to greenhouse gas reductions, and on the projected greenhouse gas emissions from the 11 that have not committed to emission reductions. For the latter group, either a business-as-usual scenario (in which no additional measures are implemented) is assumed, or any measures taken in accordance with the country’s Nationally Determined Contribution (NDC) target. No greenhouse gas data were available for most of the cities without a reduction commitment Therefore, for the group as a whole, we first scaled their 2010 emissions using the population–emissions ratio obtained from the available city data. Then, the TIMER model’s increase in US emissions was used for the business-as-usual projections.
If we scale the projected result for the 25 largest US cities to that for the 200 largest US cities, the range of reductions additional to the NDC reduction level is between -70 and +50 MtCO2eq. The lower end of the range (based on business-as-usual projections) then becomes negative, as the larger group contains more cities without a greenhouse gas reduction commitment.
These results show that, to assess the additionality of city reduction commitments to the national NDC target, it is important to include not only the cities with a greenhouse gas reduction commitment, but also those without.
Moreover, to show the additionality of sub-national and non-state reductions to the NDC target on a national level, all actors (sub-national, companies, civil society) need to be taken into account, while paying attention to any overlap.
The extent to which cities are able to achieve their committed greenhouse gas reduction targets depends on the degree of independence of national governments to implement and enforce climate policies. This leads to another important question, namely how to increase the effectiveness of the interaction between national and sub-national policies. Availability of and access to data on city greenhouse gas emissions are low, making
assessment of large numbers of cities difficult.
FULL RESULTS
1 Introduction
An increasing number of sub-national and non-state actors, such as cities and companies, are taking mitigation measures to prevent climate change. In addition, under the Paris Agreement of 2015, non-party stakeholders were recognised, and were invited to scale up their climate actions and register them at the Non-Sate Actor Zone for Climate Action (NAZCA) platform (UNFCCC, 2016). As a follow-up, during the 2016 climate summit in Marrakech, the Marrakech Partnership for Global Climate Action was launched to catalyse and support climate action within the UNFCCC by Parties as well as non-Party Stakeholders. This sequence of events led to the conclusion that it is essential to clearly establish the role of sub-national authorities and non-state actors in international climate negotiations, and to assess their impact on greenhouse gas emission levels. In addition, it is important to consider the interaction between the policies of non-state actors and sub-national authorities on the one hand, and national government policies on the other.
As a first step, Roelfsema et al. (2015) estimated that the global impact of international cooperative initiatives (ICIs) would result in a 2.5 GtCO2e reduction by 2020 and 5.5 GtCO2e reduction by 2030, relative to a business-as-usual scenario that does not include any climate policies. But these greenhouse gas reductions were shown to overlap, to a large extent, with national commitments made within the UNFCCC. However, these estimated overlaps were based on the assumption that certain emission reductions from international initiatives will not lead to additional reductions if they occur in the countries that have already pledged reductions covered by the sectors involved2. So, the possibility that ICIs could have more ambitious reduction commitments compared to national policies was not considered. To improve the insight into a possible overlap requires more national detailed information, which we pursued for this assessment.
The focus of this analysis is on large cities as sub-national actors and on the role of cities in global climate change, which has become increasingly important, over time (Seto et al., 2014). More specifically, because data availability proved problematic — there is for example ‘no comprehensive statistical database on urban and rural greenhouse gas emissions and greenhouse gas data is particularly scarce for medium and small cities’ (Seto, 2014) — we focused on the 25 largest US cities. Desk research provided many of the data on these 25 cities. To show the impact of smaller and medium-sized cities, we extrapolated the results to the 200 largest US cities for which only population sizes were available.
Note that various levels of urban greenhouse gas emissions and reduction commitments can be analysed at different scales (cities, metropolitan regions and urban agglomerations). Most urban populations live in areas with fewer than 750,000 people (Erickson, Tempest, 2014). For our analysis, we started with the smallest urban areas, but the method can be expanded to also include other scales, more countries, and other sub-national actors’. For example, states and counties in the United States have implemented their own climate policies, such as those on greenhouse gas targets and renewable energy portfolio standards (Grant et al., 2014).
2 Once a country has formally ratified the Paris Agreement, their INDC is converted to NDC 3 Retrieved from
The large range of estimated emission reductions for cities, as provided by the literature, is between 0.6 and 3.7 GtCO2eq by 2030 (see Table 1). If we only consider the studies that assessed city commitments, and not their potential, the reduction range for cities with reduction commitments is smaller, namely between 0.4 and 0.7 GtCO2eq by 2030 (see Table 2). Note that this range is based on results from studies that all use varying numbers of cities, and that the reference against which they compare the greenhouse gas reduction commitments is unclear.
For this assessment, we focused on US city greenhouse gas reduction commitments and the overlap with NDCs pledged on the national level. The research question is: ‘what is the impact of the greenhouse gas reduction commitments by US cities on their projected emission levels and how much of this reduction is in addition to the US NDC emission reductions by 2030?’ The US NDC is to reduce between 26% to 28% in greenhouse gas emissions, relative to 2005 levels. The average of this target was extrapolated to 2030 using the long-term greenhouse gas emission reduction target of 80% relative to 2005 levels (US Government, 2016).
Our research question first led to the development of a methodology for quantifying the impact of and overlap between city and national greenhouse gas reduction commitments. Subsequently, we quantified this for the 25 largest US cities and then scaled this up to the 200 largest cities. The impact of city greenhouse gas reduction commitments is presented in this study as the reductions relative to business-as-usual projections as published by the cities themselves, or, if not available, those based on the IMAGE model’s (PBL, 2014) SSP2 scenario (Riahi et al., 2016; Van Vuuren et al., 2014). This approach also enabled
assessment of any overlap between and additionality of city emission reduction commitments to national commitments, NDCs and commitments of other actors. This assessment focuses on any overlap with the NDC greenhouse gas reduction commitment, rather than on policies. We assumed the goal of implementing national policies to be that of achieving the NDC target. As the degree to which countries are likely to achieve their 2030 NDC target under current policies was found to vary (Kuramochi et al., 2016), this may imply that countries need to implement additional climate policies.
Table 1 Potential city greenhouse gas reductions, from the literature
Author Title Reductions
by 2020 (MtCO2eq) Reductions by 2030 (MtCO2eq) Impact on GHG emissions Erickson, Tempest (2014) Advancing climate ambition: how city-scale actions can contribute to global climate goals
3,700 Potential contribution of city reductions to the global emission level, compared to reference scenario of 15.4 GtCO2eq
The New Climate Economy (2014)
What impact can local economic development in cities have on global greenhouse gas emissions? Assessing the evidence
600 Potential contribution of city reductions to the global emission level from specific measures in indoor heating and cooling and personal vehicle use, compared to reference scenario of 8 GtCO2eq
Table 2 Estimated committed city greenhouse gas reductions, from the literature
Author Title Reductions
by 2020 (MtCO2eq) Reductions by 2030 (MtCO2eq) Impact on GHG emissions C40 Cities (2013)
The Rio numbers 400 (250) 1,000 Reduction commitments by C40 cities, compared to a reference scenario of 2.3* GtCO2e by 2020 and 2.9* GtCO2e by 2030 ARUP, C40 Cities (2014) Working together: global aggregation of city climate commitments
454 402 Cities with reduction commitments for 2020 and 2030 from 228 cities Umwelt Bundesamt (2016) International Climate Initiatives – A way forward to close the emissions gap?
500* 550* Impact from two ICIs: C40,
Under 2° Memoramdum of Understanding (Under 2MOU) Carbon Climate Registry (2015) 5 year overview report (2010-2015) 1,000 866 (67% of 1293) registered greenhouse gas reduction commitments
Compact of Mayors (2016)
Climate leadership at the local level: global impact of the Compact of Mayors 500 740 360 cities committed to Compact of Mayors Roelfsema et al. (2015) Climate Action Outside the UNFCCC
600 700 C40 cities and Covenant of Mayors commitments, compared to reference scenario of 4.6 GtCO2eq by 2020 and 5.3 GtCO2eq by 2030 Hsu et al. (2015) Towards a new climate diplomacy
454 Compact of Mayors cities with reduction commitments Yale
Data-driven (2016)
920 560 2,154 community or region-wide emission reduction commitments from nearly 1,853 cities and 86 regions ICLEI (2015) Measuring up 38** US cities with reduction
commitments for 2020, from 116 US cities
* Number was taken from graph, exact number not available
** Cities with longer commitment periods were estimated to achieve 191 MtCO2e reductions by 2035
Many cities organise themselves in International Cooperative Initiatives (ICIs), which have a wide range of roles, such as producing policy disseminating knowledge, training, lobbying and consulting governments or developing low-carbon products or policies (Chan et al., 2015). Some databases register ICIs and ICI commitments, of which the UNEP Climate Initiatives Platform (CIP) and the NAZCA portal are most well-known. The CIP contains a collection of information on international climate initiatives (UNEP, UNEP Partnership DTU, 2014), and NAZCA is the official platform for tracking climate action by non-Party
Stakeholders (UNFCCC, 2016). The UNEP Climate Initiatives platform includes 38 ICIs3 in
which cities participate, and the NAZCA portal includes 10 ICIs4. Notwithstanding the importance of city cooperation on climate change for assessing the impact of city reduction commitments on greenhouse gas levels, we only need to consider individual cities. This information was obtained from the NAZCA platform.
In conclusion, this study assesses the impact of US city greenhouse gas reduction
commitments and determines the possible additionality of these commitments to the US NDC target. First, the analysis of the aggregated impact of the 25 largest U.S. cities and the scaling to the 200 largest US cities is presented. This is followed by a comparison of the reductions against the national US NDC target, and, finally, by a discussion of the interaction between city and national climate actions.
2 Impact of US city reduction
commitments on national
greenhouse gas emission levels
The impact of city reduction commitments on the total US greenhouse gas emission level depends not only on the climate actions by cities that have committed to reduce their greenhouse gas emissions, but also on those by cities without such commitments. This section shows the impact on greenhouse gas emission levels from climate actions by the 25 largest cities for which a large amount of information was available, and shows the result for the 200 largest cities based on scaling.
Of the largest 25 US cities in 20105, 14 have published greenhouse gas reduction
commitments (see Figure 1). These 14 cities are projected to deliver 95 MtCO2eq in annual emission reductions by 2030, from a business-as-usual (BAU) emission level of
245 MtCO2eq, as aggregated for these cities. This would result in a 36% reduction relative to 2010 emission levels, and is more than the national US NDC reduction commitment of 21% relative to 2010 emissions6. Comparing these city reduction commitments with the emission reductions that would occur if, instead, these cities were to achieve NDC targets, resulted in 30 MtCO2eq in additional reductions.
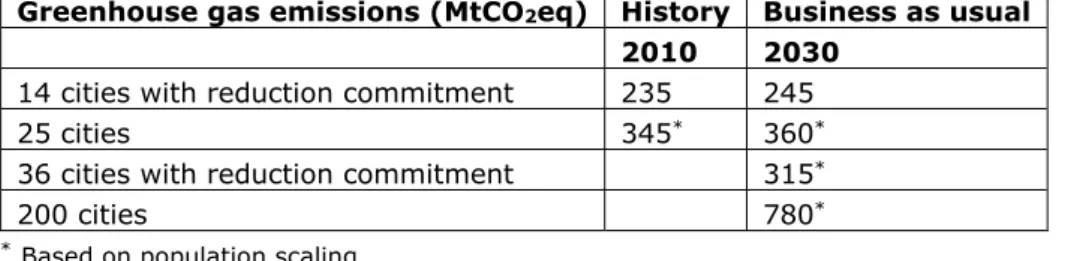
Table 3 Historical and business‐as‐usual greenhouse gas emissions for US cities and the country as a whole
Greenhouse gas emissions (MtCO2eq) History Business as usual
2010 2030
14 cities with reduction commitment 235 245
25 cities 345* 360*
36 cities with reduction commitment 315*
200 cities 780*
*Based on population scaling
Table 4 The population in 2010 of cities, urban areas and the country as a whole, included in the analysis
Population (millions) 2010
14 cities with reduction commitment* 23.9
25 cities 35.1
36 cities with reduction commitment 30.6
200 cities 75.9
Urban** 252.2
Total** 312.2
* source: http://www.citymayors.com/gratis/uscities_100.html ** source: https://esa.un.org/unpd/wup/DataQuery/
The 14 cities with reduction commitments have published greenhouse gas inventories, and in many cases also climate plans (see Appendix). If no business-as-usual projections were available, the TIMER greenhouse gas emission trend was used to project city greenhouse gas emissions based on 2010 inventory data. In that case, the national trend was used for city
5 See http://www.citymayors.com/gratis/uscities_100.html
6 Translation of NDC commitment to 2010 base year. Official NDC commitment is 27% (26528%) relative to
greenhouse gas development. The total historical and business-as-usual emissions for these cities were 235 MtCO2eq in 2010 and are projected to reach 245 MtCO2eq by 2030 (see Table
3).
Data on greenhouse gas reduction commitments were taken from the NAZCA portal (see Appendix). Note that any emission reduction commitments related to government operations, renewable energy, energy efficiency and non-greenhouse gas or non-energy reduction commitments were not taken into account. The reduction commitments were either interpolated or extrapolated to 2030, based on long-term targets or assumptions about business-as-usual trends after the target year.
Figure 1 The 25 largest US cities, in 2010, with and without greenhouse gas reduction commitments
Following the projected results for the 14 cities with reduction commitments, in a subsequent step, we determined the total impact of the 25 largest US cities. As no greenhouse gas projections were available for the 11 cities without a reduction commitment, we scaled the baseline of these cities to those with such commitments on the basis of population size. Total greenhouse gas emissions in the 25 largest cities were 345 MtCO2eq in 2010 and were projected to be 360 MtCO2eq by 2030. Scaling US city greenhouse gas emissions on the basis of population is appropriate, as emissions scale proportionally with urban population size (Fragkias et al., 2013).
The next step was to assess the climate actions by the 11 cities without greenhouse gas reduction commitments. In terms of population, these cities represent almost one third of the 25 largest cities. As these cities did not announce any climate plans, two scenarios were defined, covering the range of possible climate action7
1. These cities implement policies in line with the NDC commitment, either through their own actions or as a result of national policies impacting city greenhouse gas emission levels. This means that they will achieve reductions according to the INDC pledge.
7 A third scenario could be designed in which these cities would take action going further than NDC targets, but
this is assumed not be likely, as cities without GHG target will probably not have ambition going beyond national ambition
2. These cities do not implement climate measures and thus follow their business-as-usual pathway
Note that the first scenario represents the approach used in Graichen et al. (2016), were it is implicitly assumed that non-state actors without reduction commitment would achieve NDC emission reductions.
The 25 US cities together, are projected to reduce 125 MtCO2eq in greenhouse gas emissions from a business-as-usual level of 360 MtCO2eq under Scenario1 and 95 MtCO2eq under Scenario 2 (see Table 5). This equals a respective 30 and 5 MtCO2eq in additional reductions on top of national NDC reductions. Under the first scenario, the total amount in emission reduction in addition to the NDC by the 11 cities without a reduction commitment is by definition zero. For the group of 25 cities, this results in a total overall additional reduction of 30 MtCO2eq. Under Scenario 2, the 11 cities without reduction commitment will not reduce any emissions compared to the BAU emission level, therefore, this results in an increase in emissions of 25 MtCO2eq relative to the NDC commitment. This leads to a total additional reduction of 5 MtCO2eq for the group of 25 cities. In summary, when taking into account different options for emission reductions by cities without reduction commitment, the range of additional reductions by the 25 largest cities is 5 to 30 MtCO2eq.
Table 5 Greenhouse gas emissions and reductions commitments for the 25 largest US cities 2010 2030 (MtCO2eq) Historical emissions (2010) BAU Reductions achieved by implementation of measures in 25 largest cities, compared to the BAU level Emission level after implementation of reduction commitments Emission level of cities if policies are implemented consistent with NDC Additional reductions to NDC Scenario 1 With reduction commitment 235 245 95 150 185 30 Without reduction commitment 110 115 30 85 85 0 Total 345 360 125 235 270 30 Scenario 2 With reduction commitment 235 245 95 150 185 30 Without reduction commitment 110 115 0 115 85 ‐25 Total 345 360 95 265 270 5
Next, to show the impact on greenhouse gas emissions in medium-sized US cities, we scaled the results for the 25 largest cities on the basis of the population sizes of the 200 largest cities. After scaling, the range of reductions additional to NDC reductions became -70 to +50 MtCO2eq (see Figure 2). Although 24 cities of the additional 175 cities have published
greenhouse gas reduction commitments on the NAZCA portal, no greenhouse gas inventories were readily available. 36 cities committed to emission reduction targets, together, represent 40% of the total population of the 200 cities.
Thus, BAU emission levels and emissions reductions could be determined for both groups (the 36 cities with and 164 cities without greenhouse gas reduction commitments). The 200 largest cities represent almost 25% of the US population, and the 36 cities with reduction commitments represent almost 10% (see Table 4). Therefore, more than two-thirds of the US cities with reduction commitments are represented in this study, as the 10% can be compared to 14% share of the total US population, represented by communities (including cities) that are carrying out emissions inventories and establishing emission reduction goals
(ICLEI and WWF, 2015). Note that, as the population share of the cities with greenhouse gas reduction commitments within the 200 cities is smaller than that of the 25 cities, the
reductions in addition to the NDC emission reductions, under the second scenario, are lower and even become negative (see Scenario 2 in Figure 2).
Figure 2 Reductions in addition to the NDC target, for the 200 largest US cities
* The NDC target for 2025 represents an average reduction of 27%, relative to 2005 levels (incl. LULUCF CO
2). It is assumed that
this target also applies to total greenhouse gas emissions, excluding LULUCF CO2. The 2030 target is based on extrapolation from
3 Interaction between national
and city climate action
The previous section showed a wide range of possible US city emission reductions in addition to the NDC target, possibly even leading to negative additional reductions. The factor driving this range is the uncertainty about the climate actions that can be expected from actors without any greenhouse gas reduction commitments. Questions such as: ‘is it possible to indicate when city climate action would result in emission reductions near the upper or lower level of this range?’ and ‘have countries accounted for city action in their NDC target or would that be in addition to their NDC target? Only a full ex-ante assessment of all national, sub-national, and non-state actors, with and without reduction commitments, could give a definite answer.
If only cities with greenhouse gas reduction commitments would be included in the analysis, as under Scenario 1, it is implicitly assumed that other cities would act according to the national NDC target. This will most likely result in a selection bias, as cities with greenhouse gas reduction commitments are more likely to have ambitious climate policies and cities without reduction commitment are more likely to implement climate measures that are even less ambitious than the NDC target. Above all, ambitious climate action in one city could result in increases in greenhouse gas emissions in other locations; for example, due to reallocating waste or power plants to locations outside city boundaries. This can be defined as national carbon leakage — leakage within national borders. Therefore, to assume an NDC-related climate ambition for cities without reduction commitment would be a very positive assumption. This would depend on the degree to which those cities are able to implement and enforce climate policies, independently from the US Federal Government? City reduction commitment is defined for all greenhouse gases emitted within city boundaries, but city authorities only have a direct influence on their own public operations. The remaining emission reductions should come from other actors, which means that companies located in cities and people living or working in one also need to take action themselves. Therefore, cities without reduction commitment could achieve reductions below their business-as-usual emission level, even if city authorities do not take action themselves. In other words, assuming that cities without reduction commitments would follow their BAU pathway is a conservative assumption. Thus, the two assumptions described in our assessment make up the likely range of reductions as shown in the previous section.
Finally, the question arises about the extent to which countries have included city action in their NDC target. “Better alignment between national mitigation targets and non-state and sub-national climate actions could help harness the full potential of climate action and have an impact on the overall ambition for the next round of NDCs” (Galvanizing the Groundswell of Climate Actions, 2016). Although this may change in the near future, currently, most countries have not explicitly included specific actor commitments in their NDC reduction targets. The NDC target is based on average climate action for the country as a whole, assuming some actors will do more than others. The extent to which this NDC target is actually achieved depends on the level of implementation by all actors (national government, sub-national authorities, companies and civil society). As government authorities are only able to have a direct impact on the greenhouse gases emitted from their own operations, most action need to come from sub-national authorities, companies and civil society. Therefore, ex-ante reductions in addition to the NDC target, on a national level, can only be revealed if the total in greenhouse gas reductions by all actors, also accounting for overlap, would be higher than the targeted NDC reduction. This implies the necessity of a full
assessment of all national, sub-national, and non-state actors, both with and without reduction commitments.
4 Discussion and conclusion
City climate action, in our assessment, is regarded as a combination of short- and long-term reduction commitments, together with strong implementation of policies, policy instruments and measures on the ground. We included greenhouse gas reduction commitments by the largest 25 US cities. Hence, other types of commitments, such as those relating to renewable energy, energy efficiency and finance, were not taken into account. Furthermore, we
assumed cities to fulfil their greenhouse gas reduction commitments, while the feasibility of their climate actions, plans and measures were not assessed. According to the UNEP report (UNEP, 2016), only a small, albeit increasing, number of initiatives are carrying out
monitoring, reporting and verification procedures, which are vital for assessing feasibility.
Therefore, this assessment can be seen as a first step towards full assessment of city climate action. This also holds for the assessment of any overlap between national and city reduction commitments. There may be overlap between the reduction commitments made on various government levels, and between the policies implemented to achieve these commitments. Overlap between policies could result in both increasing and decreasing effectiveness.
The question arising from this discussion is about the extent to which cities would be able to implement climate policies, independently from the US Federal Government. Federal
governments implement policies that impact all actors, also those within city boundaries. But what influence do city governments have themselves, with respect to emission reduction? The direct impact through government operations is relatively small. But to what extent can they influence emissions from transport, buildings, energy supply and the waste sector, within city boundaries? This depends on the direct power with regard to implementation and climate action governance of each city, which differs per country (C40 Cities and ARUP, 2015). ‘US cities, on average, score only moderately on power’ (ibid). Much transformative power also lies with US States. It should be noted that C40 cities are large cities, and larger cities are more likely to have the power to implement climate action. Even if they lack the constitutional power, large cities would be able to organise local stakeholders due to their organisational and financial capacity. In addition to focusing on any overlap between national government and non-state actors, it would also be important to investigate how to increase the effectiveness of the interaction between national and sub-national policies, on a country-by country basis.
To facilitate and improve the assessment of national and city policies and to estimate any overlap, especially in the context of UNFCCC climate commitments, two pathways need to be followed. First, the analysis should go beyond mere targets, and also include and compare city policy instruments and national policies. Second, to obtain a full picture of non-state action, tools such as integrated assessment models could be expanded to include various levels of governance, such as regional representation. This picture could include a differentiation between various types of commitments and policies, such as those on government operations, renewable energy, and energy efficiency.
This brings up the issue of data availability and accessibility. Hsu (2016) argues that such data sets on countries should be linked with NAZCA data. This is in line with our experience of data on city populations, greenhouse gas inventories and climate plans not being readily available. On top of that, information about city reduction commitment that was available on NAZCA was not easily accessible, making assessment of large numbers of cities very difficult. Such assessments including all actors, however, would be essential to provide a full picture of the expected impact of sub-national and non-state actors.
Notwithstanding these comments, this assessment gives a good indication of the impact of emission reductions on US greenhouse gas emissions in the 200 largest US cities, based on an assessment of the 25 largest US cities. The 25 US cities are projected to reduce between 95 and 125 MtCO2eq in greenhouse gas emissions, from a business-as-usual level of 360 MtCO2eq. This is between 5 and 30 MtCO2eq in additional reduction, on top of the national US NDC target. The greenhouse gas reduction commitments by the 200 largest cities are estimated to lead to between -70 and +50 MtCO2eq in emission reductions, in addition to the US NDC. This assessment led to the insight that a full assessment of all actors would be necessary, in order to determine the possible additionally of sub-national and non-state action to national NDCs.
REFERENCES
C40 Cities and ARUP (2015). Powering Climate Action: Cities as global changemakers,
https://issuu.com/c40cities/docs/powering_climate_action_full_report.
Chan S, Falkner R, Van Asselt H and Goldberg M. (2015). Strengthening non-state climate action: a progress assessment of commitments launched at the 2014 UN Climate Summit. London School of Economics, International Environmental Negotiations. Erickson P and Tempest K. (2014). Advancing climate ambition: How city-scale actions can
contribute to global climate goals. Stockholm Environmental Institute. Working paper. Fragkias M, Lobo J, Strumsky D and Seto KC (2013). Does size matter? Scaling of CO2
emissions and U.S. urban areas. PLOS One 8.
Galvanizing the Groudnswell of Climate Actions (2016). Relation between NDCs and cooperative, subnational and non-state action. Framework memorandom.
http://www.climategroundswell.org/blog-test/2016/6/21/framework-memo-on-relation-between-ndcs-and-cooperative-subnational-and-non-state-action.
Grant D, Bergstrand K and Running K. (2014). Effectiveness of US state policies in reducing CO2 emissions from power plants. Nature Climate Change, Vol. 4, pp. 977982.
Graichen J, Healy S, Siemons A, Höhne N, Kuramochi T, Gonzales-Zuñiga S, Sterl S, Kersting J and Wachsmuth J. (2016). International Climate Initiatives – a way forward to close the emissions gap? Initiatives’ potential and role under the Paris Agreement. Umwelt
Bundesamt.
Hsu A. (2016). Track climate pledges of cities and companies. Nature 532:303306.
ICLEI and WWF (2015). Measuring up 2015. How US cities are accelerating progress toward national climate goals.
http://icleiusa.org/citytalkusa-measuring-up/.
Kuramochi T, Hohne H, Gonzales-Zuniga S, Sterl S, Hagemann M, Hernandez Legaria E, Den Elzen M, Roelfsema M, Van Soest H, Forsell N and Turkovska O. (2016). Greenhouse gas mitigation scenarios for major emitting countries. Analysis of current climate policies and mitigation pledges (update: November 2016). New Climate Institute, Cologne.
UNFCCC (2016). Non-state actor zone for climate action, http://climateaction.unfccc.int/. retrieved in April 2016.
PBL (2014). Integrated Assessment of Global Environmental Change with Model description and policy applications IMAGE 3.0. PBL Netherlands Environmental Assessment Agency, The Hague.
Riahi K, van Vuuren DP, Kriegler E, Edmonds J, O’Neill BC, Fujimori S, Bauer N, Calvin K, Dellink R, Fricko O, Lutz W, Popp A, Cuaresma JC, Kc S, Leimbach M, Jiang L, Kram T, Rao S, Emmerling J, Ebi K, Hasegawa T, Havlik P, Humpenöder F, Da Silva LA, Smith S, Stehfest E, Bosetti V, Eom J, Gernaat D, Masui T, Rogelj J, Strefler J, Drouet L, Krey V, Luderer G, Harmsen M, Takahashi K, Baumstark L, Doelman JC, Kainuma M, Klimont Z, Marangoni G, Lotze-Campen H, Obersteiner M, Tabeau A and Tavoni M. (2016). The Shared Socioeconomic Pathways and their energy, land use, and greenhouse gas emissions implications: An overview. Global Environmental Change.
Roelfsema M, Harmsen M, Olivier JGJ and Hof A. (2015). Climate action outside the UNFCCC,
http://www.pbl.nl/en/publications/climate-action-outside-the-unfccc
.
Seto KC, Dhakal S, Bigio A, Blanco H, Delgado GC, Dewar D, Huang L, Inaba A, Kansal A, Lwasa S, McMahon JE, Müller DB, Murakami J, Nagendra H and Ramaswami A. (2014).
Human Settlements, Infrastructure and Spatial Planning. In: Climate Change 2014:
Mitigation of Climate Change. Contribution of Working Group III to the Fifth Assessment Report of the Intergovernmental Panel on Climate Change [Edenhofer, O., R. Pichs-Madruga, Y. Sokona, E. Farahani, S. Kadner, K. Seyboth, A. Adler, I. Baum, S. Brunner, P. Eickemeier, B. Kriemann, J. Savolainen, S. Schlömer, C. von Stechow, T. Zwickel and J.C. Minx (eds.)]. Cambridge University Press, Cambridge, United Kingdom and New York, NY.
Singh S and Kennedy C. (2015). Estimating future energy use and CO2 emissions of the
world's cities. Environmental Pollution 203:271278.
UNEP, UNEP Partnership UD (2014), Climate Initiatives Platform,
http://climateinitiativesplatform.org/index.php/Climate_Database:About
.
UNEP (2016). The Emissions Gap Report 2016. United Nations Environment Programme (UNEP), Nairobi.
US Government (2016). United States Mid-century strategy for deep decarbonization. The White House, Washington.
Van Vuuren DP, Kriegler E, O’Neill BC, Kristie LE, Riahi K Carter TR, Edmonds J, Hallegatte S, Kram T, Mathur R and Winkler H. (2014). A new scenario framework for Climate Change Research: scenario matrix architecture. Climatic Change 122:273.
Yale Data-driven (2016). Taking stock of global climate action.
http://datadriven.yale.edu/wp-content/uploads/2016/12/Data_Driven_Yale_Taking-Stock-of-Global-Climate-Action_Nov_2016_final.pdf.
APPENDIX - US CITY DATA
Greenhouse gas inventories on the 25 largest US cities
City
Source
New York
http://www1.nyc.gov/assets/sustainability/downloads/pdf/publications/NYC_GHG_Inventory_2014.pdf
Los Angeles
http://www.laregionalcollaborative.com/la‐county‐ghg‐inventory/
Chicago
https://www.cityofchicago.org/city/en/progs/env/2015‐chicago‐ghg‐emissions‐inventory.html
Houston
http://catee.tamu.edu/wp‐content/presentations/2009/Tsuda.pdf
Philadelphia
https://beta.phila.gov/media/20160429144916/2015‐citywide‐greenhouse‐gas‐emissions‐inventory‐for‐2012.pdf
Phoenix
San Antonio
https://sanantonio.legistar.com/View.ashx?M=F&ID=4669091&GUID=96E6C756‐208A‐41D9‐ABC7‐CF4392636AB7
San Diego
https://www.sandiego.gov/planning/genplan/cap
Dallas
http://greendallas.net/wp‐content/uploads/2015/12/GHG_EmissionsReport_Final2012.pdf
San Jose
https://www.sanjoseca.gov/DocumentCenter/View/55505
Austin
https://www.austintexas.gov/sites/default/files/files/Sustainability/Climate/Comm‐_GHG.pdf
Jacksonville
Indianapolis
San Francisco
https://data.sfgov.org/Energy‐and‐Environment/San‐Francisco‐Communitywide‐Greenhouse‐Gas‐Invento/btm4‐e4ak
Columbus
https://www.columbus.gov/getgreen/greenhouse‐gas‐inventory/
Fort Worth
Charlotte
http://charmeck.org/p2c/2lead/documents/final%20charlotte%20community%20ghg%20emissions%20inventory%20rpt.pdf
Detroit
El Paso
Memphis
Boston
https://www.cityofboston.gov/images_documents/Community%20GHG%20Inventory%202013_tcm3‐49977.pdf
Seattle
http://www.seattle.gov/Documents/Departments/OSE/Climate%20Docs/2014GHG%20inventorySept2016.pdf
Denver
https://www.denvergov.org/content/dam/denvergov/Portals/771/documents/Climate/CAP%20‐%20FINAL%20WEB.pdf
Washington
http://www.climateaction2016.org/
Nashville‐Davidson
https://www.nashville.gov/Portals/0/SiteContent/Sustainability/2009GreenhouseGasInventory.pdf
Business-as-usual projections for the 25 largest US cities
City
BAU
available
Source
New York
FALSE
http://www.nyc.gov/html/dep/pdf/climate/climate_complete.pdf
Los Angeles
TRUE
http://planning.lacounty.gov/assets/upl/project/ccap_final‐august2015.pdf
https://www.lamayor.org/plan
Chicago
FALSE
https://www.cityofchicago.org/city/en/progs/env/climateaction.html
Houston
FALSE
Philadelphia
FALSE
https://beta.phila.gov/departments/office‐of‐sustainability/publications/
Phoenix
FALSE
San Antonio
TRUE
https://sanantonio.legistar.com/View.ashx?M=F&ID=4669091&GUID=96E6C756‐208A‐
41D9‐ABC7‐CF4392636AB7
San Diego
TRUE
https://www.sandiego.gov/planning/genplan/cap
Dallas
TRUE
http://www.sanjoseca.gov/documentcenter/view/9388
San Jose
TRUE
http://www.sanjoseca.gov/documentcenter/view/9388
Austin
TRUE
http://austintexas.gov/page/climate‐change‐policies‐and‐plans
http://www.austintexas.gov/climate
Jacksonville
FALSE
Indianapolis
FALSE
San Francisco
TRUE
http://sfenvironment.org/cas
Fort Worth
FALSE
Charlotte
FALSE
Detroit
FALSE
El Paso
FALSE
Memphis
FALSE
Boston
FALSE
http://plan.greenovateboston.org/
Seattle
FALSE
http://www.seattle.gov/environment/climate‐change/climate‐action‐plan
Denver
FALSE
https://www.denvergov.org/content/dam/denvergov/Portals/771/documents/Climate/CAP%20‐%20FINAL%20WEB.pdf
Washington
FALSE
Greenhouse gas reduction commitments by the 25 largest US cities
City
Commitment Inventory BAU
GHG Coverage Coverage area
Base
Year 1
Target
year 1
Target
1
Base
Year 2
Target
year 2
Target
2
Population 2010
8New York
TRUE
TRUE
FALSE Total
Community‐wide
CO
2e
2005
2030
30%
2005
2050
80%
8,175,133
Los Angeles
TRUE
TRUE
FALSE Total
Community‐wide
CO
2e
1990
2025
45%
1990
3,792,621
Chicago
TRUE
TRUE
FALSE Total
Community‐wide
CO
2e
1990
2020
25%
1990
2050
80%
2,695,598
Houston
FALSE
TRUE
FALSE Total
Community‐wide
CO
2e
2,099,451
Philadelphia
TRUE
TRUE
FALSE Total
Community‐wide
CO
2e
1990
2035
45%
1990
2015
20%
1,547,607
Phoenix
FALSE
FALSE
FALSE Total
1,488,750
San Antonio
FALSE
FALSE
TRUE Total
1,327,407
San Diego
TRUE
TRUE
TRUE Total
Community‐wide
CO
2e
2010
2020
15%
2010
2035
50%
1,307,402
Dallas
FALSE
TRUE
TRUE Total
Community‐wide
CO
2e
1,197,816
San Jose
TRUE
TRUE
TRUE Total
Community‐wide
CO
2e
1990
2040
0%
945,942
Austin
TRUE
TRUE
TRUE Total
Community‐wide
CO
2e
2010
2050
90%
842,592
Jacksonville
FALSE
FALSE
FALSE
836,507
Indianapolis
FALSE
FALSE
FALSE
834,852
San Francisco
TRUE
TRUE
TRUE Total
Community‐wide
CO
2e
1990
2025
40%
1990
2050
80%
825,863