PART III:
TOTAL GREENHOUSE GAS
EMISSIONS
1. TRENDS IN GHG EMISSIONS
CO2 emissions from fuel combustion represent the majority of anthropogenic GHG emissions. However,
comprehensive analysis of emission trends considers other sources of CO2 as well as other gases, knowing
that data on gases and sources other than CO2 from fuel combustion are much more uncertain.
Country-specific estimates of CO2 from biomass burning and F-gas emissions are particularly difficult to ascertain.
To complement work regarding the emissions of CO2 from fuel combustion, the IEA choose to include the
EDGAR data on other CO2 sources and on five other greenhouse gases: CH4, N2O and the fluorinated gases
(or “F-gases”) HFCs, PFCs and SF6. These gases are addressed by the Kyoto Protocol.
The information in Part III (with the exception of CO2 emissions from fuel combustion) has been provided
by Jos G.J. Olivier from the PBL Netherlands Environmental Assessment Agency and Greet Janssens-Maenhout leading the EDGAR team of the Joint Research Centre (JRC) of the European Commission, using the EDGAR 4.2 FT2010 database developed jointly by JRC and PBL. Please see Chapter 2 for further de-tails on data sources and methodology.
Please note that the greenhouse gas emissions totals presented here will differ with those shown in countries’ official national greenhouse gas inventory submissions to the UNFCCC Secretariat. This is primarily due to differences in coverage for the category Other. However, differences also occur due to differences in alloca-tion, methodologies and underlying data sources for activities and emission factors, as specified in Part 3, Chapter 2: Sources and methods. Details on possible differences between IEA and UNFCCC CO2 emissions from fuel combustion estimates can be found in Part I, Chapter 1: IEA Emissions Estimates. Details on causes of differences in other GHG emission sources can be found in Part III, Chapter 2: Sources and methods.
Global and regional trends
Dominated by emissions related to fossil fuels, total emissions of all greenhouse gases - weighted by their GWP1 - increased by about 80% since 1970 (Fig-ure 1). Significant increases were observed for all gases: CO2, including large-scale biomass burning of
forests and biomass decay (107%); CH4 (47%), N2O
(43%), and the F-gases (about 700%).
Global total GHG emissions increased by 31% during the period 1990-2010, driven again by a 44% growth in CO2 emissions from fuel combustion. Over the
1. Global Warming Potential: see Box 1.
same period, although highly variable over time, CO2
emissions from biomass burning and post-burn decay – based on satellite observations – are assumed to have decreased by about 10% with CO2 from decay of
drained peatland increasing by 18%. Increases in CO2
emissions from cement production (120%), CH4
emis-sions from fossil fuel production (44%) and from waste (21%), N2O emissions from agriculture (20%),
and the F-gases (about 225%, mainly from HFC use) also contributed to the total increase. The F-gases doubled their share of global emissions from 1% in 1990 to 2% in 2010.
The picture varies significantly across regions and gases. In 2010, most methane emissions originated in non-Annex I regions such as Asia (42%), including China (21%), and Latin America (12%). Emissions from Annex I countries contributed 26% of total
emissions, with the largest contribution coming from the Annex I members of the Former Soviet Union (8%) and North America (8%).
For methane, emissions from animals and their waste dominate sources in Latin America and South Asia, while emissions from rice cultivation are common in South, East and Southeast Asia. Coal production emissions are concentrated in East Asia (mainly China), North America, and Other Europe and Eura-sia, while emissions from gas systems are concen-trated in the Former Soviet Union countries and North America. Methane from landfills stems mainly from Annex I countries, whereas methane emissions from wastewater disposal originate predominantly in non-Annex I countries.
Non-Annex I regions produced three-quarters of global nitrous oxide emissions in 2010: Asia (36%) including China (18%), Africa (19%) and Latin America (14%). N2O emissions from Annex I
countries contributed 27% to the global total, with most emissions originating in North America (11%) and OECD Europe (9%).
Of all N2O sources, animal waste emissions occur
predominantly in the non-Annex I regions of Latin America, Africa and South Asia; from fertiliser use is largest in East Asia (mainly China) and Latin America followed by North America, Annex II Europe and
South Asia (mainly India). N2O emissions from crop
production are largest in North America, Latin America, South Asia and East Asia. Industrial processes also emit significant volumes of N2O.
The shares of Annex I countries in total CH4 and total
N2O emissions (26% and 27% respectively) were
rela-tively low compared to their share in global CO2
emis-sions (38%).
In 2010, most fluorinated gas emissions originated in Annex I countries (66%), with North America contributing 38%, OECD Europe 13%, OECD Asia Oceania 9% and Other Europe and Eurasia 7%. Non Annex I countries contributed about 34% to global F-gas emissions.
Trends by gas
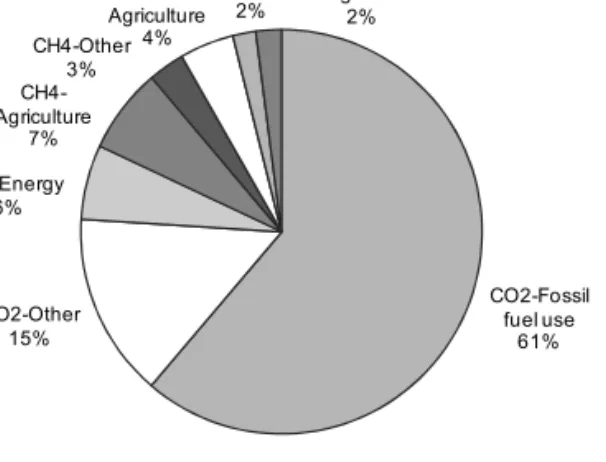
In 2010, CO2 contributed 76% of global GHG
emissions, CH4 about 16%, N2O about 6% and the
combined F-gases about 2% (Figure 2). The largest sources of GHG emissions were the energy sector (69%, mainly CO2 fossil fuel use), and agriculture
(11%, mainly CH4 and N2O). Other sources of
green-house gases were CO2 from biomass burning (10%,
mostly forest and peat fires and post-burn decay in
Figure 1. Global GHG emissions 1970-2010 GtCO2-eq.
Sources: IEA for CO2 from fuel combustion and JRC/PBL (2012) [EDGAR 4.2 FT2010] for all other sources.
0 5 10 15 20 25 30 35 40 45 50 1970 1975 1980 1985 1990 1995 2000 2005 2010
Drained peat decay and peat fires CO2 Forest fires CO2
Postburn decay CO2 and N2O
HFCs, PFCs, SF6
Other CO2, CH4 and N2O
Waste CH4
Agriculture N2O
Agriculture CH4
Industrial processes
Fossil fuel: fugitive and flaring
CO2 and non-CO2 from fossil fuel combustion
non-Annex I countries), and CO2 from cement
production (3%, of which 54% originated in China). Please note that emissions from forest and peat fires are highly variable over the years.
Figure 2. Global GHG emissions by gas/source in 2010
CO
2emission trends
Energy dominates the trend in CO2 emissions,
account-ing for 82% of the global total CO2 emissions in 2010
including non-energy uses. About 10 percentage points higher than in 1970, this share now varies between 90-99% in most Annex I countries. Within non-Annex I countries, the energy share in CO2 emissions varies more
widely. Indeed, in some African, Latin American and Asian countries, it can be lower than 10%.
Over the 1990-2010 period, total fossil fuel combus-tion emissions of CO2 increased about 45%
world-wide (by about 146% in non-Annex I countries while decreasing 3% in Annex I countries). Emissions from electricity and heat production and from road trans-port dominated global trends. Between 1990 and 2010, CO2 emissions from electricity and heat
produc-tion increased by 18% for Annex II countries and by 109% in the rest of the world. Over the same period, road transport emissions rose 23% in Annex II coun-tries and 124% in the other councoun-tries. By 2010, these two sectors together accounted for 58% of global total CO2 emissions from fuel combustion. The
introduc-tion at the beginning of this publicaintroduc-tion provides a more complete discussion of CO2 emissions in 2012
and the trends in energy-related CO2 emissions.
In 2010, the highly variable emissions from deforestation (i.e. forest fires) plus from decay of drained peatland accounted for about 7% of global CO2 emissions (or
about 13% including indirect CO2 emissions from
post-burn decay of remaining aboveground biomass). According to satellite observations the share of defor-estation in global emissions was about 18% in the
CO2-Fossil fuel use 61% CO2-Other 15% CH4-Energy 6% CH4-Agriculture 7% CH4-Other 3% N2O-Agriculture 4% N2O-Other 2% F-gas-All2%
Box 1: Global Warming Potential
The contribution of non-CO2 gases to total
emissions can be estimated by expressing the emissions of all the gases in CO2-equivalent
units. For a given gas, emissions expressed in mass are multiplied by its specific weighting factor, the Global Warming Potential (GWP). The GWP is an estimate of the relative contribution of a kilogramme of that gas to global radiative forcing, as compared to the same amount of CO2, integrated over a fixed
period of time (e.g. 100 years).
In this chapter we follow the UN Framework Convention on Climate Change (UNFCCC), that presently uses GWP values from the Second Assessment Report (SAR) of the Inter-governmental Panel on Climate Change (IPCC), for reporting total greenhouse gas emissions: 100-year GWPs of 21 for CH4, 310 for N2O and
23 900 for SF6. For the most common HFCs,
GWPs vary between 140 and 3 000 (1 300 for HFC-134a). For the by-product HFC-23, the GWP is 11 700. The GWPs for PFCs vary between 6 500 (CF4) to 9 200 (C2F6). These two
PFCs, the ones most commonly used, are also significant sources of by-product emissions. The GHG data in this chapter are all expressed in CO2-equivalents using these GWP values.
However, the Parties to the Climate Convention have decided to use for their emissions inventory reporting from 2015 onwards the updated GWP values from IPCC’s Fourth Assessment Report. These values give 19% more weight to CH4 with
a new GWP value of 25, whereas for N2O a 4%
lower value of 298 is used. For F-gases most GWP values have increased, e.g. by 10% for HFC-134a and by 26% for HFC-23.
In particular the new GWP value for CH4
impacts the total GHG emissions trend and the share of the sources. Using the new GWP values increases the share of total CH4 emissions
in 2010 by 2.5% points (from 15.8% to 18.3%) while the share of CO2 from fossil fuels
decreases by 1.6% points (from 61.2% to 59.6%).
1970s, 1980s and 1990s. Since 2000, however, this share has decreased due to rapidly increasing emissions from fossil fuel combustion. In 2010, CO2 emissions
from cement clinker production – excluding fossil fuel use – represented almost 4% of total emissions worldwide. Between 1990 and 2010, CO2 from
cement production increased by more than 150%.
CH
4emission trends
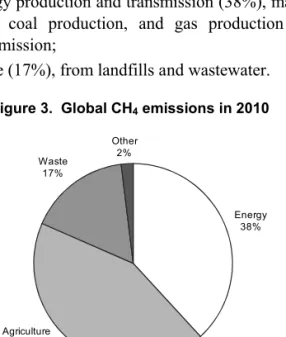
As seen in Figure 3, on an individual gas basis, the major global sources for methane (CH4) in 2010 were:
• agriculture (43%), mainly from enteric fermentation by animals and animal waste, from rice cultivation and from savannah burning;
• energy production and transmission (38%), mainly from coal production, and gas production and transmission;
• waste (17%), from landfills and wastewater.
Figure 3. Global CH4 emissions in 2010
Between 1970 and 2010, global methane emissions increased by almost half. In the 1970s emissions in-creased with an average growth rate of 1.3% per year. In the 1980s, this growth rate slowed down to an average 1.1% per year, determined mainly by growth of emissions in Other Europe and Eurasia from gas production and transmission and in East Asia from coal production (Figure 6). In addition, enteric fermen-tation by ruminants and waste and wastewater disposal contributed to the increased emissions, particularly in non-Annex I regions. Emissions from rice cultivation are estimated to have decreased due to changes in types of rice grown and to other organic amendment practices. Furthermore, coal production shifted to incorporate more surface mining, which releases much less methane than underground mines.
In the 1990s, an average decrease of 0.2% per year was observed. The economic decline of FSU countries in the early 1990s strongly influenced this global methane trend. Their emissions from coal production, from gas transmission and from animals (enteric fermentation) decreased substantially between 1990 and 1995. It should be stressed, however, that detailed statistics for this region are uncertain over this period. Despite the overall decline in the 1990s, increases were observed regionally: from gas production (particularly in the Middle East and North America), from waste handling (landfills in Latin America and wastewater in South Asia), from large-scale biomass burning in developing countries and from coal production in China. These increases were partially offset by decreases in fugitive emissions from coal production and CH4 emissions from animals in EIT
countries.
Since 2000, emissions started increasing again, with an average growth rate of 1.9% per year, which has meant that since 2002, the emissions increased faster than in the last four decades. This led to a global in-crease of about 20% over the period 2000-2010, driven by increased coal mining by the top methane-emitting country China (+50%) and increased cattle numbers in Brazil (+23%).
Between 1990 and 2010, country-specific trends of activity data and emission factors lead to an increase of global total methane emissions of about 17%. Dur-ing this period, emissions in non-Annex I countries increased about 38%, with the largest absolute growth occurring in Asia and Africa. Emissions in Annex I countries decreased by 18%, mainly driven by the countries of the Former Soviet Union. Annex II emissions as a whole decreased over the same period by 16% and OECD Europe decreased by about 21%, mainly as a result of the policies of the United Kingdom and Germany, which reduced coal production and increased methane recovery from coal mines, entailing emission reductions of about 50%. In North America and OECD Europe, methane emissions from landfills also decreased by about 50% due to enhanced waste separation and methane recovery.
N
2O emission trends
For nitrous oxide (N2O), agriculture contributed
70% of emissions in 2010, mainly from synthetic fertilisers and animal waste dropped on soils (either as animal manure or by animals during grazing) and agricultural waste burning (Figure 4). A much smaller
Energy 38% Agriculture 43% Waste 17% Other 2%
source is fuel combustion (9%, mainly from coal, fuelwood and road transport). Another small source is N2O from industrial processes (4%), mostly in
Annex I countries.
Figure 4. Global N2O emissions
in 2010
Between 1970 and 2010, global emissions of N2O
increased by about 43%. Increased use since the 1970s of synthetic fertilisers and manure from live-stock caused agricultural emissions in South Asia and East Asia to increase on average by 3-4% annually. These regional emission trends continued into the 2000s (Figure 7). Emissions from Latin America and Africa also increased in the 1990s, predominantly from the same sources and from forest fires.
In contrast, N2O emissions from industrial processes
decreased by 40% during the 1980s. This decrease resulted from the gradual upgrade of global produc-tion facilities for nitric acid. By 1990 about 20% of the facilities were equipped for non-selective catalytic reduction limiting NOx emissions while
simultane-ously reducing N2O emissions.
During the 1970s, North America and Japan intro-duced catalytic converters in gasoline-fired cars to reduce emissions of precursors of tropospheric ozone, but with higher N2O emissions as a side effect. Since
the 1990s this technology was also introduced in Europe and Australia. Until about 2000 the catalytic converters contributed to the increase in N2O
emis-sions in these countries, though in the late 1990s newer types were introduced with lower specific N2O
emissions.
In the period 1990-2010, global N2O emissions are
estimated to have increased by about 10%. The three-quarter reduction in industrial emissions from adipic
acid manufacturing particularly limited this increase. Over this period, emissions in non-Annex I countries increased by over 35%, mainly in the agricultural sector in South Asia, East Asia and Latin America. The in-crease was partially offset by decreasing emissions in the non-Annex I members of the Former Soviet Union countries (-24%) and, to a lesser extent, in other EIT countries. In OECD Europe, N2O decreased by almost
29% since 1990, mainly due to emission abatement in the chemical industry and to a decrease in the use of nitrogen fertilisers.
When considering these trends, the reader should bear in mind that the uncertainties in annual emissions of most sources of N2O are very large, e.g. the uncertainty
for agricultural sources may sometimes exceed 100%.
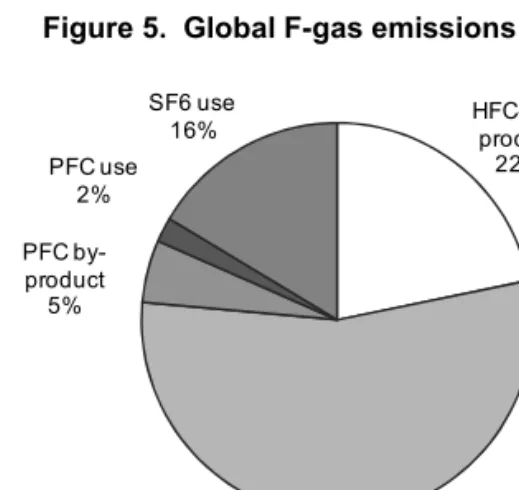
HFC, PFC and SF
6emission trends
For the fluorinated gases (Figure 5), emissions are split between “use” and “by-products” because of the different ways they are produced. HFC use repre-sented 55% of the total in 2010, of which HFC 134a alone represented 42%. Total by-product emissions of HFC contributed 22% and by-product emissions of PFCs another 5%. SF6 use represented 16%, while
PFC use represented the remaining 2%. Most F-gas emissions are emitted by Annex I countries.
Figure 5. Global F-gas emissions in 2010
Between 1990 and 2010, the estimated emissions of F-gases increased by about 225%, mainly due to an increase in HFC emissions: emissions of HFC in 2010 were about 9 times higher than in 1990. During the same period, PFCs emissions decreased by about 35% while SF6 emissions increased by about 45%. Annex I
regions experienced large growth in F-gas emissions, with regional increases on the order of 125% except for North America which showed an increase of over
Energy 9% Agriculture 70% Industrial Processes 4% Other 17% HFC- by-product 22% HFC use 55% PFC by-product 5% PFC use 2% SF6 use 16%
250%. On a regional basis, total F-gas emission trends varied between 10% and 1500% for the non-Annex I regions, with the largest absolute increases coming from East Asia, driven by a fifteen-fold increase in China, which is here included in East Asia.
Since 1995, global F-gas emissions have increased more rapidly. The increase in HFC emissions (4.5 times higher) more than offset a 30% reduction in PFCs emissions. The small reductions in global SF6 emissions observed in the period 1996-2004
were mainly due to reductions in emissions from manufacture and use of switchgear for the electricity
sector. The large reduction in PFC emissions in the last years is due to the phasing-out of old Søderberg technology for aluminium production in China. Global emissions of HFCs other than HFC-134a now exceed emissions of HFC-134a, widely used for refrigeration and air-conditioning.
When considering these trends, one should note that the uncertainties in annual emissions of most sources of F-gases are very large, e.g. at a country level they may well exceed 100%. Therefore, the figures provided for individual countries should be consid-ered solely as order-of-magnitude estimates.
2. SOURCES AND METHODS
The information in Part III (with the exception of CO2
emissions from fossil fuel combustion) has been provided by Jos G.J. Olivier from PBL and Greet Janssens-Maenhout based on the EDGAR 4.2 FT2010 dataset. PBL and JRC are responsible for the calculation of the EDGAR 4.2 FT2010 data.
General note on EDGAR
Version 4 of the Emission Database for Global Atmospheric Research, in short the EDGAR 4 system, has been developed jointly by the European Commission’s Joint Research Centre (JRC) and the PBL Netherlands Environmental Assessment Agency. EDGAR is providing global anthropogenic emissions of greenhouse gases CO2, CH4, N2O, HFCs, PFCs and
SF6 and of precursor gases and air pollutants CO,
NOx, NMVOC, SO2 and the aerosols BC/OC, per
source category, both at country/region levels as well as on a 0.1x0.1 degree grid online to its large community of users and even for the IPCC Fifth Assessment Report (Working Group III).
Activity data were mostly taken from international statistical sources and emission factors for greenhouse gases were selected mostly from the 2006 IPCC Guidelines for National Greenhouse Gas Inventories (IPCC, 2006) to ensure a consistent approach across countries. JRC and PBL have made all reasonable efforts to ensure that the information was generated correctly, but it is the responsibility of the EDGAR consortium to modify activity data when required to arrive at complete time series and for selecting the emission factors. It is stressed that the uncertainty in the resulting dataset at national level may be substantial, especially for methane and nitrous oxide, and even more so for the F-gases. The uncertainty is caused by the limited accuracy of international activity data used and in particular of emission factors selected for calculating emissions on a country level (Olivier,
2002; Olivier et al., 2005). However, since the methods used are either IPCC methodologies or comparable to them (see below), global totals comply with budgets used in atmospheric studies, plus the data were based on international information sources, this dataset provides a sound basis for comparability. The EDGAR 4.2 Fast Track 2010 (FT 2010) dataset was further extended in time by adding emissions for 2011 and 2012. For the GHG update, the impact of clean development mechanism projects in developing countries to reduce CH4, N2O and HFC-23 emissions
was taken into account. This applies to sources such as coal mines and landfills (CH4 recovery), nitric acid
and adipic acid production (N2O) and the production
of HCFC-22 (HFC-23), which now start to influence significantly global emission trends. In addition, a few errors found in the dataset have been corrected. Although this dataset has been constructed with great care, JRC and PBL do not accept any liability from use of the data provided in this report including any inaccuracies or omissions in the data provided. For details on uncertainty and caveats identified in the dataset, as well as more detailed source category estimates, we refer users to the EDGAR 4 website at edgar.jrc.ec.europa.eu. Note that preliminary estimates for other more recent years than 2010 will be made publicly available through this website. Preliminary global trends of GHG emissions will also be made available at PBL (2014). For CO2 emissions through to
2013 please refer to Olivier et al. (2014).
Source definitions
For carbon dioxide:
Fuel combustion refers to fossil fuel combustion and the unstored fraction of non-energy/feedstock use (IPCC Source/Sink Category 1A) estimated using the
IPCC Sectoral Approach from the Revised 1996 IPCC Guidelines (see Part I).
Fugitive refers to flaring of associated gas in oil and gas production (in some cases including indirect CO2 from
methane venting) (IPCC Source/Sink Category 1B). Industrial Processes refers to production of cement, lime, soda ash, carbides, ammonia, methanol, ethylene and other chemicals, metals and to the use of soda ash, limestone and dolomite, and non-energy use of lubricants and waxes (IPCC Source/Sink Category 2). However, from EDGAR 4.1, only emissions from production of cement, lime and soda ash and from the use of soda ash, limestone and dolomite are included here, since all others were estimated by the IEA and reported under ‘Fuel combustion’.
Other refers to direct emissions from forest fires and peat fires plus emissions from decay (decomposition) of aboveground biomass that remains after logging and deforestation and emissions from peat fires and decay of drained peat soils (IPCC Source/Sink Category 5). CO2 from solvent use (IPCC Source/Sink
Category 3), application of agricultural lime (IPCC Source/Sink Category 4) and from fossil fuel fires, notably coal fires and the Kuwait oil fires (IPCC Source/Sink Category 7), is also included here.
For methane:
Energy comprises production, handling, transmission and combustion of fossil fuels and biofuels (IPCC Source/Sink Categories 1A and 1B).
Agriculture comprises animals, animal waste, rice production, agricultural waste burning (non-energy, on-site) and savannah burning (IPCC Source/Sink Category 4).
Waste comprises landfills, wastewater treatment, hu-man wastewater disposal and waste incineration (non-energy) (IPCC Source/Sink Category 6).
Others includes industrial process emissions such as methanol production, forest and peat fires and other vegetation fires (IPCC Source/Sink Categories 2 and 5).
For nitrous oxide:
Energy comprises combustion of fossil fuels and bio-fuels (IPCC Source/Sink Categories 1A and 1B). Agriculture comprises fertiliser use (synthetic and animal manure), animal waste management, agricul-tural waste burning (non-energy, on-site) and savan-nah burning (IPCC Source/Sink Category 4).
Industrial Processes comprises non-combustion emis-sions from manufacturing of adipic acid, nitric
acid, caprolactam and glyoxal (IPCC Source/Sink Category 2).
Others includes N2O usage, forest and peat fires
(including post-burn emissions from remaining biomass) and other vegetation fires, human sewage discharge and waste incineration (non-energy) and indirect N2O from atmospheric deposition of NOx and
NH3 from non-agricultural sources (IPCC Source/Sink
Categories 3, 5, 6 and 7).
For fluorinated gases:
HFC emissions comprise by-product emissions of HFC-23 from HCFC-22 manufacture and the use of HFCs (IPCC Source/Sink Categories 2E and 2F). PFC emissions comprise by-product emissions of CF4
and C2F6 from primary aluminium production and the
use of PFCs, in particular for the manufacture of semiconductors, flat panel displays and photovoltaic cells (IPCC Source/Sink Categories 2C, 2E and 2F). SF6 emissions stem from various sources of SF6 use,
of which the largest is the use and manufacture of Gas Insulated Switchgear (GIS) used in the electricity dis-tribution networks (IPCC Source/Sink Categories 2C and 2F) and from SF6 production (Category 2E).
Data sources and
methodology for
EDGAR 4.2 FT2010
The EDGAR 4.2 Fast Track 2010 (EDGAR 4.2 FT2010) has been available online since October 20132. For greenhouse gases the default emission fac-tors from the 2006 IPCC Guidelines (IPCC, 2006) were used instead of those of the Revised 1996 IPCC Guidelines (IPCC, 1997), except for CH4 and N2O
from road transport where technology-specific factors were used from the EMEP-EEA emission inventory guidebook (EEA, 2009).
EDGAR 4.2 FT2010 provides an extended time series for all sources by adding emissions for 2009 and 2010 to the EDGAR4.2 dataset (1970-2008). For the Fast Track estimates for 2009 and 2010, for the main sources of each greenhouse gas as proxy of the emissions trend in these years, either the official national reported emissions trend from UNFCCC (2012) was used, or the trend in the latest activity
data for 2008 to 2010, or statistics for an activity that was assumed to be a good proxy for that source. These statistics were sectoral CO2 emissions (IEA,
this publication), fossil-fuel production (IEA, 2012), gas flaring (NOAA/NCDC, 2012), production of steel, aluminium, cement, lime and ammonia (USGS, 2012; WSA, 2012), animal numbers, crop production and nitrogen fertiliser consumption (FAO, 2012), large-scale biomass burning (GFED 3; Van der Werf et al., 2010), photovoltaic solar cell production and flat panel display sales (IEA, 2011; and others). For small-scale sources, such as industrial process sources of methane and nitrous oxide from caprolac-tam production, linear extrapolation of the past trend from 2005 to 2008 was assumed. These proxies – sometimes adjusted to incorporate significant trends in the emission factors – were applied to most sources, comprising more than 95% of the global total for gas. For important sources, where significant trends in the technology mix or in the application rate of emission control technology had occurred, trend estimates were included. In all other cases the mix and fraction of end-of-pipe abatement technology has been left unchanged after 2008.
To take into account non-CO2 emission reductions that
have occurred due to control measures implemented since 1990, officially reported emissions were used for Annex I countries (mainly countries that were already members of the OECD in 1990). These emission trends have been taken from the CRF emission data files which make up part of the National Inventory Reports (NIR) to the UNFCCC (UNFCCC, 2008, 2010, 2012). In addition, for non-CO2 emission reductions in
devel-oping countries up to 2010, we used information on so-called clean development mechanism (CDM) projects that have been implemented according to the “CDM pipeline” database maintained by the UNEP-Risø Cen-tre (2011). This was done for methane recovery from coal mining and landfills, N2O abatement in industrial
processes and HFC-23 emission reductions from HCFC-22 manufacture.
Methods and data applied for all years except 2009 and 2010 are described below.
Energy / Fugitive / Biofuel
The data sources for fugitive CO2 emissions and CH4
and N2O from energy are listed below. Data for
fossil fuel production and use for 138 countries were taken from the IEA energy statistics for OECD and Non-OECD countries 1970-2008 (extended energy balances, in energy units) (IEA, 2007, 2010). This dataset comprises 94 sectors and 64 fuel types. For the
countries of the Former Soviet Union and Former Yugoslavia a modified dataset was used to achieve a complete time series for the new countries from 1970 to 2008, the sum of which converges to the older data-set for the total Former Soviet Union and Yugoslavia. For another 62 countries, the aggregated IEA data for the regions ‘Other America’, ‘Other Africa’ and ‘Other Asia’ have been split using the sectoral IEA data per region together with total production and consumption figures per country of coal, gas and oil from energy statistics reported by the US Energy Information Administration (EIA, 2007, 2010).
Please note that the figures of CO2 from fuel
combus-tion and non-energy use of fuels in this report differ somewhat from the EDGAR 4.2 FT2010 dataset, for the following reasons:
• IEA energy statistics used for 1970-2008 may dif-fer slightly due to revisions included in subsequent IEA releases. For EDGAR 4.2 FT2010 the releases of 2007 and 2010 were used for 1970-1999 and 2000-2008, respectively (IEA, 2007, 2010);
• the IEA uses the default CO2 emission factors
from the Revised 1996 IPCC Guidelines, which differ slightly due to different default oxidation factors (coal updated value +2%, oil products +1%, natural gas +0.5%) and updated defaults for carbon content for some fuels, the quality of which may vary considerably (mainly refinery gas, up-dated value -7%, coke oven gas -7%, blast furnace gas +7%, coke -1%);
• the IEA estimates CO2 emissions from carbon
released in fossil fuel use labelled in the sectoral energy balance as ‘non-energy use’ or ‘chemical feedstock’ using default fractions stored. For EDGAR 4.2 FT2010, for 1970-2008 default emis-sion factors and methods from the 2006 IPCC Guidelines were applied, which may give rise to considerable differences compared to the 1996 guidelines.
In addition, subtraction of the non-energy/feedstock fuel use part of the EDGAR 4.2 FT2010 dataset in order to combine it with the IEA CO2 dataset also
in-troduces some uncertainty.
To estimate CH4 emissions from fossil fuel production
and transmission, hard coal and brown coal produc-tion data have been separated into surface and under-ground mining based on various national reports. For gas transport and distribution, pipeline length was used as activity data. Pipeline length and material sta-tistics are taken from reports on Europe by Eurogas and Marcogaz, national reports (e.g. the United States
and Canada), UNFCCC (2008) and supplemental data from CIA (2008). Total amounts of natural gas flared (sometimes including gas vented) for most countries for 1994 onwards are primarily based on amounts of gas flared determined from the satellite observations of the intensity of flaring lights (Elvidge et al., 2009), reported by NOAA (2011). For other years before 1994 and for other countries emissions or emissions trends were supplemented by CO2 trends from
CDIAC (Marland et al., 2006), EIA (2011) and UNFCCC (2010).
Biofuel data were also taken from IEA (2007).
How-ever, to avoid incomplete time series for large sectors, solid biomass consumption in the residential and commercial sectors in non-OECD countries were re-placed by fuelwood and charcoal consumption from FAO (2007). Vegetal waste used as fuel is based on the amounts of crop residues per country and fractions used as fuel based on Yevich and Logan (2003) and IPCC (2006). The amount of dung used as fuel is based on the total amount of manure produced per country and the fraction of total manure burned as fuel with fractions from IPCC (2006) and UNFCCC (2008). The results are rather close to the work of Fernandes et al. (2007) who made an extensive analysis of global and regional biofuel use in 2000. Charcoal production data were taken from IEA (2010) and sup-plemented or extrapolated using data from UN (2010) for 1990-2005 and FAO (2010) for pre-1990 data and 49 more countries not included in the IEA dataset. Emission factors for fossil fuel production and use are based on the default values in the 2006 IPCC Guide-lines (IPCC, 2006). Methane emission factors for coal mining are based on average depths of coal produc-tion based on CIAB (1994), EURACOAL (2008), Kirchgessner et al. (1993) and include post mining emissions. Methane recovery from coal mining was included for twelve countries amounting to about 1.3 Tg in 1990 (of which about one-third was allocated to the United States and Germany). Recov-ery in 2005 was estimated at 2.8 Tg (of which 50% in China and 25% in the United States (UNFCCC, 2010; Thakur et al., 1994, 1996; EPA, 2008; Cheng et al., 2011).
Emission factors for oil and gas production, transport and distribution were taken from IPCC (2006), sup-plemented with data from UNFCCC (2008), except for the emission factor for CH4 from oil tanker
transport which is from Rudd and Hill (2001). The CH4 emission factor for venting and flaring has been
derived from country-specific data reported to UNFCCC (2010), with the average value used as
global default, applied to all other countries. The CO2
emission factor excludes the indirect emissions through gas venting.
For N2O from gasoline cars in road transport, the
frac-tion of cars equipped with different types of catalytic converters was taken into account (based on various references). The factors for biofuel combustion were taken from the 2006 IPCC Guidelines. For charcoal production the emissions factors are from Andreae (2011).
Industrial processes
Production data for the CO2 sources cement, iron and
steel, non-ferrous metals and various chemicals were based on UN Industrial Commodity Statistics (UN, 2006a), often supplemented for recent years by data from the US Geological Survey (USGS, 2007). The same method applied to paper, wine, beer and bread production. Data for other CO2 sources such as
production of lime, soda ash, ammonia, ferroalloys and non-ferrous metals were from USGS (2007, 2010), supplemented by data reported to the UNFCCC (2010). IFA (2007) was used for urea pro-duction (where it is assumed that the fossil carbon in CO2 from ammonia production is stored) and FAO
(2007) for production of pulp, meat and poultry. Iron and steel production was further split into technolo-gies (basic oxygen furnace, open hearth, electric arc furnace) using data from WSA (2010).
For the N2O sources nitric acid, adipic acid and
caprolactam, production data are based on UNFCCC (2010) and on smoothed and averaged SRIC (2005) data. For other industrial production for which no in-ternational statistics were available, such as silicon carbide and glyoxal, UNFCCC (2010) was used, though limited to Annex I countries.
However, for many countries interpolations and extrapolations were necessary to arrive at complete time series per country for 1970-2005/2008. Special attention had to be given to new EIT countries, in particular to Former Soviet Union and Former Yugoslavia countries, to maintain consistency with the older totals for the former countries.
Emission factors for CO2, CH4 and N2O are described
in IPCC (2006). Note that emissions of CO2 from
cement production are only a proxy for cement clinker production. The N2O emission factors for the
production of adipic acid, nitric acid, caprolactam and glyoxal are based on IPCC (2006). For adipic acid, abatement is only assumed from 1990 onwards if indicated in UNFCCC (2010) combined with
activity data from SRIC (2005). For nitric acid in 1970, all old technology is assumed, changing their technology towards 1990 into high pressure plants in non-Annex I countries and a mix of low and medium pressure plants in Annex I countries that matches reported emissions in UNFCCC (2010). In addition, about 20% of global total production, all in Annex II countries, is equipped with Non-Selective Catalytic Reduction (NSCR) technology (Choe et al., 1993). The emission factors for the F-gases as by-product emissions were based on IPCC (2006), but modified to match global emissions to observations of atmos-pheric concentrations.
Global annual total production of HCFC-22 was taken from AFEAS (2008) and McCulloch and Lindley (2007) and included captive production, but was modified using UNFCCC (2010) and other data sources. Primary aluminium production statistics per country from UN (2006a) were combined with smelter types characterised by one of five technologies accord-ing to Aluminium Verlag (2007) and Hunt (2004) for China. The default emission factor for HFC-23 from HCFC-22 manufacture was set for non-OECD coun-tries at the IPCC default for old, un-optimised plants and for OECD countries at a somewhat lower and which decreased over time to reflect atmospheric con-centrations. Country-specific fractions of emission abatement were estimated for six Annex II countries based on reported emissions in UNFCCC (2010) and UNEP Risø Centre (2011) for other countries. For aluminium production the CF4 emission factors per
technology were based on large-survey factors for 1990 to 2002 reported by IAI (2006, 2008), but with modifications for Söderberg technologies to comply with atmospheric concentration trends, and for C2F6
based on the ratio to CF4 reported in IPCC (2006) for
default Tier 2 emission factors.
Global consumption of HFC-125, 134a (in three ap-plications) and 143a was taken from AFEAS (2008), for HFC-152a, 227ea, 245fa, 32 and 365mfc from Ashford et al. (2004) and for HFC-23, 236fa and 43-10-mee from UNFCCC (2008). Global HFC con-sumption was distributed to countries according to their share in global CFC-12 or CFC-11 consumption (ODP consumption statistics from the UN Ozone Se-cretariat) depending on their characteristics (either mostly for refrigeration/air-conditioning or mostly for other applications, largely foams/aerosols) and cali-brated to regional totals calculated by Ashford et al. (2004)). Global emission factors for HFC use were derived from the emissions also reported by these data sources, except for HFC-125 and 143a which were from Ashford et al. (2004).
Global consumption data of PFCs (and SF6) for
semi-conductor manufacture for Annex I countries in 1990 to 2005 were based on UNFCCC (2008) and the Na-tional Inventory Report 2008 of Japan, for Taiwan on Lu (2006) and for other non-Annex I countries for 1995 and 2005 based on their global share in semi-conductor manufacture (SEMI, 1998; SEMI, 2009). The trend from 1982 to 2005 of PFC use within four regions/countries (the United States, Japan, Europe and Rest of the World) was estimated from world market sales (SIA, 2006). Global CF4 and SF6
con-sumption and concon-sumption in Taiwan for the produc-tion of flat panel displays for 2003 is from Lu (2006); trends and market shares per country from SEMI (2007). National consumption of PFCs for PV cells is based on the production per country of PV systems in m2 (estimated from production statistics in MW for 1985-2003: Kammen, 2005; and for 1990, 1995, 2000-2007: Jäger-Waldau, 2008). The emission fac-tors are from IPCC (2006), for semiconducfac-tors and FPD using the Tier 2a factors and for PV production taking into account the fraction of thin film production per country and assuming that 50% of the manufac-turers uses PFCs. PFC consumption for other PFC uses was based on data for PFC use in fire extinguish-ing and air-conditionextinguish-ing, together with use as solvent reported by a few Annex I countries (UNFCCC, 2008), extrapolated to all Annex I countries and as-suming an emission factor of 1.
Global consumption of SF6 per application was taken
from Knopman and Smythe (2007). For SF6 containing
switchgear, equipment manufacture and utility stock estimates were adjusted using the method in Mais and Brenninkmeijer (1998) with the regional and per coun-try distribution based on various references (e.g. Mais and Brenninkmeijer, 1998; Bitsch, 1998, personal communication) and for missing countries and years based on the trend in the increase of electricity con-sumption as a proxy for GIS stock additions. For pri-mary magnesium production and diecasting global consumption was distributed using production statistics from USGS (2007) and IMA (1999a,b) and others for the number of diecasting companies per country. Other sources were distributed as follows: sport shoes among Annex I countries based on GDP, tyres according to reported consumption in Germany (UNFCCC, 2008), sound insulating windows mainly in Germany with 10% used in neighbouring countries, aluminium pro-duction as reported in UNFCCC (2010), accelerators were distributed according to the number of high-energy physics laboratories and miscellaneous sources according to the number of airborne early warning sys-tems such as AWACs. A major revision was made to
soundproof window production and small revisions to other sources, partly based on UNFCCC (2010). Note that both the variables for distributing global total consumption per source category and the emis-sion factors vary widely between different plants and countries. This implies that the estimated emissions of F-gases at country level should be considered as very uncertain (an order of magnitude).
Please note that CO2 from fossil carbon accounted for
in this sector (such as from ammonia and carbide pro-duction, iron and steel production using a blast fur-nace and metal production through smelting processes with carbon anode consumption) and CO2 from urea
application in agriculture have been subtracted from the EDGAR 4.2 FT2010 data. This avoids double counting compared with the IEA CO2 dataset for fuel
combustion that includes these emissions (see section on Energy).
Solvent and other product use
For N2O from the use of anaesthesia, an amount of
24 gN2O and 34 gN2O per capita in 2000 was used for
EIT and Annex II countries, respectively, based on the average values in UNFCCC (2010) and tentatively set at 5 g/cap/year for non-Annex I countries, based on Kroeze (1994). A global declining rate of 20% be-tween 1990 and 2005 was assumed as observed for total Annex I countries.
For N2O from aerosol spray cans, an amount of
10 gN2O per capita in 2000 was used for Annex I
countries based on the average values in UNFCCC (2010), and none for non-Annex I countries. A uni-form inclining rate from 1990 to 2005 of 50% was assumed as observed for total Annex I countries.
Agriculture
In general, the IPCC (2006) methodology and new default emission factors for CO2, CH4 and N2O were
used to estimate agricultural emissions, except for the instances specified below. Please note that N2O
emis-sions from agriculture as reported in EDGAR 4.2 FT2010 are substantially lower than those presently reported by most Annex I countries due to two mark-edly lower emission factors: 1) the default IPCC emission factor (“EF1”) for direct soil emissions of N2O from the use of synthetic fertilisers, manure used
as fertiliser and from crop residues left in the field has been reduced by 20%; and 2) the default emission factor (“EF5”) for indirect N2O emissions from
nitro-gen leaching and run-off been reduced by 70% com-pared to the values recommended in the 1996 IPCC
Guidelines and the IPCC Good Practice Guidance (IPCC, 1997, 2000).
Livestock numbers were taken from FAO (2007, 2010). For enteric fermentation by cattle, country-specific methane emission factors were calculated following the IPCC methodology (IPCC, 2006) using country-specific milk yield (dairy cattle) and carcass weight (other cattle) trends from FAO (2007) to esti-mate the trends in the emission factors. For other ani-mal types, regional emission factors from IPCC (2006) were used.
Livestock numbers were combined with estimates for animal waste generated per head to estimate the total amount of animal waste generated. Nitrogen excretion rates for cattle, pigs and chickenin Europe were based on the CAPRI model (Pérez, 2005; Britz, 2005; Leip et al., 2007) and for all other countries and animal types in IPCC (2006), The trend in carcass weight was used to determine the development in nitrogen excre-tion over time. The shares of different animal waste management systems were based on regional defaults provided in IPCC (2006) and regional trend estimates for diary and non-dairy cattle for the fractions stall-fed, extensive grazing and mixed systems from Bouwman et al. (2005). Methane emissions from ma-nure management were estimated by applying default IPCC emission factors for each country and tempera-ture zone. For the latter, the 1x1 degree grid map for non-dairy cattle from Lerner et al. (1988) was used and the annual average temperature per grid cell from New et al. (1999) to calculate the livestock fractions of the countries in 19 annual mean temperature zones for cattle, swine and buffalo and three climates zones for other animals (cold, temperate, warm). N2O emissions
from manure management were based on distribution of manure management systems from Annex I coun-tries reporting to the UNFCCC (2008), Zhou et al. (2007) for China and IPCC (2006) for the rest of the countries.
The total area for rice cultivation was obtained from FAO (2007, 2010), which was split over different ecology types (rainfed, irrigated, deep water and up-land) using IRRI (2007). The total harvested area of rice production in China was increased by 40%, due to recognition that official harvested rice area statis-tics for China largely underestimate the actual area (Denier van der Gon, 1999; 2000; personal communi-cation, 2000). However, methane emission factors were not taken from IPCC (2006) but from a review of Neue (1997), and country-specific studies by Mitra et al. (2004), Gupta et al. (2002) and IIASA (2007). For the period 1970-2000 a trend in the emission
factors was assumed based on data from Denier van der Gon (1999, 2000).
The same data as described above for manure man-agement were used to estimate N2O emissions from
the use of animal waste as fertilizer by taking into account the loss of nitrogen that occurs from manure management systems before manure is applied to soils and additional nitrogen introduced by bedding mate-rial. N2O emissions from fertilizer use and CO2 from
urea fertilization were estimated based on IFA (2007) and FAO (2007) statistics and emission factors from IPCC (2006).
CO2 emissions from liming of soils were estimated
from Annex I country reports to the UNFCCC (2010), and on the use of ammonium fertilizers for other countries (FAO, 2007e) as liming is needed to balance the acidity caused by ammonium fertilizers.
Areas of cultivated histosols were estimated by com-bining three different maps: the FAO climate map and soil map (FAO Geonetwork, 2007) and the land use map of Goldewijk et al. (2007). However, where available areas reported by Annex I countries to the UNFCCC (2008) were used. Separate N2O emission
factors were applied for tropical and non-tropical re-gions (IPCC, 2006).
Nitrogen and dry-matter content of agricultural resi-dues were estimated based on cultivation area and yield for 24 crop types from FAO (2007) and IPCC (2006) factors. The fractions of crop residues removed from and burned in the field were estimated using data of Yevich and Logan (2003) and UNFCCC (2008) for fractions burned in the field by Annex I countries. Subsequently, N2O emissions from crop residues left
in the field and non-CO2 emissions from field burning
of the residues were calculated using IPCC (2006) emission factors.
Indirect N2O emissions from leaching and runoff were
estimated based on nitrogen input to agricultural soils as described above. Leaching and run-off was as-sumed to occur in other areas than non-irrigated dry-land regions, which were identified based on FAO (1999; 2000; 2005) and Murray et al. (1999). The fraction of nitrogen lost through leaching and runoff was based on a study of Van Drecht et al. (2003). IPCC (2006) emission factors were used for indirect N2O from leaching and runoff, as well as from
deposi-tion of agricultural NH3 and NOx emissions.
For savannah burning, estimates for areas burned are based on satellite measurements (see next section) and emission factors from IPCC (2006).
Large-scale biomass burning
For estimating the amounts of biomass burned in large-scale fires the three key parameters have to be multiplied: (a) area burned, (b) aboveground biomass density (fuel load) (kg/ha), and (c) fraction of above-ground biomass burned (combustion completeness). Country-specific data for large-scale biomass burning (total amount of dry matter burned, which were sub-divided into tropical and non-tropical forest fires, sa-vannah fires and grassland fires), have been taken from the gridded data at 1x1 degree grid of the Global Fire Emissions Database (GFED version 2; Van der Werf et al., 2006) for the years 1997-2005. For years prior to 1997, the GFED v2.0 data were scaled back to 1970 using regional biomass burning trends from the RETRO dataset, covering the period 1960-2000 (Schultz et al., 2008). GFED data for agricultural ar-eas were attributed to savannah and grassland fires. There is an insignificant overlap with the EDGAR category for agricultural waste burning. The GFED data on biomass burning were estimated using burned area time series for 2001-2005 derived from the MODIS satellite sensors in combination with the fuel load estimated by the satellite-driven Carnegie-Ames-Stanford-Approach (CASA) biogeochemical model that was adjusted to account for fires. The 1997–2000 period was included using fire counts from the VIRS/ATSR sensors. The burning areas were mapped at 0.5x0.5 km spatial resolution. For some countries a correction was made to the time series for the allocation of biomass burned in savannahs and tropi-cal forests. Since these sources have different emis-sion factors, total emisemis-sions have changed for these countries. For 2006-2008 the trend in the activity data from the GFED v3 model (Van der Werf et al., 2010) was used, since the new dataset is not consistent with the previous version. The non-CO2 emission factors
for large scale biomass burning have been updated using data from Andreae (2011). The GHG emission factors were not taken from IPCC (2006), (which were from Andreae and Merlet (2001)), but updated values from Andreae (2011), including the carbon content of 0.47 kg C/kg dry matter, which is the default value for tropical forest. For greenhouse gas accounting purposes, net CO2 emissions from
savan-nah and grassland fires have been assumed to be zero (organic carbon in a short cycle). There is a large un-certainty in the assumptions for the carbon contents and the fraction of carbon that is actually being burned and thus in the amount of burned carbon. CO2 emissions from large-scale biomass burning are
Roughly half of the aboveground biomass is not burned, but rather decomposes over time. This results in delayed decay emissions of approximately the same level of magnitude as the direct emissions from the fires but distributed over a period of 10 to 20 years (IPCC, 2006). Post-burn CO2 emissions have been
estimated from the same activity data as direct burn-ing emissions by assumburn-ing that remainburn-ing above-ground biomass decays in the 15 year2 after the year the fire or deforestation occurred, i.e. 1/15 per year and a carbon content of 0.47 kg C/kg dry matter tropi-cal forest from IPCC (2006).
For CO2 emissions from drained peatlands the
comprehensive dataset of Joosten (2009) was used, comprising of activity data for 1990 and 2008 and CO2 emission factors per hectare of drained peatland.
For intervening years, the activity data were linearly interpolated, except for Indonesia, for which the trend in the area of palm oil plantations was used as proxy for the interpolation. For years before 1990 a linear increase from 0 in 1970 was assumed, with a few exceptions, where the area was assumed to remain constant prior to 1990. In EDGAR 4.2 FT2010 the amount of peat burned (in Indonesia only) has been separated from the amount of tropical forest burned in the GFED v2.0 dataset and different emission factors have been applied for most substances (Christian et al., 2003; Weiss (2002), resulting in different emissions.
In addition, enhanced N2O emissions that occur after
large-scale tropical biomass burning (Bouwman et al., 1997) were calculated from the post-burn biomass dataset.
Waste handling
To estimate the amount of organic solid waste in land-fills three key parameters have to be determined: (a) Municipal Sold Waste (MSW) generated per year (kg/cap), (b) fraction of total solid waste that is land-filled, and (c) fraction of Degradable Organic Carbon (DOC) in the MSW (%). Total and urban population figures were taken from UN (2006b).The amounts of Municipal Sold Waste (MSW) generated are the pri-mary statistics for emissions from landfills. For 70 countries, the 2006 IPCC Guidelines provide coun-try-specific data for 2000 of the amount of MSW gen-erated per year per capita (urban capita in case of non-Annex I countries) and the fraction landfilled and in-cinerated. For 58 more countries, country-specific values for the MSW generation per capita were found in the literature. For the remaining 91 countries, the waste generation per capita in 2000 was estimated
using an exponential fit of the IPCC (2006) country-specific data for 70 countries of MSW/cap for 2000 to GDP/cap. For Annex I countries trend data for MSW generation/cap are available for the period 1990-2005 (UNFCCC, 2008). For other years and for other coun-tries for which these data are not available, extrapola-tion from 2000 back and forward was done using the exponential fit mentioned above. When the country-specific fraction of MSW landfilled was missing, re-gional defaults provided in IPCC (2006) were used. In addition, UN statistics on MSW treatment may pro-vide country-specific data for years other than 2000. Based on regional defaults for the composition of MSW, IPCC (2006) provides regional defaults for the fraction of Degradable Organic Carbon (DOC). For Annex I countries, country-specific data from UNFCCC (2008) were used (sometimes including a change over time) and for 94 Non-Annex I countries, country-specific MSW composition data were found, from which the average DOC value was calculated. However, in version 4.2, for a number of Annex I countries, the DOC fraction was adjusted to better reflect the overall emission trends for landfills as re-ported to UNFCCC (2008).
Calculation of methane emissions from landfills using the First Order Decay (FOD) model of IPCC (2006), the Methane Conversion Factor (MCF), requires the k-value and the Oxidation Factor (OX). The MCF is characterised by the type of landfill: managed aerobic or anaerobic, unmanaged deep or shallow. Apart from country-specific time series which are available for 11 Annex I countries, two sets of MCF time series for Annex I and non-Annex I countries were determined based on assumptions about the fractions of the four landfill types over time. For the k-value, which is the methane generation rate (inversely proportional to the half life value of the DOC), default regional MSW composition weighted k-values for four climate zones (tropical dry/wet and non-tropical dry/wet) were pro-vided by IPCC (2006). For EDGAR 4.2 FT2010, coun-try-specific values were calculated using the country-specific fractions of the population (urban population for non-Annex I countries) in each climate zone. The IPCC default values were used to estimate the Oxida-tion Factor (0.1 for Annex I and 0 for non-Annex I). Finally, the amounts of methane recovered (and used or flared) to be subtracted from the gross methane emis-sions, were taken as reported by Annex I countries in UNFCCC (2010) and for 23 non-Annex I countries from CDM projects reported by the UNEP Risø Centre (2011). Total recovery in 2010 is estimated at 12.9 Tg CH4, half of which was by the United States
and almost one fifth by the United Kingdom; about 13% is recovered by non-Annex I countries.
For domestic wastewater, total organics in wastewater (BOD5) was estimated using regional default or
coun-try-specific default values for BOD5 generation per
capita per day provided by IPCC (2006). For indus-trial wastewater, total organically degradable material in wastewater from industry was calculated per type of industry from WW generation per ton of product and COD values (chemical oxygen demand (industrial degradable organic component in wastewater) in kg/m3 WW, using defaults from IPCC (2006). Production statistics for industry types that produce most organics in wastewater are available from UN (2006a). Exam-ples are meat and poultry, raw sugar, alcohol, pulp and organic chemicals. To estimate methane emis-sions from domestic wastewater, additional informa-tion is required on the WW treatment systems, such as sewer systems (to wastewater treatment plants (WWTP) or to raw discharge), latrines by type, open pits and septic tanks. Regional or country-specific default fractions for 2000 were from IPCC (2006). In addition, country-specific fractions of improved sani-tation over time from Van Drecht et al. (2009) were used, based on the UN Water Supply and Sanita-tion (WSS) dataset and other naSanita-tional reports, and fractions reported by Doorn and Liles (1999). For in-dustrial methane emissions, fractions of on-site treat-ment in WWTP, sewer with and without city-WWTP, and raw discharge were based on regional values re-ported by Doorn et al. (1997). To calculate methane emissions from wastewater, default factors provided by IPCC (2006) per type of WW treatment were used, with default methane correction factors (MCF) per type of treatment. For Annex I countries, OECD or EIT average fractions of methane recovered in WWTPs (and either used as biogas or flared) were used, except for five countries for which country-specific values reported in UNFCCC (2008) were used. To estimate N2O emissions from wastewater, the
ac-tivity data used is the total annual amount of nitrogen in the wastewater, which was calculated from annual protein consumption per capita reported by FAO (2007), using correction factors for non-consumed protein and for the fraction of industrial and commercial protein that is co-discharged. For the correction fac-tors and the N2O emission factor, defaults provided in
IPCC (2006) were used.
Other waste sources are incineration, with activity data from UNFCCC (2008) and IPCC (2006) and extrapola-tions assuming a fixed ratio to landfilling, and com-posting (UNFCCC, 2008; ECN, 2008; CCC, 2008).
Other sources
Indirect N2O emissions from atmospheric deposition
of nitrogen of NOx and NH3 emissions from
non-agricultural sources, mainly fossil fuel combustion and large scale biomass burning, were estimated using nitrogen in NOx and NH3 emissions from these
sources as activity data, based on preliminary EDGAR 4.2 FT2010 data for these gases. The same IPCC (2006) emission factor was used for indirect N2O from atmospheric deposition of nitrogen from
NH3 and NOx emissions as was used for agricultural
emissions.
General Note
We note that EDGAR 4.2 FT2010 estimates for all sources have been made for all years. For more de-tailed data of the EDGAR 4.2 FT2010 dataset, includ-ing the complete period 1970-2010 and a few small corrections after the release of the dataset for some sources of F-gas emissions in 2010 (HFC-23 from HCFC manufacture and PFCs from solvent use and from PV cell manufacture) and preliminary estimates for more recent years we refer to the EDGAR version 4 website at edgar.jrc.ec.europa.eu. Aggre-gated preliminary estimates can also be found at PBL (2014) and for CO2 in Olivier et al. (2014).
References
AFEAS (2008). Production, sales and atmospheric release of fluorocarbons through 2006. Alternative Fluorocarbons Environmental Acceptability Study (AFEAS) Program Office, Washington DC. Internet: www.afeas.org/data.php on May 2009.
Aluminium Verlag (2007). Primary Aluminium Smelters and Producers of the World. Aluminium Verlag, Düsseldorf, Germany.
Andreae, M. (2011). Updated emissions factors for emissions of trace gases and aerosols from biomass burning, pers. comm. 30 July 2011.
Andreae, M. and P. Merlet (2001). Emissions of trace gases and aerosols from biomass burning. Global biogeochemical Cycles, 15, 955-966.
Ashford, D., D. Clodic, A. McCulloch and L. Kuijpers (2004). Emission profiles from the foam and refrigeration sectors comparison with atmospheric concentrations. Part 2: results and discussion, International Journal of Refrigeration, 27, 701-716.
Bitsch, R. (Siemens) (1998). Personal communication on estimated regional distribution of SF6 from
switchgear in 1995 by CAPIEL and UNIPEDE, 29 July 1998.
Bouwman, A.F., D.S. Lee, W.A.H. Asman, F.J. Dentener, K.W. Van der Hoek and J.G.J. Olivier (1997). A Global High-Resolution Emission Inventory for Am-monia, Global Biogeochemical Cycles, 11, 561-587. Bouwman, A.F., K.W. Van der Hoek, B. Eickhout and I. Soenario (2005). Exploring changes in world ruminant production systems. Agricultural Systems, 84,:121-153.
Britz, W. (ed.) (2005). CAPRI Modelling System Documentation. Common Agricultural Policy Regional Impact Analysis. Universität Bonn, Bonn, Germany. Internet: www.agp.uni-bonn.de/agpo/rsrch/ capri/capri-documentation.pdf
CCC (2008). Communication and Education Initiatives, Composting Council of Canada (CCC). Toronto. Internet: www.compost.org/commEdInit.html Cheng, Y.P., L. Wang, and X.-L. Zhang (2011). Environmental impact of coal mine methane emissions and responding strategies in China. Int. J. Greenhouse gas Control, 5, 157-166.
Choe, J.S., P.J. Gook and F.P. Petrocelli (1993). Developing N2O abatement technology for the nitric
acid industry. Paper presented at the 1993 ANPSG Conference, Destin, Florida, 6 October, 1993.
CIA (2008). The World Fact Book. Central Intelligence Agency (CIA), Washington DC. Internet: www.cia.gov/library/publications/the-world-factbook/ CIAB (1994). Global methane emissions and the coal industry. Coal Industry Advisory Board, IEA, Paris. Christian, T.J., B. Kleiss, R.J. Yokelson, R. Holzinger, P.J. Crutzen, W.M. Hao, B.H. Saharjo and D.E. Ward (2003). Comprehensive laboratory measurements of biomass-burning emissions: 1. Emissions from Indo-nesian, African, and other fuels, J. Geophys. Res., 108(D23), 4719, doi:10.1029/2003JD003704.
Denier van der Gon, H. (1999). Changes in CH4
emission from rice fields from 1960 to 1990s, The declining use of organic inputs in rice farming. Global Biogeochemical Cycles, 13, 1053-1062.
Denier van der Gon, H. (2000). Changes in CH4
emission from rice fields from 1960 to 1990s, Impacts of modern rice technology. Global Biogeochemical Cycles, 14, 61-72.
Doorn, M.R.J., R.P. Strait, W.R. Barnard and B. Eklund (1997). Estimates of global greenhouse-gas emissions from industrial and domestic waste water treatment. Report no. NRMRL-RTP-086. R 8/18/97. Pechan & Ass., Durham.
Doorn, M.J. and D.S. Liles (1999). Quantification of methane emissions and discussion of nitrous oxide, and ammonia emissions from septic tanks, latrines, and stagnant open sewers in the world. EPA, Washington DC. EPA report EPA-600/R-99-089, October 1999.
ECN (2008). Biowaste Treatment; Country presentations. European Compost Network (ECN), Weimar, Germany. Internet: www.compostnetwork.info/ EEA (2009). EMEP-EEA emission inventory guidebook – 2009, European Environment Agency. Internet: www.eea.europa.eu/publications
EIA (2007, 2010, 2011, 2013). International Energy Statistics; downloaded in 2007, 2010, 2011, 2013. US Energy Information Administration, Washington DC. Internet: www.eia.doe.gov/emeu/international/ contents.html
Elvidge, C.D., D. Ziskin, K.E. Baugh, B.T. Tuttle, T. Ghosh, D.W. Pack, E.H. Erwin and M. Zhizhin (2009). Fifteen Year Record of Global Natural Gas Flaring Derived from Satellite Data. Energies, 2, 595-622, doi:10.3390/en20300595.
EPA (2008). Global Overview of CMM Opportuni-ties. US Environmental Protection Agency in support of the Methane to Markets Partnership. EPA, Washington DC.
EURACOAL (2008). Coal industry across Europe 2008. Brussels, Belgium.
FAO (1999). Irrigation in Asia in figures. FAO Water report 18. ftp://ftp.fao.org/agl/aglw/docs/wr18.pdf FAO (2000). Irrigation in Latin America and the Caribbean in figures. FAO water report 20. Internet: ftp://ftp.fao.org/agl/aglw/docs/wr20.pdf
FAO (2005). Irrigation in Africa in figures. FAO water report 29. Internet: ftp://ftp.fao.org/agl/aglw/ docs/wr29_eng.pdf
FAO (2007a, 2010). FAOSTAT: ForeSTAT. Internet: faostat.fao.org/site/626/default.aspx#ancor
FAO (2007, 2010, 2012, 2014). FAOSTAT. Live animal numbers, crop production, total nitrogen fertiliser consumption statistics for 2000-2008/2000-2010, 2000-2012. Internet: faostat3.fao.org/faostat-gateway/go/to/download/Q/*/E
FAO Geonetwork (2007, 2011). Digital Soil Map of the World. Internet: www.fao.org/geonetwork/srv/en/ metadata.show?id=14116&currTab=simple
Fernandes, S.D., N.M. Trautmann, D.G. Streets, C.A. Roden and T.C. Bond (2007). Global biofuel use, 1850–2000, Global Biogeochemial Cycles, 21, GB2019, doi:10.1029/2006GB002836.
Goldewijk, K., G. van Drecht and A. Bouwman (2007). Mapping contemporary global cropland and grassland distributions on a 5 x 5 minute resolution. Journal of Land Use Science, 2, 167-190.
Gupta, P., C. Sharma, S. Bhattacharya and A. Mitra (2002). Scientific basis for establishing country greenhouse gas estimates for rice-based agriculture: An Indian case study. Nutrient Cycling in Agroecosys-tems 64, 19-31.
Hunt, W.H. (2004). The China Factor: Aluminium Industry Impact. JOM, 56, 21-24.
IAI (2006, 2008). Report on the aluminium industry’s global perfluorocarbon gas emissions reduction pro-gramme. Results of the 2004/2006 anode effect survey. International Aluminium Institute (IAI), London, UK. IEA (2007, 2010, 2012, 2013). Energy Statistics of OECD and Non-OECD Countries. On-line data ser-vice. Internet: data.iea.org
IEA (2011). Trends in Photovoltaic Applications. Survey report of selected IEA countries between 1992 and 2010. IEA, Paris. Report no. IEA-PVPS T1-20:2011.
IFA (2007). IFA Statistics. Production, imports, ex-ports and consumption data for nitrogen, phosphate and potash fertilizers. International Fertilizer Industry Association, Paris. CD-ROM.
IIASA (2014). GAINS model. Internet: http://gains.iiasa.ac.at/models/index.html
IMA (1999a). The Magnesium Diecasters Guide 1999; Volume III; Version 23 February 1999.
IMA (1999b). Magnesium International Buyers Guide. IPCC (1997). Revised 1996 IPCC Guidelines for Na-tional Greenhouse Gas Inventories. IPCC/OECD/ IEA, Paris.
IPCC (2000). Good Practice Guidance and Uncer-tainty Management in National Greenhouse Gas In-ventories, IPCC-TSU NGGIP, Japan.
IPCC (2006). 2006 IPCC Guidelines for National Greenhouse Gas Inventories. Eggleston, S., Buendia, L., Miwa, K., Ngara, T., Tanabe, K. (eds.). IPCC-TSU NGGIP, IGES, Japan. Internet: www.ipcc-nggip.iges. or.jp/public/2006gl/index.html
IPCC (2014). Climate Change 2014: Mitigation. Con-tribution of Working Group III to the Fifth Assessment Report of the Intergovernmental Panel on Climate Change [ Edenhofer, O., R. Pichs-Madruga, Y. Sokona, E. Farahani, S. Kadner, K. Seyboth, A. Adler, I. Baum, S. Brunner, P. Eickemeier, B. Kriemann, J. Savolainen, S. Schlömer, C. von Stechow, T. Zwickel and J.C. Minx (eds.)], Cambridge University Press, Cambridge, United Kingdom and New York, NY. Internet: http://www.ipcc.ch/report/ar5/wg3/.
IRRI (2007). World rice statistics. Distribution of rice crop area, by environment. 2001. Internet: www.irri. org/science/ricestat/
Jäger-Waldau, A. (2008). PV Status Report 2008. Joint Research Centre, Institute for Energy. Report no. EUR 23604 EN. Luxembourg. ISBN 978-92-79-10122-9.
Joosten, H. (2009). The Global Peatland CO2 Picture -
Peatland status and drainage related emissions in all countries of the world. Wetlands International, Ede, The Netherlands. Database received by pers. comm., 2010. JRC/PBL (2012). EDGAR version 4.2 FT2010. Joint Research Centre/PBL Netherlands Environmental Assessment Agency. Internet: edgar.jrc.ec.europa.eu/ Kammen, D.M. (2005). Strategies for a sustainable, CO2 neutral energy economy. Solar to Fuel – Future
Challenges and Solutions. Lawrence Berkeley Na-tional Laboratory, March 28, 2005.
Kirchgessner, D.A., S.D. Piccot and J.D. Winkler (1993). Estimate of global methane emissions from coal mines. Chemosphere, 26, 453-472.
Knopman, D. and K. Smythe (2007). 2004-2006 SF6 data summary. Project Memorandum PM-2327-NEMA, 25 June 2007. Internet: epa.gov/highgwp/ electricpower-sf6/documents/04-06_data_summary.pdf Kroeze, C. (1994). Nitrous oxide (N2O). Emission
inventory and options for control in the Netherlands. RIVM, Bilthoven. Report no. 773001 004.
Leip, A., R. Koeble, G. Marchi, M. Kempen, T. Heckelei and W. Britz (2007). Linking an eco-nomic model for European agriculture with a mecha-nistic model to estimate nitrogen losses from cropland soil in Europe, Biogeosciences Discussion, 4, 2215-2278, 2007.
Lerner, J., E. Matthews and I. Fung (1988). Methane emission from animals: a global high resolution data-base, Global Biogeochemical Cycles 2, 139-156.