Evaluation of ecological risk limits
for DDT and drins in soil
Assessment of direct toxicity and food chain transfer
RIVM Letter report 2015-0139 C.E. Smit│E.M.J. Verbruggen
Colophon
© RIVM 2015
Parts of this publication may be reproduced, provided acknowledgement is given to: National Institute for Public Health and the Environment, along with the title and year of publication.
C.E. Smit (auteur), RIVM
E.M.J. Verbruggen (auteur), RIVM
Contact: Els Smit
Centre for Safety of Substances and Products els.smit@rivm.nl
This investigation has been performed by order and for the account of Ministry of Infrastructure and the Environment, within the framework of the project M/607711 Soil quality and Risk assessment.
This is a publication of:
National Institute for Public Health and the Environment
P.O. Box 1 | 3720 BA Bilthoven The Netherlands
Publiekssamenvatting
Evaluatie van de ecologische risicogrenzen voor DDT en Drins in de bodem.
Een beoordeling van de directe toxiciteit en doorvergiftiging in de voedselketen
Het RIVM heeft onderzocht of de ecologische risicogrenzen in bodem voor twee groepen bestrijdingsmiddelen veilig zijn voor roofvogels. Dit betreft zogeheten drins (dieldrin, aldrin, endrin) en DDT, inclusief de bijbehorende afbraakproducten DDD en DDE. Voor endrin en het totaal aan DDT-verbindingen zijn de risicogrenzen aangescherpt om ook roofvogels voldoende te beschermen. Voor dieldrin en aldrin zijn de risicogrenzen daarvoor wel toereikend. Deze informatie kan zowel landelijk als door lokale overheden worden gebruikt bij het afleiden van normen en beslissingen over hergebruik van grond, vooral in groene gebieden.
De onderzochte bestrijdingsmiddelen zijn verboden, maar zitten in bepaalde gebieden van Nederland nog steeds in de bodem. Kleine vogels en zoogdieren krijgen de stoffen binnen via het eten van wormen en andere bodemdieren en geven ze vervolgens door aan grotere
roofvogels.
Voor dit onderzoek is recente kennis gebruikt over de mate waarin stoffen via de voedselketen schadelijk kunnen zijn voor grotere organismen. Deze ‘stapeling’ blijkt voor deze stoffen belangrijk en is daarom betrokken bij de berekening van de ecologische risicogrenzen. De huidige risicogrenzen zijn in 2001 afgeleid en zijn alleen gebaseerd op de mate waarin ze direct giftig zijn voor organismen in de bodem. Over de directe giftigheid waren destijds weinig gegevens beschikbaar en er zijn in de huidige studie ook nauwelijks nieuwe gegevens
bijgekomen.
Synopsis
Evaluation of ecological risk limits for DDT and drins in soil. Assessment of direct toxicity and food chain transfer
RIVM evaluates if the current Dutch ecological risk limits for DDT (and its metabolites DDD and DDE), and drins (dieldrin, aldrin, endrin) in soil are protective for predatory birds. For endrin and the sum of DDT-compounds, risk limits are lowered to protect these organisms. For dieldrin and aldrin, the current values give sufficient protection. This information can be used by national and local authorities to set soil standards and to decide on the re-use of soil in green areas.
The use of these pesticides has been banned, but soil residues are still present in certain areas in the Netherlands. The compounds accumulate in birds and mammals via consumption of earthworms and other soil organisms, and are transferred to larger predatory birds.
For this evaluation, up-to-date knowledge on the transfer of these compounds in the food chain to higher animals is used. For both groups of compounds, food chain transfer is a critical factor for the derivation of ecological risk limits in soil. The current values were derived in 2001 on the basis of direct ecotoxicity to soil organisms. Only limited data were available then, and from this study it appears that there still is a lack of relevant data for soil organisms. Improving the risk limits at this point is therefore not possible.
Contents
Summary — 9 1 Introduction — 11
1.1 Background of the report — 11
1.2 Risk limits considered in this report — 11
1.3 Using ecotoxicity data: data quality and treatment of results — 12 1.4 Importance of secondary poisoning — 13
1.5 Aim of the present report, readers guide — 14 2 DDT and metabolites — 15
2.1 Assessment of direct ecotoxicity — 15 2.2 Assessment of secondary poisoning — 22
2.3 Summary and conclusions on DDT and metabolites — 39 3 Dieldrin, aldrin and endrin — 43
3.1 Direct ecotoxicity — 43
3.2 Assessment of secondary poisoning — 43 3.3 Summary and conclusions on drins — 48 4 Conclusions — 51
References — 53
Appendix 1. Overview of potentially relevant aquatic endpoints from the US EPA Ecotox database — 59
Appendix 2. Toxicity of DDT and metabolites to birds — 71 Appendix 3. Toxicity of DDT and metabolites to mammals — 79 Appendix 4. Toxicity of drins to bird — 83
Summary
In this report, the current Dutch ecological risk limits for DDT and its metabolites, and drins in soil are evaluated. The current values date back to 2001 and are based on a limited dataset. Moreover, only direct ecotoxicity was taken into account whereas for these compounds food chain transfer is highly relevant. The aim of the present research was to investigate if the current ecological risk limits offer adequate protection for the soil ecosystem, considering both direct ecotoxicity and secondary poisoning.
For both groups of compounds a screening of the literature resulted in very limited additional data on direct ecotoxicity to soil organisms. Due to a lack of chronic studies for relevant species, it is not possible to improve the scientific basis of the risk limits for direct ecotoxicity. To overcome this situation, it may be considered to derive risk limits for soil from aquatic data using equilibrium partitioning. However, although some new studies have been published since 2001, new data will not lead to major changes in the outcome as compared to previous
evaluations. Moreover, chronic data on relevant endpoints of potentially sensitive species groups are still lacking.
To evaluate the aspect of food chain transfer for both groups of
compounds, data on toxicity for birds and mammals were collected and used to derive safe concentrations in bird and mammal food according to current European methodology. From this safe dietary level, an equivalent safe concentration in soil was calculated for worm-eating birds, using information on the accumulation from soil to earthworms. DDT, its metabolites and drins are biomagnifying compounds, meaning that accumulation increases with increasing position in the food chain. As a result, safe values for worm-eating birds may not be protective for higher predators feeding on those birds. Some field studies are available in which residues in soil, worms, birds and eggs were determined. It appears that concentrations of DDT and DDE in small birds and eggs are much higher than in worms from the same location. Based on these field data, an additional safety factor of 10 is proposed to protect predators that feed on small worm-eating birds and/or their eggs. It may be assumed that a similar situation exists for drins, but quantitative information to derive such a factor could not be retrieved in the time span of this project.
Using the information gathered in this report, it appears that the current risk limits for dieldrin and aldrin are likely protective for birds, including predatory species. For DDT, its metabolites and endrin, the current values are likely protective for worm-eating birds, but not for higher predatory birds.
1
Introduction
1.1 Background of the report
Ecological risk limits play an important role in the Dutch soil protection policy. Together with human health related risk limits, they are used for assessment of soil quality in the context of decision making on
remediation, re-use of soil and risk management in case of chemical spills or other emergency situations.
The derivation of most risk limits was performed in 2001 [1], mostly based on data from ecotoxicity tests that had been evaluated previously [2-6], but using an adapted methodology.
Since then, risk limits for some (groups of) compounds have been updated, by adding new data to the already available datasets and taking into account methodological developments [7,8], but the majority of the currently used ecological risk limits originates from the 2001-report. Upon request of the Dutch Ministry of Infrastructure and the Environment, it was investigated to what extent the existing ecological risk limits for soil can (should) be improved to meet new scientific developments and to solve practical problems that arise when using those risk limits in practice [9].
As a follow-up, a scoring method was developed to rank the existing ecological risk limits with respect to uncertainty related to data quality and changes in methodology [10]. Based on this evaluation, DDT and its metabolites DDE and DDD and drins (aldrin, dieldrin and endrin) were selected for a closer review. Before focusing on these specific
compounds, the following sections give some background information on the risk limits considered in this report and the aspects that are
considered most important when discussing the scientific validity of the previously derived risk limits.
1.2 Risk limits considered in this report
The relevant ecological risk limits in the context of this report are the Maximum Permissible Concentration (MPC) and the Serious Risk Concentration (SRC).
The MPCsoil is defined as the concentration in soil at which no negative effect on ecosystems is expected [11,12]. The MPCsoil is derived considering direct ecotoxicity to soil organisms and/or bacterial or enzymatic processes (MPCsoil, eco), and/or considering secondary
poisoning of predatory birds and mammals (MPCsoil, secpois). Considering the protection level and methodology, the MPCsoil, eco is comparable to a Predicted No Effect Concentration (PNEC) as derived in various
international frameworks [13,14]. The derivation of the MPCsoil, secpois is based on the risk assessment for secondary poisoning as outlined in European guidance [13-15].
The SRCsoil is usually derived for direct ecotoxicity to soil organisms and/or processes only. The SRCsoil, eco is the environmental concentration at which possibly serious ecotoxicological effects on soil organisms and/or processes are to be expected, meaning that 50% of the species or processes is potentially affected. In some cases, secondary poisoning was additionally taken into consideration for derivation of the SRC
[7,16], see further Section 1.4. Detailed guidance for the derivaton of the MPC and SRC for soil is given in [17].
In addition to the MPCsoil and SRCsoil, an intermediate risk level is presented that represents a limit concentration for the reuse of soil for residential functions in The Netherlands. In line with the methodology described in [18], this intermediate ecological value is set equal to the geometric mean of the ecologically based MPCsoil and SRCsoil.
1.3 Using ecotoxicity data: data quality and treatment of results The derivation of ecological risk limits basically follows a four step approach: collection of literature, evaluation of the scientific reliability, selection of relevant endpoints and using the endpoints to derive the risk limits. It can be imagined that if new data were generated since the last evaluation, this may potentially lead to a different result. However, even if this is not the case and the same literature data would be used, newly derived risk limits will differ from those derived in 2001. Re-evaluation of the literature according to current insights may lead to different conclusions regarding the quality of the data, and the way risk limits are derived given a certain dataset has been adapted in several ways during the past years.
1.3.1 Data quality
Regarding data quality, a general observation is that the evaluation of the scientific reliability of individual ecotoxicity studies has received increasing attention over the years. This is partly due to the fact that more established test guidelines have become available, including criteria that can be used to (in)validate test results. It has to be noted, though, that aquatic data seem to be more often rejected than
terrestrial tests when studies are re-evaluated according to current insights. This may be due to the fact that for some compounds
maintenance of exposure concentrations in aquatic tests is more critical than in confined terrestrial test systems. Both the MPCeco and the SRCeco are preferably based on terrestrial ecotoxicity data. However, when such data are limited or absent, aquatic data may be used to derive risk limits for soil by using equilibrium partitioning. Changes in the quality
assessment of aquatic data may thus be important for terrestrial risk limits as well.
1.3.2 Changes in data treatment
Once reliable and relevant ecotoxicity endpoints are selected, the available data can be used in different ways to derive risk limits. If the number of data is limited, an assessment factor is put on the lowest endpoint. If more data are available, statistical extrapolation using Species Sensitivity Distributions (SSDs) can be applied. Changes in the requirements for using the latter were identified as an important factor when considering the uncertainty related to the previously derived risk limits [10]. An SSD displays the fraction of species potentially affected as a function of the exposure concentration. The Hazardous
Concentration for 5% and 50% of the species (HC5 and HC50), are used as input for the MPCeco and SRCeco, respectively.
In 2001, SSDs were applied when data for at least four taxonomic groups were available1, regardless of the trophic levels represented in
the dataset. The HC5 and HC50 were used without any additional assessment factors. With the implementation of the European Technical Guidance Document (TGD) for risk assessment of new and existing substances in 2003 [13], the requirements for performing SSDs have been extended. At present, SSDs can only be performed when at least 10 (preferably 15) values are available for at least eight different taxonomic groups, representing primary producers, and primary and secondary consumers. For the aquatic compartment, it is specified in detail which are the required taxonomic groups. This is not the case for soil, but the requirements with respect to the number of data and the inclusion of at least three trophic levels are considered to be the same. As a consequence, application of SSDs for terrestrial species is possible in rare cases only.
For the SRCeco, whether or not performing an SSD is not a major change if No Observed Effect Concentrations (NOECs) are present for at least two trophic levels. The 50th percentile of the SSD that was used previously, is equal to the geometric mean of the NOECs that will be used now. However, when less than two taxonomic groups are present and/or the NOECs represent a single trophic level, acute data will be considered as well and an additional comparison with the equilibrium partitioning method will be made. In 2001, the comparison with
equilibrium partitioning based values was almost always made and the lower value was chosen.
1.4 Importance of secondary poisoning
The above discussed changes in data evaluation and application of SSDs concern risk limits based on direct ecotoxicity to soil organisms. In view of the high bioaccumulation potential of DDT and related compounds, secondary poisoning of predatory birds and mammals should be taken into account when assessing the impact of soil contamination on
ecosystem health. However, in line with previous evaluations [6,19,20], it was concluded in the 2001-report that secondary poisoning was not critical for the derivation of the MPC when applying the then prevailing methods [1]. However, based on updated information on the
accumulation of DDT by earthworms, it was concluded in 2002 that inclusion of secondary poisoning would potentially be critical for derivation of the MPC [16]. At the level of the SRC, inclusion of
secondary poisoning would lead to a value similar to the SRCeco derived in the 2001-report, which was based on direct ecotoxicity only [16]. As for the above described changes in performing SSDs, also for
secondary poisoning important developments in methodology have been made since 2001-2002. In general, the evaluation of the bird and
mammal studies with respect to quality has not been changed to a great extent, and endpoints obtained in the past are most often still
considered valid upon re-evaluation. However, the way these data are used according to the TGD [13] differs from that used in the above mentioned evaluations. Assessment factors are applied depending on the duration of the studies, and conversion factors are used to translate toxicity endpoints based on dietary doses into values based on
concentrations in food. Moreover, risk limits based on secondary
poisoning have been calculated in the past using one combined dataset in which data on direct ecotoxicity and secondary poisoning were combined, or using separate datasets [16]. At present treating
secondary poisoning and direct ecotoxicity separately is considered most appropriate, and the route leading to the lowest risk limit is used to set the final value [17]. These methodological changes will lead to risk limits for secondary poisoning that are potentially lower than those derived previously, even if the same input data on bird and mammal toxicity are used. Recently, an alternative methode has been developed that uses an energy-based approach to convert toxicity data for birds and mammals obtained with laboratory diet to corresponding values in wildlife food [21]. It appeared, however, that the available data do not allow to further explore this method in this report (see section 2.3.4.1). 1.5 Aim of the present report, readers guide
The aim of the present research is to investigate if the current ecological risk limits offer adequate protection for the soil ecosystem, considering both direct ecotoxicity and secondary poisoning. DDT and related compounds are discussed in Chapter 2. In section 2.1, the assessment of direct ecotoxicity is evaluated first, a closer look is taken at the underlying data that were used in 2001, and the options for improving the dataset for direct ecotoxicity are discussed on the basis of a literature screening on new terrestrial and aquatic ecotoxicity data. In section 2.2, the assessment of secondary poisoning is elaborated on, with an overview of previously made evaluations (section 2.2.1), and an additional assessment for worm-eating birds and mammals and higher predators (section 2.2.3). Section 2.3 gives the summary and
conclusions on DDT and metabolites. Chapter 3 follows the same order for drins.
Chapter 4 summarises the results of the evaluation and discusses the implications for the derivation of the MPCeco and SRCeco of these compounds.
2
DDT and metabolites
2.1 Assessment of direct ecotoxicity
2.1.1 Direct ecotoxicity to soil organism
2.1.1.1 Previous assessment
In 2001, no data were available on direct ecotoxicity of DDE and DDD to soil organisms [1]. For DDT the data were taken from a previous RIVM-evaluation (and Annex) prepared by Van de Plassche in 1994 [6,22]. Terrestrial data in that report were taken from an earlier RIVM-report that was published in 1990 by Denneman and Van Gestel [4]. The dataset consists of a single acute LC50-value of 10 mg/kgdwt soil for the cricket Gryllus pennsylvanicus. This value is the geometric mean of 12 values from tests in different soil types, and is expressed on the basis of Dutch standard soil with 10% organic matter (OM). The MPCeco of 0.01 mg/kgdwt soil was derived using this value with an assessment factor (AF) of 1000, the SRCeco was set to 1 mg/kgdwt soil using an AF of 10. Both values are expressed on the basis of dry weight (dwt) soil for Dutch standard soil containing 10% organic matter (OM). The result of the equilibrium partitioning method (see section 2.1.2) was less critical than this direct value.
2.1.1.2 Evaluation of additional data
To evaluate the options for adding new soil ecotoxicity values to the dataset, the Ecotox database of the United States Environmental Protection Agency (US EPA) [23] and the US EPA report on ecological soil screening levels (Eco-SSL) for DDT and metabolites [24], were screened for additional ecotoxicity data from relevant tests.
The US EPA Ecotox database did not contain any additional relevant data for DDE and DDD. Most entries for DDT in the US EPA Ecotox database concern studies with spray application, expressed in a weight per area basis. These data were not further considered. Of the remaining chronic data (test duration of 12 days or longer) one relevant study was
retrieved in which micro-organisms, plants, springtails and earthworms were tested [25]. Resulting chronic EC50-values were all > values, except for an EC50 of 588 mg/kgdwt soil, for reproduction of the earthworm Eisenia fetida in a sandy soil with 1% organic carbon (≈ 1.7% OM), and an EC50 of 950 mg/kgdwt soil for the springtail Folsomia
candida in a silty soil with 1.7% organic carbon (≈ 2.89% OM). From
the data in this paper, EC10-values of 47.5 and 51 mg/kgdwt soil could be fitted for reproduction of E. fetida and F. candida, respectively.
Expressed on the basis of Dutch standard soil with 10% OM, these EC10-values would be equal to 280 and 176 mg/kgdwt soil.
The US EPA Eco-SSL report [24] cites two reliable studies with plants, one of which could be retrieved. From the data in this study [26], a 13-weeks EC10 of 7.3 mg DDT/kgdwt soil was estimated for growth of the common bean Phaseolus aureus in a soil with 0.53% organic carbon (≈ 0.91% OM). This is equivalent to 80 mg/kgdwt soil in Dutch standard soil with 10% OM. According to the abstract of the other study [27], exposure to DDT at 5 to 50 mg/kgdwt soil had no effect on germination,
seedling emergence and early growth of cotton (Gossypium hirsutum), soybean (Glycine max), corn (Zea mays) and wheat (Triticum aestivum) in a soil with 0.85% organic carbon, the NOEC would thus be
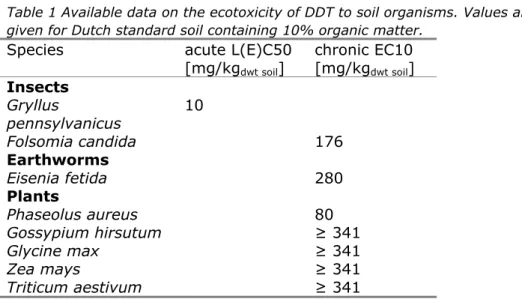
≥ 341 mg/kgdwt soil at 10% OM. The available ecotoxicity data for soil organisms are presented in Table 1.
Table 1 Available data on the ecotoxicity of DDT to soil organisms. Values are given for Dutch standard soil containing 10% organic matter.
Species acute L(E)C50
[mg/kgdwt soil] chronic EC10 [mg/kgdwt soil] Insects Gryllus pennsylvanicus 10 Folsomia candida 176 Earthworms Eisenia fetida 280 Plants Phaseolus aureus 80 Gossypium hirsutum ≥ 341 Glycine max ≥ 341 Zea mays ≥ 341 Triticum aestivum ≥ 341
The chronic EC10-values for springtails, earthworms and plants are much higher than the acute LC50 for the cricket, indicating that none of these represents a sensitive species group. This limits the usefulness of the chronic data for derivation of the MPCsoil, eco and SRCsoil, eco to a great extent. Because chronic data for a potentially sensitive taxon are
missing, the MPCsoil, eco should still be derived on the basis of the acute value. In the absence of chronic data for sensitive species, taking the geometric mean of the EC10-values would result in a bias in the
derivation of the SRCeco. Due to a lack of data, the US EPA did not derive Eco-SSL for DDT and metabolites based on plants or invertebrates [24]. 2.1.1.3 Conclusion on direct ecotoxicity to soil organisms
From the above it is concluded that for DDT, it is possible to improve the dataset for soil organisms that was used in 2001, by re-assessing the quality of the “old” studies and by addition of new studies that were performed after 1994. However, the relevance of the new data for soil organisms is limited, because they were derived for species that are much less sensitive than the species already included in the dataset. New data for DDE and DDD are not available. It is concluded that a revision of risk limits on the basis of direct ecotoxicity data for soil organisms is not possible.
2.1.2 Aquatic ecotoxicity data used for equilibrium partitioning
2.1.2.1 Previous assessments and additional data for DDT
In 2001 [1], risk limits for DDT based on direct ecotoxicity for soil organisms were compared with those derived from aquatic data by equilibrium partitioning (EqP) because of the limited data for soil organisms. The dataset of the 1994-report [22] consisted mainly of acute data, and only few chronic studies were available. Data for fresh- and saltwater species were combined. The lowest acute L(E)C50 was 0.63 µg/L for Daphnia pulex, the lowest NOEC-value was 0.05 µg/L for
D. magna. The geometric mean of the chronic NOEC-values was 1.7
µg/L, the geometric mean L(E)C50 was 4.3 µg/L. Using an AF of 10 on the latter, the SRCwater, eco was derived as 0.43 µg/L. From this value, an SRCsoil, eco of 10 mg/kg was derived using a partitioning coefficient of 4.35 (log-value, taken from [28]). Because this value is higher than the value of 1 mg/kg based on direct ecotoxicity for soil organisms (see above), the latter was chosen as the final SRCsoil, eco. An MPCwater, eco for direct ecotoxicity of 0.005 µg/L (5 ngL/) was derived in 1994, based on a NOEC of 0.05 µg/L for Daphnia magna with an AF of 10. The
MPCwater, secpois based on secondary poisoning was 0.00044 µg/L
(44 ng/L), and this value was taken as the final MPCwater. This value was not used for further calculation of the MPC for soil, the MPCsoil, eco was set at the above mentioned value of 0.01 mg/kg (see 2.1.1).
The acute dataset for DDT used in 1994 and 2001 includes L(E)C50-values for 44 freshwater species and for 26 saltwater species, including algae, crustaceans, insects, molluscs, fish and amphibians. The chronic dataset for DDT includes NOECs for two freshwater species and seven saltwater species, including algae, crustaceans and fish. Except for the chronic fish-study, analysis of test concentrations was not performed, which at present would be reason to reject the results. Moreover, the chronic NOECs for daphnids originate from a 14-days study and were estimated by dividing L(E)C50-values by 10. This would mean that from the previously used data, only the single NOEC for fish of 0.35 µg/L would probably be selected after re-evaluation of the old dataset. Similar to what was done for soil, the US EPA Ecotox database was screened for (additional) data on aquatic ecotoxicity. The database contains data for technical DDT and o’,p’-DDT. Data were first filtered for tests in which concentrations were verified. The remaining dataset was split into acute data from tests lasting 5 days or less, and chronic data from tests lasting 7 days and longer.
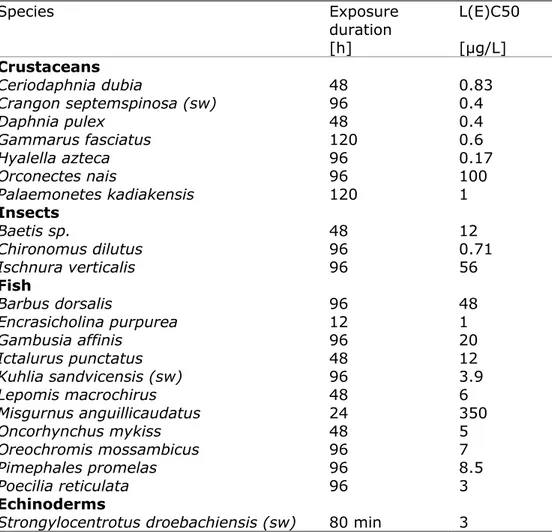
The resulting acute dataset (see Appendix 1, Table A1.1) contains about 60 potentially relevant acute data (LC50, EC50) originating from 14 literature references, only few of which were published later than 1994. The lowest relevant acute endpoints per species are shown in Table 2. The lowest value of this selection is a 4-days LC50 of 0.17 µg/L for the crustacean Hyalella azteca [29], which is about 3.5 times lower than the previously lowest geometric mean EC50 of 0.63 µg/L for the crustacean
Daphnia pulex, but only two times lower than the lowest individual EC50
of 0.36 µg/L reported for this species (see footnote c to table A8.2 in [1]). the geometric mean of the acute values is 4.4 µg/L, which is similar to the value of 4.3 µg/L derived in 2001 [1].
Table 2 Acute aquatic ecotoxicity data for DDT included in the US EPA Ecotox database. Lowest relevant endpoint per species from short-term studies (≤ 5 days) in which concentrations were measured. Marine species are indicated with sw = saltwater. Species Exposure duration [h] L(E)C50 [µg/L] Crustaceans Ceriodaphnia dubia 48 0.83 Crangon septemspinosa (sw) 96 0.4 Daphnia pulex 48 0.4 Gammarus fasciatus 120 0.6 Hyalella azteca 96 0.17 Orconectes nais 96 100 Palaemonetes kadiakensis 120 1 Insects Baetis sp. 48 12 Chironomus dilutus 96 0.71 Ischnura verticalis 96 56 Fish Barbus dorsalis 96 48 Encrasicholina purpurea 12 1 Gambusia affinis 96 20 Ictalurus punctatus 48 12 Kuhlia sandvicensis (sw) 96 3.9 Lepomis macrochirus 48 6 Misgurnus anguillicaudatus 24 350 Oncorhynchus mykiss 48 5 Oreochromis mossambicus 96 7 Pimephales promelas 96 8.5 Poecilia reticulata 96 3 Echinoderms
Strongylocentrotus droebachiensis (sw) 80 min 3
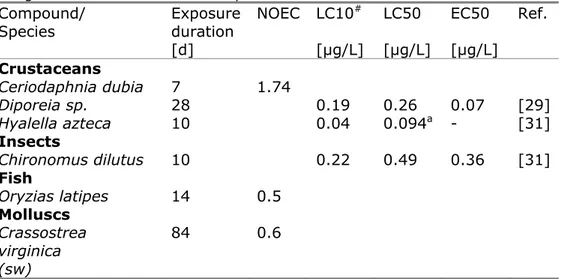
When selecting chronic data from those tests in which chemical analysis was performed, 50 potentially relevant endpoints were found for four different species (crustaceans, insects, fish, and a mollusc), originating from eight references (see Appendix 1, Table A1.2). The lowest value from these new data is a 10-days LC50 of 0.07 µg/L for H. azteca [30], which is very similar to the 10-days LC50 of 0.094 µg/L obtained for the same test duration in a more recent study [31]. For another crustacean species, Diporeia sp., an LC50 of 0.26 µg/L and EC50 of 0.07 µg/L for narcosis are reported from a 28-days test [29]. Unfortunately, the US EPA dataset does not report NOEC or EC10 values for these species. However, from information provided in the papers, LC10-values could be estimated. The chronic endpoints that were collected from the US EPA Ecotox database and estimated LC10-values are presented in Table 3. A 10-days LC10 of 0.04 µg/L could be estimated for H. azteca, while for
Diporeia sp. the 28-days LC10 was estimated as 0.19 µg/L. If for this
species the ratio between the 28-days EC50 for narcosis and the LC50 for mortality (0.07/0.26) is also valid at the 10%-effect level, the 28-days EC10 for narcosis would be 0.05 µg/L. This is similar to the 10-days LC10 of 0.04 µg/L for H. azteca. It should be noted that the endpoints for crustaceans and insects only refer to mortality and
immobility. Potentially sensitive endpoints such as growth and reproduction are not included. The geometric mean of the new NOEC/LC10-values for DDT is 0.31 µg/L.
Table 3 Chronic aquatic ecotoxicity data for DDT included in the US EPA Ecotox database, selection from long-term studies (≥ 5 days) in which concentrations were measured. LC10-values were not included in the database, but estimated using data of the authors. Marine species are indicated with sw = saltwater.
Compound/
Species Exposure duration [d] NOEC LC10# [µg/L] LC50 [µg/L] EC50 [µg/L] Ref. Crustaceans Ceriodaphnia dubia 7 1.74 Diporeia sp. 28 0.19 0.26 0.07 [29] Hyalella azteca 10 0.04 0.094a - [31] Insects Chironomus dilutus 10 0.22 0.49 0.36 [31] Fish Oryzias latipes 14 0.5 Molluscs Crassostrea virginica (sw) 84 0.6
# not included in US EPA Ecotox database, value derived from original reference a: a lower LC50 of 0.07 µg/L is included for this species in the US EPA Ecotox database [23], but no LC10 could be derived from this reference
2.1.2.2 Previous assessments and additional data for DDE and DDD
Because data on direct ecotoxicity to soil organisms were absent, the SRCsoil, eco for DDE and DDD was based on equilibrium partitioning using aquatic data.
For DDE, the dataset of the 1994-report [22] consisted of acute
L(E)C50-values for seven marine and freshwater species (crustaceans, molluscs, fish, and flatworms), and one single 14-days chronic NOEC of 0.1 µg/L for the marine crustacean Nitocra spinipes. The geometric mean of the acute data for DDE was 50 µg/L, and the SRCwater, eco was set equal to the single NOEC of 0.1 µg/L, the MPCwater, eco to 0.001 µg/L. Based on these values, an SRCsoil, eco of 1.3 mg/kg and MPCsoil, eco of 0.013 mg/kg were derived using equilibrium partitioning. Again the former MPC-value based on secondary poisoning was retained as the final MPCwater.
For DDD, the 1994-dataset [22] contained acute values only, including L(E)C50-values for 18 marine and freshwater species (algae,
crustaceans, an insect, a mollusc, fish and amphibians). The geometric mean of acute data was 38 µg/L, and the SRCwater, eco was set to
3.8 µg/L. The MPCwater, eco was set to 0.024 µg/L using the lowest
L(E)C50 of 2.4 µg/L for Penaeus duorarum with an AF of 100. Based on these risk limits for water, the SRCsoil, eco and MPCsoil, eco were set to 34 and 0.021 mg/kg using equilibrium partitioning. Note that the final MPCwater was kept at the former value of 44 ng/L derived for DDT on the basis of secondary poisoning (see 2.2.1).
As for DDT, analytical verification of test concentrations was not performed in the test used in 1994 and 2001. Only few studies were
performed using a renewal or flow-through system, and most studies would nowadays not be accepted as valid.
Additional aquatic endpoints for DDE and DDD from tests with analytical verification of test concentrations were collected from the US EPA Ecotox database as described above for DDT. For both compounds, acute
L(E)C50-values from short-term tests based on measured
concentrations were only available for the crustacean H. azteca and the insect Chironomus dilutus.
For DDE, L(E)C50-values of 4.57 and 22.3 µg/L are reported for H.
azteca and C. dilutus [31]. The LC50 of 4.57 µg/L is nearly two times
higher than the previously used lowest LC50 of 2.5 µg/L for N. spinipes [22]. The geometric mean of the two new values is 10 µg/L, which is five times lower than the previously used geometric mean of 50 µg/L. For DDD, reported 4-days L(E)C50-values for H. azteca and C. dilutus are 0.82 µg/L and 0.22 µg/L, respectively [31]. This latter value is a factor of 10 lower than the lowest LC50 of 2.4 µg/L for P. duorarum that was used previously. The geometric mean of the new L(E)C50-values for DDD is 0.40 µg/L, which is derived, which is almost 100 times lower than the previously used geometric mean of 38 µg/L.
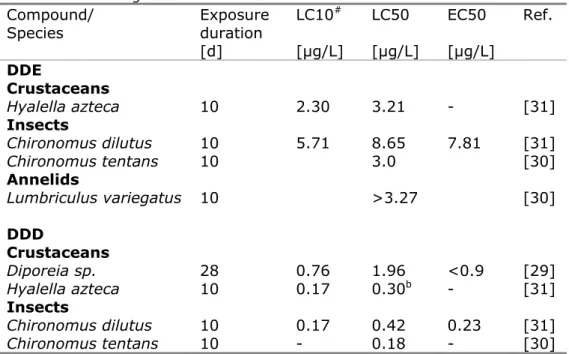
For the long-term tests with DDE and DDD included in the US EPA Ecotox database, only L(E)C50-values are reported. However, from the data included in the above mentioned two references [29,31], LC10-values could be derived for H. azteca, C. dilutus and Diporeia sp. (DDD only). The estimated LC10-values are shown in Table 4, together with the LC50 and EC50-values reported by the authors for the same tests. The geometric mean LC10 is 3.6 µg/L for DDE and 0.40 µg/L for DDD.
Table 4 Chronic aquatic ecotoxicity data for DDD and DDE included in the US EPA Ecotox database, selection from long-term studies (≥ 5 days) in which concentrations were measured. LC10-values were not included in the database, but estimated using data of the authors.
Compound/
Species Exposure duration [d] LC10# [µg/L] LC50 [µg/L] EC50 [µg/L] Ref. DDE Crustaceans Hyalella azteca 10 2.30 3.21 - [31] Insects Chironomus dilutus 10 5.71 8.65 7.81 [31] Chironomus tentans 10 3.0 [30] Annelids Lumbriculus variegatus 10 >3.27 [30] DDD Crustaceans Diporeia sp. 28 0.76 1.96 <0.9 [29] Hyalella azteca 10 0.17 0.30b - [31] Insects Chironomus dilutus 10 0.17 0.42 0.23 [31] Chironomus tentans 10 - 0.18 - [30]
# not included in US EPA Ecotox database, values derived from original reference b: a lower LC50 of 0.19 µg/L for this species is included in the US EPA Ecotox database [23], but no LC10 could be derived from this reference
When considering using these values, some remarks should be made. First of all, similar to DDT it should be noted that EC50-values reported by the authors for Diporeia sp. and C. dilutus are lower than the
corresponding LC50-values, but EC10 values could not be calculated. Furthermore, lower LC50-values were reported for H. azteca as compared to the studies that were used for LC10-estimation. Most important, the endpoints considered here only involve mortality and immobility. Potentially more sensitive endpoints such as growth or reproduction are not included, and the previously used lowest 14-days NOEC of 0.1 µg/L for effects of DDE on reproduction of the marine crustacean N. spinipes is over 20 times lower than the lowest LC10 derived here. This ‘old’ NOEC would most likely be retained, since renewal of test medium was applied. This leads to the conclusion that the LC10-values as derived here might not represent the most sensitive endpoint per taxonomic group.
2.1.2.3 Conclusions on direct ecotoxicity to aquatic organisms
Additional aquatic data are available that may be used for derivation of risk limits for soil by means of equilibrium partitioning. The impact of the additional aquatic data for DDT is likely limited when acute data are used for derivation of the SRCwater, eco, since the geometric mean of the new acute data is similar to the previously derived value (4.4 vs. 4.3 µg/L). The geometric mean of the new chronic data for DDT is lower than used before (0.31 vs. 1.7 µg/L), and the lowest LC10-value from the new data is about a factor of 10 lower than the lowest valid NOEC from the old dataset (0.04 vs. 0.35 µg/L). This would potentially lead to lower SRCwater, eco and MPCwater, eco-values. It should be noted that
potentially sensitive endpoints such as growth and reproduction are not available.
For DDE and DDD, additional aquatic data are available that may be used for derivation of risk limits for soil using equilibrium partitioning. These additional aquatic data may lead to a substantial lower geometric mean L(E)C50. However, in contrast to the dataset for DDT, some of the previously used studies with DDD and DDE might pass the current quality assessment because renewal or flow-through systems were applied. When these higher acute L(E)50-values from the old dataset are retained, the geometric mean and the resulting SRCwater, eco will be higher too and the difference with the old value might be less.
Considering the chronic values, it is noted that relatively low values were found for DDD. The geometric mean LC10 of 0.40 µg/L for DDD based on new data is about a factor of 100 lower than the SRCwater, eco of 38 µg/L that was previously derived on the basis of acute data. In contrast, the additional LC10-values found for DDE are much higher than the previously derived NOEC, and the SRCwater, eco based on the geometric mean NOEC/LC10-values would at least be 10 times higher than before.
At the level of the MPCwater, eco, the impact of the new data is expected to be limited. For DDD, the availability of chronic data would allow for using a lower assessment factor. For DDE, accepting the previously used lowest NOEC of 0.1 µg/L would mean that the MPCwater, eco remains unchanged.
2.2 Assessment of secondary poisoning
2.2.1 Introduction
As indicated above in section 1.4, the question on the relevance of secondary poisoning for soil risk limits has been addressed several times in the past. It was also mentioned in that section that the methodology regarding the treatment of bird and mammal data has been brought in line with European guidance, and that additional guidance has been developed recently. In this chapter, the previous evaluations are briefly summarised and it is investigated if additional data and new guidance will change the conclusions that were drawn previously. Section 2.2.2 summarises the previous assessments from 1991 and 1994, which involved the assessment of a simplified terrestrial food chain (soil worm worm eating bird or mammal) [19,20], and a more complex assessment based on energy demands and including higher predators [32,33]. The assessment using new data is presented in section 2.2.3.
2.2.2 Previous assessments
2.2.2.1 Risks for worm eating birds and mammals
The first evaluation of secondary poisoning of DDT and metabolites in the context of Dutch standard setting for soil was made in an RIVM-report that was published in 1991 by Romijn et al. [20]. In this RIVM-report, an MPCsoil was derived for worm-eating bird and mammals, by dividing the NOEC for birds and/or mammals by a bioconcentration factor (BCF) for worms (nowadays often referred to as Biota to Soil Accumulation Factor, BSAF). Calculations were performed for birds and mammals alone or combined, the NOECs were derived by statistical extrapolation,
using NOECs for individual species. A geometric mean and maximum BSAF for worms of 0.27 and 0.51 kgdwt soil/kgwwt worm were used, based on five datapoints from combined laboratory and field tests and corrected to a standard soil with 10% OM. The results are presented in the table below, taken from the publication based on the 1991-report [19].
Table 5 MPCsoil, secpois derived by Romijn et al. [19,20] using NOEC-data for birds
and mammals and BCF (BSAF)-values for worms. The NOECs for birds and mammals were based on statistical extrapolation. The BSAFs used were 0.27 (geometric mean) and 0.51 kgdwt soil/kgwwt worm, both corrected to standard soil
with 10% organic matter. Table copied from [19].
In the same publication, also an uncorrected geometric mean BCF (BSAF) of 3.29 kgdwt soil/kgwwt worm is presented. This value is based on a much larger dataset of 23 laboratory and field studies with 10 species, individual BSAFs range from 0.09 to 21.9 kgdwt soil/kgwwt worm. Because organic matter content was not reported for all studies, a correction could not be applied.
In 1994, the same dataset was used by Van de Plassche et al. to make the comparison with direct ecotoxicity at the level of the MPC [6,22]. In this report, default BSAFs for worms of 1 and 10 kgdwt soil/kgwwt worm were used. Data for birds and mammals were treated separately as before, but also put into a combined dataset together with data for direct ecotoxicity. The results for p,p’-DDT are shown below in Table 6. For o,p'-DDT, p,p’-DDD, and p,p'-DDE, the MPC for secondary poisoning was not calculated because comparison with direct ecotoxicity could not be made in the absence of data. The final MPCsoil for DDT as well as for DDD and DDE was set at 0.01 mg/kgdwt soil, based on direct ecotoxicity. In 2002, an SRCsoil, secpois of 1.1 mg/kgdwt soil was derived for DDT using combined data on birds and mammals [16].
Table 6 Overview of MPC-values for DDT derived in 1994 [6,22]. All values in mg/kgdwt soil.
MPCsoil, eco MPCsoil, secpois
birds MPCsoil, secpois mammals MPCsoil, secpois birds/ mammals MPCsoil eco + secpois MPCsoil EqP 0.01 0.048 1.7 0.11 0.01 0.0094 2.2.2.2 Foodweb approach
Also in 1994, an RIVM-report was published by Jongbloed et al. in which risk limits for soil were derived for various top predators using a
foodweb approach considering exposure of birds and mammals to different types of food [32]. For this, the bird and mammal toxicity data of Romijn et al. were supplemented with new data. These data were converted to NOECs for top predators applying correction factors for the differences in energy demand and assimilation efficiency between free living and laboratory animals, and differences in caloric content between laboratory food and wild prey. Geometric mean bioaccumulation factors (BAFs) were used to describe the accumulation of DDT from soil by invertebrates and plants, and the accumulation from food by birds and mammals. For earthworms, a geometric mean BSAF of
0.17 kgdwt soil/kgwwt worm is reported, based on six laboratory and field experiments. Further details could not be found in the appendices of the report and associated publication [32,33]. Information on diet
composition and caloric content of food was used to calculate soil-based BAFs for top predators, which were used to back-calculate the NOECs for these species to an MPCsoil. The resulting MPC-values for different food chains and for specific predator species are summarised in the table below, taken from the publication of this work in 1996 [33].
Table 7 MPCsoil, secpois derived by Jongbloed et al. [32,33] using converted
NOEC-data for top predators and BAF-values for different food sources. Table copied from [33].
When comparing the results of the foodweb model of Jongbloed et al. (Table 7) on the one hand with the calculations of Romijn et al. (see Table 5) on the other hand, it can be seen that the foodweb model with top predators results in lower MPC-values than considering only worm eating birds and mammals. For the short food chain, MPC-values are 0.41 and 0.78 mg/kgdwt soil for birds and 14.4 and 27.2 mg/kgdwt soil for mammals, depending on the BSAF used (see Table 5). When extending the worm-based food chain with top predators, the MPC-values are 0.1 and 0.26 mg/kgdwt soil when based on predatory birds and 2.0 and 4.2 mg/kg dwt soil for predatory mammals (Table 7). However, because of the differences in underlying methodology, it is not possible to translate these differences in a simple correction factor that can be used to account for biomagnification to higher food chain levels.
The principle of using energy demand of birds and mammals and caloric content in food to estimate safe levels has been implemented for worm-eating birds and mammals in the risk assessment methodology for the authorisation of plant protection products [34]. The extended foodweb approach has never been officially adopted for deriving risk limits for soil.
2.2.3 Evaluation and additional assessment for DDT and related compounds
2.2.3.1 General methodology
The current methodology for the derivation of an MPCsoil, secpois for worm-eating birds and mammals is described in Van Vlaardingen and
Verbruggen [17] and is based on European guidance [13,15]. Toxicity data for birds and mammals are collected and the results are expressed on the basis of a dietary concentration in mg/kgfd. If the results of a study are presented as a daily dietary dose on the basis of body weight (bw), the corresponding dietary concentration is recalculated using the reported information on food intake and body weight or default
conversion factors. After conversion, the resulting NOEC (sometimes also indicated as a No Observed Adverse Effect Concentration, NOAEC) is divided by the appropriate assessment factor, considering the
duration of the study. This assessment factor also includes a correction for the difference in caloric content of laboratory food as compared to field prey, for which a correction factor of 3 is used. In fact, with this factor it is assumed that in the field a bird or mammal has to eat 3 times as much as compared to the lab to cover its energy demand. The lowest value is used as the MPCoral, bird or MPCoral, mammal, which denotes the concentration in earthworms that will not lead to negative effects on birds and mammals upon life-time exposure. The corresponding concentration in soil is derived by dividing the MPCoral, bird or MPCoral, mammal by an earthworm Biota to Soil Accumulation Factor (BSAF). Derivation of the SRCsoil, secpois is not described, but for the purpose of this report a similar approach is used in which the NOAEC are divided by the appropriate assessment factor, and the geometric mean of these values is used as the SRCoral, bird or SRCoral, mammal. These values are then divided by the BSAF to obtain the corresponding SRCsoil, secpois. Recently, a new methodology was developed for derivation of quality standards to protect (predatory) birds and mammals [21]. The method also builds on an energy based approach, although implemented in a different way than previously. In this new method, the bodyweight of a species is used to estimate its daily energy demand under field
conditions. The toxicity test result is normalised to the energy content of the particular test food. Using information on energy content of different food types in the field, the exposure of birds and mammals can be estimated for various food webs. The method also addresses the factors that are needed to extrapolate from subacute and semi-chronic
exposure to chronic exposure. Furthermore, guidance is given on the use of statistical extrapolation for bird and mammal data. For soil, the major improvement of the method as compared to the standard
approach is that a better correction is applied for the low energy content of earthworms as compared to laboratory food. It has been shown that the default factor of 3 used in the European guidance documents [13,15] is an underestimation for earthworms, for which a factor of 5.2 would be needed (see further below). Unfortunately, the necessary information to apply this new method (body weight, daily food intake and energy content of the test food) is not supplied in the mostly older studies on DDT and metabolites. Using assumptions and defaults to generate the necessary input would mean that considerably uncertainty would be introduced. It was therefore decided not to apply the new methodology, but use the standard method instead.
2.2.3.2 Choice of the BSAF for earthworms
As indicated in section 2.3.2 and 2.3.3, different BSAFs for earthworms have been used in the past, i.e. geometric mean and maximum values of 0.27 and 0.51 kgdwt soil/kgwwt worm for total DDT at 10% OM by Romijn et al. [19,20], default values of 1 and 10 kgdwt soil/kgwwt worm by Van de Plassche et al. [6], and a geometric mean of 0.17 kgdwt soil/kgwwt worm by Jongbloed et al. [32,33]. As already indicated in 2.3.2, an overall BSAF of 3.29 kgdwt soil/kgwwt worm was also reported [19], which is the geometric mean of reliable and less reliable data from laboratory and field studies, without correction for OM content. For the data used by Romijn et al. [19,20] to calculate the OM-corrected BSAF, there seems to be a negative correlation between BSAF and OM content in the laboratory study with freshly contaminated soil, but the BSAF of the other
(field)study does not fit into the observed correlation. Moreover, it was shown that accumulation of DDT and DDE decreases with increased ageing times [35,36], indicating that (laboratory) experiments with freshly contaminated soils may not be representative for deriving a BSAF for historically contaminated sites for which the current risk limits apply. Most field studies cited in Romijn et al. are quite old studies that were performed when the use of DDT was still allowed. These studies may also overestimate the accumulation as compared to the current situation.
For the present assessment, earthworm BSAFs were therefore retrieved from studies in which ageing was taken into account. These are studies in which soil and worms were collected from historically contaminated sites, or in which accumulation from historically contaminated field soil was studied in the lab using worms from a breeding culture (or from an uncontaminated site). Romijn et al. [19,20] cited one single reliable field study on DDT [37]. The BSAFs in this study originate from an
experimental field plot that had been sampled after ageing for 1, 5 and 11 years after contamination. It appeared that this study was continued, and a recent paper reports on the accumulation after 45 years of ageing [35]. Some other field accumulation studies on DDT were retrieved in
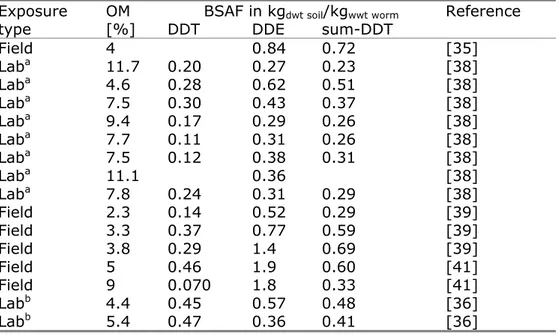
addition [36,38-41], from which BSAFs could be calculated. If residues in worms were reported on a dry weight basis, values were converted to wet weight assuming a generic moisture content for earthworms of 84.3% [34,42]. Lipid-based concentrations reported by Hendriks et al. [41] were converted to wet weight based BSAF-values using the reported fat-content in this study. The available BSAF-values in kgdwt soil/kgwwt worm for DDE and DDT and the sum of all isomers of DDT and metabolites (indicated as sum-DDT) are presented in Table 8 below. If not reported as such, sum-DDT was calculated as the sum of DDE and DDT, multiplying DDE-residues with a factor of 1.1 based on molar mass. The BSAFs are plotted as a function of OM-content in Figure 1.
Table 8 Summary of BSAFs for DDT, DDE and sum-DDT in worms for soils with different organic matter content as reported in the literature. Field = worms sampled from contaminated site, Lab = laboratory exposure of worms to contaminated field soils.
Exposure OM BSAF in kgdwt soil/kgwwt worm Reference
type [%] DDT DDE sum-DDT
Field 4 0.84 0.72 [35] Laba 11.7 0.20 0.27 0.23 [38] Laba 4.6 0.28 0.62 0.51 [38] Laba 7.5 0.30 0.43 0.37 [38] Laba 9.4 0.17 0.29 0.26 [38] Laba 7.7 0.11 0.31 0.26 [38] Laba 7.5 0.12 0.38 0.31 [38] Laba 11.1 0.36 [38] Laba 7.8 0.24 0.31 0.29 [38] Field 2.3 0.14 0.52 0.29 [39] Field 3.3 0.37 0.77 0.59 [39] Field 3.8 0.29 1.4 0.69 [39] Field 5 0.46 1.9 0.60 [41] Field 9 0.070 1.8 0.33 [41] Labb 4.4 0.45 0.57 0.48 [36] Labb 5.4 0.47 0.36 0.41 [36]
a: worms from uncontaminated field site b: worms from breeding culture
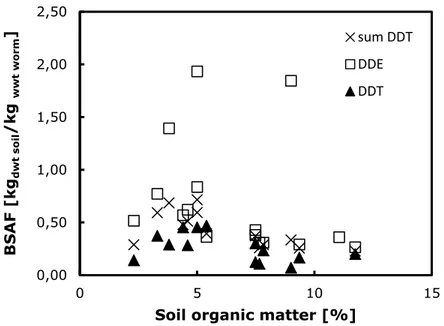
Figure 1 BSAFs for DDT, DDE and sum-DDT in earthworms as a function of organic matter content in soil.
Based on this figure, there is no apparent correlation between soil organic matter content and BSAFs for DDE, due to three relatively high BSAF-values of 1.4 – 1.9 kgdwt soil/kgwwt worm. In the original papers, no obvious explanation could be found on the basis of which these studies should be considered as invalid. However, when omitting the data on DDE and plotting the data for DDT and sum-DDT separately on a different scale, there is a clear tendency of decreasing BSAF with increasing OM content (see Figure 2).
Figure 2 BSAFs for DDT and sum-DDT in earthworms as a function of organic matter content in soil. The same data as used in Figure 1 are plotted using a different scale for the Y-axis.
0,00 0,50 1,00 1,50 2,00 2,50 0 5 10 15 BSAF [kg dwt so il /kg wwt worm ]
Soil organic matter [%]
sum DDT DDE DDT 0,00 0,10 0,20 0,30 0,40 0,50 0,60 0,70 0,80 0 5 10 15 BSAF [kg dwt so il /kg wwt worm ]
Soil organic matter [%] sum DDT DDT
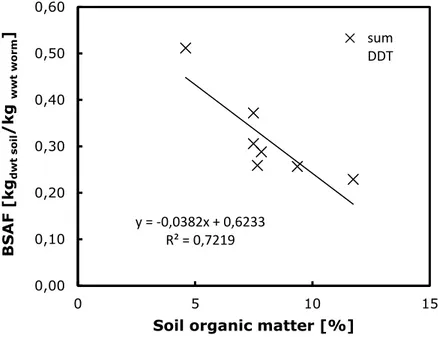
The correlation is even more obvious when looking at the results of a single experiment. Figure 3 shows the BSAFs for sum-DDT as a function of soil OM based on the data of Gaw et al. [38], who exposed worms from an uncontaminated site to contaminated field soils with different OM content.
Figure 3 BSAFs for sum-DDT in earthworms as a function of organic matter content in soil. Data from Gaw et al. [38].
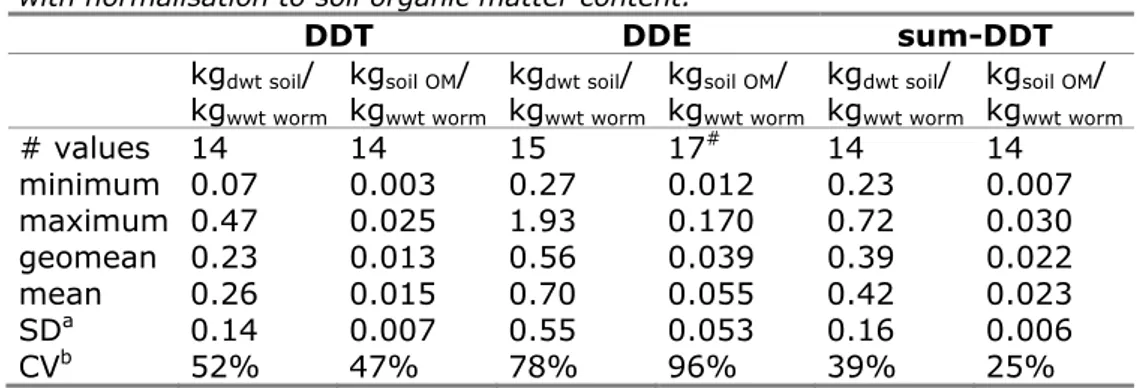
Based on this observation and the generally accepted correlation between OM-content and accumulation, it was decided to normalise BSAFs to OM content. Table 9 presents the summary statistics of the original and normalised BSAFs (in kgsoil OM/kgwwt worm) for DDT, DDE and sum-DDT. In one of the studies [40], DDE concentrations in soil were reported on a wet weight basis and BSAFs in kgdwt soil/kgwwt worm could not be calculated. This study is therefore not included in Table 8, but since organic carbon content was reported, OM-normalised BSAFs could be included in the data summarised in Table 9. Theoretically, additional normalisation to lipid content of worms should also be considered. However, actual lipid content was reported in two studies only [40,41]. Using a default lipid content for the other studies would only change the absolute values, but not decrease the relative differences between soils.
y = ‐0,0382x + 0,6233 R² = 0,7219 0,00 0,10 0,20 0,30 0,40 0,50 0,60 0 5 10 15 BSAF [kg dwt so il /kg wwt worm ]
Soil organic matter [%] sum DDT
Table 9 Summary statistic of BSAFs for DDT and sum-DDT in worms without and with normalisation to soil organic matter content.
DDT DDE sum-DDT kgdwt soil/ kgwwt worm kgsoil OM/ kgwwt worm kgdwt soil/ kgwwt worm kgsoil OM/ kgwwt worm kgdwt soil/ kgwwt worm kgsoil OM/ kgwwt worm # values 14 14 15 17# 14 14 minimum 0.07 0.003 0.27 0.012 0.23 0.007 maximum 0.47 0.025 1.93 0.170 0.72 0.030 geomean 0.23 0.013 0.56 0.039 0.39 0.022 mean 0.26 0.015 0.70 0.055 0.42 0.023 SDa 0.14 0.007 0.55 0.053 0.16 0.006 CVb 52% 47% 78% 96% 39% 25% a: standard deviation b: coefficient of variation
#: data from Hebert et al. [40] could only be used to calculate OM-normalised BSAFs
Based on this analysis, the OM-normalised BSAFs for sum-DDT
represent the most robust estimate of DDT-accumulation in worms. The geometric mean BSAF of 0.022 kgsoil OM/kgwwt worm is used for further calculations.
2.2.3.3 Risks for worm-eating birds
The available data from the 1991-report are presented in Appendix 2, together with additional data from an update in 1994 [32]. In some cases, the lowest dose tested gave a significant effect. In case the effect was 20% or less, the NOEC was derived dividing the Lowest Observed Effect Concentration (LOEC) by a factor of 2. A factor of 3 was used if 20-50% effect occurred. According to present guidance [14,17], deriving a NOEC from a LOEC with <20% effect is still allowed, but the
extrapolation from higher effect percentages is no longer used and these LOEC-data can only be used as supporting information.
The US EPA Ecotox database and the previously mentioned Eco-SSL report [23,24] were consulted to confirm the available data, and to check for additional data on reproduction and growth of birds. Mortality data were not taken into account, since this is not the most sensitive endpoint for toxicity of DDT and metabolites to birds. All potentially relevant studies in the Ecotox database were also included in the Eco-SSL report, and the data from the latter were further explored. Relevant No Observed Adverse Effect Concentrations (NOAEC in mg/kgfd) and No Observed Adverse Effect Levels (NOAEL in mg/kgbw per day) are listed in Appendix 2, Table A2.2. Note that almost all data used previously by RIVM are also included in the Eco-SSL dataset.
From the available data, the lowest value per species for either DDT, DDD or DDE was selected. No molar conversion was applied to express all data on the basis of DDT, because there is no obvious difference in toxicity. Moreover, in some tests a mixture was applied, while for the others it can be assumed that although the test substance was DDT, exposure to metabolites will have occurred due to conversion in the food or in the organisms. Another point is that molar conversion will only have a minor effect.
It appears from Appendix 2 that large differences exist in test results for species for which many studies are available, such as the mallard duck
Anas platyrhynchos, the japanese quail Coturnix japonica and the
chicken Gallus domesticus. For these species, the lowest and highest NOAEL and NOAEC-values may differ an order of magnitude or more. The lowest test results were confirmed by checking the underlying study or its abstract. For example, for the chicken, the lowest test result is a 10-weeks LOEC of 0.1 mg/kgfd for reproduction, based on a significant reduction in the number of chicks per hen by 18, 34 and 38% at 0.1, 1 and 10 mg/kgfd, respectively [43]. In another study with the same duration, no effects on eggshell quality, egg production or hatchability were observed at 100 mg/kgfd (abstract checked) [44]. It is not clear what is the cause for the different results in these studies. One possibility is the use of different DDT analogues and/or different bird breeds. In previous assessments, the geometric mean was taken if for a species multiple test results were available. At present, taking the geometric mean is in general only done for (standard) tests which are performed in a similar way. This is not the case here, and the lowest test result is used for further calculations.
Table 10 lists the resulting NOAEC-data for birds. If for a species only a LOAEL or LOAEC was available and the effect level was <20%, the result is presented as “< LOAEC/2” or “LOAEC/2”. If the effect level could not be checked because the reference (or abstract) was unavailable, the result is given as a <-value.
In the evaluation of 1991 and 1994, an assessment factor of 10 was applied to extrapolate the results from short-term tests to longer durations. According to the current guidance, short-term LC50-values may be used with an assessment factor of 3000, but preference is given to chronic NOEC-values, to which an assessment factor of 30 is applied. The test duration of a chronic reproduction study according to OECD guidelines is at least 20 weeks. The present dataset also contains bird studies that can be considered as short-term (5 d NOEC for Columba
livia) or semi-chronic, i.e. lasting 5 - 15 weeks. The guidance does not
propose assessment factors for these non-standard studies, but since sub-lethal effects are measured, the factor of 30 is considered
appropriate when reproductive parameters have been measured. When the only data for a species refer to body weight (Pelecanus
erythrorhynchos and Phalacrocorax auritus) or histopathology without
measuring actual reproduction (Meleagris gallopavo), a factor of 30 would possibly not be protective, but the higher factor of 3000 is not appropriate either. Choosing a factor in between would mean a rather arbitrary choice. Therefore, the NOAEC-values are used with an assessment factor of 30 to derive an MPCoral, bird per species.
Table 10 Lowest NOAEC-values per species for DDT and metabolites from long-term tests with birds and MPCoral, bird values derived using the default assessment
factor of 30.
Species Exposure
time Endpoint Tested as NOAEC [mg/kgfd] MPCoral, bird AF 30 [mg/kgfd] Anas platyrhynchos 22 w egg shell thinning DDE 1 0.033
Anas rubripes 8 m egg shell
thinning DDE < 5 < 0.17
Colinus virginianus 8 m body weight DDT ≥ 25 ≥ 0.83
Columba livia 5 d testes
degeneration
DDD < 3 < 0.10
Coturnix japonica 5 w progeny counts DDT 5 0.17
Falco sparverius 6 m egg shell
thinning DDE 0.3 0.010
Gallus domesticus 10 w reproduction DDT 0.05 0.0017
Haliaeetus
leucocephalus 55 d body weight DDT < 10 < 0.33 Lonchura striata 6 w progeny counts DDT < 9 < 0.30
Meleagris
gallopavo 15 w reproductive histology DDT 265 8.8
Otus asio 20 m egg shell
thinning DDE 2.8 0.09
Pelecanus erythrorhynchos
10 w body weight sum 72 2.4
Phalacrocorax
auritus 9 w body weight sum 25 0.83 Phasianus
colchicus
11 w egg shell thinning
DDE 10 0.33
Streptopelia risoria 90 d reproduction DDE 5 0.17
Tyto alba 1 y progeny counts DDE < 1.5 < 0.050
Zonotrichia albicollis
6 w body weight DDT < 5 < 0.17 The lowest MPCoral, bird, AF is then 0.0017 mg/kgfd, while based on the geometric mean of the unbound values, the SRCoral, bird AF is 0.16 mg/kgfd.
Taking the MPCoral, bird of 0.0017 mg/kgfd and the BSAF of
0.022 kgsoil OM/kgwwt worm (see section 2.2.3.2), the MPCsoil, secpois, bird, AF is 77 µg/kgsoil OM. The SRCsoil, secpois, bird, AF is 730 µg/kgsoil OM (rounded values). Expressed on the basis of Dutch standard soil with 10% OM, these values are equivalent to 8.0 and 70 µg/kgdwt soil, respectively (rounded values).
Because more than eight species are available, it is reasonable to use statistical extrapolation. For this, the program MOSAIC-SSD was used, which is able to fit SSDs based on datasets with censored data [45]. If SSDs are applied, the original assessment factor of 30 may be lowered. According to the new method [21], when a full correction for caloric content is made, the default correction factor of 3 for the difference in caloric content between laboratory food and field prey can be omitted and a factor of 10 would be put on the lowest NOEC instead of default factors of the TGD and REACH guidance [13,14,17]. For the derivation
of an SSD-based MPC, a default assessment factor of 5 is put on the HC5. Depending on the size and quality of the dataset, stepwise lowering of this factor may be considered. For the SRC, the geometric mean of the NOAECs is taken, and the HC50 is used with an assessment factor of 1. In this case, however, because a full correction for caloric content cannot be made, the above mentioned default factor of 3 should still be applied, i.e. the SSD should be run using the NOAEC-values of Table 10 with an assessment factor of 3.
When doing so using a log-normal distribution, the HC5 (with 95% confidence limits) is estimated as 12.2 µg/kgfd (95% CL 1.6-128) and the HC50 as 824 µg/kgfd (95% CL 204-3104). Using a log-logistic distribution results in similar values. With 17 values the dataset is reasonably large and covers potentially sensitive endpoints. On the other hand, about half of the data are unbound values, which introduces additional uncertainty. Therefore, putting an assessment factor of 3 on the HC5 is considered justified for derivation of the MPCsoil, secpois. This results in an MPCoral, bird, SSD of 4.1 µg/kgfd.
Using this MPCoral, bird, SSD and the BSAF of 0.022 kgsoil OM/kgwwt worm (see 2.2.3.2) the MPCsoil, secpois, bird, SSD is 190 µg/kgsoil OM. The
SRCsoil, secpois, bird SSD is 0.824 / 0.022 = 37.5 mg/ kgsoil OM. These values are equivalent to 20 and 3800 µg/kgdwt soil, respectively, for Dutch standard soil (rounded values). The MPCsoil, secpois, bird, SSD and
SRCsoil, secpois, bird SSD should be interpreted as risk limits for the sum of DDT and metabolites.
Note that the SRC-values are most likely too high and give an underestimation of the risk, because is it not sure if the assessment factors are high enough to cover uncertainties with respect to study duration and endpoints considered and with respect to the extrapolation from laboratory food to field prey. Furthermore, the SRC does not cover biomagnification to higher organisms. This is further discussed in
section 2.2.3.5.
2.2.3.4 Risks for worm-eating mammals
Similar to what is described above, the available data for mammals from the 1991-report and update from the 1994-report [32] are presented in Appendix 3, table A3.1. The previously mentioned Eco-SSL report [24] was consulted to check for additional data on reproduction and growth of mammals. Mortality data were not taken into account, since the evaluation by the US EPA shows that this is not the most sensitive endpoint [24]. Relevant No Observed Adverse Effect Concentrations (NOAEC in mg/kgfd) and No Observed Adverse Effect Levels (NOAEL in mg/kgbw.d) are listed in Appendix 3, Table A3.2. Note that not all data used previously by RIVM are included in the Eco-SSL dataset.
From the available data, the lowest value per species for either DDT, DDD or DDE was selected (see Table 11). In case only a NOAEL was available, the NOAEC expressed as dietary concentration was estimated using (default) values on food intake and body weight. The lowest available NOAEC for the rat from a dietary study is 1 mg/kgfd for reduced ovary weight (reference checked) [46]. However, a 120-days LOAEL of 0.2 mg/kgbw.d was obtained based on 30% reduction in body weight gain [47], which is equivalent to a NOAEC of < 1 mg/kgfd.
A 10-fold lower LOAEL of 0.02 mg/kgbw.d could not be verified because the abstract could not be retrieved. The data for rhesus monkeys
(Macaca mulatta) reported by Jongbloed et al. [32] were not included in the Eco-SSL report. The LOAEL of 5 mg/kgbw.d for the squirrel monkey
Salmura sclureus [48] was verified from the study abstract, but because
only mortality was assessed in this study the result is not included here. The results for the rhesus monkey could be verified: absence of
mortality and clinical signs at 200 mg/kgfd (equivalent to
6.6 mg/kgbw.d), but reproduction was not assessed in this study [49]. Considering the duration of the tests, an assessment factor of 30 should be used according to the current guidance [13,14,17].
Table 11 Lowest NOAEC-values per species for DDT and metabolites from long-term tests with mammals and MPCoral, mammal values derived using the default
assessment factor of 30.
Species Exposure
time Endpoint Tested as NOAEC [mg/kgfd]
MPCoral, mammal AF 30
[mg/kgfd]
Canis familiaris 3 gen age at
puberty DDT 11 0.37
Macaca mulatta 7.5 y clinical signs DDT 200 6.7
Mesocricetus
auratus 72 w body weight DDE 500 17 Mus musculus 120 d fertility DDT < 7 < 0.23
Oryctolagus cuniculus
116 d progeny counts
DDT 25# 0.83
Ovis aries 9 m progeny
counts DDT 10 0.33 Peromyscus polionotus 15 m progeny counts DDT 18# 0.60
Rattus norvegicus 120 d body weight DDT < 1# < 0.033
# recalculated from dietary dose using information in Eco-SSL report [24].
In view of the fact that the lowest values of the dataset are <-values, it is considered not appropriate to only use the next higher bound values for risk limit derivation. Therefore, the program MOSAIC-SSD was used. In accordance with the procedure for birds, a log-normal distribution was fit to the NOAEC-values from Table 12, using an assessment factor of 3 instead of 30.
The HC5 is estimated as 126 µg/kgfd (95% CL 16.1 - 1566) and the HC50 as 4549 µg/kgfd (95% CL 962 - 22087). Assuming a log-logistic distribution results in similar values. In this case, because the number of datapoints is low and the spread around the HC-estimates is large, the highest assessment factor of 5 is used for derivation of the MPCsoil, secpois. This results in an MPCoral, mammal, SSD of 25.2 µg/kgfd. Using the BSAF of 0.022 kgsoil OM/kgwwt worm (see 2.3.4.2) the MPCsoil, secpois, mammal, SSD is 1150 µg/kgsoil OM. The SRCsoil, secpois, bird SSD is 4.5 / 0.022 =
205 mg/kgsoil OM. Expressed on the basis of Dutch standard soil with 10% OM, this is equivalent to 120 and 21000 µg/kgdwt soil, respectively (rounded values).
The MPCsoil, secpois, mammal, SSD and SRCsoil, secpois, mammal SSD should be interpreted as risk limits for the sum of DDT and metabolites.
![Table 5 MPC soil, secpois derived by Romijn et al. [19,20] using NOEC-data for birds and mammals and BCF (BSAF)-values for worms](https://thumb-eu.123doks.com/thumbv2/5doknet/3032464.7789/25.892.181.805.446.692/table-secpois-derived-romijn-using-noec-mammals-values.webp)
![Table 7 MPC soil, secpois derived by Jongbloed et al. [32,33] using converted NOEC- NOEC-data for top predators and BAF-values for different food sources](https://thumb-eu.123doks.com/thumbv2/5doknet/3032464.7789/26.892.172.624.857.1128/table-secpois-derived-jongbloed-converted-predators-different-sources.webp)