PFOA measurements in blood
Measurements in the serum of people living near DuPont/Chemours in Dordrecht
Colophon
© RIVM 2017
This publication may be quoted from on the condition that the source is acknowledged: The National Institute for Public Health and the
Environment (RIVM), the title of the publication and the year of publication.
DOI 10.21945/RIVM-2017-0113
R. Van Poll (author), RIVM E. Jansen (author), RIVM R. Janssen (author), RIVM
This report was compiled using contributions by (in alphabetical order): R. Bos (author),RIVM
C. Kenens (author), Healthcare and Youth Care Agency for the Zuid-Holland Zuid region [Dienst Gezondheid en Jeugd Zuid-Zuid-Holland Zuid] M. Kraaij(author), RIVM
J. Pennings (author), RIVM
J. van Veelen (author), Healthcare and Youth Care Agency for the Zuid-Holland Zuid region [Dienst Gezondheid en Jeugd Zuid-Zuid-Holland Zuid] A. Wijmenga – Monsuur (author), RIVM
M. Zeilmaker (author), RIVM Contact person:
ric.van.poll@rivm.nl
This research was commissioned by the provincial government of Zuid-Holland, within the framework of RIVM project E/121022/01:
Verification/Sampling
Published by:
National Institute for Public Health and the Environment
PO Box 1 3720 BA Bilthoven The Netherlands
Synopsis
PFOA measurements in blood
Measurements in serum in residents around DuPont/Chemours in Dordrecht, The Netherlands.
RIVM has measured PFOA blood values in residents in two zones around the chemical factory DuPont/Chemours. The results show that these measured blood values correspond well with the calculated values in an earlier study in 2016 on the emission of PFOA by DuPont/Chemours. These findings support the conclusion of the earlier study that it is likely that residents around Dupont/Chemours have been chronically exposed to high values of PFOA.
Residents who live for a long time in the vicinity of the plant have higher blood values than residents who live further away from the plant or for a shorter period of time. The latter two groups show serum PFOA values corresponding to background values such as those found in European studies (3.5 ng/ml). Some of the residents (4.7%) have higher blood values than expected in view of the European studies.
From a sample of residents of the municipalities of Dordrecht, Sliedrecht and Papendrecht people were invited to participate. A blood sample was taken from a total of 382 local residents (response 58%) in the autumn of 2016. In this blood sample, the content of PFOA was determined. Participants who wanted to know their PFOA levels were informed about their individual PFOA blood value.
This study was conducted by RIVM in collaboration with the Service Youth and Health, South Holland South. The study was commissioned by the Province of South-Holland. At the same time a literature review on effects of PFOA on humans will be issued.
Publiekssamenvatting
PFOA-metingen in bloed
Metingen in serum bij omwonenden van DuPont/Chemours te Dordrecht Het RIVM heeft in twee zones rondom de chemiefabriek
DuPont/Chemours in Dordrecht gemeten hoeveel PFOA in het bloed van omwonenden zit. Deze gemeten bloedwaarden komen goed overeen met de waarden die in 2016 zijn berekend als gevolg van de uitstoot van deze stof. Daarmee ondersteunen de bevindingen de conclusie van het onderzoek uit 2016 dat bewoners in de omgeving van de fabriek DuPont/Chemours waarschijnlijk langdurig aan hoge waarden PFOA zijn blootgesteld.
Bewoners die lang en dicht bij de fabriek wonen, hebben hogere
waarden PFOA in hun bloed dan bewoners die verder weg of minder lang in de omgeving wonen. De bloedwaarden van de laatste twee groepen komen overeen met waarden zoals die in algemene zin voor mensen zijn gevonden in Europees onderzoek (de zogeheten achtergrondwaarden; 3,5 nanogram PFOA per milliliter serum). Een deel van de omwonenden (4,7 procent) heeft hogere bloedwaarden dan verwacht op basis van het Europees onderzoek.
Voor de steekproef zijn omwonenden uit de gemeenten Dordrecht, Sliedrecht en Papendrecht uitgenodigd. Zij zijn onderverdeeld in vier groepen: mensen die lang en dicht bij de fabriek wonen, mensen die verder weg wonen, en een groep die na 2002 in het gebied kwam wonen toen de uitstoot van PFOA was afgenomen. Ten slotte is een
controlegroep uitgenodigd van mensen die buiten het gebied wonen en dus niet zijn blootgesteld. Van de genodigde omwonenden nam
64 procent deel, van de controlegroep was dat 37 procent. Gemiddeld is dat een opkomst van 58 procent. In totaal is bij 382 omwonenden een bloedmonster afgenomen en is daarin het gehalte PFOA bepaald. Omwonenden die dit op prijs stelden zijn via een brief over hun bloedwaarden geïnformeerd.
Dit onderzoek is door het RIVM uitgevoerd, in samenwerking met de Dienst Gezondheid en Jeugd Zuid-Holland Zuid (de regionale GGD), in opdracht van de provincie Zuid-Holland. Tegelijk met dit onderzoek verschijnt onder andere een literatuurstudie over de effecten van blootstelling aan PFOA op de mens.
Contents
1 Introduction — 9
1.1 Reason/background — 9
1.1.1 What was investigated in 2015/2016? — 9
1.1.2 Which questions had remained unanswered? — 11 1.2 Purpose — 12
1.3 PFOA serum values used — 12
2 Methods and execution — 13
2.1 Research organisation — 13 2.2 Research structure/design — 13 2.2.1 Exposure and research area — 13 2.2.2 The research groups — 14
2.2.3 Criteria for participation — 15
2.2.4 Medical-ethical assessment of the research protocol — 16 2.2.5 Random sample size — 16
2.2.6 Eventual group size of random sample — 17 2.3 Recruitment — 17
2.4 Data check — 18 2.5 Blood samples — 18
2.6 Analysis of PFOA in serum — 19 2.7 Statistical analyses — 19
3 Results — 21
3.1 Background information — 21 3.1.1 Response — 21
3.1.2 Demographic data — 21
3.2 Chemical analyses control — 22 3.3 PFOA blood values — 23
4 Discussion, Conclusions and Recommendation — 27
4.1 Discussion — 27
4.1.1 Comparison of calculated and measured values — 27
4.1.2 Comparison of measured values with known background values — 27 4.2 Conclusion — 29
5 Annexes — 31
5.1 Information for participants in PFOA random sample-blood analysis — 31 5.2 Consent form for participants in the PFOA blood analysis — 35
1
Introduction
1.1 Reason/background
In September 2015 reports about emissions of PFOA
(PerFluoroOctanoicAcid) near a factory of the chemical giant DuPont in the American city of Parkersburg (West Virginia, C8 study) led to disquiet in the Netherlands. There was particular concern around the DuPont/Chemours factory in Dordrecht regarding the emission and the possible effects of PFOA from DuPont/Chemours.
Eventually, questions were raised in the Dutch House of
Representatives.1 Following these questions, the State Secretary of the Ministry of Infrastructure and the Environment (IenM) commissioned RIVM to investigate which concentrations of PFOA in air and water could have resulted in the emissions from the DuPont factory in Dordrecht and to use this as a basis to estimate possible health risks. This was
investigated in 2015/2016.2
1.1.1 What was investigated in 2015/2016?
In this investigation, mathematical models were used to examine the exposure to PFOA and the blood values of PFOA in residents in an area around the factory. People can be exposed to PFOA by consuming food and drinking water and by breathing in air which contains PFOA.
Because PFOA can accumulate in the human body, the study considered exposure in the past and therefore throughout the entire period of emissions (1970-2012). The exposure via drinking water was
determined using recent measurement data of PFOA in drinking water in Dordrecht ('sampled directly from the tap'). These drinking water
concentrations were not higher than in other areas of the Netherlands, which could be explained by the fact that the drinking water in
Dordrecht and Sliedrecht comes from locations which are unaffected by ground or surface water which might be contaminated with emissions. This is in contrast with the American situation in West Virginia, where the concentrations in drinking water in a relatively large area were higher by approximately a factor of 1,000 compared to the Dutch situation. The exposure via food was determined on the basis of the underlying background exposure as established for the Netherlands in 2009.3
The exposure via air was determined by converting the emissions into air concentrations for an inhaled quantity. The concentrations in the air were then adjusted for the penetration of PFOA aerosol particles from the outside air to the indoor air. At the time of the 2016 study, emission data were only available for the DuPont/Chemours factory in Dordrecht for the 1998-2012 period. There were no emissions after 2012.
RIVM performed this study using model calculations of the exposure to PFOA in the air. The RIVM report entitled ´Risicoschatting emissie PFOA 1 Appendix Proceedings II 2015/16, nos. 421 and 422.
2 Zeilmaker, M. et al. (2016). Risk assessment of PFOA emissions for local residents at Location: DuPont/Chemours, Dordrecht, the Netherlands. RIVM Letter report 2016-0049.
3 C.W. Noorlander, J.D. te Biesebeek, S.P.J. van Leeuwen, M.J. Zeilmaker (2010). Intake of PFOS and PFOA from food and drinking water in The Netherlands. RIVM Letter report 320126001/2010.
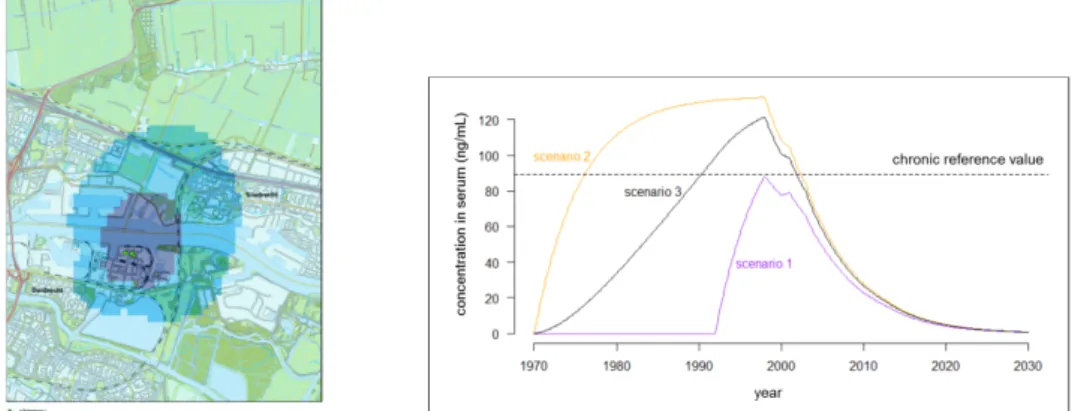
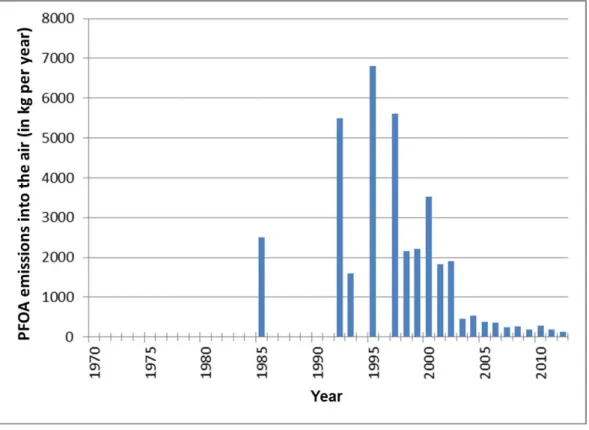
voor omwonenden´ [Risk assessment of PFOA emissions for local residents]' from 20162 revealed that people living near the DuPont chemicals factory from 1970 to 2012 were exposed to PFOA in the air. RIVM calculated that people who had lived close to DuPont for a long period of time may have had a higher than desirable quantity of PFOA in their blood for several years (Figure 1). After 2002 the quantity of PFOA which DuPont emitted into the air decreased significantly, leading to lower blood contents, according to the calculations. After 2012 no PFOA at all was emitted into the outside air (Figure 2).
Figure 1 Research area around DuPont/Chemours in Dordrecht (left section of Figure 1). Model simulation of the long-term development of the PFOA
concentration (ng/ml) in the serum of local residents in the inner contour (dark blue) during the period 1970-2030 as a consequence of inhaling PFOA in three different exposure scenarios. Dotted line: lifelong health-based threshold value for PFOA in serum (right section of Figure 1).
On the basis of the model calculation the expectation was that the blood value of residents living close to the factory (inner contour, dark blue) would be 10 ng/ml higher in 2016 compared to the background value. As regards the light blue zone (outer contour, light blue) there was an increase of 5 ng/ml compared to the background value.
Since the publication of the above report in March 2016 additional emission data have become available.4 This has created a more
complete picture of the emissions of PFOA by Dupont/Chemours during the past 20 years. As can be seen in Figure 2, there are still several years for which no emission data are available.
This additional data raises the question of whether the 2016 calculations needed to be reanalysed. On the basis of the findings of the TNO report entitled ‘Archiefonderzoek historische emissies DuPont Dordrecht’ [Archive research relating to historical emissions from DuPont
Dordrecht], namely that the PFOA emissions were approximately 5 tons per year in the 1990s, it was concluded that this was properly reflected in the chosen approach used in one of the three scenarios in the RIVM risk assessment (2016) (scenario 2: 5 tons per year throughout the
4 Koch R. et al. (2016). Archive research relating to historical emissions from DuPont Dordrecht [Archiefonderzoek historische emissies DuPont Dordrecht]. TNO report.
entire period before 1992). A reanalysis of the calculations from 2016 was not required.
Figure 2 PFOA emissions into the air in kilograms per year for several years throughout the period 1970-2012 (TNO, 20174; RIVM 20162). PFOA was still emitted into the air during the other years (1970 up to and including 1984, 1986 up to and including 1991, 1994 and 1996), but the quantity is unknown. The data from before 1999 is based on historical emissions4.
1.1.2 Which questions had remained unanswered?
In a letter of March 2016 to the Dutch House of Representatives5 in which the State Secretary of Infrastructure and the Environment informed the Dutch House of Representatives about the above-mentioned research, she indicated how she wanted to process the recommendations in the RIVM report. One of the recommendations concerned a 'collection of blood samples from randomly selected people who lived nearby the factory to check the outcomes of the computational model used' (a so-called 'verification exercise'). The provincial government of Zuid-Holland became the commissioning party, and the research assignment came about in collaboration with, and with financing from, the Ministry of Infrastructure and the Environment and the three municipalities involved, namely Dordrecht, Papendrecht and Sliedrecht. The research was carried out by RIVM in collaboration with the Healthcare and Youth Care Agency [Dienst Gezondheid and Jeugd (DG&J)] in Dordrecht and started in May 2016.
1.2 Purpose
By carrying out the blood analysis, RIVM and the DG&J wanted to find out whether the model calculations from 2016 correspond to the serum values measured in the current study.
The research questions are as follows:
• Question 1: To what extent do the measured PFOA contents in the blood (serum) of the local residents (near the DuPont factory in Dordrecht) correspond to the values calculated in the RIVM exposure model?
• Question 2: Are the PFOA contents measured in the blood (serum) of these local residents higher than those of a control population living elsewhere and therefore not exposed to PFOA in the air?
The blood values of PFOA measured during this study are a reflection of all sources of exposure to PFOA.
In addition, it will be indicated how the measured values relate to the underlying levels referred to in the literature. The term background value means the quantity of PFOA in the blood of local residents that would be expected if the factory had not emitted any PFOA.
1.3 PFOA serum values used
On the basis of the model calculation from 2016 the expectation is that the blood value of residents living in the vicinity of the factory (inner contour, dark blue) in 2016 would be 10 ng/ml higher compared to the background value. As regards the outer contour (light blue zone) the increase is 5 ng/ml compared to the background value.
European studies have been carried out in which the background value of PFOA in serum is determined. ECHA has analysed a number of European studies together. The current study was structured on the basis of the (average median) background value of 3.5 ng/ml (range 1.4 - 6.8 ng/ml) which was revealed by this European research by ECHA6. In their analysis an average was also determined of all maximum values measured in the various European studies. This average was 21 ng/ml (range 6.2 - 100 ng/ml).
The point of departure for the current study is, therefore, that the background value for adults in the Netherlands is also 3.5 ng/ml and that a variation in PFOA values can be expected with maxima of up to 21 ng/ml. This background value and expected variation were used to determine the necessary group size for the current study.
6 ECHA/RAC (2015) ECHA/Committee for Risk Assessment (RAC)/Committee for Socio-Economic Analysis (SEAC), Opinion on an Annex XV dossier proposing restrictions on perfluorooctanoic acid (PFOA), its salts and PFOA-related substances, ECHA/RAC/RES-O-0000006229-70-02/F, ECHA/SEAC/RES-O-0000006229-70-02/F, compiled version prepared by the ECHA Secretariat of RAC’s opinion (adopted 8 September 2015) and SEAC’s opinion (adopted 4 December 2015).
2
Methods and execution
2.1 Research organisation
The provincial government of Zuid-Holland commissioned the research together with the municipalities involved, namely Dordrecht,
Papendrecht and Sliedrecht and the Ministry of Infrastructure and the Environment.
The assignment was carried out by a team of researchers from RIVM in cooperation with the Healthcare and Youth Care Agency [Dienst
Gezondheid and Jeugd (DG&J)] in Dordrecht.
A sounding board group was consulted several times during the research. The purpose of the sounding board group was to discuss progress of the research and answer any research-related questions. The participants in the sounding board group were residents (one from each of the municipalities), representatives from the municipalities, the provincial government and national government, a representative from Chemours7 and a representative from the DG&J.
Finally, internal and external experts added comments to, and discussed a draft report by RIVM.8
2.2 Research structure/design
2.2.1 Exposure and research area
The research groups were put together on the basis of the data from the 2016 study. This involved an assessment of the period during which the participants lived in the area close to Dupont/Chemours. The factory in Dordrecht emitted PFOA from 1970 up to and including 2012. From 2002 onwards the quantity of PFOA emitted by the factory clearly decreased (see Figure 2).
As regards the distance between people's homes and the factory a distinction was made between a zone close to DuPont (inner contour, dark blue area, see Figure 3) where people may have been exposed to larger quantities for a longer period of time, and a zone further away from DuPont (outer contour, light blue area, see Figure 3) where people were exposed to smaller quantities. The emissions from the factory were also characterised by a period during which they were relatively high, namely from 1970 up to and including 2002 (see Figure 2) and a period during which they were relatively low, from 2003 up to and including 2012. PFOA emissions stopped after 2012.
7 Up until 2012 the production of certain fluoropolymers containing PFOA was in the hands of DuPont.
Chemours has been responsible for the production of these polymers since 2015 (July). Chemours has indicated that, since 2013, PFOA has no longer been used in the production of these polymers, having been replaced by so-called GenX technology. https://www.chemours.com/Dordrecht-Plant/nl_NL/assets/downloads/pdf/2016-0511-meest-gestelde-vragen.pdf.
8 A draft version of the report has been read and commented on by Prof. Martin van den Berg, IRAS, Utrecht University; Dr Paul Scheepers, Radboud University Medical Center, Radboud University Nijmegen. In addition, the draft version was discussed by the authors on 14 March 2017 with Prof. Greet Schoeters, VITO/ University of Antwerp, Dr Irma de Vries, NVIC; and Prof. Erik Lebret and Dr Joke Herremans, both from RIVM.
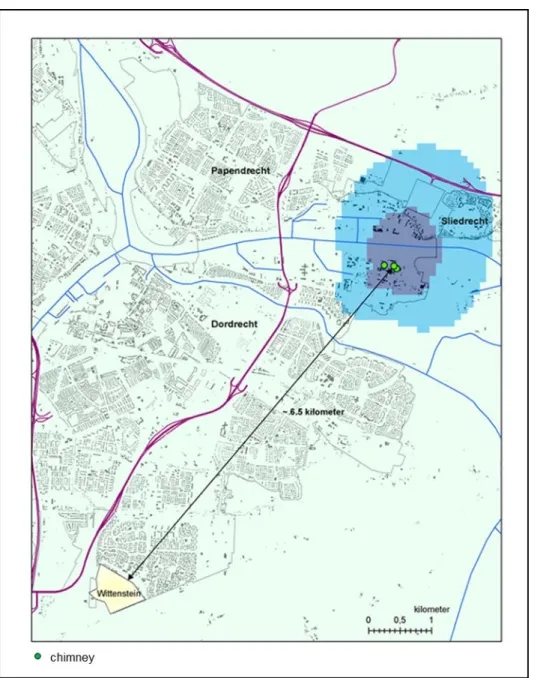
The control area was in a region where no PFOA exposure of note occurred, at a distance of 6.5 km from the DuPont/Chemours factory (Wittenstein, see Figure 3).
Figure 3 Overview map of the research area around DuPont in Dordrecht and the control area. It should be noted that parts of the research area were also in the municipalities of Sliedrecht and Papendrecht. In the research area a distinction is made between two areas: an area close to the factory (inner contour, dark blue) and an area slightly further away from the factory (outer contour, light blue).
2.2.2 The research groups
On the basis of emissions, the distance between people's homes and the factory, and the period of time people lived in the area, four groups of local residents were defined from which residents were selected for blood analysis:
1. People who lived inside the dark blue contour on and before 1-1-2003 and still lived there at the time of the research (inner contour, dark blue, Group 1).
2. People who lived inside the light blue contour on and before 1-1-2003 and still lived there at the time of the research (outer contour, light blue, Group 2).
3. People who came to live in the light or dark blue contour (the research area) after 1-1-2003 and who are expected to have been exposed to relatively low quantities of PFOA (Short-term residents, Group 3).
4. People who live in the Wittenstein neighbourhood, which is an area where no PFOA exposure via Dupont is expected, used as the control area (Control, Group 4).
See Figure 3.
2.2.3 Criteria for participation
A number of inclusion and exclusion criteria were used for participation in the research.
Inclusion criteria
A potential participant could participate in the study if s/he met the following criteria:
• 18 years of age or older;
• had received a personal invitation and could provide proof of identity;
• had understood the participant information and was legally capable.
Exclusion criteria
Any potential participant who met one of the following criteria was excluded from participating in the study:
• if they suffered coagulation-related problems (in other words, registered for check-ups with the thrombosis service
[Trombosedienst]);
• if they were a Dupont employee.
Apart from the question of whether and when participants had worked at Dupont/Chemours, no additional questions were asked about the rest of the participants' employment history. It is therefore possible that some of the participants had never been employed by Dupont/Chemours, but were employed on the factory site.
2.2.4 Medical-ethical assessment of the research protocol
The research protocol was not governed by the Medical Research (Human Subjects) Act (WMO). Research is governed by the WMO9 if it fulfils the following two conditions:
1. the research is medical and scientific in nature and; 2. people are subjected to activities or if rules of conduct are
imposed on them.
This research was intended to determine whether the PFOA contents in the blood of local residents are comparable with the values calculated in the exposure model. No health questions were asked and, at this
moment in time, no relationship can be established between values found and health. This means that the requirement that the research objective should be to answer the question relating to illness and health has not been met. All this means that, although the research is scientific research, it is not medical scientific research. The failure to meet this first condition means that the research is not subject to the WMO and has not been submitted to the medical and ethical reviewing committee [medisch ethische toetsingscommissie] (METC) for medical-ethical assessment.
However, the research was carried out using a statistically substantiated research protocol, participant information and permission procedure.
2.2.5 Random sample size
Calculations were carried out to determine the minimum random sample size on the basis of data from other European countries (see paragraph 1.3), about the PFOA background values in blood serum and the
variation.
1. Inner contour, dark blue, Group 1 The following assumptions were used:
• A background value of 3.5 ng/ml and variation with maximum value of 21 ng/ml (see paragraph 1.3).
• The PFOA serum concentration modelled by RIVM2 indicates that this is 10 ng/ml higher compared to the background value. This corresponds to 13.5 ng PFOA/ml measured value in blood. • 95% power to demonstrate this difference (10 ng/ml) in
conjunction with p < 0.05. This means 95% probability of finding a difference based on an assessment with a 95% reliability interval.
On the basis of this set-up the number of 22 participants had sufficient statistical power.
2. Outer contour, light blue, Group 2
In this case the same assumptions were used as for Group 1, with the difference being that the assumption for this group was an increase of 5 ng PFOA/ml (measured value in the blood is 8.5 ng/ml) which was calculated for the outer ring in 2016.
On the basis of this set-up the number of 161 participants had sufficient statistical power.
3. Short-term residents (Group 3) and 4. Control (Group 4)
For each of these groups the point of departure was that at least 50 residents should take part.
2.2.6 Eventual group size of random sample
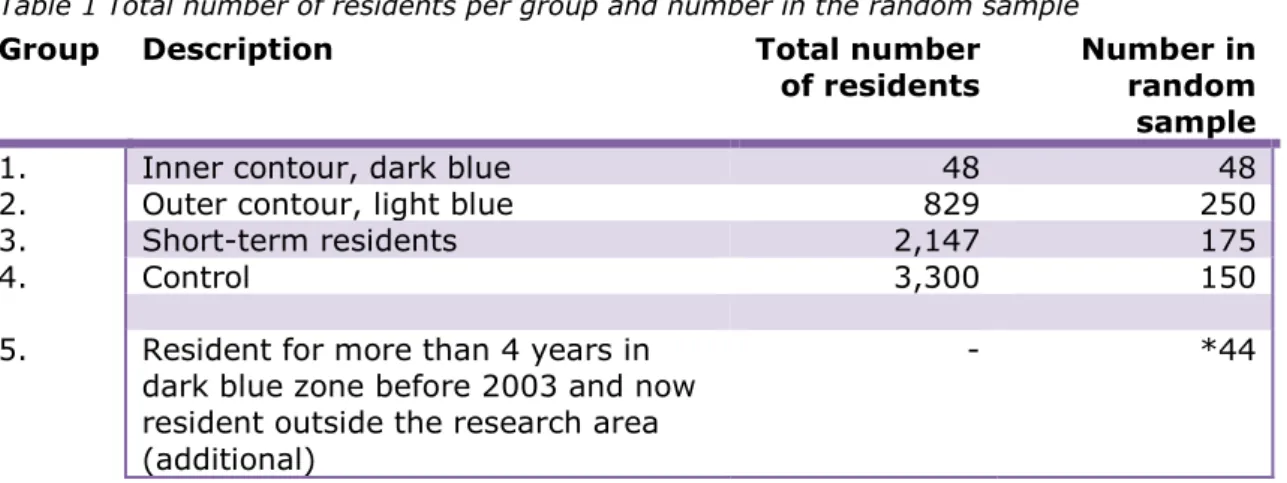
At the time that the research was carried out, during the summer and autumn of 2016, 3,024 people aged 18 and older were living in the research area (inner and outer contour, dark and light blue area). The actual number of residents per area and the required number of participants per group resulted in the sampling shown in Table 1. In the first instance a total of 623 residents were invited to provide a blood sample.
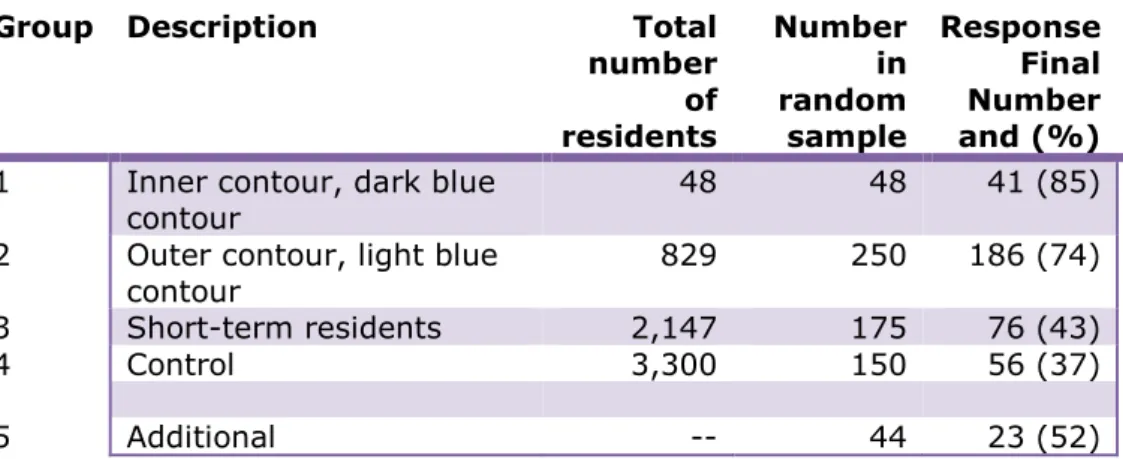
Table 1 Total number of residents per group and number in the random sample
Group Description Total number
of residents Number in random sample
1. Inner contour, dark blue 48 48
2. Outer contour, light blue 829 250
3. Short-term residents 2,147 175
4. Control 3,300 150
5. Resident for more than 4 years in dark blue zone before 2003 and now resident outside the research area (additional)
- *44
*When putting together the groups it was clear that the target number of 50 participants in Group 1 would not be achieved. The reason for this is that there were only 48 people in the group in question. It was decided to check whether it would be possible, to find former residents of the inner contour, or dark blue contour (area of residence of Group 1) who were now living outside the research area and who would be prepared to participate in the study, without affecting its results They had to have lived in the area of the inner contour for a minimum of 4 years, prior to 2003. These people were found in the three municipalities and 44 of them were invited to participate in the research (Group 5). If the outcomes (median values) of this group did not differ from Group 1, the groups would be combined. In the event of differing data, Group 5 would be analysed as a separate group.
2.3 Recruitment
Name and address details were obtained from the Personal Records Database [Basis Registratie Personen] (BRP) of all people aged 18 and older who live in the four areas four areas. From this a random sample was taken from each area as described above. The DG&J sent all the selected people a personalised information letter and participant information (see Annex 1).
Potential participants were able to make an appointment online or by telephone to participate in the study. During this initial contact by telephone, a number of inclusion and exclusion criteria were assessed (exclusion: employed (in the past) at DuPont, use of anti-coagulants, see paragraph 2.2.3).
During the blood collection appointment, the participants were informed about the study, inclusion and exclusion criteria were checked and participants gave written permission for the study. A maximum of 16 ml of blood was taken and participants filled in an online questionnaire regarding a number of personal details (gender, age, height, weight), duration of residence, duration of employment, work environment, smoker/non-smoker and the location of the home in relation to the factory.
The blood collection period was between September and mid-November 2016. For participants from the study area this was from 5 to 13
September, for the control area this was 4 and 5 October and for the additional group this was 9 November.
2.4 Data check
When the participants' information was checked it transpired that a number of people had not been categorised into the correct research group: 6 people from Group 2 turned out to belong in Group 1 (Group 1 from 23 + 6 to 29).
The additional recruitment resulted in 23 participants for Group 5. A first analysis of the blood values revealed that the blood values of the people from the additional recruitment were systematically lower than those of the residents from Group 1. This led to the conclusion that this addition would affect the research result and these blood values were therefore not included in the answers to the research questions. The values of this Group 5 are presented separately in this report.
In addition, on the basis of additional information about emissions, from the ‘Archief onderzoek historische emissies’ [Historical emissions
research archive]4, it was decided to designate residents who had lived, in the period from 1 January 1999 - 1 January 2003, in the inner
contour, or dark blue contour, on the basis of exposure; see Figure 2. These residents were added to Group 1.
This brings the total number of residents in Group 1 to 41 (29 + 12, see also Table 2).
2.5 Blood samples
At three locations in Dordrecht and Sliedrecht experienced DG&J employees took blood from the participants and stored it in two 10 ml coagulation tubes. A preprinted label was attached to each tube bearing the participant's number. After blood collection, the samples were stored at 4-8 oC until they were transported by car to RIVM in Bilthoven. The temperature of the samples during transportation was between 4-15 oC. RIVM received the tubes, together with the corresponding, preprinted labels with only the participant's number. The tubes were immediately centrifuged to produce serum in a centrifuge (Heraeus Sepatech, Megafuge 1.0) at 3,200 revolutions/min (corresponds to 3,300 g) for a period of 15 min. The serum fraction (on top) was then divided into a maximum of 8 portions of 1 ml in polypropylene tubes with screw caps. Then the tubes were stored in a freezer at -80 oC until they were
transported to the laboratory for analysis. The temperature of the freezer was continuously monitored by automatic temperature registration with an alarm function as used at RIVM.
2.6 Analysis of PFOA in serum
The serum samples (1 tube with 1 ml serum per participant) were transported by DHL, to a laboratory in Prague (Metrological and Testing Laboratory, University of Chemistry and Technology, Prague; Testing laboratory 1316.2 accredited by the Czech Accreditation Institute, in four batches,). The samples were packed for transport in a tempex box with dry-ice. The samples had been received in Prague within 24 hours after having been sent.
The laboratory in Prague used an LC-MS-method for the analysis of PFOA. The method is described in Annex 5.3.
The concentrations of PFOA were reported in ng/ml serum, without correction for lipids. The detection limit for PFOA was 0.05 ng/ml. In order to verify the high values and to carry out a comparison with the results of the laboratory in Prague, 30 samples were sent for PFOA analysis to a laboratory in Bremen (Medizinisches Labor Bremen, Haferwende 12, 28357 Bremen). All the high samples (PFOA >20
ng/ml), several duplicate samples and a number of samples with various concentrations across the range from 0-20 ng/ml were sent out for analysis.
2.7 Statistical analyses
In order to compare demographic data (gender, age, weight, height, BMI and smoker/non-smoker) between the research groups a chi-squared test (gender, smoker/non-smoker) and a 'One-way ANOVA' (age, weight, height, BMI) were used. In order to correct for multiple testing, the acquired p values were corrected to the 'Benjamini-Hochberg False Discovery Rate' (FDR).
In the case of the PFOA concentrations, a so-called 'normal probability plot' was used to determine whether there was a (log) normal
distribution.
In addition, the values of the participants in the inner contour (dark blue area) and outer contour (light blue area) (Group 1 and Group 2) were compared with the values calculated in the RIVM study from 2016, namely 13.5 and 8.5 ng/ml.
The Short-term residents and the Control group were compared with the European reference value of 3.5 ng/ml (question 1).
The PFOA concentrations (median values) in the four groups were compared in pairs using Mann-Whitney U tests.
• Inner contour, dark blue with Outer contour, light blue. • Inner contour, dark blue with Short-term residents. • Inner contour, dark blue, with Control.
• Outer contour, light blue with Short-term residents. • Outer contour, light blue with Control.
• Short-term residents with Control. (question 2).
In addition, a unilateral test was performed for each comparison to determine whether the former group has a higher median value than the second group. (In order to correct for multiple testing, a Bonferroni correction was made to the p values obtained).
3
Results
3.1 Background information
3.1.1 Response
Letters were sent to a total of 667 residents: 473 in the study area, 150 in the control group and 44 additional. Ultimately a blood sample was taken from 382 people. That is an overall response of approximately 57%, see Table 2.
The definitive response is shown in the column furthest to the right of Table 2. The total number of blood samples that will be used to answer the research questions is 359 (totals of groups 1, 2, 3 and 4; 58%).
Table 2 Total number of residents per group and number in the random sample.
Group Description Total
number of residents Number in random sample Response Final Number and (%) 1 Inner contour, dark blue
contour 48 48 41 (85)
2 Outer contour, light blue
contour 829 250 186 (74)
3 Short-term residents 2,147 175 76 (43)
4 Control 3,300 150 56 (37)
5 Additional -- 44 23 (52)
Non-response research was not performed. However, an assessment was made to determine the extent to which the respondent group was similar to the total population in the study area, for the analysed characteristics (age, gender distribution and duration of residence). In the case of Group 1 there was some over-representation of middle-aged participants (compared to young people and elderly people). Women were slightly over-represented in Group 4.
3.1.2 Demographic data
Ultimately the blood values of 359 residents were used in the analyses. Group 5, 23 residents who lived in the dark blue area, but who had moved house were not included in the statistical analyses. The values measured in this group are, however, shown in the tables. Before
examining the blood values, we first look at the personal characteristics of the participant groups and the extent to which these are comparable with the researched personal characteristics, mutually and with the Dutch population. The researched personal characteristics are: age, gender, weight, height and smoker/non-smoker.
The data of the participants per group is shown in Table 3.
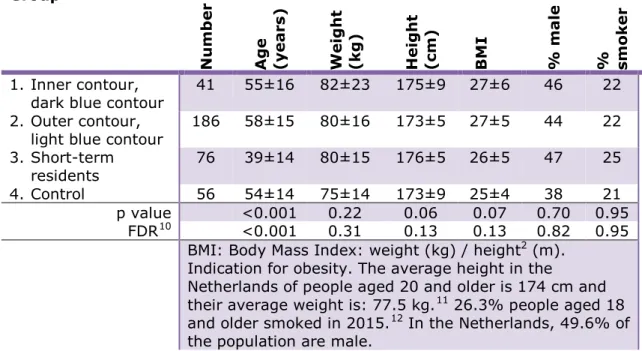
Table 3 Number participants and demographic data per research group (average and standard deviation of %).
Group N u m b er Ag e (y ear s) W ei g h t (k g ) H ei g h t (cm) BM I % ma le % sm o ke r 1. Inner contour,
dark blue contour 41 55±16 82±23 175±9 27±6 46 22 2. Outer contour,
light blue contour 186 58±15 80±16 173±5 27±5 44 22 3. Short-term
residents 76 39±14 80±15 176±5 26±5 47 25
4. Control 56 54±14 75±14 173±9 25±4 38 21
p value <0.001 0.22 0.06 0.07 0.70 0.95 FDR10 <0.001 0.31 0.13 0.13 0.82 0.95
BMI: Body Mass Index: weight (kg) / height2 (m). Indication for obesity. The average height in the
Netherlands of people aged 20 and older is 174 cm and their average weight is: 77.5 kg.11 26.3% people aged 18 and older smoked in 2015.12 In the Netherlands, 49.6% of the population are male.
Although the groups differ slightly from each other regarding the various researched characteristics, they are fairly comparable. The only
statistically significant difference is the age. The Short-term residents group (Group 3) is significantly younger than the participants in the other groups. This can be explained by the fact that age is strongly related to duration of residence, and this group has a relatively short duration of residence, namely the shortest of all groups.
With regard to the researched personal characteristics the participants differ somewhat from the Dutch population, but the differences are small.
3.2 Chemical analyses control
In order to check the reproducibility of the measurements a total of 14 samples were sent in duplicate to the laboratory in Prague for analysis. The duplicate samples were coded separately and were not recognisable for the recipient laboratory. The average duplicate variation for PFOA (intra assay) was 6.8%. The variation was greatest (21%, N=2) at around the 1 ng/ml level. For the higher values (2-30 ng/ml) the variation was lower (4.4%, N=12).
The comparison of the PFOA measurements of the Laboratory in Prague with those of the laboratory in Bremen was performed using a total of 30 samples. This series contains all the samples with PFOA values 10 FDR: False Discovery Rate, correction of p values for multiple testing
11
http://statline.cbs.nl/Statweb/publication/?DM=SLNL&PA=81565ned&D1=a&D2=a&D3=0-1,5&D4=0&D5=0,10,20,30,33-34&HDR=T&STB=G1,G2,G3,G4&VW=T. Consulted on 23 Feb. 2017. 12
>20 ng/ml (N=18), supplemented by 12 samples which are proportionally distributed across the 0-20 ng/ml range.
The result of the degree of comparison is shown in Figure 4. The coefficient R2 is used as the criterion. The R2 shows the proportion of explained variation: that is the degree to which the data from one series can be predicted on the basis of the data from the other series. The correlation between both laboratories was extremely good, namely 0.977, with only 3.7% difference in the gradient of the correlation line (Y=1.037*X+0.843). All values higher than 20 ng/ml have therefore been verified. It should be noted here that this is a verification of the laboratory tests in the same blood sample and not a measurement of a new blood sample. Blood was taken only once from each participant.
Figure 4 Degree of similarity between the chemical analysis results of PFOA in serum (in ng/ml) by the laboratory in Bremen (y axis) and the laboratory in Prague (x axis) after a Passing-Bablok regression (correction for outliers). The dotted lines indicate the 95% reliability interval.
3.3 PFOA blood values
Table 4 shows the PFOA serum values per group (in ng/ml. NB: value corresponds to microgram per litre).
The distribution of the blood values was not normal. For that reason non-parametric figures and analyses were used to present the data and the analysis. The median value, also referred to as the 50th-percentile value, is the value whereby 50% of the participants have a blood value which is equal to, or lower than, that value. For example, a 75th-percentile value (75%) is the value whereby 75% of the participants have a value which is equal to, or lower than, that value.
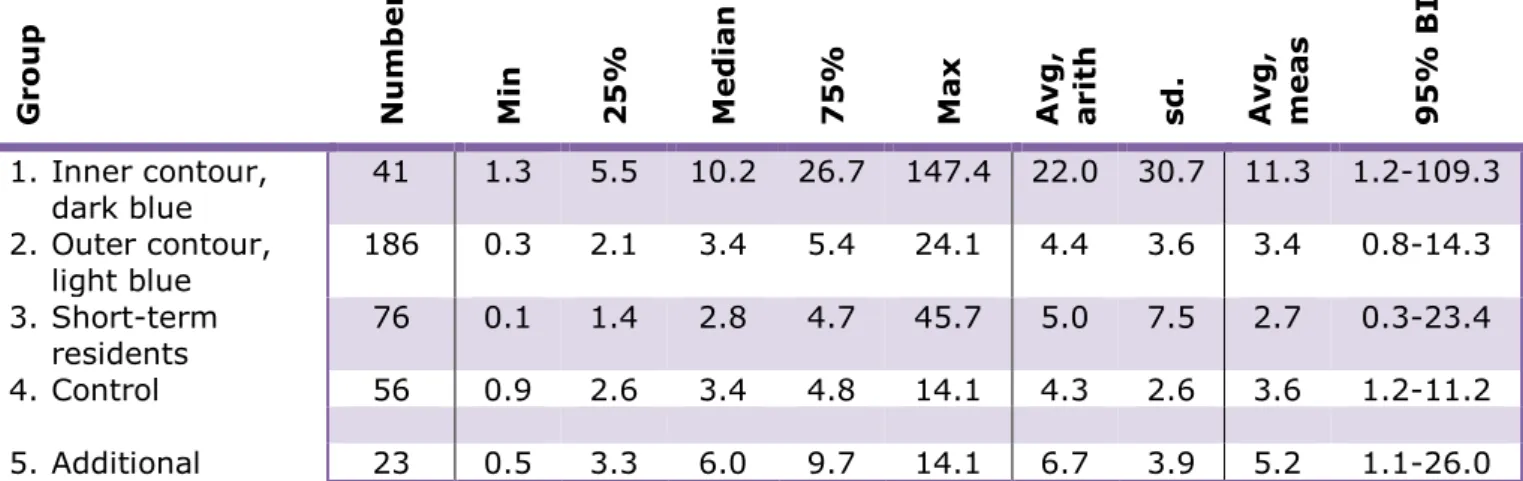
Table 4 PFOA blood values (serum, ng/ml) per group. Median values (and minimum (min), maximum (max), 25th-percentile (25%) and 75th-percentile (75%) value); arithmetic average (avg, arith) and standard deviation (sd); geometric average (avg, meas) and 95% reliability interval.13
Gr o u p N u m b er M in 25% Med ian 75% Max Av g , ar it h sd . Av g , m ea s 95% B I 1. Inner contour, dark blue 41 1.3 5.5 10.2 26.7 147.4 22.0 30.7 11.3 1.2-109.3 2. Outer contour, light blue 186 0.3 2.1 3.4 5.4 24.1 4.4 3.6 3.4 0.8-14.3 3. Short-term residents 76 0.1 1.4 2.8 4.7 45.7 5.0 7.5 2.7 0.3-23.4 4. Control 56 0.9 2.6 3.4 4.8 14.1 4.3 2.6 3.6 1.2-11.2 5. Additional 23 0.5 3.3 6.0 9.7 14.1 6.7 3.9 5.2 1.1-26.0
In order to answer question 1 (To what extent do the measured PFOA
contents in the blood (serum) of the local residents (of the DuPont factory in Dordrecht) correspond to the values calculated in the RIVM exposure model?) the measured value for the inner contour, or dark
blue contour (Group 1) was compared with the calculated value for this area: 10 ng/ml increased, which would mean a median serum value of 13.5 ng/ml. For the outer contour, or light blue contour (Group 2), the calculated value had increased by 5.0 ng/ml, which would mean a serum value of 8.5 ng/ml. The Short-term residents and Control groups were compared with the background value found in European studies: 3.5 ng/ml, median value.
The median values of the residents in the inner contour, or dark blue contour, and the outer contour, or light blue contour are 10.2 and 3.4 ng/ml, respectively and are therefore (slightly) lower than the
aforementioned calculated values of 13.5 and 8.5 ng/ml. The values of the Short-term residents and Control groups are 2.8 and 3.4 ng/ml, respectively and are therefore comparable with the background values found in European studies. The variation is considerable for all groups and each group in the research area (Groups 1, 2 and 3) contains participants with relatively high values (> 21 ng/ml).
In order to answer question 2 (Are the PFOA contents measured in the
blood (serum) of these local residents higher than those of a control population living elsewhere, and which was, therefore, not exposed to
13 The median is the middle value in a series of numbers which are classified according to size. In other words, 50% of the numbers are below the median and 50% of the numbers are above the median. The advantage of a median is that it is less sensitive to outliers than the average. The arithmetic average is the value of sum of a series of numbers divided by the number of numbers. The geometric average is the value of the multiplication of a series of numbers and then the n-root thereof. N is equal to the number of numbers. The arithmetic average shows the balance in differences with the geometric average showing a balance in relations between the numbers. The 95% reliability interval is an interval estimate for – in this case – the geometric average. If the research were to be carried out a substantial number of times, the average value 95 of the 100 times would be in the 95% reliability interval.
PFOA in the air?) all groups were compared with each other using a
Mann-Whitney (M-W) U test, a non-parametric or distribution-free test (see Table 5). A unilateral test was carried out (higher expected PFOA blood value compared to a lower value) without correction for multiple comparison (in order to reduce capitalisation on chance (flukes)).14
Table 5 Results of Mann-Whitney U test: group-based non-parametric comparison of PFOA blood values.
Group 1 2 3 4
1. Inner contour, dark blue contour -
2. Outer contour, light blue contour 1 > 2a -
3. Short-term residents 1 > 3a 2 > 3b -
4. Control 1 > 4a 2 = 4c 3 = 4c -
a: p<0.001, b: p=0.02, c: p=1.0
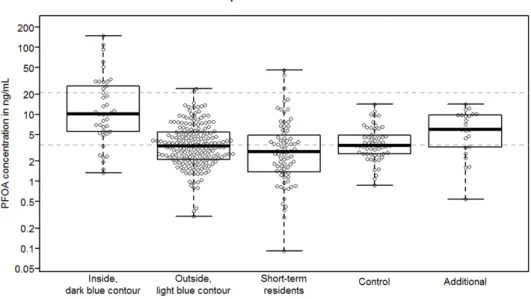
The results of the M-W U test show that the PFOA values found in the blood in Group 1 (statistically significant) are higher than in the other three groups and that those in Group 2 (statistically significant) are higher than in Group 3. The values in the other groups are no different from each other. This is shown in Figure 5 which is a graph of the numbers from Table 4.
Consequently, there are differences between groups. A multivariate analysis was performed to assess whether these differences can be attributed to other relevant15 investigated characteristics (age, gender) than to just the group.
In the case of group and age the difference found was as expected. In the case of gender it is clear that the PFOA values for women are
approximately 15% lower than for men. However, the difference found is not statistically significant. This difference between men and women is also found in other studies.16
14 If a correction is made (Bonferroni correction) the difference in median between Group 2 and Group 3 is statistically not significant (p=0.12). The other comparisons have the same result as without Bonferroni correction.
15 A characteristic was regarded as relevant if it revealed a statistically significant effect in a uni-variate analysis. This only applied to age and gender, and not to height, weight (BMI) and smoker/non-smoker. 16 Contaminating substances in your body. What are you carrying around with you? Flemish Human
Biomonitoring Programme 2007-2011 [Vlaams Humaan Biomonitoringsprogramma 2007-2011]. Results report: Reference biomonitoring part.
Figure 5 Graph (box plot) of the PFOA blood values (in ng/ml) per group. The lowest line is the minimum value, the uppermost line is a maximum value, the lowest line of the 'box' is 25th-percentile value, the uppermost line of the 'box' is 75 percentile value, and the middle, thick line is the median (50 percentile) value. Each little circle represents an individual serum value.
NB: The scale for blood value (y axis) is logarithmic. Dotted lines, from top to bottom, at: 21 ng/ml (average maximum value from European research (range 6.2 - 100 ng/ml)), 13.5 ng/ml (calculated median value inner contour, dark blue), 8.5 ng/ml(calculated median value outer contour, light blue) and 3.5 ng/ml (average median value from European research (range 1.4 - 6.8 ng/ml)).
4
Discussion, Conclusions and Recommendation
4.1 Discussion
The primary aim of the research was to verify the model calculation in order to make a statement, partly on the basis of the results, on the follow-up steps to be taken.
This was done using the following basic values from the model calculations:
• Residents in the inner contour, the dark blue contour, have a maximum median value of 13.5 ng/ml;
• Residents in the outer contour, the light blue contour, have a maximum median value of 8.5 ng/ml;
• The median value of participants from the control group (Group 4) is approximately equal to the European median of 3.5 ng/ml with maximum values up to 21 ng/ml.
4.1.1 Comparison of calculated and measured values
Participants from the inner contour, or dark blue contour have a median value of 10.2 and are therefore slightly below the calculated value of 13.5. Participants from the outer contour, or light blue contour have a median value of 3.4 which is also below the predicted value of 8.5. As a result, the answer to question 1 (To what extent do the measured
PFOA contents in the blood (serum) of the local residents (of the DuPont factory in Dordrecht) correspond to the values calculated in the RIVM exposure model?) is that these values correspond closely with each
other. In any event it is clear that the model did not underestimate the measured serum PFOA values. Consequently, it can also be concluded that these model calculations are a good method for deducing serum values in the population. Some limitations do, of course, apply because we only have serum data from 2016. Because the calculated (median) value is a good reflection of the measured (median) value in 2016, we can assume that the calculated value before then is also a good
(median) reflection of the actual situation. Therefore, the results of the current research support the conclusions from 2016 that it is probable that the residents of the area around Dupont/Chemours (Group 1 and, to a lesser extent, Group 2) suffered long-term exposure to high concentrations of PFOA in the past.
4.1.2 Comparison of measured values with known background values
The background value we used in this study was 3.5 ng/ml. With a median of 3.4 and an average of 4.3 the control group (Group 4) is close to this European background value. The highest value in the control group, of 14.5, is below the value of 21.0 provided by ECHA. However, it should be pointed out that the ECHA background value was calculated on the basis of older studies. More recent data from Belgium17 shows, for example, a median value that is between 2.13 and 3.69 ng/ml and a maximum value of 25.2 ng/ml.
17 Contaminating substances in your body. What are you carrying around with you? Flemish Human
Biomonitoring Programme 2007-2011 [Vlaams Humaan Biomonitoringsprogramma 2007-2011]. Results report: Reference biomonitoring part.
In the case of question 2 'Are the PFOA contents measured in the blood
(serum) of these local residents higher than those of a control
population which was exposed less or not at all?' we have observed that
Group 1, participants from the inner contour, or dark blue contour, with a median of 10.2, have a statistically increased PFOA value compared to the other groups. Group 2, outer contour, or light blue contour, have a median of 3.4 and display a slightly increased value compared to the participants in the Short-term residents group. Although this value is statistically significant, this significance disappears if a correction is made for multiple testing. The Short-term residents group has a median of 2.8 and therefore displays a comparable value to the controls and the European background value of 3.5. Variation is, of course, evident in the groups. This variation is greatest in the Short-term residents group. In total 18 participants (4.7%) from the study area have a value which is higher than 21 ng/ml and therefore higher than the value which ECHA indicated as the (average) maximum value found in European population studies.
The current study provides no basis for explaining those individual high values in the various groups. In the case of Group 1 and Group 2, exposure to PFOA in the air was an obvious source in the past. In a general sense there are various possible explanations for the higher serum values:
• The half-life of PFOA in serum – this is the period of time during which the blood value decreases by 50% – is 4 years. However, this is an average half-life. The decrease in PFOA in the blood is therefore not the same for each individual. Earlier research revealed that, depending on the individual, the half-life can vary from 1.5 to 9.1 years.18 Local residents with a high PFOA content in the past and a longer half-life, whereby the amount of PFOA in the blood therefore decreases more slowly, could consequently have a higher measured PFOA value in the blood. Due to the major differences in half-life, calculating back to serum values of PFOA in the past at individual level is by no means easy.
• The model that was previously used to calculate serum values assumes air exposure to be the most important source of PFOA. Air exposure is calculated on an annual basis including peak load. However, the individual peak load may have varied during a particular year. This can affect individual values.
• Research involving DuPont employees has revealed that their serum values could exceed 1,000 ng/ml. DuPont employees are excluded from our study and a questionnaire was used to obtain a general insight into the employment history of the participants. It is not known whether participants spent much time at the Dupont/Chemours site due to their work. More detailed
information could provide an explanation for the higher individual values we found.
• Exposure to PFOA also takes place via consumer products and food. No information on this was collected during this study. However, on the basis of the literature and known background values in population studies it is unlikely that PFOA from food and drinking water could lead to serum values in excess of 21
ng/ml.19
4.2 Conclusion
The measured values of PFOA (PerFluorOctaGGnoic acid) in the blood of local residents of Chemours/DuPont correspond closely to the values calculated using an RIVM computer model.
Local residents who have lived in the vicinity of the factory for a long period of time have higher blood values than residents who live further away or who have lived in the vicinity for shorter periods of time. Residents who live further away or who have lived in the vicinity for a shorter period of time have PFOA values in their blood which correspond to background values found in European studies. The results of the current research support the conclusions from 2016 that it is probable that the residents of the area around Dupont/Chemours (Group 1 and, to a lesser extent, Group 2) suffered, in the past, long-term exposure to high concentrations of PFOA.
Some of the residents studied (4.7%) in the study area have higher blood values (>21 ng PFOA/ml) than expected.
19 Noorlander, C.W., J.D. te Biesebeek, S.P.J. van Leeuwen & M.J. Zeilmaker. 2010. Intake of PFOS and PFOA from food and drinking water in The Netherlands. RIVM-Letter report 320126001.
5
Annexes
5.1 Information for participants in PFOA random sample-blood
analysis
You have been selected to participate in a study of the quantity of PFOA in your blood. Participation in the study is voluntary.
In the past (up until 2012) the substance, perfluorooctanoic acid (PFOA) was emitted into the air by chemicals factory DuPont/Chemours in Dordrecht. RIVM research has revealed that there is a possibility of the substance being present in the blood of local residents. However, it is far from certain that this is the case.
For that reason a blood analysis programme is to be performed involving residents who have lived near the factory for a long period of time. By way of a control, people are also to be examined who have not lived at the location for that long and people who actually live a long way away from the factory.
The research is to be carried out by the National Institute for Public Health and the Environment [Rijksinstituut voor Volksgezondheid en Milieu] (RIVM) and the Municipal Health Department (GGD) Zuid-Holland Zuid (part of the Youth Care Agency [Dienst Gezondheid & Jeugd]). The costs of this research are being reimbursed by the government. You do not have to pay to participate in this research.
People who live at varying distances from Dupont/Chemours are being invited to participate in this research. As far as RIVM and the Municipal Public Health Services for this region are concerned, it is very important that sufficient people participate. That will enable an assessment to be made of whether it is true that people who have lived close to
DuPont/Chemours over a prolonged period of time have an increased quantity of PFOA in their blood.
Before you decide whether you would like to participate in this blood analysis, we would like to explain to you what the research entails. Please read this information carefully.
What is PFOA?
PFOA is a man-made chemical substance which does not occur naturally in the environment. The substance is used to treat carpets and clothing, in cardboard packaging coatings and in non-stick layers applied to cooking pans.
PFOA can end up in the environment during manufacturing and through the use and disposal of products which contain it. It can also be created in the environment when other chemicals containing fluorine break down.
The European Union concluded that the substance has the following characteristics: it is bio-accumulating (accumulates in the body), it is not biodegradable, it is reprotoxic (has an effect on reproduction) and may be carcinogenic. It is also known to affect the liver. Not all health effects have been proven. Neither is it certain which concentration in the body causes the worst effects of all.
What is the aim of the research?
With this research we want to find out whether the quantity of PFOA in the blood of people living nearby DuPont/Chemours corresponds to RIVM's expectations based on its own calculations. PFOA has no longer been emitted by Dupont/Chemours for several years now and no measurements have been taken in the vicinity or in the blood of local residents. Neither is the quantity of PFOA in the blood known of the general Dutch population. Instead this has been estimated. As a
consequence, calculations were a necessary first step in order to gain an impression of the quantity of PFOA in the blood of local residents. This present blood analysis is intended to assess the outcomes of the RIVM calculations.
More information about PFOA, the calculations and estimates can be found at http://www.rivm.nl/Onderwerpen/P/PFOA
Why have you been invited to take part in the research?
For our research it is important that people take part who live at various distances from Dupont/Chemours. This will allow outcomes to be
compared of people who do live in the direct vicinity of the factory and those who do not. You are one of the 600 or so people who have been invited to participate in the research.
Random names were taken from the Personal Records Database [Basis Registratie Personen] (BRP) of the municipalities of Dordrecht,
Sliedrecht and Papendrecht. These people are being invited to take part in the research.
Participation in the study is entirely voluntary. Can anyone take part in the research?
No. You can only take part if you are aged eighteen or older, if you are legally capable and if you have received a personal letter of invitation. People who have not received this letter will be unable to participate. You cannot, therefore, arrange for a replacement if you are unable or unwilling to participate.
You cannot participate if you work at DuPont/Chemours or did so in the past. People who suffer from coagulation-related problems and are therefore registered with the thrombosis service are also unable to participate. (If you are in any doubt, or if you have any questions, please contact the Municipal Public Health Services for this region (Dienst Gezondheid & Jeugd) on +31 (0)78 7708500).
How can you register for the research?
If you have received a letter of invitation and fulfil the criteria for participation, you can schedule an appointment via the following link: www.dienstgezondheidjeugd.nl/bloedonderzoekpfoa
When doing so, please use your participant number stated in the letter of invitation and your date of birth. If you do not have Internet, please make an appointment by telephone via telephone number: +31 (0)78 7708500 (on working days between 8.30 a.m. and 4.30 p.m.).
Where can you have your blood sample taken?
If you have been invited for the random sample blood analysis of local residents of DuPont/Chemours, you can make an appointment to have your blood taken at one of the following locations:
• ASVZ Merwebolder Address: Touwbaan 1 3363 WB Sliedrecht
Monday 5 September 2016, 4.30 – 7.30 p.m. Tuesday 13 September 2016, 4.30 – 7.30 p.m. • Woon en zorgcentrum de Merwelanden
Address: Haringvlietstraat 515 3313 EM Dordrecht
Tuesday 6 September 2016, 3.00 – 7.00 p.m. Monday 12 September 2016, 3.00 – 7.00 p.m. • Dienst Gezondheid & Jeugd (GGD)
Karel Lotsyweg 40 3318 AL Dordrecht
Thursday 8 September 2016, 8.30 – 7.00 p.m.
If you have been invited for the DuPont/Chemours random sample blood analysis control group, you can make an appointment to have your blood taken at:
• GGD ZHZ
Karel Lotsyweg 40 3318 AL Dordrecht
Tuesday 4 October 2016, 8.30 a.m. - 12.00 p.m. Wednesday 5 October 2016, 5.00 p.m. - 7.30 p.m.
Extra days may be scheduled depending on the required number of appointments.
What does the research involve?
The first step is to fill in the consent form included with this information. Please do not forget to sign it.
You will then be invited to one of the research locations you have chosen. There, two samples of your blood will be taken (a total of 16 ml). Beforehand you will be asked to provide proof of identification (in the form of a valid Dutch passport, ID card or driving licence) and to hand in the consent form you have signed.
Lastly you will be asked to fill in a questionnaire after your sample has been taken. Your answers will help the Municipal Public Health Services and RIVM to assess the results of the blood analysis.
If you have any questions about the form, you can ask the Municipal Public Health Services’ staff members present. The appointment (blood collection and filling in the questionnaire) will last approximately 30 minutes in total.
What must you do if you do not want to participate in the research or want to stop?
It is up to you to decide whether you participate in the study. If you decide not to participate, you do not need to do anything.
If you have decided to participate, but then change your mind, this is not a problem. All you need to do is inform the Municipal Public Health Services for this region that you want to stop. You do not have to give a reason.
What happens to your personal details?
Each participant is assigned a unique participant number which will be stated on the blood collection tubes and the questionnaire. No mention will be made of your name.
All your details will remain strictly confidential. Only the Municipal Public Health Services for this region researchers will be able to look up which participant number belongs to which name. Personal details will not be passed on. Your details will be kept (by the researchers of the Municipal Public Health Services) for ten years. An RIVM monitor checks the research but does not have access to any personal data.
What happens with your blood?
The serum from your blood is sent to a qualified laboratory for testing. The PFOA concentration in the serum will be measured. By signing the consent form you give your permission for residues of the serum to be stored at RIVM for a maximum of ten years.
RIVM, and not the Municipal Public Health Services, will pass on the result of the blood analysis to your GP or specialist.
It is possible that the serum will be used for additional research into other fluorine compounds at a later date. You can indicate your approval of this on the consent form.
The outcomes of the research are to be processed into a report and/or publication which will not contain any personal data.
When will you receive the result (your blood value)?
If you want, we can send you the result of the concentration of PFOA in your blood by post in about April 2017. You can indicate on the consent form whether you want to receive this information.
Will you receive a payment for participating?
You do not have to pay to participate in this research. The costs of the blood sampling and tests are being reimbursed by the government. After the blood sample has been taken you will be sent a gift token worth € 25.00 to thank you for taking part.
Questions
If you have any (additional) questions about the letter of invitation and/or the above information, please contact with the Municipal Public Health Services for this region (Dienst Gezondheid & Jeugd on telephone number +31 (0)78-7708500 or email info@dienstgezondheidjeugd.nl). You can find more information about PFOA and the random sample-blood analysis at www.dienstgezondheidjeugd.nl/steekproefpfoa
5.2 Consent form for participants in the PFOA blood analysis • I have received an invitation to participate in the PFOA blood
analysis and have read the information for participants. I have been given an opportunity to ask questions. All my questions were answered satisfactorily. I had enough time to decide whether I want to participate.
• I am not a(n) (former) employee of DuPont/Chemours. • I am legally capable.
• I do not have any coagulation-related problems for which the thrombosis service has to check my blood.
• I know that my participation is voluntary. I also know that I can decide at any moment not to participate or to stop participating in the research, without having to give any reason.
• I give permission to collect and use my data and blood sample in the manner and for the purposes listed in the information letter. • I give permission to store my data and blood residue for another
ten years after this research.
Please indicate what is applicable with a cross. O I would like to participate in this research.
I □ do
□ do not
give permission to inform me of the result of the amount of PFOA in my serum sample.
I □ do
□ do not
give permission to measure my blood for other fluorine compounds if that is desirable based on the outcomes of this research.
I □ do
□ do not
give permission to be approached again after this research for follow-up research.
Name of participant: Date of birth:
Signature: Date:
To be filled in by Municipal Public Health Services employee: (who discusses the consent form)
Location:
Participant number: Identity document no.:
I declare that I have fully informed this participant about the said research.
Name:
Signature Date: / / __
Blood taken by:………..
Initials……….
Date………
5.3 Chemical analysis
Description of the method
Following petition of isotope labelled PFOA as internal standard, the serum sample (0.5 ml) was extracted using acetonitril. After adding water-free MgSO4, the rough extract was concentrated using a rotation vacuum evaporator. The residue was dissolved in in methanol for the U-HPLC-MS/MS analysis.
Instrumental analysis
The U-HPLC-analyses of PFOA were performed with a 1290 Infinity LC II (Agilent Technologies, USA). The U-HPLC column used was the Acquity UPLC BEH C18 (100 mm × 2,1 mm i.d.; 1.7 µm; (Waters, USA), eluted with a mixture of 5 mM CH3COONH4 in water and 5 mM CH3COONH4 in MeOH. The U-HPLC system was linked to a triple-quadrupole mass spectrometer (Agilent Triple quadrupole G6495) with electrospray ionisation (ESI) in the negative ion mode.
Method validation
The lowest quantification limit is 0.05ng/ml. The recovery and repeatability (expressed as RSD, in %) of the analysis method were calculated using six analyses of artificially infected blank serum sample (without naturally present PFOA). The validation level was 1 ng/ml for PFOA. The relative standard deviation was 12% with an average recovery of 94% (see also 2.6).