Emissions
of air
pollutants
Informative Inventory Report 2014
Netherlands
Informative Inventory
Report 2014
B.A. Jimmink, H.M. ten Broeke1, P.W.H.G. Coenen1, R. Dröge1, G.P. Geilenkirchen2, A.J. Leekstra, C.W.M. van der Maas,
R.A.B. te Molder, C.J. Peek, J. Vonk, D. Wever
1 Netherlands Organisation for Applied Scientific Research (TNO) 2 PBL Netherlands Environmental Assessment Agency
Emissions of transboundary air pollutants in the Netherlands 1990-2012 Informative Inventory Report 2014
Contacts:
Benno Jimmink (benno.jimmink@rivm.nl) Wim van der Maas (wim.van.der.maas@rivm.nl)
This report has been compiled by order and for the account of the Directorate-General for the Environment, of the Dutch Ministry Infrastructure and the Environment, within the framework of the project Emissieregistratie M680355, ‘Netherlands Pollutant Release & Transfer Register’. Report prepared for submission in accordance with the UNECE Convention on Long-Range Transboundary Air Pollution (CLRTAP) and the European Commission.
RIVM report 680355015/2014 ©RIVM 2014
National Institute for Public Health and the Environment (RIVM), PO Box 1, 3720 BA Bilthoven, the Netherlands; Tel: +31-30-274 9111; Fax: +31-30-278 75 31; www.rivm.nl/en
Acknowledgements
Many colleagues from a number of organisations (CBS, LEI, Alterra, RVO.nl, PBL, RIVM and TNO) have been involved in the annual update of the Netherlands Pollutant Release & Transfer Register (PRTR), also called the Emission Registration (ER) system, which contains emission data from over 1000 facilities on about 350 pollutants. The emissions are calculated by members of the ER ‘Task Forces’. This is a major task, since the Netherlands’ inventory contains many detailed emission sources. Subsequently, the emissions and activity data of the Netherlands’ inventory are converted into the NFR source categories and contained in the Excel files. The description of the various sources, the analysis of trends and uncertainty estimates (see Chapters 2 to 10) were made in co-operation with the following emission experts: Mr. Gerben Geilenkirchen (transport), Mr. Peter Coenen, Mr. Harm ten Broeke and Mrs. Rianne Dröge (energy),
Mr. Kees Peek (industrial processes, solvents and product use), Mr. Jan Vonk (agriculture). We are particularly grateful to Mr. Bert Leekstra and Mr. Dirk Wever, for their contribution to data processing, chart production and quality control. For their continued support, we acknowledge Mr. R. Wolters and Mr. W. Prins in particular, from The Directorate for Climate Change, Air Quality and Noise of the Dutch Ministry of Infrastructure and Environment. For the design and layout of this report, we thank the RIVM’s graphic department, in particular Mr. Gert Boer. We greatly appreciate the contributions of each of these groups and individuals to this Informative Inventory Report as well as the contributions of the external reviewers that provided comments on the draft report.
Publiekssamenvatting
Emissies Nederland blijven in 2012 onder nationale plafonds
De uitstoot van stikstofoxiden (NOx), ammoniak,
zwaveldi-oxide en niet-methaan vluchtige organische stoffen (NMVOS) is in 2012 in Nederland licht gedaald. Daarmee bleef de uitstoot onder de maxima die de Europese Unie daaraan sinds 2010 stelt. Nederland voldoet daardoor, net als in 2011, aan de vier ‘nationale emissieplafonds’ (NEC) voor deze stoffen.
Dit blijkt uit de Nederlandse emissiecijfers van grootscha-lige luchtverontreinigende stoffen. Het RIVM verzamelt en analyseert deze cijfers. Behalve bovengenoemde stoffen gaat het om de uitstoot van koolmonoxide, fijn stof (PM10), zware metalen en persistente organische stoffen (POP’s). De uitstoot van al deze stoffen is tussen 1990 en 2012 gedaald. Dit komt vooral door schonere auto’s en brandstoffen en door emissiebeperkende maatregelen van industriële sectoren.
Meer kilometers door bromfietsen
Door de jaren heen zijn de methoden om de emissies te berekenen verbeterd, wat nu resulteert in nauwkeurigere cijfers. De emissies van bromfietsen en motorfietsen zijn afhankelijk van het aantal gereden kilometers per jaar en daar is nu beter inzicht in. Het totale aantal gereden kilometers door bromfietsen blijkt in de afgelopen jaren bijna twee keer zo hoog is als werd gedacht. Daarmee is de uitstoot van schadelijke stoffen navenant hoger. Ten opzichte van andere typ voertuigen blijven bromfietsen
echter een relatief kleine emissiebron en dragen ze beperkt bij aan de totale nationale emissies. In steden zijn ze wel een relevante bron. Het aantal gereden kilometers door motorfietsen, en daarmee de uitstoot, blijft in lijn met eerdere inzichten.
Vrachtauto’s zwaarder beladen
De uitstoot van schadelijke stoffen door vrachtauto’s is voor het eerst berekend op basis van recente inzichten in het gewicht van vrachtauto’s. Trekker-opleggers blijken zwaarder beladen dan tot nu toe werd verondersteld. Ook rijden vrachtauto’s vaker met een aanhanger dan tot nu toe werd aangenomen, waardoor ze zwaarder zijn. Een hoger gewicht betekent een hoger brandstofverbruik, en veelal ook een hogere uitstoot per gereden kilometer. De uitstoot van PM10 door vrachtauto’s is hierdoor circa 5 procent hoger dan in de vorige IIR-rapportage. Hogere emissies ammoniak
De uitstoot van ammoniak blijkt hoger dan eerder werd verondersteld vanwege enkele nieuwe inzichten; de cijfers zijn hierdoor vanaf 1997 bijgesteld. Zo worden luchtwas-sers, die voornamelijk op varkensstallen zitten, niet altijd gebruikt. Ook is vanaf 2002 in melkveestallen het leefoppervlak per dier toegenomen. Door het grotere contactoppervlak van mest met lucht wordt meer ammoniak uitgestoten. Door de aangepaste aannames is het nationale totaal met 6,6 kiloton verhoogd ten opzichte van 2011.
Trefwoorden: emissies, grootschalige luchtverontreiniging, emissieregistratie
Abstract
Emissions the Netherlands in 2012 remain under national ceilings
Emissions of nitrogen oxides (NOx), ammonia, sulphur
dioxide and non-methane volatile organic compounds (NMVOC) in the Netherlands have slightly decreased in 2012. Consequently, the emissions stayed below the caps the European Union has set from 2010. Herewith, the Netherlands comply with all four so-called emission ceilings (NEC).
This has become apparent from the emission data on air pollutants from the Netherlands. RIVM collects and reports these data. Besides above-mentioned substances, emissions of carbon monoxide, particulate matter (PM10),
heavy metals and persistent organic pollutants (POPs) have been reported. The emissions of all substances have decreased in the 1990 – 2012 period. The downward trend may in particular be attributed to cleaner fuels, cleaner car engines and to emission reductions in the industrial sectors. More kilometres by mopeds
Over the years emission calculation methods have been improved, resulting in higher data accuracy. In 2012, the emissions from mopeds and motorcycles have been calculated, based on improved knowledge of the mileages. The total number of kilometres driven by mopeds appears to have been nearly twice as high in recent years. As a result, the emissions of pollutants are proportionally higher. In relation to the total number of vehicles, the
number of mopeds however remains relatively low and their contribution to the total national emissions is limited. In cities, they are a relevant source. The mileages by motorcycles, and consequently their emissions remain in line with previous insights.
Heavy-duty vehicles carry heavier loads
Emissions of pollutants by heavy-duty trucks have for the first time been calculated on the basis of recent insights in truck loads. Tractor-trailer combinations appear to carry heavier loads and the fraction of trailers behind rigid trucks is larger than previously assumed. A heavier load means a higher fuel use and for most substances a higher emission per kilometre driven. PM10 emissions by
heavy-duty trucks are about 5 percent higher than in the previous IIR report.
Higher agricultural ammonia emissions
Agricultural ammonia emissions appear to be higher than previously assumed because of new insights. Air scrubbers on animal housing (predominantly pigs) were not always in use or even employed. Since 2002, the living space per animal has increased for dairy cattle housing. This resulted in a higher contact surface manure-air and thus more ammonia emitted. The new insights have raised the national total of ammonia emissions by about 6 percent compared to 2011.
Key words: emissions, transboundary air pollution, emission inventory
Glossary
AER Annual Environmental Report
CLRTAP Convention on Long-Range Transboundary Air Pollution CBS Statistics Netherlands
CNG Compressed Natural Gas DCS Dutch Continental Shelf DPF Diesel particulate filter EEA European Environment Agency
EMEP European Monitoring and Evaluation Programme
ER-I Emission Inventory data of individual point-source emissions and activities ERT Emission Review Team
EU European Union HCB Hexachlorobenzene IEF Implied Emission Factor
IenM Dutch Ministry of Infrastructure and the Environment IIR Informative Inventory Report
LEI Agricultural Economics Research Institute LPG Liquefied petroleum gas
NACE Nomenclature statistique des activités économiques dans la Communauté européenne NAP national car Passport Corporation
NEC National Emission Ceiling NEH Netherlands Energy Statistics
NEMA National Emission Model for Agriculture NFR Nomenclature for Reporting
NIR National Inventory Report
NMVOC Non-methane volatile organic compounds NRMM Non-Road Mobile Machinery
NS Dutch Railways
NUSAP Numeral Unit Spread Assessment Pedigree PAH Polycyclic aromatic hydrocarbon
PBL Netherlands Environmental Assessment Agency PM Particulate matter
POP Persistent organic pollutant
PRTR Pollutant Release and Transfer Register
Rav Dutch Ammonia and Livestock Farming Regulation
RDW national motor vehicle and driving licence registration authority RLD Dutch national air traffic service
SPIN Co-operation project on Industrial Emissions TAN Total ammonia nitrogen
TWC Three-way catalyst
QA/QC Quality Assurance/Quality Control
RIVM National Institute for Public Health and the Environment RVO.nl Netherlands Enterprise Agency
RWS Rijkswaterstaat
TNO Netherlands Organisation for Applied Scientific Research UNECE United Nations Economic Commission for Europe UNFCCC United Nations Framework Convention on Climate Change WWTP Waste Water Treatment Plant
Contents
Acknowledgements 3 Publiekssamenvatting 4 Abstract 5 Glossary 6 1 Introduction 91.1 National inventory background 9
1.2 Institutional arrangements for inventory preparation 10
1.3 The process of inventory preparation 10
1.4 Methods and data sources 13
1.5 Key source analysis 13
1.6 Reporting, QA/QC and archiving 13
1.7 Uncertainties 15
1.8 Explanation on the use of notation keys 17
1.9 Missing sources 18
2 Trends in emissions 19
2.1 Trends in national emissions 19
2.2 Trends in sulphur dioxide (SO2) 21
2.3 Trends in nitrogen oxides (NOx) 21
2.4 Trends in ammonia (NH3) 22
2.5 Trends in non-methane volatile organic compounds (NMVOC) 22
2.6 Trends in PM10 23
2.7 Trends in PM2.5 23
2.8 Trends in Pb 24
3 Energy 25
3.1 Overview of the sector 25
3.2 Public electricity and heat production (1A1a) 26
3.3 Industrial combustion (1A1b, 1A1c and 1A2) 28
3.4 Small combustion (1A4ai, 1A4bi, 1A4ci and 1A5a) 31
3.5 Fugitive emissions (1B) 33
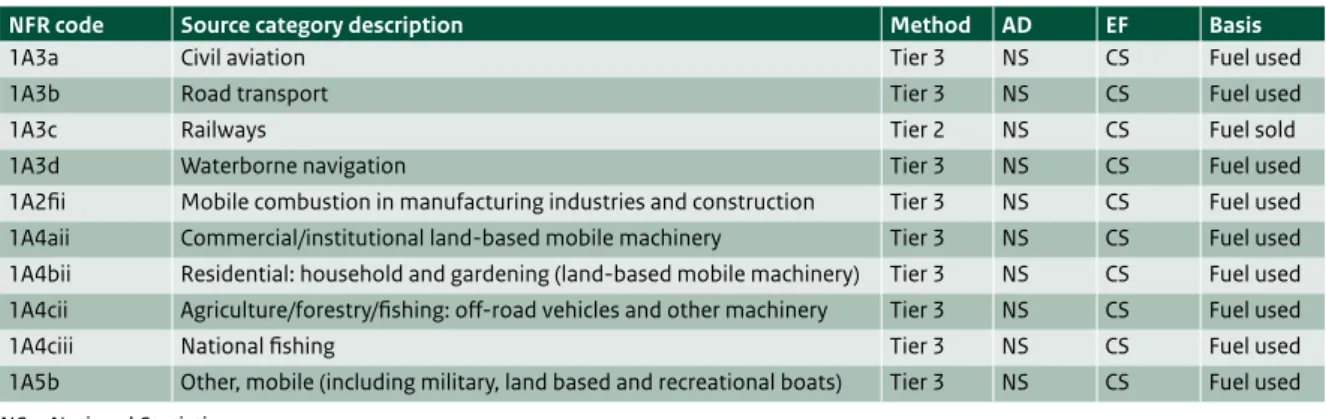
4 Transport 35
4.1 Overview of the sector 35
4.2 Civil aviation (1A3a) 36
4.3 Road transport (1A3b) 39
4.4 Railways (1A3c) 49
4.5 Waterborne navigation and recreational craft (1A3d) 51
4.6 Non-road mobile machinery (NRMM) 55
4.7 National fishing (1A4ciii) 58
5 Industry 63
5.1 Overview of the sector 63
5.2 Mineral production (2A) 66
5.3 Chemical industry (2B) 67
5.4 Metal production (2C) 67
5.5 Other production industry (2D) 69
5.6 Other production, consumption, storage, transportation or handling of bulk products (category 2G) 69
6 Solvents and product use 71
6.1 Overview of the sector 71
6.2 Paint Application (3A) 72
6.3 Other solvent use (category 3D) 74
7 Agriculture 75
7.1 Overview of the sector 75
7.2 Animal husbandry and manure management 76
7.3 Crop production and agricultural soils 80
8 Waste 83
8.1 Overview of the sector 83
8.2 Solid waste disposal on land 84
8.3 Waste-water handling 85
8.4 Waste incineration 85
8.5 Other waste 86
9 Other 88
10 Recalculations and other changes 89
10.1 Recalculations of certain elements of the 2013 inventory report 89
10.2 Improvements 89
10.3 Effects of recalculations and improvements 90
11 Projections 93
11.1 Energy 94
11.2 Transport 96
11.3 Industry 98
11.4 Solvents and Product use 98
11.5 Agriculture 98
12 Spatial distributions 101
12.1 Background for reporting 101
12.2 Methodology for disaggregation of emission data 101
12.3 Maps with geographically distributed emission data 102
References 105
1
Introduction
The United Nations Economic Commission for Europe’s’Geneva 1979 Convention on Long-Range Transboundary Air Pollution (CLRTAP) was accepted by the Netherlands in 1982. Under the Convention parties are obligated to report emission data to the Conventions’ Executive Body in compliance with the implementation of the Protocols to the Convention (also accepted by the Netherlands). The annual Informative Inventory Report (IIR) on national emissions of SO2, NOX, NMVOC, CO, NH3 and various heavy
metals and POPs is prepared using the Guidelines for Estimating and Reporting Emission Data under the CLRTAP (UNECE, 2009).
The Netherlands’ IIR 2014 is based on data from the national Pollutant Release and Transfer Register (PRTR). The IIR contains information on the Netherlands’ emission inventories for the years 1990 to 2012, including descrip-tions of methods, data sources, QA/QC activities carried out and a trend analysis. The inventory covers all anthro-pogenic emissions to be reported in the Nomenclature For Reporting (NFR), including individual polycyclic aromatic hydrocarbons (PAHs), which are to be reported under persistent organic pollutants (POPs) in Annex IV. Moreover, this year, the spatial distributions of emission data have been reported, this has to be done every five years. A chapter on the followed methodology has therefore been included.
1.1
National inventory background
Emission estimates in the Netherlands are registered in the national Pollutant Release and Transfer Register (PRTR). This PRTR database is the national database for sectorial monitoring of emissions to air, water and soil of pollutants and greenhouse gases. The database was set up to support national environmental policy as well as to report to the framework of Ceilings (NEC) of the European Union, the CLRTAP, the United Nations Framework Convention on Climate Change (UNFCCC) and the Kyoto Protocol (National System). The PRTR encompasses the process of data collection, processing and registration, and reporting on emission data for some 350 compounds. Emission data (for the most important pollutants) and documentation can be found at
www.prtr.nl
. Instead of using the defaults from the EMEP/EEA air pollutant emission inventory guidebook (EEA, 2009), the Netherlands often applies country-specific methods with associated activity data and emission factors. The emission estimates are based on official statistics of the Netherlands (e.g. on energy, industry and agriculture) and environmental reports by companies in the industrial sectors. Both nationally developed and internationally recommended emission factors have been used.1.2
Institutional arrangements for
inventory preparation
The Dutch Ministry of Infrastructure and Environment (IenM) has the overall responsibility for the emission inventory and submissions to CLRTAP. A Pollutant Release and Transfer Register (PRTR) system has been in operation in the Netherlands since 1974. Since 2010, the Ministry of IenM has outsourced the full coordination of the PRTR to the Emission Registration team (ER team) at the National Institute for Public Health and the Environment (RIVM). The main objective of the PRTR is to produce an annual set of unequivocal emission data that is up to date, complete, transparent, comparable, consistent and accurate. Emission data are produced in annual (project) cycles (RIVM, 2013; 2014). Various external agencies contribute to the PRTR by performing calculations or submitting activity data (see next section). In addition to the RIVM, the following institutes contribute to the PRTR:
• Netherlands Environmental Assessment Agency (PBL); • Statistics Netherlands (CBS);
• Netherlands Organisation for Applied Scientific Research (TNO);
• RWS Centre for Water Management (RWS-WD); • RWS Centre for Transport and Navigation (RWS-DVS); • Deltares;
• Alterra WUR;
• Wageningen UR Livestock Research; • RWS Centre for Environment(RWS-Afval); • Agricultural Economics Research Institute (LEI);
• Fugro-Ecoplan, which co-ordinates annual environmen-tal reporting (AER) by companies.
Each of the contributing institutes has its own responsibil-ity and role in the data collection, emission calculations and quality control. These are laid down in general agreements with RIVM and in annual project plans.
1.3
The process of inventory
preparation
Data collection
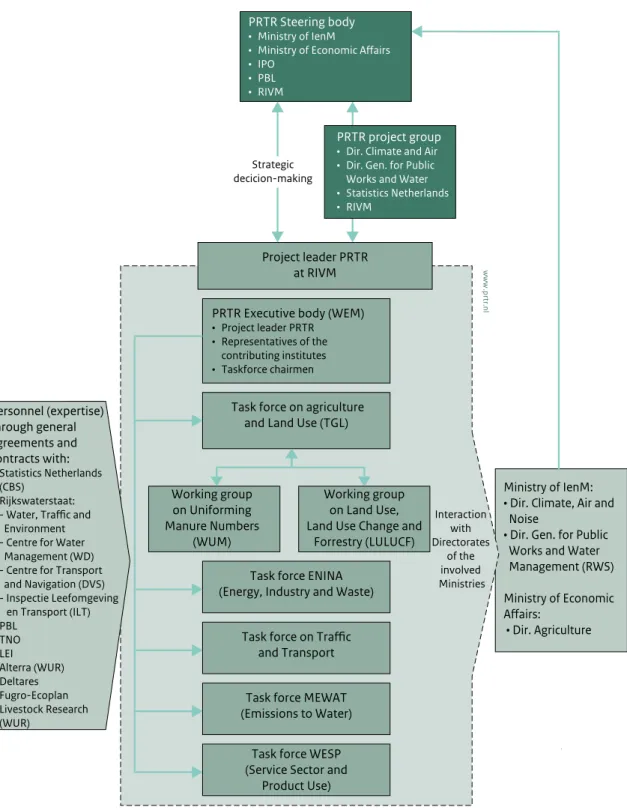
For the collection and processing of data (according to pre-determined methods), the PRTR is organised accord-ing to task forces. The task forces consist of sector experts of the participating institutes. Methods are compiled on the basis of the best available scientific views. Changes in scientific views lead to changes in methods, and to recal-culation of historical emissions. The following task forces are recognised (see Figure 1.1):
• Task Force on Agriculture and Land Use (TGL);
• Task Force on Energy, Industry and Waste Management
- ENINA;
• Task Force on Traffic and Transportation; • Task Force on Water - MEWAT;
• Task Force on Service Sector and Product Use - WESP. Every year, after collection of the emission data, several quality control checks are performed by the task forces during a yearly ‘trend analysis’ workshop. After approval by participating institutes, emission data are released for publication (www.prtr.nl). Subsequently, these data are disaggregated to regional emission data for national use (e.g. 5x5 km grid, municipality scale, provincial scale and water authority scale).
1.3.1
Point-source emissions
As result of the Netherlands’ implementation of the EU Directive on the European Pollutant Release and Transfer Register (E-PRTR), about 1,000 facilities, are in 2011 legally obligated to submit their emissions of pollutants to air when they exceed a certain threshold. For some pollut-ants, lower thresholds have been set in the Dutch imple-mentation of the E-PRTR directive (VROM, 2008). Through this, the total reported amount of the main pollutants for each subsector approximately meets 80% of the subsector total. This criterion has been set as safeguard for the quali-ty of the supplementary estimate for Small and Medi-um-sized Enterprises (SMEs).
As from 1 January 2010, the above-mentioned companies can only submit their emissions as part of an Annual Environmental Report (AER), electronically. All these companies have emission monitoring and registration systems with specifications in agreement with the competent authority. Usually, the licensing authorities (e.g. provinces, central government) validate and verify the reported emissions. Information from the AERs is stored in a separate database at the RIVM and formally remains property of the companies involved.
Data on point-source emissions in the AER database are checked for consistency by the task forces. The result is a selection of validated data on point-source emissions and activities (ER-I) which are then stored in the PRTR database (Dröge 2012). The ER-I data is combined with supplementary, estimates for Small and Medium-sized Enterprises (SMEs). Several methods are applied for calculating these emissions. TNO has derived emission factors for NOx emissions from small installations, for
instance (Van Soest-Vercammen et al., 2002), while, for other substances, the Implied Emission Factors (IEFs) derived from the AERs are applied to calculate sector emissions.
Figure 1.1 The organisational arrangement of the Netherlands Pollutant Release and Transfer Register (PRTR). www .p rtr .n l Ministry of IenM: • Dir. Climate, Air and Noise
• Dir. Gen. for Public Works and Water Management (RWS) Ministry of Economic • Dir. Agriculture PRTR Steering body • Ministry of IenM • IPO • PBL • RIVM Personnel (expertise) through general agreements and contracts with: • Statistics Netherlands (CBS) • Rijkswaterstaat: Environment - Centre for Water Management (WD) - Centre for Transport and Navigation (DVS) - Inspectie Leefomgeving en Transport (ILT) • PBL • TNO • LEI • Alterra (WUR) • Deltares • Fugro-Ecoplan • Livestock Research (WUR) Project leader PRTR at RIVM PRTR Executive body (WEM)
• Project leader PRTR • Representatives of the contributing institutes • Taskforce chairmen
Task force on agriculture and Land Use (TGL)
Task force ENINA (Energy, Industry and Waste)
and Transport Task force MEWAT (Emissions to Water)
Task force WESP (Service Sector and
Product Use) Working group on Uniforming Manure Numbers (WUM) Working group on Land Use, Land Use Change and
Forrestry (LULUCF) Interaction with Directorates of the involved Ministries Strategic decicion-makingStrategic decicion-making PRTR project group • Dir. Climate and Air • Dir. Gen. for Public Works and Water • Statistics Netherlands • RIVM
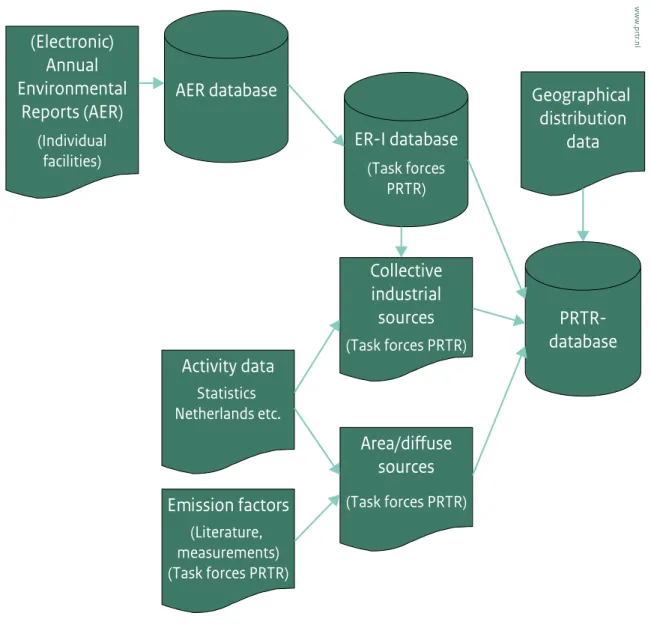
1.3.2 Data storage
In cooperation with the contributing research institutes, all emission data are collected and stored in the PRTR data-base managed by the RIVM.
Emission data from the ER-I database and from collec-tively estimated industrial and non-industrial sources are stored in the PRTR database (see Figure 1.2). The PRTR database, consisting of a large number of geographically distributed emission sources (about 700), contains complete annual records of emissions in the Netherlands.
Each emission source includes information on the NACE-code (Nomenclature statistique des activités économiques dans la Communauté européenne) and industrial subsector, separate information on process and combustion emissions, and the relevant environmental compartment and location. These emission sources can be selectively aggregated, per NFR category.
Figure 1.2 The data flow in the Netherlands Pollutant Release and Transfer Register.
(Electronic)
Annual
Environmental
Reports (AER)
(Individual
facilities)
AER database
ER-I database
Collective
industrial
sources
Area/di use
sources
Activity data
Emission factors
(Literature,
measurements)
(Task forces PRTR)
Geographical
distribution
data
PRTR-database
Statistics
Netherlands etc.
(Task forces
PRTR)
(Task forces PRTR)
(Task forces PRTR)
ww w .pr tr. nl1.4
Methods and data sources
Methods used in the Netherlands are documented in several reports and protocols, and in meta-data files, available from
www.prtr.nl
. However, some reports are only available in Dutch. For greenhouse gases (www.rvo.nl/nie), particulate matter (PM) and all emis-sions related to mobile sources, the documentation has been translated in English.In general, two emission models are used in the Netherlands:
• A model for emissions from large point sources (e.g. large industrial and power plants), which are registered separately and supplemented with emission estimates for the remainder of the companies within a subsector (based mainly on IEFs from the individually registered companies). This is the so-called bottom up method. • A model for emissions from diffuse sources (e.g. road
transport, agriculture), which are calculated from activity data and emission factors from sectorial emission inventory studies in the Netherlands (e.g. SPIN documents produced by the ‘Cooperation project on industrial emissions’).
1.5
Key source analysis
Following recommendations 9 and 10 from the Stage 3 in-depth review report for the Netherlands (UNECE, 2010), a trend assessment was carried out for the emission inventory of all components, in addition to a level assessment, to identify key source categories. In both approaches key source categories were identified using a cumulative threshold of 80%. Key categories are those which, when summed together in descending order of magnitude, add up to more than 80% of the total level (EEA, 2009). The level assessments were performed for both the latest inventory year 2012, as well as for the base year of the inventory, 1990. The trend assessments aim to identify categories for which the trend is significantly different from that of the overall inventory. See Appendix 1 for the actual analysis.
1.6
Reporting, QA/QC and archiving
Reporting
The Informative Inventory Report is prepared by the inventory compiling team at RIVM (RIVM-NIC), with con-tributions by experts from the PRTR task forces.
QA/QC
The RIVM has an ISO 9001:2008 based QA/QC system in place. The PRTR quality management is fully in line with
the RIVM QA/QC system. Part of the work for the PRTR is done by external agencies (other institutes). QA/QC arrangements and procedures for the contributing insti-tutes are described in annual project plans (RIVM, 2013; 2014). The general QA/QC activities meet the international inventory QA/QC requirements described in part A, chapter 6 of the EMEP inventory guidebook (EEA, 2009).
There are no sector-specific QA/QC procedures in place within the PRTR. In general, the following QA/QC activities are performed:
Quality assurance (QA)
QA activities can be summarised as follows:
• For the energy, industry and waste sectors, emission calculation in the PRTR is based mainly on AERs by companies (facilities). The companies themselves are responsible for the data quality; the competent authorities (in the Netherlands, mainly provinces and local authorities) are responsible for checking and approving the reported data, as part of the annual quality assurance;
• As part of the RIVM-quality system internal audits are performed at the Department for Emissions and air quality of the RIVM Centre for Environmental Quality; • Furthermore, there are annual external QA checks on
selected areas of the PRTR system.
Quality Control (QC)
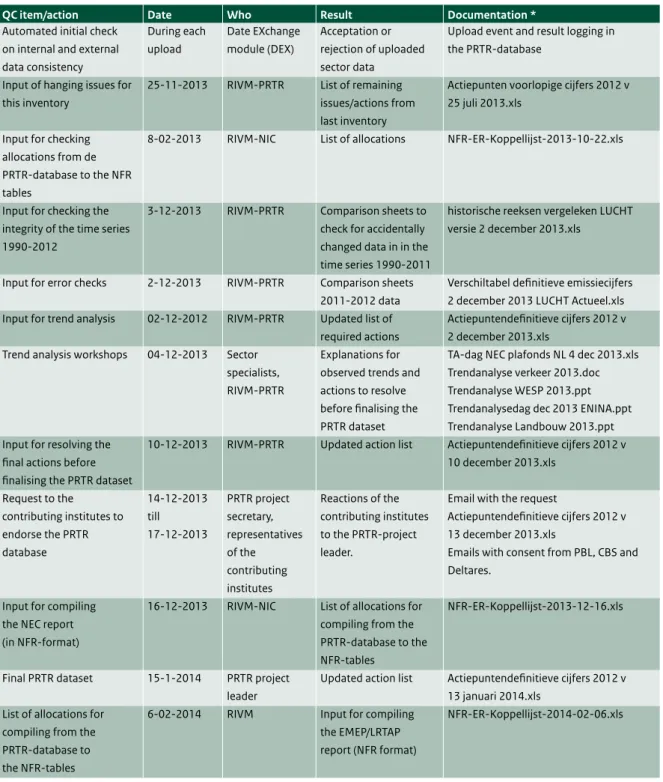
A number of general QC checks have been introduced as part of the annual work plan of the PRTR (for results see Table 1.1). The QC checks built into the work plan focus on issues such as consistency, completeness and accuracy of the emission data. The general QC for the inventory is largely performed within the PRTR as an integrated part of the working processes. For the 2013 inventory the PRTR task forces filled in a standard-format database with emis-sion data from 1990 to 2012. After an automated first check of the emission files, by the Data EXchange module (DEX) for internal and external consistency, the data becomes available to the specific task force for checking consistency and trend (error checking, comparability, accu-racy). The task forces have access to information on all emissions in the database, by means of a web-based emission reporting system, and are facilitated by the ER-team with comparable information on trends and time series. Several weeks before a final data set is fixed, a trend verification workshop is organised by the RIVM (see Text box 1.1). Results of this workshop, including actions for the taskforces to resolve the identified clarification issues, are documented at RIVM. Required changes to the database are then made by the task forces.
Table 1.1 Key items of the verification actions data processing 2013 and NFR/IIR 2014.
QC item/action Date Who Result Documentation *
Automated initial check on internal and external data consistency During each upload Date EXchange module (DEX) Acceptation or rejection of uploaded sector data
Upload event and result logging in the PRTR-database
Input of hanging issues for this inventory
25-11-2013 RIVM-PRTR List of remaining issues/actions from last inventory
Actiepunten voorlopige cijfers 2012 v 25 juli 2013.xls
Input for checking allocations from de PRTR-database to the NFR tables
8-02-2013 RIVM-NIC List of allocations NFR-ER-Koppellijst-2013-10-22.xls
Input for checking the integrity of the time series 1990-2012
3-12-2013 RIVM-PRTR Comparison sheets to check for accidentally changed data in in the time series 1990-2011
historische reeksen vergeleken LUCHT versie 2 december 2013.xls
Input for error checks 2-12-2013 RIVM-PRTR Comparison sheets 2011-2012 data
Verschiltabel definitieve emissiecijfers 2 december 2013 LUCHT Actueel.xls Input for trend analysis 02-12-2012 RIVM-PRTR Updated list of
required actions
Actiepuntendefinitieve cijfers 2012 v 2 december 2013.xls
Trend analysis workshops 04-12-2013 Sector specialists, RIVM-PRTR
Explanations for observed trends and actions to resolve before finalising the PRTR dataset
TA-dag NEC plafonds NL 4 dec 2013.xls Trendanalyse verkeer 2013.doc Trendanalyse WESP 2013.ppt Trendanalysedag dec 2013 ENINA.ppt Trendanalyse Landbouw 2013.ppt Input for resolving the
final actions before finalising the PRTR dataset
10-12-2013 RIVM-PRTR Updated action list Actiepuntendefinitieve cijfers 2012 v 10 december 2013.xls Request to the contributing institutes to endorse the PRTR database 14-12-2013 till 17-12-2013 PRTR project secretary, representatives of the contributing institutes Reactions of the contributing institutes to the PRTR-project leader.
Email with the request
Actiepuntendefinitieve cijfers 2012 v 13 december 2013.xls
Emails with consent from PBL, CBS and Deltares.
Input for compiling the NEC report (in NFR-format)
16-12-2013 RIVM-NIC List of allocations for compiling from the PRTR-database to the NFR-tables
NFR-ER-Koppellijst-2013-12-16.xls
Final PRTR dataset 15-1-2014 PRTR project leader
Updated action list Actiepuntendefinitieve cijfers 2012 v 13 januari 2014.xls
List of allocations for compiling from the PRTR-database to the NFR-tables
6-02-2014 RIVM Input for compiling the EMEP/LRTAP report (NFR format)
NFR-ER-Koppellijst-2014-02-06.xls
Text box 1.1 Trend verification workshops
About a week in advance of a trend analysis meeting, a snapshot from the database is made available by RIVM in a web-based application (Emission Explorer, EmEx) for checks by the institutes involved, sector and other experts (PRTR task forces) and the RIVM PRTR-team. In this way the task forces can check for level errors and consistency in the algorithm/method used for calculations throughout the time series. The task forces perform checks for relevant gases and sectors. The totals for the sectors are then compared with the previous year’s data set. Where significant differences are found, the task forces evaluate the emission data in more detail. The results of these checks form the subject of discussion at the trend analysis workshop and are subsequently documented.
Furthermore, the PRTR-team provides the task forces with time series of emissions per substance for the individual subsectors. The task forces examine these time series. During the trend analysis for this inventory the emission data were checked in two ways: 1) emissions from 1990 to 2011 from the new time series were compared with the time series of last year’s inventory and 2) the data for 2012 were compared with the trend development per gas since 1990. The checks of outliers are performed on a more detailed level of the subcategories in all sector background tables: • annual changes in emissions;
• annual changes in activity data;
• annual changes in implied emission factors and • level values of implied emission factors.
Exceptional trend changes and observed outliers are noted and discussed at the trend analysis workshop, resulting in an action list. Items on this list have to be processed within 2 weeks or be dealt with in next year’s inventory.
Archiving and documentation
Internal procedures are agreed on (e.g., in the PRTR work plan) for general data collection and the storage of fixed data sets in the PRTR database, including the documenta-tion/archiving of QC checks. As of 2010, sector experts can store relating documents (i.e. interim results, model runs, etc.) on a central server at the RIVM. These documents then become available through a limited-access website. Moreover, updating of monitoring protocols for substanc-es under the CLRTAP is one of the prioritisubstanc-es within the PRTR system. Emphasis is placed on documentation of methodologies for calculating SOx, NOx, NMVOC, NH3, PM10
and PM2.5. Methodologies, protocols and emission data
(including emissions from large point sources on the basis of Annual Environmental Reports), as well as such emission reports as the National Inventory Report (UNFCCC) and the Informative Inventory Report (CLRTAP), are made available on the website of the PRTR:
www.prtr.nl.
1.7 Uncertainties
Uncertainty assessments constitute a means to either provide the inventory users with a quantitative assess-ment of the inventory quality or to direct the inventory preparation team to priority areas, where improvements are warranted and can be made cost-effective. For these purposes, quantitative uncertainty assessments have been carried out since 1999. However, awareness of uncertain-ties in emission figures was expressed earlier in the PRTR in so-called quality indices and in several studies on industrial emissions and generic emission factors for
industrial processes and diffuse sources. To date, the Dutch PRTR gives only one value per type of emission (calculation result, rounded off to three significant digits). The information on the uncertainty about emission figures presented here is based on the TNO report ‘Uncertainty assessment of NOx, SO2 and NH3 emissions in the
Netherlands’ (Van Gijlswijk et al., 2004), which presents the results of a Tier 2 ‘Monte Carlo’ uncertainty assessment. This uncertainty assessment is based on emissions in the year 2000. Since then, several improvements in activity data and methods (e.g. total N to TAN; see Chapter 7) have been implemented. Therefore, it is necessary to update the uncertainty assessment. This is foreseen within the next years and results will be presented in the IIR in question. Then also a more detailed uncertainty analysis as suggested by the ERT in their Stage 3 in-depth review will be provided (UNECE, 2010).
1.7.1
Quantitative uncertainty
Uncertainty estimates on national total emissions have been reported in the Dutch Environmental Balances since 2000 (PBL, 2009). These estimates were based on uncertainties per source category, using simple error propagation calculations (Tier 1). Most uncertainty estimates were based on the judgement of RIVM/PBL emission experts. A preliminary analysis on NMVOC emissions showed an uncertainty range of about 25%. Van Gijlswijk et al., 2004) assessed the uncertainty in the contribution from the various emission sources to total acidification (in acidification equivalents) according to the Tier 2 methodology (estimation of uncertainties per source
category using Monte Carlo analysis). See Table 1.2 for results. A comparison was also made between the Tier 1 and Tier 2 methodologies. This was not straightforward, as the two studies used a different knowledge base. The 2000 Tier 1 analysis used CLRTAP default uncertainties for several NOx processes, which explains the difference with
the 1999 Tier 1 results. For NH3, the difference between the
2000 Tier 1 and Tier 2 can be explained by taking non-normal distributions and dependencies between individual emission sources per animal type into account (both are violations of the Tier 1 assumptions: effects encapsulated in the 1999 Tier 1 analysis). The differences for SO2 and
total acidifying equivalents are small. The conclusion drawn from this comparison is that focusing on the order of magnitude of the individual uncertainty estimates, as in the RIVM (2001) study, provides a reasonable first assessment of the uncertainty of source categories. The RIVM (2001) study draws on the results from an earlier study on the quality of nitrogen oxide (NOx) and sulphur
dioxide (SO2) emissions, as reported by individual
companies for point sources under their national reporting requirements. In addition to providing quantitative uncertainty estimates, the study yielded important
conclusions. For example, it was concluded that a limited number of facilities showed high uncertainties (e.g. 50% or more for NOx), which could be reduced with little extra
effort, and that companies generally have a lack of knowledge on the uncertainty about the emissions they report.
In the study by Van Gijlswijk et al. (2004), emission experts were systematically interviewed on quantitative uncer-tainties, which provided simultaneous information on the reliability and quality of the underlying knowledge base. For processes not covered by interviews, standard default uncertainties, derived from the Good Practice Guidance for CLRTAP emission inventories, were used (Pulles and Van Aardenne, 2001). The qualitative knowledge (on data validation, methodological aspects, empirical basis and proximity of data used) was combined into a score for data strength, based on the so-called NUSAP approach (Van der Sluijs et al., 2003; Van der Sluijs et al., 2005). The qualitative and quantitative uncertainties were combined in so-called diagnostic diagrams that may be used to identify areas for improvement, since the diagrams indicate strong and weak parts of the available knowledge (see Figure 1.3). Sources with a relatively high quantitative uncertainty and Figure 1.3 NUSAP diagnostic diagram indicating strong and weak elements in the available knowledge on acidifying substances.
0.0 0.5 1.0 1.5 2.0 2.5 3.0
Strength (average pedigree score) 0.00
0.05 0.10 0.15 0.20
Rank correlation squared
1 NH3 from dairy cows, manure application 2 NOx from mobile sources agriculture 3 NOx from agricultural soils
4 NH3 from pigs farmed for meat, manure application 5 NOx from gasoline passenger cars, along freeways 6 NH3 from dairy cows, animal housing and storage 7 NOx from articulated trucks, along freeways 8 NH3 from breeding stock pigs, manure application 9 NH3 from calves and yearlings, manure application 10 NH3 from synthetic fertilizer application
www .p rtr. nl 1 2 3 4 5 6 7 8 9 10 zoneSafe Danger zone
Table 1.2 Uncertainty (95% confidence ranges) in acidifying compounds and for total acidifying equivalents for emissions in 1999 (RIVM, 2001) and 2000 (Van Gijlswijk et al., 2004).
Component Tier 1 for 1999 Tier 1 for 2000 Tier 2 for 2000
NH3 ± 17% ± 12% ± 17%
NOx ± 11% ± 14% ± 15%
SO2 ± 8% ± 6% ± 6%
weak data strength are thus candidates for improvement. To effectively reduce uncertainties, their nature must be known (e.g. random, systematic or knowledge uncertain-ty). A general classification scheme on uncertainty typology is provided by Van Asselt (2000).
1.8
Explanation on the use
of notation keys
The Dutch emission inventory covers all relevant sources specified in the CLRTAP that determine the emissions to air in the Netherlands. Because of the long history of the inventory it is not always possible to specify all subsectors in detail. This is the reason why notation keys are used in the emission tables (NFR). These notation keys will be explained in tables 1.3 to 1.5.
Table 1.3 The Not Estimated (NE) notation key explained.
NFR code Substance(s) Reason for Not Estimated
1A2fii Cd, Cr, Cu, Ni Not in PRTR 1A3bv Cr, Cu, Zn Not in PRTR 1A3bvii Cd, Cr, Cu, Ni, Zn Not in PRTR
1A3c Cd Not in PRTR
1A3di(ii) Cd Not in PRTR 1A3dii Cd Not in PRTR 1A4aii Cd-Ni, Zn Not in PRTR 1A4bii Pb-Cu, Se, Zn Not in PRTR 1A4cii Cd-Ni, Zn Not in PRTR 1A4ciii Cd Not in PRTR 1A5b Cd Not in PRTR 2B2 NOx Not in PRTR 4B NMVOC Not in PRTR 4B2 NOx, NH3, TSP, PM10, PM2.5 Not in PRTR 4B3 TSP, PM10, PM2.5 Not in PRTR 4B7 NOx, NH3, TSP, PM10, PM2.5 Not in PRTR 6A NH3 Not in PRTR 6B NH3 Not in PRTR 6Cd NH3, Pb, Cd, As-Zn, PAHs, HCB Not in PRTR 1A3aii(ii) All Not in PRTR 1A3ai(ii) All Not in PRTR
Table 1.4 The Included Elsewhere (IE) notation key explained.
NFR code Substance(s) Included in NFR code
1A3aii(i) All 1A3ai(i) 1A3e All 1A2fi, 1A4cii,
1B2b 1B1a TSP, PM10, PM2.5 2G
1B2c NMVOC, TSP, PM10, PM2.5, CO
1B2b, 1B2aiv 2A2 NOx, NMVOC, SO2 2A7d
2A5 NMVOC 2A7d
2A6 NOx, NMVOC, SO2 2A7d 2B1 NMVOC, NH3 2B5a 2B2 NH3 2B5a 2B4 NMVOC 2B5a 2C2 All 1A2a 2C5f All 1A2b 3C NMVOC 2B5a 4B3 NOx 4B4 4B9c NOx, NH3, TSP, PM10, PM2.5 4B9b 4B9d NOx, NH3, TSP, PM10, PM2.5 4B9b 4D1a NOx 11C 4D2c NOx 11C 4D2c NH3 4B 6A NOx, NH3, TSP, PM10, PM2.5, CO, PAHs 1A5a 6B NOx, NMVOC, NH3, TSP, PM10, PM2.5, CO, PAHs 1A4ai 6Cc All 1A1a 6Cd NOx, SO2, NH3, CO 1A4ai
Table 1.5 Sub-sources accounted for in reporting ‘other’ codes, with NO/NA meaning not occurring or not applicable.
NFR code Substance(s) reported Sub-source description
1A2f combustion (not reported elsewhere) in industries, machineries, services, product-making activities
1A5a combustion gas from landfills 1A5b recreational navigation
1B1c NO/NA
1B3 NO/NA
2A7d processes, excl. combustion, in building activities, production of building materials 2B5a production of chemicals, paint, pharmaceutics, soap, detergents, glues and other
chemical products
2B5b NO/NA
2C5e production of non-ferrous metals
2C5f NO/NA
2G making products of wood, plastics, rubber, metal, textiles, paper. Storage and handling
3A3 NO/NA
4B13 NOx, NH3, TSP, PM10, PM2.5
pets, rabbits and fur-bearing animals
4G NMVOC, Zn volatilization of crops and from use of pesticides
6D handling waste
7A NOx, NH3, TSP, PM10, PM2.5
smoking tobacco products and burning candles; transpiration, breathing, manure application to private domains and nature, horses and ponies from private owners
7B NO/NA
11C NOx volatilization of NO from agricultural and non-agricultural land
1.9
Missing sources
The Netherland’s emission inventory covers all important sources.
2
Trends in
emissions
2.1
Trends in national emissions
In 2012, the Dutch NOx and NH3 emissions have further
decreased below the national emission ceiling set for the year 2010 (NEC2010). For NH3, SO2 and NMVOC the
Netherlands already complied with the respective ceilings in 2010. The emissions of all substances showed a downward trend in the 1990-2012 period (see Table 2.1). The major overall drivers for this trend are:
• emission reductions in the industrial sectors; • cleaner fuels;
• cleaner cars.
Road transport emissions have decreased 87% since 1990 for NMVOC, 66% for PM, 64% for NOx and 98% for SO2,
despite a growth in road transport of 23%. The decrease is mainly attributable to European emission regulations for new road vehicles. For PM and NOx, standards have been
set for installations by tightening up the extent of emission stocks of heating installations (BEES). In meeting these requirements, Dutch industrial plants have realised a reduction of 93% in PM emissions and 62% in NOx
emissions, since 1990. Sections 2.2-2.8 elaborate in more detail on the drivers for the downward emission trend for specific substances.
Table 2.1 Total national emissions, 1990-2012.
Main Pollutants Particulate Matter Priority Heavy Metals
NOx CO NMVOC SOx NH3 TSP PM10 PM2.5 Pb Cd Hg Year Gg Gg Gg Gg Gg Gg Gg Gg Mg Mg Mg 1990 575 1145 482 192 355 91 69 46 331 2.1 3.5 1995 477 943 341 129 208 69 51 34 154 1.1 1.4 2000 395 792 238 73 162 46 39 24 28 0.9 1.0 2005 337 683 172 64 143 40 33 19 30 1.7 0.9 2010 272 605 168 34 127 34 28 15 38 2.5 0.5 2011 257 583 149 34 125 34 28 14 23 1.1 0.6 2012 248 561 146 34 120 31 27 13 16 0.8 0.5 NEC 2010 ceiling 260 185 50 128 1990-2012 period 1) -327 -584 -336 -158 -235 -60 -43 -34 -315 -1.3 -3.0 1990-2012 period 2) -57% -51% -70% -82% -66% -66% -62% -72% -95% -62% -84% 1) Absolute difference in Gg 2) Relative difference to 1990 in %
POPs Other Heavy Metals
DIOX PAH As Cr Cu Ni Se Zn Year g I-Teq Mg Mg Mg Mg Mg Mg Mg 1990 743 20.1 1.5 11.8 37.2 75.7 0.4 223.1 1995 69 9.8 1.0 8.5 38.5 87.0 0.3 144.4 2000 30 3.8 1.1 4.9 39.6 19.2 0.5 93.5 2005 38 3.8 1.5 4.2 41.5 11.2 2.6 85.7 2010 30 3.7 0.8 3.8 46.9 2.2 1.5 107.9 2011 30 3.8 1.2 3.6 46.4 2.5 0.8 105.1 2012 23 3.5 1.1 3.6 45.1 2.2 0.8 105.7 1990 - 2012 period 1) -719 -16.2 -0.4 -8.2 7.9 -73.5 0.4 -117.5 1990 - 2012 period 2) -97% -81% -28% -69% 21% -97% 104% -53% 1) Absolute difference in Gg 2) Relative difference to 1990 in %
2.2 Trends in sulphur dioxide (SO
2)
The Dutch SOx emissions (reported as SO2) decreased by
158 Gg in the 1990-2012 period, corresponding to 82% of the national total in 1990 (Figure 2.1). Main contributions to this decrease came from the energy, industry and transport sectors. The use of coal declined and major coal-fired electricity producers installed flue-gas desulphurisation plants. The sulphur content in fuels for the (chemical) industry and traffic was also reduced. At present the industry, energy and refining sector (IER) is responsible for 94% of the national SO2 emissions.
2.3 Trends in nitrogen oxides (NO
x)
The Dutch NOx emissions (NO and NO2, expressed as NO2)
decreased by 327 Gg in the 1990-2012 period, correspond-ing to 57% of the national total in 1990 (Figure 2.2). Main contributors to this decrease are the road-transport and energy sectors. Although emissions per vehicle decreased significantly in this period, an increase in number and mileages of vehicles partially negated the effect on total road transport emissions. The shares of the different NFR categories in the national total did not change
significantly. Figure 2.1. SO2 emission trend, 1990-2012.
1990 1995 2000 2005 2010 0 50 100 150 200 Gg 6 Waste 1A3 Transport 2 Industrial processes 1A2 Industrial & Small combustion 1A1a Energy
SO
2emissions
www.pr tr .nlFigure 2.2 NOx emission trend, 1990–2012.
1990 1995 2000 2005 2010 0 100 200 300 400 500 600 Gg Other 1A2 Industry 1A1 Energy 1A3 Transport
NO
xemissions
www.pr tr. nl2.4 Trends in ammonia (NH
3)
The Dutch NH3 emissions decreased by 235 Gg in the
1990-2012 period, corresponding to 66% of the national total in 1990 (Figure 2.3). This decrease was due to emission reductions from agricultural sources. The direct emissions from animal husbandry decreased slightly because of decreasing animal population and measures to reduce emissions from animal houses. Application emissions decreased because of measures taken to reduce the emissions from applying manure to soil and to reduce the total amount of N applied to soil. At present, 90% of Dutch NH3 emissions come from agricultural sources.
2.5 Trends in non-methane volatile
organic compounds (NMVOC)
The Dutch NMVOC emissions decreased by 336 Gg in the 1990-2012 period, corresponding with 70% of the national total in 1990 (Figure 2.4). All major source categories contributed to this decrease: transport (introduction of catalysts and cleaner engines), product use (intensive programme to reduce NMVOC content in consumer products and paints) and industry (introducing emission abatement specific for NMVOC).
Figure 2.3 NH3 emission trend, 1990 - 2012.
1990 1995 2000 2005 2010 0 100 200 300 400 Gg Other 4 Other agricultural 4B9 Poultry 4B8 Swine
NH
3emissions
www.pr tr. nlFigure 2.4 NMVOC emission trend, 1990–2012.
1990 1995 2000 2005 2010 0 100 200 300 400 500 Gg Other 2 Industrial processes 3 Solvents 1A3 Transport
NMVOC emissions
www.pr tr. nl2.6 Trends in PM
10Dutch PM10 emissions decreased by 43 Gg in the 1990-2012
period, corresponding with 62% of the national total in 1990 (Figure 2.5). The major source categories contributing to this decrease are:
• industry (combustion and process emissions), due to cleaner fuels in refineries and the side-effect of emission abatement for SO2 and NOx;
• traffic and transport.
PM10 emissions from animal husbandry in agriculture did
not change significantly; neither did the emissions from consumers (1A4bi).
2.7 Trends in PM
2.5PM2.5 emissions are calculated as a specific fraction of PM10
by sector (based on Visschedijk et al., 1998) and decreased by 34 Gg in the 1990-2012 period, corresponding with 72% of the national total in 1990 (Figure 2.6). The two major source categories contributing to this decrease were the industrial sector (combustion and process emissions), due to cleaner fuels in refineries and the side effect of emission abatement for SO2 and NOx and the transport sector.
Figure 2.5 PM10, emission trend, 1990–2012.
1990 1995 2000 2005 2010 0 20 40 60 80 Gg Other 4 Agriculture 1A3 Transport 1A1, 2, 3 Energy & industry
PM
10emissions
www.pr tr .nl 1990 1995 2000 2005 2010 0 20 40 60 80 Gg Other 4 Agriculture 1A3 Transport 1A1, 2, 3 Energy & industryPM
10emissions
www.pr
tr
.nl
Figure 2.6 PM2.5 emission trend, 1990–2012.
1990 1995 2000 2005 2010 0 10 20 30 40 50 Gg Other 1A3 Transport 2 Industrial processes 1A Energy
PM
2.5emissions
www.pr tr. nl2.8 Trends in Pb
Lead (Pb) emissions in the Netherlands decreased by 315 Mg in the 1990-2012 period, corresponding with 95% of the national total in 1990 (Figure 2.7). This decrease is attributable to the transport sector, where, due to the removal of Pb from gasoline, the Pb emissions collapsed. The remaining sources are industrial process emissions, in particular from the iron and steel industry.
Figure 2.7 Pb, emission trend 1990-2012.
1990 1995 2000 2005 2010 0 100 200 300 400 Mg Other 1A3 Transport 2 Industrial processes 1A Energy
Pb emissions
www.pr tr. nl 1990 1995 2000 2005 2010 0 100 200 300 400 Mg Other 1A3 Transport 2 Industrial processes 1A EnergyPb emissions
www.pr tr. nl3
Energy
3.1
Overview of the sector
Emissions from this sector include all energy-related emissions from industrial activities and transport. Furthermore, they include fugitive emissions from the energy sector.
About 80% to 100% of the NOx, SO2, PM and NH3
emissions from stationary Combustion (categories 1A1, 1A2, 1A4 and 1A5) are reported based on environmental reports by large industrial companies. The emission data in the Annual Environmental Reports (AERs) come from direct emission measurements or from calculations using fuel input and emission factors.
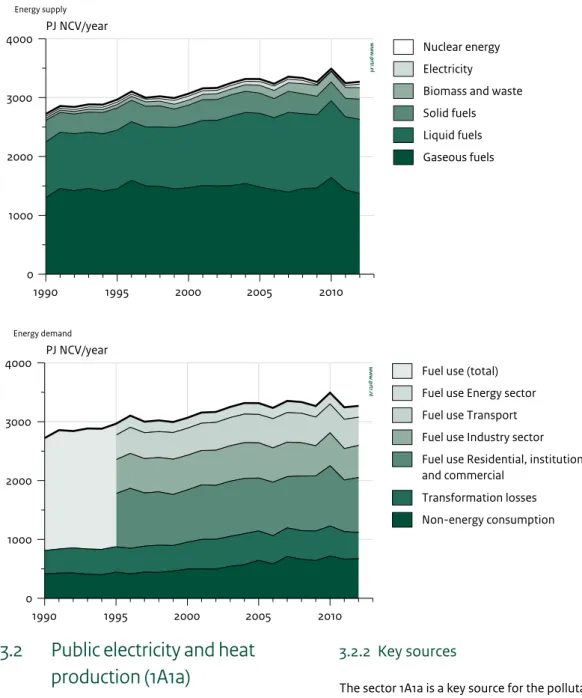
As for most developed countries, the energy system in the Netherlands is largely driven by the Combustion of fossil fuels. In 2012, natural gas supplied about 42.0% of the total primary fuels used in the Netherlands, followed by liquid fuels (38.5%) and solid fossil fuels (10.5%). The contribution of non-fossil fuels, including renewables and waste streams, is rather limited (5.9%). Figure 3.1 shows the energy supply and energy demand in the Netherlands.
3.2 Public electricity and heat
production (1A1a)
3.2.1 Source category description
In this sector, one source category is included: Public electricity and heat production (1A1a). This sector consists mainly of coal-fired power stations and gas-fired cogen-eration plants, with many of the latter being operated as joint ventures with industries. Compared to other countries in the EU, nuclear energy and renewable energy (biomass and wind) provide a small amount of the total primary energy supply in the Netherlands.
3.2.2 Key sources
The sector 1A1a is a key source for the pollutants men-tioned in Table 3.1.
Figure 3.1 Energy supply and demand in the Netherlands. For the years 1990 - 1994, only the total fuel use is shown.
1990 1995 2000 2005 2010 0
1000 2000 3000
4000 PJ NCV/year Fuel use (total)
Fuel use Energy sector Fuel use Transport Fuel use Industry sector Fuel use Residential, institutional and commercial Transformation losses Non-energy consumption www.pr tr. nl Energy demand 1990 1995 2000 2005 2010 0 1000 2000 3000
4000 PJ NCV/year Nuclear energy
Electricity Biomass and waste Solid fuels Liquid fuels Gaseous fuels www.prtr .nl Energy supply
Table 3.1 Pollutants for which the Public electricity and heat (NFR 1A1a) sector is a key source.
(Sub)category Pollutant Contribution to national total in 2012 (%)
1A1a Public electricity and heat production SOx 23.9 NOx 8.6 Hg 35.7 Cd 5.5 Dioxins 35.7 HCB 100
The incineration of wastes (with heat recovery) is the only recognized source of HCB emission in the Netherlands.
3.2.3 Overview of shares and trends in
emissions
An overview of the trends in emissions is shown in Table 3.2. For almost all pollutants emissions decreased between 1990 and 2012, while fuel consumption increased by 14% over the same period.
The emissions from the main pollutants decreased by 30% to 83%. Emissions from other pollutants decreased by 67% to 99%. The decrease in emissions was partly caused by a shift from coal to gas consumption. Furthermore, the decrease in emissions was caused by technological improvements. The only pollutants for which the emis-sions have increased are NMVOC, NH3 and Se due to an
increase in activity rate.
3.2.4 Activity data and (implied) emission
factors
Emission data are based on Annual Environmental Reports (AERs) and collectively estimated industrial sources. For this source category, 80% to 100% of the emissions are based on AERs. For estimation of emissions from collectively estimated industrial sources, National Energy Statistics (from Statistics Netherlands) are combined with implied emission factors from the AERs.
3.2.5 Methodological issues
Emissions are based on data in Annual Environmental Reports (AERs) from individual facilities (Tier 3 methodol-ogy). The emissions and fuel consumption data in the AERs are systematically examined for inaccuracies by checking the resulting implied emission factors (IEFs). If environmental reports provide data of high enough quality, the information is used for calculating an ‘implied Table 3.2 Overview of trends in emissions from Public electricity and heat production (1A1a).
Main Pollutants Particulate Matter Priority Heavy Metals
NOx CO NMVOC SOx NH3 TSP PM10 PM2.5 Pb Cd Hg Year Gg Gg Gg Gg Gg Gg Gg Gg Mg Mg Mg 1990 83 8 0.7 48 0.00 2.46 2.21 1.94 16.34 0.95 1.92 1995 62 7 1.1 17 0.04 0.98 0.62 0.41 1.56 0.16 0.38 2000 52 16 2.2 15 0.04 0.32 0.32 0.25 0.18 0.08 0.40 2005 43 8 0.6 10 0.25 0.82 0.54 0.45 0.24 0.09 0.38 2010 26 5 0.3 7 0.07 0.68 0.34 0.26 0.35 0.18 0.22 2011 23 4 0.3 7 0.08 0.69 0.21 0.18 0.37 0.09 0.22 2012 21 6 1.0 8 0.09 0.71 0.20 0.16 0.42 0.04 0.20 1990 - 2012 period 1) -60 -4 -0.4 -42 0.08 -1.77 -2.00 -1.76 -15.97 -0.86 -1.70 1990 - 2012 period 2) -73% -45% -56% -86% -72% -91% -91% -98% -91% -88% 1) Absolute difference in Gg 2) Relative difference to 1990 in %
POPs Other Heavy Metals
DIOX PAH As Cr Cu Ni Se Zn Year g I-Teq Mg Mg Mg Mg Mg Mg Mg 1990 568.0 0.17 0.50 0.62 2.05 2.49 0.02 40.66 1995 6.0 0.05 0.20 0.37 0.44 1.41 0.05 3.34 2000 0.1 0.00 0.08 0.19 0.17 0.08 0.45 0.26 2005 0.7 0.01 0.16 0.33 0.28 1.91 1.68 0.44 2010 1.2 0.01 0.11 0.12 0.15 0.16 1.33 11.33 2011 7.6 0.01 0.16 0.12 0.16 0.17 0.71 12.82 2012 1.2 0.02 0.15 0.13 0.23 0.17 0.73 13.45 1990 -2 011 period 1) -560.4 -0.16 -0.34 -0.50 -1.90 -2.32 0.69 -27.85 1990 - 2012 period 2) -98.7% -92% -68% -80% -92% -93% 3511% -68% 1) Absolute difference in Gg 2) Relative difference to 1990 in %
emission factor’ for a cluster of reporting companies (aggregated by NACE code). These emission factors are fuel and sector dependent and are used to calculate the emissions from companies that are not individually assessed.
EF ER-I (NACE category, fuel type) = Emissions ER-I (NACE category, fuel type)
Energy use ER-I (NACE category, fuel type)
where:
EF = emission factor
ER-I = Emission registration database for individual companies
Next, combustion emissions from the companies that are not individually assessed in this NACE category are calculated from the energy use according to the NEH (Netherlands Energy Statistics), multiplied by the implied emission factor. If the data from the individual companies are insufficient to calculate an implied emission factor, then a default emission factor is used (see table 3.3).
ER-C Emission (NACE category, fuel type) = EF ER-I (NACE category, fuel type)
* Energy NEH (NACE category, fuel type)
The total combustion emissions are the sum of the emission from the individual companies (ER-I) plus the emissions from the companies that are not individually assessed (ER-C).
3.2.6 Uncertainties and time-series
consistency
Uncertainties are explained in Section 1.7.
3.2.7 Source-specific QA/QC and verification
The emissions and fuel consumption data in the AERs are systematically examined for inaccuracies by checking the
resulting implied emission factors. If environmental reports provide data of high enough quality (see Section 1.3 on QA/QC), the information is used.
3.2.8 Source-specific recalculations
Emissions of the following sources have been recalculated: • PM2.5 emissions of all years and many sources have been
recalculated, partly as a result of a new PM2.5 fractions
and partly as a result of error corrections.
• Emissions of Hexachlorobenzene (HCB) have been recalculated for 1990 and 1995. In the previous submis-sion a default emissubmis-sion factor has been used for the entire time series, but this did not take into account that the Waste combustion installations have reduced their emissions significantly in the earlier years. The mitiga-tion measures which have been implemented for reducing Dioxin emissions will also affect the HCB emissions. Therefore, for the years 1990 and 1995, the HCB emissions have been related to the Dioxin emissions. Emissions have not been recalculated for the year 2000 and after.
• Emissions from Waste combustion and Electricity production have been recalculated for the years 2010 and 2011, based on improved emission data from individual companies.
3.2.9 Source-specific planned improvements
There are no source-specific planned improvements.
3.3
Industrial combustion (1A1b, 1A1c
and 1A2)
3.3.1 Source category description
This source category consists of the following categories: • 1A1b ‘Petroleum refining’
• 1A1c ‘Manufacture of solid fuels and other energy industries’
• 1A2a ‘Iron and steel’ • 1A2b ‘Non-ferrous metals’ Table 3.3 Emission factors for Electricity production (g/GJ).
Natural gas Biogas Cokes Domestic fuel oil
LPG Petroleum Coal Oil fuel
VOC 12 8 91 15 2 10 3 7 SO2 2 370 87 46 300 450 NOx 1) 1) 1) 1) 1) 1) 1) 1) CO 15 20 12,437 30 10 10 50 10 PM10 0.15 2 6 4.5 2 1.8 60 22.5 PM coarse 4 0.5 0.2 40 2.5 1) See table on NO
• 1A2c ‘Chemicals’
• 1A2d ‘Pulp, paper and printing’
• 1A2e ‘Food Processing, Beverages and Tobacco’ • 1A2fi ‘Other’
The sector 1A2fi includes industries for mineral products (cement, bricks, other building materials, glass), textiles, wood and wood products, machinery.
3.3.2 Key sources
The sectors 1A1b, 1A2a, 1A2c and 1A2fi are key sources for the pollutants mentioned in Table 3.4.
3.3.3 Overview of shares and trends in
emissions
An overview of the trends in emissions is shown in Table 3.5. Emissions have reduced since 1990 for most
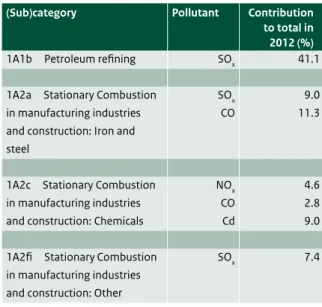
pollut-Table 3.4 Pollutants for which the Industrial combustion (NFR 1A1b, 1A1c and 1A2) sector is a key source.
(Sub)category Pollutant Contribution to total in 2012 (%)
1A1b Petroleum refining SOx 41.1 1A2a Stationary Combustion
in manufacturing industries and construction: Iron and steel
SOx CO
9.0 11.3
1A2c Stationary Combustion in manufacturing industries and construction: Chemicals
NOx CO Cd 4.6 2.8 9.0 1A2fi Stationary Combustion
in manufacturing industries and construction: Other
SOx 7.4
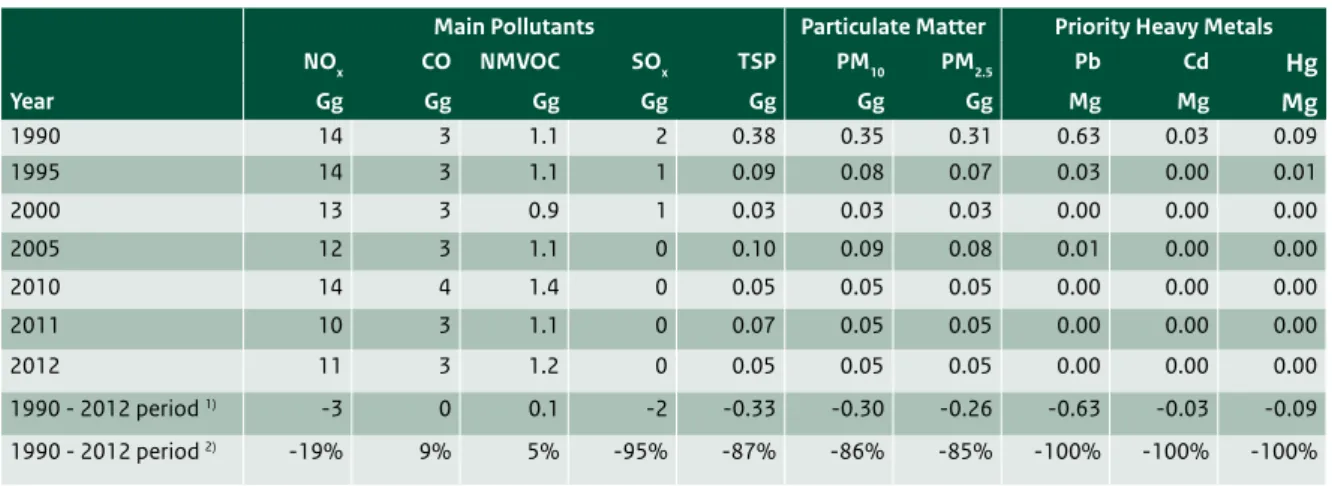
Table 3.5 Overview of trends in emissions from Industrial combustion.
Main Pollutants Particulate Matter Priority Heavy Metals
NOx CO NMVOC SOx NH3 TSP PM10 PM2.5 Pb Cd Hg
Year Gg Gg Gg Gg Gg Gg Gg Gg Mg Mg Mg 1990 101 267 10.4 110 0.58 8.95 8.12 6.63 1.89 0.14 0.18 1995 78 215 7.7 90 0.33 7.00 6.67 5.30 3.88 0.17 0.08 2000 49 161 2.5 46 0.05 4.88 4.78 3.11 0.04 0.01 0.11 2005 49 154 2.7 46 0.06 2.09 1.88 1.54 0.01 0.00 0.00 2010 40 124 5.1 24 0.45 0.77 0.53 0.38 3.08 1.28 0.02 2011 39 111 5.6 25 0.78 3.17 1.40 1.06 0.51 0.10 0.03 2012 38 105 5.3 24 0.75 0.82 0.55 0.40 0.37 0.07 0.03 1990 - 2012 period 1) -63 -162 -5.1 -87 0.18 -8.13 -7.57 -6.22 -1.51 -0.06 -0.15 1990 - 2012 period 2) -62% -61% -51% -78% 30% -91% -93% -94% -80% -47% -83% 1) Absolute difference in Gg 2) Relative difference to 1990 in %
POPs Other Heavy Metals
DIOX PAH As Cr Cu Ni Se Zn Year g I-Teq Mg Mg Mg Mg Mg Mg Mg 1990 0.01 1.02 0.17 2.49 1.39 64.60 0.04 2.95 1995 1.02 0.38 0.15 3.14 2.28 79.41 0.05 58.95 2000 0.35 0.00 0.00 0.51 0.15 17.40 0.00 10.30 2005 0.94 0.10 0.78 0.08 0.09 6.50 0.08 0.51 2010 5.79 0.12 0.01 0.14 1.13 0.02 0.12 9.81 2011 0.86 0.09 0.01 0.08 0.46 0.04 0.02 4.74 2012 0.67 0.09 0.01 0.06 0.35 0.05 0.00 2.92 1990 - 2012 period 1) 0.66 -0.93 -0.17 -2.43 -1.05 -64.55 -0.04 -0.02 1990 - 2012 period 2) 6621% -91% -97% -98% -75% -100% -97% -1% 1) Absolute difference in Gg 2) Relative difference to 1990 in %
ants, except for NH3 and dioxins. Reduction in emissions of
main pollutants has been caused by improvement in used abatement techniques. Fluctuation in dioxin emissions have been caused by differences in fuels used and/or incidental emissions. Emission reduction of SO2 and PM10 is
mainly caused by a shift in fuel use by refineries from oil to natural gas.
3.3.4 Activity data and (implied) emission
factors
Petroleum refining (1A1b)
All emission data have been based on Annual Environmental Reports (AERs).
Manufacture of solid fuels and other energy industries (1A1c) Emission data have been based on AERs and collectively estimated industrial sources.
Iron and steel (1A2a)
All emission data have been based on AERs and registered in the ER-I database.
Non-ferrous metals (1A2b)
Emission data have been based on AERs and collectively estimated industrial sources. For this source category, 5% of the NMVOC and NOx emissions and 2% of the PM
emissions are collectively estimated (in 2012). Chemicals (1A2c)
Emission data have been based on AERs and collectively estimated industrial sources. For this source category, 5% NOx emissions and 1% of the PM, CO and NMVOC
emissions are collectively estimated (in 2012). Pulp, paper and print (1A2d)
Emission data have been based on AERs and collectively estimated industrial sources. For this source category, 10% NMVOC emissions, 8% of NOx emissions and 3% of the PM and CO emissions are collectively estimated (in 2012). Food processing, beverages and tobacco (1A2e) Emission data have been based on AERs and collectively estimated industrial sources.
Other (1A2f)
This sector includes all combustion emissions from the industrial sectors not belonging to the categories 1A2a to 1A2e. Emission data have been based on AERs and collectively estimated industrial sources.
For some of the above mentioned categories, emissions were not entirely available from the AERs. For these sectors, emissions were calculated using National Energy Statistics (NEH) and implied emission factors from the environmental reports.
3.3.5 Methodological issues
Emissions are based on data in AERs from individual facilities (Tier 3 methodology). The emissions and fuel consumption data in the AERs are systematically examined for inaccuracies by checking the resulting implied emission factors. If environmental reports provide data of high enough quality, the information is used for calculating an ‘implied emission factor’ for a cluster of reporting companies (aggregated by NACE code). These emission factors are fuel and sector dependent and are used to calculate the emissions from companies that are not individually assessed.
EF ER-I (NACE category, fuel type) = Emissions ER-I (NACE category, fuel type)
Energy use ER-I (NACE category, fuel type)
where:
EF = emission factor
ER-I = Emission registration database for individual companies
Next, combustion emissions from the companies that are not individually assessed in this NACE category are calculated from the energy use according to the NEH (Netherlands Energy Statistics), multiplied by the implied emission factor. If the data from the individual companies are insufficient to calculate an implied emission factor, then a default emission factor is used (see table 3.6). Table 3.6 Emission factors for the industrial sector (g/GJ).
Natural gas Biogas Cokes Domestic fuel oil
LPG Petroleum Coal Oil fuel
VOC 12 8 91 15 2 10 3 7 SO2 2 370 87 46 300 450 NOx 1) 1) 1) 1) 1) 1) 1) 1) CO 15 20 12,437 30 10 10 50 10 PM10 0.15 2 6 4.5 2 1.8 60 22.5 PM coarse 4 0.5 0.2 40 2.5