Methods for
calculating the
emissions of
transport in the
Netherlands
2019Task Force on Transportation of the Dutch Pollutant Release and Transfer Register:
John Klein Statistics Netherlands
Hermine Molnár-in ‘t Veld Statistics Netherlands
Michel Sijstermans Statistics Netherlands
Gerben Geilenkirchen PBL Netherlands Environmental Assessment Agency
Maarten ‘t Hoen PBL Netherlands Environmental Assessment Agency
Jan Hulskotte TNO
Norbert Ligterink TNO
Stijn Dellaert TNO
Colophon
Methods for calculating the emissions of transport in the Netherlands. 2019 Statistics Netherlands
PBL Netherlands Environmental Assessment Agency TNO
RWS Water, Transport and Environment (WVL)
Contact:
Gerben Geilenkirchen, gerben.geilenkirchen@pbl.nl
Authors:
John Klein, Jan Hulskotte, Norbert Ligterink, Stijn Dellaert, Hermine Molnár, Michel Sijstermans, Maarten ’t Hoen, Gerben Geilenkirchen
The majority of the tables accompanying this report have been included in a separate Excel file. References to these tables are printed in italics. In addition to the data for the emission calculation, the tables also contain references and hyperlinks to the underlying data sources and data used for the calculation of the emission totals.
Table of contents
1 Introduction ... 5
1.1 Source categories within mobile sources ... 5
1.2 Reporting requirements and formats ... 6
1.3 Outline of the report ... 7
1.4 Uncertainties ... 8
1.5 General QA/QC program in the PRTR ... 8
2 Greenhouse gas emissions ... 9
2.1 Sources category description ... 9
2.2 Methodological issues ... 10
2.2.1 Domestic aviation ... 11
2.2.2 Road transportation ... 11
2.2.3 Railways ... 14
2.2.4 Waterborne navigation and fishing ... 15
2.2.5 Non-road mobile machinery ... 15
2.2.6 Military ... 16
2.2.7 Bunker fuels ... 16
2.3 Uncertainties and time series consistency ... 16
3 Road Transport ... 17
3.1 Source category description ... 17
3.2 Emissions processes and calculation methods ... 17
3.2.1 Technology dependant exhaust emissions ... 17
3.2.2 Fuel dependant exhaust emissions ... 19
3.2.3 Exhaust emissions of VOC and PAH species ... 20
3.2.4 Evaporative emissions of VOC and VOC components ... 20
3.2.5 PM emissions resulting from wear of tyres, brakes and road surfaces ... 21
3.2.6 Leakage of lubricant oil; heavy metals and PAHs ... 24
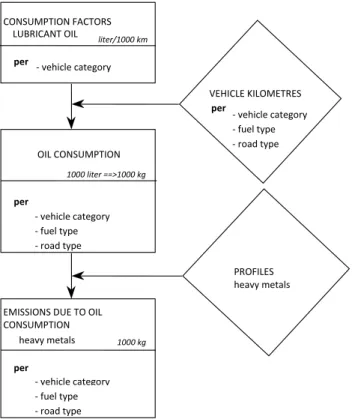
3.2.7 Consumption of lubricant oil; heavy metals ... 25
3.2.8 Fuel sold emissions from road transport... 25
3.3 Activity data for road transport ... 26
3.4 (Implied) Emission Factors for road transport ... 29
3.4.1 VERSIT+ emission factors for air pollutants ... 29
3.4.2 Fuel consumption and fuel related emission factors ... 33
3.4.3 Other emission factors ... 33
3.4.4 VOC species profiles ... 34
3.4.5 Emission factors for motorcycles and mopeds ... 35
3.5 Uncertainties ... 35
3.6 Points for improvement ... 37
4 Railways ... 38
4.1 Source category description ... 38
4.2 Activity data and (implied) emission factors ... 38
4.2.1 Exhaust emissions from railways ... 38
4.2.2 PM10 and heavy metals due to wear of overhead contact lines and carbon brushes ... 39
5.1 Source category description ... 40
5.2 Activity data and (implied) emission factors ... 41
5.2.1 Professional inland shipping ... 41
5.2.2 Passenger ships and recreational craft ... 44
5.2.3 De-gassing cargo fumes to the atmosphere ... 44
5.3 Uncertainties ... 45
5.4 Points for improvement ... 46
6 Fisheries ... 47
6.1 Source category description ... 47
6.2 Activity data and (implied) emission factors ... 47
6.3 Uncertainties ... 48
6.4 Points for improvement ... 48
7 Maritime navigation ... 49
7.1 Source category description ... 49
7.2 Activity data and (implied) emission factors ... 49
7.2.1 Emissions of sailing sea-ships ... 50
7.2.2 Emissions from seagoing vessels at berth ... 52
7.2.3 Exhaust emissions of SO2, N2O, NH3, heavy metals and VOC/PAH components ... 54
7.3 Uncertainties ... 55
7.4 Points for improvement ... 55
8 Civil aviation ... 56
8.1 Source category description ... 56
8.2 Activity data and (implied) emission factors ... 56
8.2.1 Exhaust emissions at Amsterdam Airport Schiphol... 57
8.2.2 Emissions from tyre and brake wear ... 58
8.2.3 Emissions from auxiliary power units ... 59
8.2.4 Emissions from ground support equipment ... 59
8.2.5 Emissions from storage and transfer of jet fuel ... 60
8.3 Uncertainties ... 60
8.4 Points for improvement ... 61
9 Non-Road Mobile Machinery ... 62
9.1 Source category description ... 62
9.2 Activity data and (implied) emission factors ... 62
9.2.1 Activity data ... 62
9.2.2 Emission Factors ... 63
9.2.3 Mobile machinery at container terminals ... 64
9.3 Uncertainties ... 65
9.4 Points for improvement ... 66
1 Introduction
The sources that cause emissions of environmental pollutants can roughly be divided into stationary and mobile sources. Examples of stationary sources are installations for generating heat and energy, such as central heating systems and electrical power plants, and installations where industrial processes take place. Mobile sources include various means of transport such as passenger cars, heavy-duty trucks, inland waterway vessels and aircraft, as well as mobile machinery with combustion engines, such as agricultural tractors and forklifts.
This report describes the methodologies, emission factors and activity data used to calculate the emissions of environmental pollutants from mobile sources in the Netherlands. These emissions are calculated annually by the Task Force on Transportation of the Dutch Pollutant Release and Transfer Register (PRTR). The resulting greenhouse gas emissions are reported annually in the National Inventory Report, whereas the air polluting emissions are reported in the Informative Inventory Report. Both inventory reports give a brief description of the trends in emissions and the methodologies used to calculate emissions. The methodologies and underlying data used are described in detail in the present report.
This report describes the methodologies used for calculating the emissions for the 1990-2017 time series, as reported in the 2019 National Inventory Report (RIVM 2019a) and the 2019 Informative Inventory Report (RIVM 2019b). The report has been compiled by the members of the Task Force on Transportation of the PRTR, which includes members of Statistics Netherlands, the PBL Netherlands Environmental Assessment Agency, the Netherlands Organisation of Applied Scientific Research TNO and the RWS Water, Transport and Environment (WVL) of the Dutch Ministry of Infrastructure and Navigation. For a more general description of the Dutch PRTR and the different task forces, please refer to the website of the PRTR (www.emissieregistratie.nl).
The majority of the tables accompanying this report have been included in a separate Excel file. References to these tables are printed in italics. In addition to the data for the emission calculation, the tables also contain references and hyperlinks to the underlying data sources used for the calculation of the emissions.
1.1 Source categories within mobile sources
This report covers the methodologies used for calculating both the greenhouse gas emissions and the emissions of air pollutants by mobile sources in the Netherlands. Mobile sources include:
• Road transportation • Railways • Civil aviation • Inland navigation • Maritime navigation • Fisheries
• Non-Road Mobile Machinery • Military shipping and aviation
For each source category, various processes are distinguished that result in emissions of greenhouse gases and air pollutants:
• Wear of overhead contact lines and carbon brushes on trains, trams and metros;
• Support systems on board ships (heating, electricity generation, refrigeration and pumping).
This report only covers emissions to air. The emissions to water from mobile sources are reported by the MEWAT taskforce of the PRTR. This includes emissions to water from:
• Anti-fouling on recreational boats;
• Coatings and bilge water from inland waterway vessels;
• Leakage of propeller shaft grease and spillage from inland waterway vessels; • Corrosion of zinc anodes on inland waterway vessels and locks;
• Leaching from seagoing vessels and fishery vessels in harbours and national continental shell; • Anodes of seagoing vessels and fishery vessels in harbours and on the national continental shelf. For more information about the methodologies, activity data and emission factors used to calculate the emissions from these emission sources, please refer to the documentation on the PRTR-website.
1.2 Reporting requirements and formats
The emissions from the PRTR are used for air quality modelling and for emission reporting to the UN and the EU. Under the UN Framework Climate Change Convention (UNFCCC) and the EU Monitoring Mechanism Regulation (MMR), countries are obliged to annually report national emissions of greenhouse gases. The emissions of air pollutants are reported under the UNECE Convention on Long-Range Transboundary Air Pollution (LRTAP) and the EU National Emission Ceilings Directive (NECD). The reporting guidelines and formats for these reporting obligations differ. The present report covers the methodologies used for both obligations. Greenhouse gas emissions are reported in the annual National Inventory Report (NIR) and the accompanying ‘Common Reporting Format’ (CRF) tables, based on the reporting obligations and guidelines from the 2006 IPCC Guidelines (IPCC 2006). Emissions from air pollutants are reported in the Informative Inventory Report (IIR) and the accompanying tables, using the ‘Nomenclature For Reporting’ (NFR) and the UNECE Guidelines for reporting emissions and projections data under the LRTAP convention (UNECE 2015). The CRF and NFR codes used to report emissions for the different source categories are mentioned in the different chapters of the present report.
The estimates of emissions from mobile sources are also used for air quality monitoring. For these purposes, emissions are estimated for the Dutch national territory. Where methodologies for calculating emissions on national territory differ from methodologies used to calculate official greenhouse gas (CRF) and air pollutant (NFR) emissions, this is described in chapters 3 to 9. Table 1A gives a short overview of the emissions included in the different reporting obligations.
Table 1A Emissions included in different reporting obligations
Source category Greenhouse gases (CRF) Air pollutants (NFR) Air pollutants (air quality modelling)
Civil aviation Domestic only; LTO & cruise. International aviation memo item
Domestic & international;
LTO only Domestic & international; LTO only Road Transportation Based on fuel sold in NL Based on fuel sold in NL Based on fuel used in NL Railways Based on fuel sold in NL Based on fuel sold in NL Based on fuel sold in NL Water-borne inland navigation Domestic only.
International memo item All emissions on Dutch national territory All emissions on Dutch national territory Non-Road Mobile Machinery Based on fuel used in NL Based on fuel used in NL Based on fuel used in NL Fishing Based on fuel sold in NL Based on fuel sold in NL Based on fuel used in NL Military aviation and shipping Based on fuel sold in NL Not included separately Not included separately Maritime navigation Memo item; based on fuel
For civil aviation, the CRF includes greenhouse gas emissions from domestic aviation, i.e. all flights that both depart and arrive in the Netherlands. Emissions from international aviation, with either departure or arrival abroad, are reported as a memo item and are not included in the national totals. Emissions are calculated based on the amount of fuel supplied to national and international aviation. The NFR includes emissions from both national and international aviation, but only throughout the Landing and Take-off cycle (LTO). Cruise emissions are not included in the national totals. Air quality modelling also uses the LTO-emissions from air pollutants by civil aviation, as reported in the NFR.
For road transport and for railways, both the CRF and the NFR include emissions resulting from the fuel supplied to road transport and railways in the Netherlands. The activity data for both reporting obligations are identical. Since some of this fuel is used abroad, the emission totals are not suited for air quality modelling. For air quality modelling the emissions from road transport are derived using statistics on vehicle kilometres driven (and resulting fuel used) in the Netherlands. For railways there is no bottom-up calculation of air pollutant emissions in the Netherlands due to the lack of activity data on train kilometres driven. Air quality modelling therefore uses the same emission totals for railways as reported in the NFR. For inland navigation, the CRF includes greenhouse gas emissions from domestic navigation, i.e. all voyages that both depart and arrive in the Netherlands. Emissions from international navigation, with either departure or arrival abroad, are reported as a memo item and are not included in the national totals. The NFR includes all emissions of air pollutants from inland navigation within Dutch national territory, including the emissions from international navigation. As such, the activity data differ for both reporting obligations. The NFR emission totals are also used for air quality modelling.
For fisheries, both the CRF and the NFR include emissions resulting from the fuel deliveries to fisheries in the Netherlands (i.e. fuel sold). Not all emissions resulting from these fuel deliveries take place on Dutch national territory. Specifically for air quality modelling, emissions of air pollutants are estimated on the Dutch part of the North Sea.
For non-road mobile machinery (NRMM), both the CRF and the NFR include emissions resulting from all fuel used by NRMM in the Netherlands. Since fuel sales to NRMM are not reported separately in the Energy Balance, fuel consumption is estimated using a modelling approach. To ensure consistency with national energy statistics, the total fuel sales data from the Energy Balance (including sales to both road transport and NRMM) are adjusted accordingly. Emission totals from the NFR are also used for air quality modelling. Emissions from maritime navigation are reported as a memo item in both the CRF and the NFR, but the activity data differ between both reporting obligations. The CRF includes total fuel sold (and resulting emissions) to maritime navigation in the Netherlands, regardless of where the fuel is subsequently used. The NFR includes the emissions of air pollutants by maritime shipping on the Dutch part of the North Sea, regardless of whether or not the fuel used was delivered in the Netherlands or abroad. The emission estimates from the NFR are also used for air quality modelling.
Emissions from military aviation and navigation are included in the CRF, based on the fuel deliveries for military purposes in the Netherlands. The NFR does not include emissions from military aviation or shipping due to a lack of data on number of flights and voyages and the types of air planes and ships used. Due to this lack of emissions estimates, emissions from military aviation and shipping are also not included in air quality modelling.
1.3 Outline of the report
The current report describes the methodologies and underlying data used to estimate emissions from mobile sources in the Netherlands. Chapter two covers the methodologies used for calculating emissions of greenhouse gases by mobile sources. The remaining chapters cover the methodologies used for
description of the activity data and (implied) emission factors, the uncertainty estimates and the points for improvement.
The (trends in the) emission totals for the different source categories and the source-specific recalculations are described annually in the NIR and IIR. The present report only covers the methodologies used. Table 1.1 of the accompanying table set gives an overview of the share of the different mobile source categories in the national emission totals for greenhouse gases and air pollutants and in the emission totals of mobile sources. Table 1.2 gives an overview of the annual changes in methodologies. A general description of the PRTR QA/QC program is given in paragraph 1.5 below. Source-specific QA/QC procedures are described in the NIR and IIR.
1.4 Uncertainties
The reporting guidelines for emissions of both greenhouse gases and air pollutants require Parties to quantify uncertainties in their emission estimates. The uncertainty estimates for emissions from mobile sources are covered in the present report. Uncertainty estimates for greenhouse gas emissions have been quantified and are described in Chapter 2.3. For air pollutants, uncertainty estimates per source category are presented in chapters 3 to 9.
1.5 General QA/QC program in the PRTR
The annual work plan of Dutch PRTR includes a description of QA/QC processes that will be carried out before emissions can be finalized. The QA/QC procedures of the PRTR focus on consistency, completeness and accuracy of the emission data. The general QA/QC for the inventory is largely performed within the PRTR as an integrated part of the work processes. Once emission data have been uploaded by the different taskforces to the PRTR database, automated checks are performed by the data exchange module (DEX) for internal and external consistency. Results are reported back to the taskforces for checking. Several weeks before the emission data are finalized, a trend verification workshop is organized. Results of this workshop, including actions for the taskforces to resolve the identified issues that need further clarification, are documented. Required changes to the database are then made by the taskforces.
Before the trend verification workshop, a snapshot from the PRTR emission database is made available to the task forces. Task forces are required to check for level errors and consistency in the algorithm/method used for calculations throughout the time series. The task forces perform checks for relevant gases and sectors. The sector totals are also compared with previous year's data. Significant changes need to be verified and explained. Also, the emission data for the latest year that was added to the time series is compared with previous years to check for temporal consistency. The results of all checks are subject of discussion at the trend analysis workshop and are subsequently documented.
2 Greenhouse gas emissions
This chapter covers the methodologies used for calculating the greenhouse gas emissions from mobile sources in the Netherlands. Since these methodologies differ from those used for calculating emissions of air pollutants, they are covered in a separate chapter. The emissions of greenhouse gases from mobile sources in the Netherlands are reported annually in the National Inventory Report (NIR) and the accompanying ‘Common Reporting Format’ (CRF) tables, based on the reporting obligations from the 2006 IPCC Guidelines (IPCC 2006).
2.1 Sources category description
The greenhouse gas emissions from mobile sources are reported under different sources categories in the CRF, as is shown in Table 2A. Emissions from transport are reported under 1A3, which includes emissions from civil aviation (1A3a), various means of road transportation (1A3b), railways (1A3c) and water-borne navigation (1A3d). Emissions from non-road mobile machinery are reported under different source categories in the CRF, based on the sectors where the machinery is applied:
• Emissions from industrial and construction machinery are reported under 1A2g; • Emissions from commercial and institutional machinery are reported under 1A4a; • Emissions from residential machinery are reported under 1A4b;
• Emissions from agricultural machinery are reported under 1A4c.
Emissions from fisheries are reported under 1A4c as well, whereas emissions from military aviation and shipping are reported under 1A5b. Emissions from bunker fuels, delivered to international aviation and water-borne navigation, are not part of the national emission totals, but instead are reported as a memo item under source category 1D1. Table 2A gives an overview of the methodologies used for calculating the greenhouse gas emissions, with Tier 1 (T1) being the most basic approach and Tier 3 (T3) the most detailed. The table also shows whether the emission factors used are country-specific values (CS) or default values (D) derived from the 2006 IPCC Guidelines.
Table 2A Greenhouse gas emission reporting for mobile sources in the CRF
CRF code Source category description Methodology Emission factors*
1D1a International bunkers (International Aviation) T1 D 1D1b International bunkers (International Navigation) T1, T2 D, CS 1A2gvii Manufacturing industries and construction, other (Off-road vehicles
and other machinery) T1, T2 D, CS
1A3a Domestic aviation T1 D, CS
1A3b Road Transportation T2, T3 D, CS
1A3c Railways T1, T2 D, CS
1A3d Domestic Navigation T1, T2 D, CS
1A4aii Commercial/Institutional (Off-road vehicles and other machinery) T1, T2 D, CS 1A4bii Residential (Off-road vehicles and other machinery) T1, T2 D, CS 1A4cii Agriculture/Forestry/Fishing (Off-road vehicles and other
machinery) T1, T2 D, CS
1A4ciii Fishing T2 D, CS
1A5b Mobile (Military use) T2 D, CS
2D3 Non-energy Products from Fuels and Solvent Use (Other) T3 CS *) CS = country-specific; D = default
Source category 1A3a (domestic aviation) includes emissions from domestic aviation in the Netherlands, i.e. all aviation with departure and arrival in the Netherlands. This includes emissions from overland flights which depart from and arrive at the same airport. Emissions from fuel deliveries to international aviation are reported under 1D1a and are not part of the national emission totals. Similarly, source category 1a3d (domestic navigation) only includes emissions from domestic navigation. This includes the emissions from recreational craft, passenger and freight shipping and so-called ‘work-at-sea’. Emissions from international water-borne navigation, i.e. navigation with either arrival or departure abroad, are reported as a memo item under 1D1b. Emissions from fisheries are reported separately in the inventory under source category 1A4ciii. In line with the 2006 IPCC Guidelines, all emissions from fishing are part of the national emission totals; there is no international bunker fuel category for commercial fishing, regardless of where the fishing occurs.
Emissions from military aviation and water-borne navigation are reported under source category 1A5b. This includes the emissions resulting from the combustion of jet kerosene and marine fuel for military aviation and navigation. The emissions by the land forces are not reported separately but are included in the emissions by road transport and mobile machinery.
Source category 1A3b (road transportation) includes all emissions from motorized road transport in the Netherlands. This includes emissions from passenger cars (1A3bi), light-duty trucks (1A3bii), heavy-duty trucks and buses (1A3biii) and motorcycles and mopeds (1A3biv). It also includes CO2 emissions from the
use of lubricants by two-stroke mopeds and motorcycles. CO2 emissions resulting from the use of
urea-based additives in catalytic converters in road vehicles are reported under source category 2D3. Source category 1A3c (Railways) includes greenhouse gas emissions from diesel fuelled railway transportation in the Netherlands.
2.2 Methodological issues
Greenhouse gas emissions from mobile sources in the Netherlands are calculated based on the formula:
Emission (kg) = Σtype of fuel fuel sales (kg) * heating value (MJ/kg) * Emission factor (kg/MJ)
The activity data (i.e. the fuel sales per fuel type) are derived from the Energy Balance, as reported by Statistics Netherlands. Table 2.1 shows the activity data used for the most recent inventory. The heating values and the CO2-emission factors per fuel type are country-specific, as shown in Table 2.2. The N2O and
CH4 emission factors for the most part are defaults, the only exception being the emission factors for road
2.2.1 Domestic aviation
Greenhouse gas emissions from domestic civil aviation are calculated using a fuel-based Tier 1 methodology. Fuel deliveries for domestic aviation are derived from the Energy Balance. This includes deliveries of both jet kerosene and aviation gasoline. The time-series for deliveries of both jet kerosene and aviation gasoline for domestic aviation are shown in Table 2.1.
The heating values and CO2 emission factors for aviation gasoline are derived from the Netherlands’ list of
fuels (Zijlema 2019) and are based on measurements of gasoline for road transport, as described in the NIR 2019. For jet kerosene default values are used from the 2006 IPCC Guidelines (IPCC 2006). These values are shown in Table 2.2A. For N2O and CH4 default emission factors are used, as shown in Table 2.2B. Since civil
aviation is a minor source of greenhouse gas emissions in the Netherlands and is not a key source in the inventory, the use of a Tier 1 methodology to estimate emissions is deemed sufficient.
Emissions of precursor gases (NOx, CO, NMVOC and SO2), reported in the CRF under ‘domestic aviation’, are
the uncorrected emission values from the Netherlands Pollutant Release and Transfer Register and refer to all aircraft emissions during landing and take-off (LTO) cycles at Dutch airports. The methodology used to calculate LTO-emissions of air pollutants is described in chapter 8. No attempt has been made to estimate non-greenhouse gas emissions specifically related to domestic flights (including cruise emissions of these flights), since these emissions are negligible.
2.2.2 Road transportation
According to the 2006 IPCC Guidelines, greenhouse gas emissions from road transport should be attributed to the country where the fuel is sold. Total fuel consumption by road transport therefore should reflect the amount of fuel sold within the country’s territory. To comply with this, activity data for greenhouse gas emissions from road transport are derived from the Dutch national Energy Balance. The Energy Balance includes fuel sales data for gasoline, diesel, Liquefied Petroleum Gas (LPG), natural gas (CNG) and biofuels, as shown in Table 2.1. Fuel sales data for gasoline from the Energy Balance are adjusted for the use of gasoline in recreational craft, which is not reported separately in the Energy Balance but instead is included in road transport. In the same manner, LPG sales to road transport from the Energy Balance are adjusted for the use of LPG by NRMM, which is also not reported separately in the Energy Balance. These adjustments are also shown in Table 2.1.
Fuel sales data for road transport in the Energy Balance are not reported by vehicle category. For emissions reporting, total sales per fuel type are disaggregated to the various vehicle categories (e.g. passenger cars, light duty trucks) in accordance with their share in total fuel consumed on Dutch national territory (fuel used), as calculated bottom-up using vehicle-kilometres travelled per vehicle type and the specific fuel consumption per vehicle-kilometre. The fuel sales data are used to calculate total emissions, whereas the bottom-up calculated fuel consumption data are used to split these fuel sales per fuel type among the different vehicle categories included in the CRF. The (bottom-up) calculation of fuel consumption by road transport in the Netherlands is described in detail in in Sections 3.3 and 3.4.
The resulting fuel consumption figures differ from fuel sales data due to varying reasons: • Stockpiling is included in fuel sales data;
• Both approaches (fuel consumption and fuel sales) contain statistical inaccuracies;
• Cross-border refuelling. This concerns fuel purchased in the Netherlands (included in sales) that is used abroad (not included in consumption) or fuel purchased abroad (not included in sales) that is used in the Netherlands (included in consumption).
Heating values and CO2 emission factors for road transport
The CO2 emissions from road transport are calculated using a Tier 2 methodology. Country-specific heating
values and CO2 emission factors are derived from Swertz et al. (2017), as shown in Table 2.7 and 2.8. These
values were derived from measurement campaigns performed in 2004 (Olivier 2004) and in 2015-2017 (Ligterink 2016). The methodology used to derive a consistent time series for both the heating values and CO2 emission factors for gasoline and diesel is described in Swertz et al. (2017). A summary is given below.
The composition of both gasoline and diesel has changed throughout the time series, e.g. due to the introduction of leadfree gasoline, the addition of biofuels in the market fuels and the lowering of the sulphur content of the fuels. In 2015, measurements were performed on 25 gasoline and 19 diesel fuel samples (Ligterink, 2016). Samples were collected in both summer and winter at stations representing different brands (including budget stations) and in different regions in the Netherlands. The methods used for sample analysis are described in Ligterink (2016). Due to some outliers in the results, additional measurements were performed in 2017. Fuel samples were collected monthly across the Netherlands, mixed in equal fractions (typically 6 samples, ranging from 4 to 7) and subsequently analysed to estimate monthly averages. Based on both measurement programmes, the average heating value for fossil gasoline was calculated to be 43.0 MJ/kg and the average CO2 EF was 3170 g/kg fuel. In order to construct a
consistent timeseries, the following assumptions were made:
• The previously used heating value in the Energy Balance for gasoline of 44.0 MJ/kg was assumed to be applicable to the start of the time series, i.e. 1970. The CO2 EF was assumed to be 3200 g/kg
fuel.
• The (average) measurement results from Olivier (2004) were assumed to be applicable to lead-free gasoline without added biofuels, which was measured at the time.
• The decrease of the heating value between 1970 and 2004 was assumed to be resulting from the replacement of lead by oxygenates. The decrease of the lead content of gasoline between 1986 and 1997 was used as a proxy to construct a time series.
• The increase in the heating value between 2004 and 2015 was assumed to be resulting from the addition of bioethanol in the market fuel. As such, the increase of the amount of bioethanol added to the market fuel was used as a proxy for the increase of the heating value between 2004 and 2015.
For diesel fuel, the heating value of fossil diesel is based on the 2004 measurements (43.1 MJ/kg) and the 2015 measurements (43.2 MJ/kg). The heating value of 42.7 MJ/kg (which was used in inventory reports before 2018) was assumed to apply to the situation in 1970. The change in the heating values during 1970– 2015 has been determined on the basis of the heating value-reducing sulphur content (Swertz et al., 2017). The carbon content of diesel fuel measured in 2004, which leads to a CO2 EF of 3170 g/kg, has been applied
for the entire period 1970–2004. The average CO2 EF for market diesel fuel of 3121 g/kg, measured in 2015,
has been applied for 2015 and 2016. After correction for the biofuel content in the samples, this gives 3130 g/kg for fossil diesel fuel. The values between 2004 and 2015 have been interpolated on the basis of market biofuel content.
The resulting heating values and CO2 EFs for gasoline and diesel are also applied in the emissions
calculations for railways (1A3c), domestic waterborne navigation (1A3d), NRMM and fisheries (1A2 & 1A4). Table 2.2A shows the heating values and CO2 EFs used for LPG and CNG, which were derived from the
N2O and CH4 emissions from road transport
N2O and CH4 emissions from road transport are dependant not only on the fuel type, but also on the
combustion and emission control technology and the operating conditions of the vehicles. Emissions of N2O
and CH4 from road transport therefore are calculated using a Tier 3 methodology, based on vehicle
kilometres travelled on Dutch territory and technology-specific emission factors, expressed in grams per vehicle kilometre travelled. In this bottom-up approach, vehicle types are distinguished according to: Vehicle type, e.g. passenger cars, light-duty trucks, heavy-duty trucks and buses;
Fuel type, e.g. gasoline, diesel, LPG and natural gas;
Emission control technology, as a function of the different Euro standards per fuel type for pollutant emissions;
Operating conditions, using different emission factors for urban driving, rural driving and highway driving and the degree of congestion per road type.
The different vehicle categories used in the emission calculation are shown in Table 3.1. The activity data used for the bottom-up approach is derived from Statistics Netherlands and is described in Chapter 3.3. N2O is primarily emitted by petrol and LPG vehicles equipped with three-way catalysts. Most emissions
result from the cold start, when the catalyst is not yet warmed-up. The country-specific emissions factors for N2O are derived from Kuiper & Hensema (2012). For older vehicle types, emission factors are derived
from national emission measurement programmes (Gense and Vermeulen, 2002 & Riemersma et al., 2003). For recent generations of road vehicles with new emission reduction technologies, emission factors are derived from the 2013 EEA Emission Inventory Guidebook. The N2O emission factors per vehicle type and
road type are shown in Table 3.16.
CH4 emissions from road transport are derived from total VOC emissions using VOC species profiles. The
country-specific VOC emission factors for the different vehicle categories are shown in Table 3.29 and are derived from the VERSIT+ emission factor model. The VERSIT+ model and resulting emissions factors are described in Chapter 3.4. The mass fraction of CH4 in total VOC emissions is dependent on the fuel type,
vehicle type and – for petrol vehicles – whether or not the vehicle is equipped with a three-way catalyst. Petrol-fuelled vehicles equipped with a catalyst emit more CH4 per unit of VOC than vehicles without a
catalyst. In absolute terms, however, passenger cars with catalysts emit far less CH4 than passenger cars
without a catalyst because total VOC emissions are far lower. The country-specific VOC species profiles used to derive CH4 emissions from total VOC emission are shown in Table 3.27.
To make sure CH4 and N2O emissions from road transport are consistent with fuel sales data, the
bottom-up approach described above is used to calculate fleet average CH4 and N2O emission factors per unit of
fuel used. These emission factors are consequently combined with the fuel sales data from the Energy Balance, as shown in Table 2.1, to calculate total CH4 and N2O emissions from road transport. Therefore,
N2O and CH4 emissions are consistent with fuel sold.
Emissions resulting from the use of biofuels in road transport are reported separately in the CRF. CO2
emissions are reported as a memo item and are not part of the national emissions total. CH4 and N2O
emissions from biofuels are included in the national emissions total. The emissions calculation for biofuels is comparable to that for fossil fuels and is based on sales data for biodiesel and ethanol, as derived from the Energy Balance (Table 2.1). Emissions of CH4 and N2O from biodiesel and ethanol are calculated using
the same EFs as are used for fossil diesel and gasoline, respectively. Emissions measurement programmes use market fuels (Spreen et al., 2016), including some biofuels. Therefore, the resulting EFs are representative of the market fuels that are used, which include small shares of biofuels.
CO2 emissions from lubricants
CO2 emissions from the use of lubricants in mopeds and motorcycles are included under source category
1A3biv. There are no data available on the number of two-stroke passenger cars in the Netherlands, but it is expected to be very small. Therefore, only the amount of lubricants used in two-stroke motorcycles and mopeds was estimated. The use of lubricants was estimated assuming that 1 kg of lubricants is used per 50 kg of gasoline (based on expert judgement by TNO). The resulting emissions are calculated with an oxidation factor of 100% and using default CO2 emission factors.
The remaining amount of lubricants used in transport is calculated as the difference between the total amount of lubricants sold (derived from the Energy Balance) and the estimated amount of lubricants used in two-stroke motorcycles and mopeds.
CO2 emissions from urea-based catalysts
CO2 emissions from urea-based catalysts are estimated using a Tier 3 methodology using country-specific
CO2 emission factors for different vehicle types. Selective Catalytic Reduction (SCR) technology has been
applied in diesel-fuelled heavy-duty vehicles since 2005 for reduction of NOx emissions. To estimate the CO2
emissions from urea-based catalysts, TNO carried out a study commissioned by the Dutch PRTR to estimate road type specific CO2 emission factors from the use of urea-additives. The resulting emission factors are
shown in Table 2.4. The use of urea-additive (AdBlue) was estimated as a percentage of diesel fuel consumption of 6% for Euro V engines and 3% for Euro VI engines. Table 2.5 shows the resulting estimates of urea use throughout the time series. Urea-additive CO2 emissions are calculated to be 0.6% or less of the
diesel fuel CO2 emissions for Euro V engines and 0.3% or less for Euro VI engines. The methodology used is
described in detail in Stelwagen & Ligterink (2014).
2.2.3 Railways
Fuel sales to railways in the Netherlands are derived from the Energy Balance, as shown in Table 2.1. Since 2010, Statistics Netherlands derives fuel sales data from Vivens, a recently founded co-operation of rail transport companies that purchases diesel fuel for the railway sector in the Netherlands. Before 2010, diesel fuel sales to the railway sector were obtained from Dutch Railways (NS). NS used to be responsible for the purchases of diesel fuel for the entire railway sector in the Netherlands.
CO2 emissions from railways are calculated using a Tier 2 methodology, based on fuel sales data and
country-specific heating values and CO2 emission factors (Swertz et al., 2017), as shown in Table 2.7 and
2.8. These heating values and CO2 emission factors were derived from different measurement campaigns,
as described in Section 2.2.2. There are no country specific emissions factors for CH4 and N2O available. As
such, CH4 and N2O emissions are calculated using a Tier 1 methodology, employing EFs derived from the
2016 EEA Emission Inventory Guidebook (EEA 2013). The Guidebook provides EFs for N2O (24 g/tonne fuel)
and CH4 (182 g/tonne fuel). The resulting EFs per MJ for railways are shown in Table 2.2B.
Default EFs from the EEA Guidebook were used instead of using defaults from the 2006 IPCC Guidelines, because the Guidebook is deemed to be the most representative source for CH4 and N2O EFs in the EU. The
default EFs for railways included in the 2006 IPCC Guidelines were also derived from the EEA Guidebook, but in this case from an older (2005) version.
Emissions from railways are not a key source in the inventory, so the use of Tier 1 and Tier 2 methodologies is deemed sufficient.
2.2.4 Waterborne navigation and fishing
Diesel fuel consumption for domestic inland navigation is derived from the Energy Balance. Gasoline fuel consumption for recreational craft is not reported separately in the Energy Balance, but is included under road transport. In order to calculate greenhouse gas emissions from gasoline fuel consumption by recreational craft, fuel consumption is estimated using a bottom-up approach as described in NNWB (2008). Gasoline fuel sales data for road transport, as derived from the Energy Balance, are corrected accordingly, as is shown in Table 2.1. The CO2 emissions from water-borne navigation are calculated using a Tier 2
methodology. The same country-specific heating values and CO2 emission factors for gasoline and diesel
are used for waterborne navigation as for road transport, as described in section 2.2.2. These values are derived from Swertz et al. (2017) and presented in Tables 2.7 and 2.8.
CH4 and N2O emissions from domestic water-borne navigation are derived using a Tier 1 methodology.
Neither the 2006 IPCC Guidelines nor the EEA Emission Inventory Guidebook provides specific N2O and CH4
emission factors for inland shipping. The Tier 1 default CH4 and N2O emission factors from the 2006 IPCC
Guidelines actually apply to diesel engines using heavy fuel oil. Since no emission factors are provided for diesel engines using diesel oil, the emission factors for heavy fuel oil are used in the inventory for diesel oil as well. N2O and CH4 emission factors for gasoline use by recreational craft are not provided in either the
Emission Inventory Guidebook or the IPCC Guidelines. Emission factors are therefore derived from gasoline use in non-road mobile machinery, as provided by the 2013 Emission Inventory Guidebook (EEA 2013). The resulting emission factors for N2O and CH4 are shown in Table 2.2B.
Fuel deliveries to national fishing are derived from the national Energy Balance, as shown in Table 2.1. In line with the 2006 IPCC Guidelines, all emissions from fishing are part of the national emission totals; there is no international bunker fuel category for commercial fishing, regardless of where the fishing occurs. The CO2 emissions from fisheries are calculated using a Tier 2 methodology. Country-specific heating values and
CO2 emission factors for diesel oil are similar to those for road transport and are derived from Swertz et al.
(2017), as shown in Tables 2.7 and 2.8. Heating values and CO2 emission factors for heavy fuel oil are derived
from the Netherlands’ list of fuels (Zijlema 2018), as shown in Table 2.2A. CH4 and N2O emissions from
fisheries are derived using a Tier 1 methodology. The emission factors are shown in Table 2.2B and are derived from the 2006 IPCC Guidelines.
2.2.5 Non-road mobile machinery
Fuel consumption by non-road mobile machinery (NRMM) in different economic sectors is calculated using a modelling approach. The EMMA model (Hulskotte & Verbeek 2009) uses sales data and survival rates for different types of machinery to estimate the composition of the active fleet. Combined with assumptions on the average use (annual operating hours), the average power output (in kW) and the fuel consumption per unit of work delivered for the different types of machinery, total fuel consumption of NRMM is estimated. The methodology of the EMMA model is similar to the methodology used in the EPA NON-ROAD USA model by the US Environmental Protection Agency (EPA), as described in Harvey et al. (2003). The methodology to estimate fuel consumption from NRMM is described in Chapter 9.
CO2 emissions from NRMM are estimated using a Tier 2 methodology. Country-specific heating values and
CO2 emission factors are used similar to those for road transport, as described in section 2.2.2. CH4 and N2O
emissions from NRMM are estimated using a Tier 3 methodology, using country specific emission factors derived from the EMMA model. The methodology takes into account the fleet composition and the impact of EU emissions legislation for VOC emissions from non-road engines. CH4 emissions are calculated as
2.2.6 Military
The fuel deliveries for military aviation and navigation are derived from the Energy Balance. This includes all fuel delivered for military aviation and navigation purposes within the Netherlands, including fuel deliveries to militaries of external countries. The fuel deliveries for the entire time series are shown in Table
2.1. The emission factors used for calculating greenhouse gas emissions resulting from military aviation and
water-borne navigation are presented in Table 2.2A and 2.2B. The CO2 emission factors are derived from
the Ministry of Defence, whereas the emission factors for N2O and CH4 are derived from Hulskotte (2004).
2.2.7 Bunker fuels
The deliveries of bunker fuels for international aviation and waterborne navigation are derived from the Energy Balance. CO2 emissions from bunker fuels are calculated using a Tier 1 and Tier 2 approach. Default
heating values and CO2 emission factors are used for heavy fuel oil and jet kerosene, whereas
country-specific heating values and CO2 emission factors are used for diesel oil, as shown in Table 2.2 and described
in Netherlands’ list of fuels (Zijlema 2019). CH4 and N2O emissions resulting from the use of bunker fuels
are calculated using a Tier 1 approach, using default emissions factors for both substances.
2.3 Uncertainties and time series consistency
The uncertainty estimates for the activity data and emission factors used for the different source categories described above are shown in Table 2.6. The sources for the uncertainty estimates are also shown in Table
2.6. The uncertainty estimates for the activity data are for the most part derived from the experts from
Statistics Netherlands who are responsible for compiling the Energy Balance. For most activity data the uncertainty is deemed rather small. Uncertainty in CO2 emission factors is based on expert judgement, as
described in the National Inventory Report. For CH4 and N2O emission factors, the uncertainty estimates for
the most part are derived from the 2006 IPCC Guidelines. In general, the uncertainty in CO2 emissions is
deemed rather small, whereas uncertainty in N2O and CH4 emissions is large. It should be noted that the
share of N2O and CH4 in total greenhouse gas emissions from transport (in CO2 equivalents) is very small.
Uncertainty estimates for activity data of civil aviation, road transport, railways and domestic waterborne navigation are derived from Statistics Netherlands. The uncertainty estimates for emission factors are taken from the 2006 IPCC Guidelines if default factors are applied. The uncertainties in emission factors for road transport and CO2 emission factors for other source categories are based on expert judgement, which were
determined in workshops. The uncertainty in total VOC emissions from road transport was estimated by Broeke and Hulskotte (2009).
3 Road Transport
3.1 Source category description
Road transport includes all motorized vehicles that are licensed and which travel on public roads. Road transport comprises, among other things, passenger cars, light-duty trucks, lorries, road tractors, buses, special purpose vehicles (such as fire trucks and refuse trucks) and powered two-wheelers such as motorcycles and mopeds.
Except for a small (but increasing) number of electric vehicles, road vehicles are equipped with a combustion engine for propulsion. In such engines, the chemical energy of fuels such as petrol, diesel and LPG is converted into mechanical energy. During this conversion process, various substances are emitted via the exhaust gas. In addition, emissions are released by the evaporation of motor fuels and coolants, the wear of brakes, tyres and the road surface, and the leakage and consumption of motor oil. Depending on the emission process, a specific calculation method is used. This is described in more detail in Section 3.2. The emissions of air pollutants by road transport are reported under source category ‘Road Transport’ (1A3b) in the NFR. This source category comprises all emissions from road transport in the Netherlands, including emissions from passenger cars (1A3bi), light-duty trucks (1A3bii), heavy-duty vehicles and buses (1A3biii) and mopeds and motorcycles (1A3biv). It also includes evaporative emissions from road vehicles (1A3bv) and PM emissions from tyre and brake wear (1A3bvi) and road abrasion (1A3bvii). PM emissions caused by resuspension of previously deposited material are not included in this source category.
The UNECE Guidelines for reporting air pollutant emissions under the LRTAP convention (UNECE 2014) prescribe that emissions from road vehicle transport should be consistent with the national energy balance and therefore should ‘be calculated on the basis of the fuel sold in the Party concerned’. In order to derive air pollutant emissions on the basis of fuel sold in the Netherlands, emissions are first calculated ‘bottom-up’ using data on vehicle kilometres driven and specific emission factors per vehicle kilometre (i.e. on the basis of fuel used in the Netherlands). The resulting emissions on Dutch public roads are used annually for air quality modelling. For international reporting, the emissions are subsequently adjusted to correct for differences between fuel used and fuel sold in the Netherlands. This is described in detail below.
3.2 Emissions processes and calculation methods
Emissions from road transport originate from different processes, including exhaust emissions due to combustion of motor fuels in internal combustion engines of road vehicles, evaporation of motor fuels, and wear of tyres and brakes. Different methodologies are used for these processes, as described below. This section only describes the methodologies used, the actual activity data and emission factors used in these methodologies are described in Section 3.3. Spreen et al. (2016) provides a detailed overview of the methodology for assessment of road vehicle emissions in the Netherlands.
3.2.1 Technology dependant exhaust emissions
The exhaust emissions of carbon monoxide (CO), volatile organic compounds (VOC), nitrogen oxides (NOx),
ammonia (NH3) and particulate matter (PM10) depend on the type of fuel, the engine and exhaust gas after
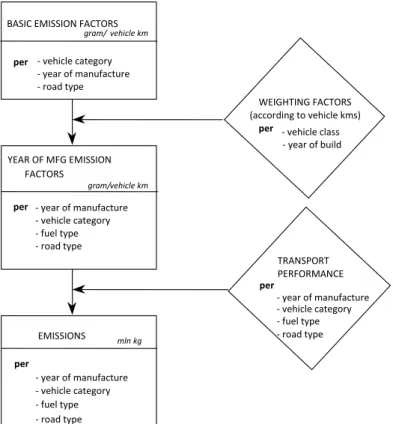
treatment technology, driving speed and driving behaviour. These emissions are calculated by multiplying the vehicle kilometres travelled on Dutch territory per vehicle type by emission factors per vehicle type, road type and congestion level, expressed in grams per vehicle kilometre. The emission factors are derived annually from measurements under test conditions, representing real-world use, and from real-world driving. Figure 3.1 shows the different steps for calculating the exhaust emissions of CO, VOC, NO, NH,
(passenger cars, light-duty trucks, etc.), weight class, fuel type, emission legislation class (Euro standards) and, for specific vehicle types, the engine and exhaust gas technology used to comply with the specific Euro standard (e.g. the use of Exhaust Gas Recirculation (EGR) or Selective Catalytic Reduction (SCR) to comply with Euro V emissions standards for heavy-duty engines). Table 3.1 shows the vehicle categories used according to type of fuel and weight class. Table 3.2 shows the different environmental regulations (Euro standards) for light-duty and heavy-duty vehicles, including the specific dates when the legislation entered into force. Table 3.37 shows the shares of different exhaust gas technologies applied for specific Euro classes. Table 3.38 shows the shares of hybrid vehicles and CNG vehicles in vehicle sales per Euro class.
Figure 3.1 Calculating emissions from road transport, actual emissions of CO, VOC, NOx, N2O, NH3, and PM10
due to combustion of motor fuels
When determining the vehicle class specific emission factors, a distinction is made between three road types. This includes travelling within the urban area (RT1), on rural roads (the roads outside the urban area with a typical speed limit of 80 km/hour; RT2) and on motorways (RT3). The distinction between road types is necessary because emissions per vehicle kilometre can differ significantly as a result of differences in maximum speed and driving dynamics (degree of acceleration, deceleration, constant driving and idling). In addition, cold starts, which are characterized by relatively high emissions, mostly take place in urban areas. The annual vehicle kilometres travelled per vehicle type are derived from Statistics Netherlands, which uses odometer readings to estimate average annual mileages per vehicle type. These annual mileages are derived per fuel type and per year of build. For these reasons, the detailed emission factors are aggregated into year-of-manufacturing emission factors. To this end, the emission factors per vehicle class are weighed with the share in sales of new vehicles during a specific year (Tables 3.3 and 3.4). Tables 3.13 - 3.15 show the year-of-manufacturing emission factors for passenger cars, motorcycles and mopeds (3.13), light-duty trucks and special vehicles (3.14) and heavy-duty vehicles (3.15). These emission factors are then multiplied by the vehicle kilometres travelled to arrive at the emissions per vehicle category per road type. For the 1990-1997 period, the allocation of total vehicle kilometres travelled per vehicle type to the different road
BASIC EMISSION FACTORS
gram/vehicle km per - vehicle category
- year of manufacture - road type YEAR OF MFG EMISSION FACTORS gram/vehicle km per EMISSIONS mln kg per - year of manufacture - vehicle category - fuel type - road type WEIGHTING FACTORS
per - vehicle class - year of build TRANSPORT PERFORMANCE per - year of manufacture - vehicle category - fuel type - road type (according to vehicle kms) - year of manufacture - vehicle category - fuel type - road type
types is based on the figures from Statistics Netherlands about the use of roads. Recent allocation figures are based on a survey by Goudappel Coffeng (2010).
Figure 3.2 Calculating emissions from road transport, emissions of SO2 and heavy metals (cadmium, copper,
chrome, nickel, zinc, lead, vanadium) due to combustion of motor fuels
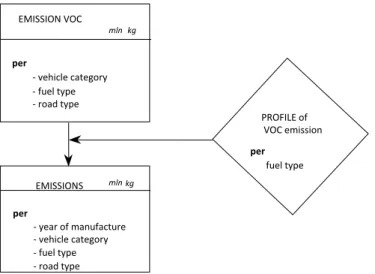
Figure 3.3 Calculating emissions from road transport, emissions of VOC and PAH components caused by combustion of motor fuels
3.2.2 Fuel dependant exhaust emissions
Figure 3.2 shows the calculation method used for the exhaust emissions of SO2 and heavy metals by road
transport. These emissions are directly related to the fuel consumption of vehicles and the type of fuel used. Fuel comprises sulphur and heavy metals, the internal combustion may change the chemical composition but the input of organically bound sulphur (in the fuel) is equal to the output of SO2 (exhaust
gas). The fuel consumption (the diamond in Figure 3.2) is derived by multiplying fuel consumption factors with the number of kilometres travelled by different types of vehicles in the Netherlands, as described in the next section. The emission calculation involves multiplying emission factors (gram/litre of fuel) with the fuel consumption per vehicle category, fuel type and road type.
EMISSION FACTORS gram/liter fuel per - fuel type EMISSIONS mln kg per - vehicle category - fuel type - road type FUEL CONSUMPTION per - vehicle category - fuel type - road type PROFILE of VOC emission per fuel type EMISSION VOC mln kg per - vehicle category - fuel type - road type EMISSIONS mln kg per - year of manufacture - vehicle category - fuel type - road type
3.2.3 Exhaust emissions of VOC and PAH species
The calculation of the exhaust emissions of approximately 70 different VOC species, including methane and PAHs, uses species profiles, as is shown in Figure 3.3. For each fuel type, a VOC species profile is used that indicates the fractions of the various VOC components in total VOC emission (Tables 3.27A-E). Different VOC species profiles are used for petrol-fuelled vehicles with and without a catalyst, because the catalyst oxidizes certain VOC components more effectively than others. The VOC and PAH profiles for each fuel type were obtained from a literature study (VROM 1993). For diesel powered vehicles from year of construction 2000 and later and petrol fuelled vehicles equipped with a 3-way catalytic converter, the profiles were derived from Ten Broeke & Hulskotte (2009).
3.2.4 Evaporative emissions of VOC and VOC components
Petrol evaporates to some extent from vehicles when they are parked, when they cool off after being used and while they are being used. The resulting evaporative emissions are calculated according to the methodology described in the European Emission Inventory Guidebook (EEA 2007). This methodology distinguishes three mechanisms which are primarily responsible for the evaporative emissions from petrol driven vehicles (in case of LPG, diurnal emissions only):
1. Diurnal emissions
Diurnal emissions are caused by the daily variation in the outdoor temperature. A rise in temperature will cause an increase of the amount of petrol vapour in the fuel system (i.e. the tank, fuel pipes and fuel injection system). Part of this vapour is emitted (together with air) from the system to prevent overpressure (tank breathing). Diurnal emissions mainly originate from the fuel tank and are independent of vehicle use. The diurnal emissions are expressed in grams per vehicle per day.
2. Running losses
The running losses occur while driving. The heat of the engine leads to the fuel heating up in the fuel system and thereby to evaporation of part of the fuel. In modern cars the use of the car has no influence on the fuel temperature in the tank. As such the running losses (and also hot and warm soak emissions) of these cars are very low. Running losses are expressed in grams per vehicle kilometre travelled.
3. Hot and warm soak emissions
Hot and warm soak evaporative emissions are caused by the engine heat and occur when a warmed up engine is turned off. The difference between hot soak and warm soak emissions is related to the engine temperature: hot soak occurs when the engine is completely warmed up. The evaporation of petrol is smaller when the engine is not yet entirely warmed up. Hot and warm soak emissions are expressed in grams per vehicle per stop.
The amount of petrol vapour released from these three mechanisms strongly depends on (variation in) outdoor temperatures, the fuel volatility and the type of fuel injection. Furthermore, running losses depend on vehicle use. Due to the application of carbon canisters in new cars since the early nineties, the evaporative losses of road transport have been reduced strongly. These canisters adsorb the majority of the evaporated petrol, which is led back into the engine. Figure 3.4 shows the emission calculation process for evaporative emissions. The Emission Inventory Guidebook includes a generic set of emission factors for each of the mechanisms mentioned above. Within these sets a distinction is made between the canister type, cylinder capacity, and average outdoor temperatures. Each set contains separate emission factors for cars with a carburettor and cars with fuel injection. Based on these factors a set of basic emission factors has been developed for Dutch circumstances (see Table 3.18), based on data on the composition and vehicle kilometres travelled of the Dutch car fleet. It was assumed that the introduction of canisters and fuel injection took place simultaneously with the introduction of three-way catalytic converters. The average outdoor temperatures in the Netherlands have been determined on the basis of data from the Dutch Meteorological Institute (KNMI) during 1990-2006. The basic emission factors have been converted into emission factors per vehicle per day for the Dutch situation (see Table 3.19). Finally it is assumed that 90% of the emissions take place in urban areas. The evaporative emissions of motor cycles and mopeds are
likewise calculated using emission factors from the Emission Inventory Guidebook 2007. Petrol vapour released during tanking is attributed to the fuel circuit (filling stations) and not to vehicle use. Due to the low volatility of diesel fuel the evaporative emissions of diesel powered vehicles have been assumed negligible.
Figure 3.4 Calculating emissions from road transport, emissions of volatile organic substances (VOC) and VOC components caused by evaporation of motor fuels
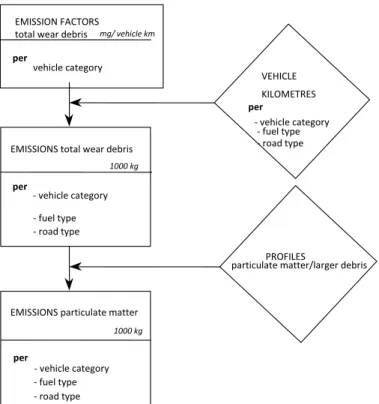
3.2.5 PM emissions resulting from wear of tyres, brakes and road surfaces
Wear of tyres, brakes and road surfaces result in particle emissions, some of which is PM10 and PM2.5. Figure
3.5 gives an overview of the calculation methodology for wear emissions.
Tyre wear of road vehicles
Vehicle tyres experience wear due to the friction between the tyres and the road. This results in emissions of particulate matter (PM). The PM-emissions resulting from tyre wear are calculated by multiplying vehicle kilometres travelled with emission factors (expressed in milligrams of tyre particulate matter emission per kilometre). The emission factors are calculated as the total mass loss of tyres resulting from the wear process and the number of tyres per vehicle category. The emission factors used are shown in Table 3.20A. The emission factors were derived from literature study (Ten Broeke et al., 2008). The differentiation of the emission factors per road type was estimated using the forces (acceleration, driving resistance, and braking) on the wheels of the vehicles as a proxy (Velders et al., 2009). It was assumed that 5% of the tyre PM-emissions consists of PM10, the remainder being larger fractions that do not stay airborne but are emitted
to the soil or surface water. The PM2.5/PM10 ratio is estimated to be 20% (see Table 3.35). Both fractions
were derived from Ten Broeke et al. (2009) and are highly uncertain.
EMISSION FACTORS
grams per vehicle per day per - year of manufacture - vehicle category - fuel type EMISSION VOCmln kg per - year of manufacture - vehicle category - fuel type NUMBER OF VEHICLES per - year of manufacture - vehicle category - fuel type PROFILE of VOC emission EMISSIONS VOC components mln kg per - vehicle category - road type
Figure 3.5 Calculating emissions from road transport, emissions of particulate matter (PM10) caused by wear
of tyres, brake linings and road surfaces
The emissions of heavy metals due to tyre wear are calculated by applying the heavy metal composition profile of tyre material. This composition is shown in Table 3.23B. It is assumed that the amount of heavy metals incorporated in PM10 is emitted to the air because PM10 particles remain airborne. The amount of
heavy metals incorporated in the coarse particle fraction (>PM10) deposits on the soil or the surface water.
Within urban areas, it is assumed that 60% of the coarse particle fraction ends up in surface water (Table
3.20B) which in this case means in the sewers, while 40% ends up in the soil. Outside urban areas, it is
assumed that 10% ends up in surface water and 90% in soil.
Wear of brake linings of road vehicles
Similar to the wear of tyres, emissions from wear of brake linings are also calculated using emission factors per vehicle kilometre travelled. The emission factors are shown in Table 3.20A. These emission factors were also derived from literature study (RWS, 2008). The differentiation of the emission factors per road type was estimated using the braking forces on the wheels of the vehicles as a proxy (Velders et al., 2009). It is assumed that the material emitted from brake linings comprises of 49% particulate matter (PM10) and 20%
larger fragments. The remainder of the material (31%) remains on the vehicle. The PM2.5/PM10 ratio is
estimated at 15% (see Table 3.35). Again, these estimates are highly uncertain due to a lack of empirical data.
The emissions of heavy metals caused by the wear of brake linings are calculated by applying a profile of the composition of brake lining material (Table 3.23B), derived from RWS (2008). For the allocation of the emissions of heavy metals to soil and water as a result of brake lining wear, the same percentages are used as with tyre wear emissions (3.23B).
EMISSION FACTORS
total wear debris mg/vehicle km per
vehicle category
EMISSIONS total wear debris
1000 kg per - vehicle category
- fuel type - road type per - vehicle category - fuel type - road type VEHICLE KILOMETRES 1000 kg per - vehicle category - fuel type - road type PROFILES
particulate matter/larger debris
Wear of road surface caused by road vehicles
The PM emissions of wear of road surface are calculated in the same manner as the emissions of tyre and brake lining particulate matter. It is assumed that the PM-emission of road surface wear caused by a vehicle is 1.6 times higher than the PM emission from tyre wear. The emission factors are shown in Table 3.20A and were based on literature study (Denier van der Gon et al., 2008). The differentiation of the emission factors per road type was estimated using the total lateral forces on the wheels of the vehicles as a proxy (Velders et al., 2009). It is assumed that the road surface wear PM emission comprises of 5% PM10, the
remainder being larger fragments. The PM2.5/PM10 ratiois estimated at 15% (Table 3.35). The emissions of
heavy metals from road surface wear were calculated in the past by using a profile of the composition of such fragments. Denier van der Gon et al. (2008) showed that hardly any heavy metals are released from road surfaces, so heavy metal emissions from road surface wear are no longer calculated.
Figure 3.6 Calculation of emissions from road transport, emissions of PAH components and heavy metals (cadmium, copper, chrome, nickel, selenium, zinc, arsenic, vanadium) caused by wear of tyres, brake linings and road surfaces
PAH emission factors for road surface wear were derived from Denier van der Gon et al. (2008). This study shows that in 1990 85% of the binders used in rural road and motorway surfaces were tar-based (TAG). After 1991 TAG was replaced by asphalt with bituminous binding agents, resulting in a major decrease of PAH-content of road surfaces. The PAH-emissions from road surfaces constructed after 1990 are considered negligible. As such, PAH emissions only occur from roads with a surface before 1991. Due to the gradual replacement of asphalt the old TAG is disappearing. It is estimated that in 2000 24% of the motorways and 51% of the rural roads contain TAG-asphalt. In 2004 this is reduced to 0% of the motorways and 27% of the rural roads. On roads in urban areas a major part of the road network consists of non-asphalt roads. It is assumed that 2015 asphalt applied before 1991 on roads in built-up areas, has been replaced. The phase-out of PAH-containing asphalt is shown in Table 3.25B.
Effects of open graded asphalt mixes
On motorways on which open graded asphalt mixes (called ZOAB in the Netherlands) are used, the coarse particles that are deposited onto the road surface are partially trapped and are not washed to the soil or surface water. Because open graded asphalt mixes are periodically cleaned (approximately twice per year), these "trapped" coarse particles (containing heavy metals) are removed from the environment. Based on a
EMISSIONS total wear debris
1000 kg per
- vehicle category - fuel type - road type
EMISSIONS heavy metals and PAH components
1000 kg per - vehicle category
- fuel type - road type
PROFILES heavy metals and PAH components
times lower than for closed graded asphalt mixes (see Table 3.25A). For PAHs, this is a factor of 2.5. In the meantime, a large percentage of the motorways have been provided with a top layer of open graded asphalt mixes (Table 3.25A). The table also shows the factors for heavy metals and PAHs with which the total quantities of heavy metals and PAHs that are deposited on open graded asphalt mixes must be multiplied to calculate the heavy metals and PAHs that are washed off the road surface.
Allocation to soil and surface water
The emission factors of tyre wear, brake lining wear and road surface wear, expressed in mg per vehicle kilometre, are shown in Table 3.20A. The profiles with respect to the allocation to water and soil (and air) are shown in Table 3.20B.
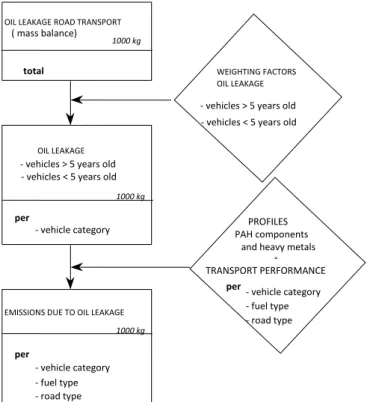
Figure 3.7 Calculation of emissions from road transport, emissions of heavy metals (cadmium, copper, chrome, nickel, zinc, arsenic, lead) and PAHs due to leakage of lubricant oil from vehicles
3.2.6 Leakage of lubricant oil; heavy metals and PAHs
The average oil leakage per vehicle kilometre travelled has been calculated in the past, derived from the total oil leakage in that year and the total number of vehicle kilometres. This calculation is based on measurements on roads that were interpreted by Feenstra and Van der Most (1985) and resulted in an average leakage loss of 10 mg per vehicle kilometre. The leakage losses for the various vehicle categories in road transport are calculated based on a set of factors, of which an example is given in Table 3.21. These factors are based on a number of assumptions that are listed in Table 3.22. One of the assumptions is that older vehicles have more leakage than younger vehicles (see also Figure 3.7).
The emission of heavy metals due to the leakage of lubricant oil depends on the composition of the oil. The heavy metal fractions in lubricant oil are shown in Table 3.26B. The calculation of the emission of PAH components due to oil leakage takes place in the same way as the calculation of heavy metals. Table 3.26B shows the composition used in the calculations (fractions of PAH components in lubricant oil).
OIL LEAKAGE ROAD TRANSPORT
( mass balance)
1000 kg total
1000 kg
EMISSIONS DUE TO OIL LEAKAGE 1000 kg per - vehicle category - fuel type - road type PROFILES PAH components
and heavy metals
WEIGHTING FACTORS OIL LEAKAGE
- vehicles > 5 years old - vehicles < 5 years old
OIL LEAKAGE
- vehicles > 5 years old - vehicles < 5 years old
- vehicle category
per
TRANSPORT PERFORMANCE
per - vehicle category
- fuel type - road type