on the Table
The influence of food choices
on nitrogen emissions and the
European environment
Special Report of the
European Nitrogen Assessment
6.5 - 8 million tonnes per year, representing around 80 % of reactive nitrogen emissions to the EUenvironment. These nitrogen losses affect our air quality (through ammonia and its links to particulate matter), water quality (through nitrates), biodiversity and soil quality (through increased nitrogen deposition) and greenhouse gas balance (through the release of nitrous oxide).
The present ENA Special Report has been prepared by the Expert Panel on Nitrogen and Food of the UNECE Task Force on Reactive Nitrogen. It examines nitrogen and other pollution losses from the food system and assesses the potential impacts of alternative diets on emissions of nitrogen to air and water. It then considers the potential impacts on land-use change and associated greenhouse gas emissions. The study finds that reductions in reactive nitrogen emissions associated with decreased intake of meat and dairy products would have substantial benefits, not only within the EU, but also at continental and global scales. The scenarios also match to consumption patterns that are better aligned with international dietary recommendations.
The Task Force on Reactive Nitrogen is a component body of the UNECE Convention on Long-Range Transboundary Air Pollution and has “the long-term goal of developing technical and scientific information, and options which can be used for strategy development across the UNECE to encourage coordination of air pollution policies on nitrogen in the context of the nitrogen cycle and which may be used by other bodies outside the Convention in consideration of other control measures”
(www.clrtap-tfrn.org).
abl
e
A
S
pecial R
epor
t of
t
he Eur
opean Nit
rogen A
ssessment
© Centre for Ecology & Hydrology, 2015.
This publication is in copyright. It may be quoted and graphics reproduced subject to appropriate citation.
Recommended citation:
Westhoek H., Lesschen J.P., Leip A., Rood T., Wagner S., De Marco A., Murphy-Bokern D., Pallière C., Howard C.M., Oenema O. & Sutton M.A. (2015) Nitrogen on the Table: The influence
of food choices on nitrogen emissions and the European environment. (European Nitrogen Assessment
Special Report on Nitrogen and Food.) Centre for Ecology & Hydrology, Edinburgh, UK. The report is available on-line at www.clrtap-tfrn.org/N-on-the-table. Hardcopy versions (subject to availability) can also be requested on-line, or purchased from cehcomms@ceh.ac.uk.
About the Task Force on Reactive Nitrogen (TFRN)
The TFRN was established by the Executive Body of the United Nations Economic Commission for Europe (UNECE) Convention on Long-range Transboundary Air Pollution (CLRTAP) with the “long-term goal of developing technical and scientific information, and options which can be
used for strategy development across the UNECE to encourage coordination of air pollution policies on nitrogen in the context of the nitrogen cycle and which may be used by other bodies outside the Convention in consideration of other control measures.” The Task Force conducts its work through
the contribution of several Expert Panels, with the present report prepared by the Expert Panel on Nitrogen and Food (EPNF).
The European Nitrogen Assessment (ENA) produced its first report in 2011 with a comprehensive analysis of the drivers, flows, impacts and policy options for better nitrogen management in Europe. The results of the ENA have been formally presented through the TFRN to the Executive Body of the CLRTAP. Special Reports of the European Nitrogen Assessment highlight key challenges and opportunities for action on nitrogen which may be used by the UNECE and other bodies.
About this publication
The present ENA Special Report has been prepared and peer reviewed as a scientifically independent process as a contribution to the work of the Task Force on Reactive Nitrogen. The views and conclusions expressed are those of the authors, and do not necessarily reflect policies of the contributing organizations. The report was edited by Clare Howard and Mark Sutton, with technical production and lay-out by Seacourt. We gratefully acknowledge kind inputs and support from other members of the TFRN Expert Panel on Nitrogen and Food: T. Garnett and J. Millward, as well as G. de Hollander, D. Nijdam, L. Bouwman (all PBL), S. Caldeira (JRC), Claudia S.C. Marques dos Santos Cordovil and Tommy Dalgaard for data, suggestions and support in preparing this report.
We acknowledge financial support through the UNECE Task Force on Reactive Nitrogen, including from the Netherlands Ministry (WOT-04-008- 010) and the UK Department for Environment, Food and Rural Affairs, together with support from the European Commission for the ÉCLAIRE, NitroEurope IP, Legume Futures and AnimalChange projects.
Graphics
Marian Abels, Filip de Blois, Jan de Ruiter and Arie den Boer (all PBL)
Front Cover Images
Centre (PBL /Jacqueline van Eijk), top right, top left, bottom right (and back cover), bottom left, copyright shutterstock.
ENA Special Report on Nitrogen and Food
Nitrogen on the table
The influence of food choices on nitrogen
emissions, greenhouse gas emissions
and land use in Europe
Henk Westhoek
1, Jan Peter Lesschen
2, Adrian Leip
3, Trudy Rood
1, Susanne Wagner
1,2,
Alessandra De Marco
4, Donal Murphy-Bokern
5, Christian Pallière
6,
1 PBL Netherlands Environmental Assessment Agency, The Hague/Bilthoven, The Netherlands. 2 Alterra, Wageningen University and Research Centre, The Netherlands.
3 Joint Research Centre, Institute for Environment and Sustainability (IES), Ispra, Italy. 4 ENEA, CR Casaccia, UTTAMB-ATM, Rome, Italy.
5 Lohne, Germany.
6 Fertilizers Europe, Brussels, Belgium.
Contents
FOREWORD . . . .5
SUMMARY FOR POLICY MAKERS . . . .7
1 INTRODUCTION . . . .13
2 CURRENT NITROGEN EMISSIONS FROM THE EU AGRICULTURAL SECTOR AND BY FOOD COMMODITY . . . .15
2.1 Introduction . . . .15
2.2 Methodology . . . .15
2.2.1 Nitrogen losses from the agricultural sector . . . .16
2.2.2 Cradle to farm gate life-cycle assessment . . . .16
2.3 Results . . . .17
2.3.1 Nitrogen losses from the agricultural sector . . . .17
2.3.2 Emissions by food commodity group . . . .17
2.3.3 Emission by functional unit of produce . . . .19
2.4 Discussion . . . .21
2.5 Summary and conclusions . . . .22
3 PRESENT AND HISTORIC EU FOOD CONSUMPTION . . . .23
3.1 Introduction . . . .23
3.2 Methodology . . . .23
3.3 Results . . . .24
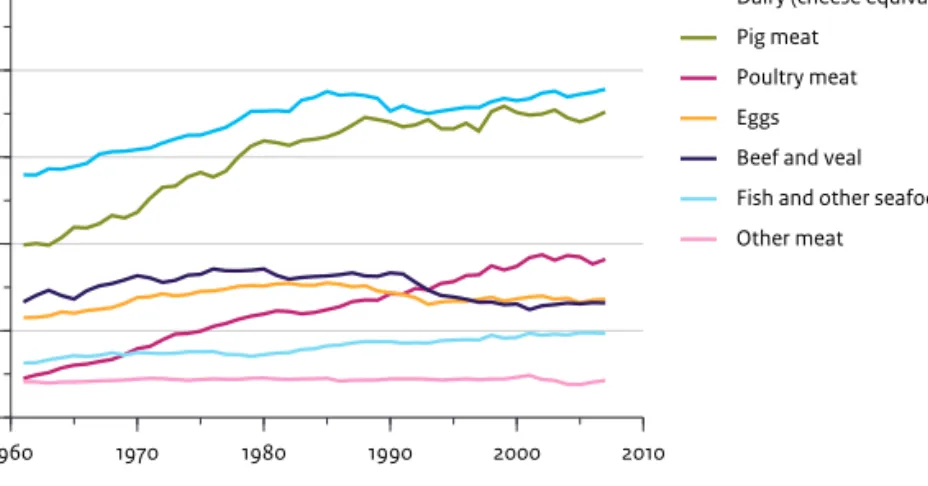
3.3.1 Development of meat consumption from 1960 to present . . . .24
3.3.2 Consumption per country . . . .25
3.4 Conclusions . . . .30 4 ALTERNATIVE DIETS . . . .31 4.1 Introduction . . . .31 4.2 Methodology . . . .31 4.3 Results . . . .32 4.3.1 Food intake . . . .32
4.3.2 Impacts on human health . . . .32
4.3.3 Impact on nitrogen footprint . . . .35
4.4 Discussion . . . .36
4.5 Conclusions . . . .37
5 ENVIRONMENTAL EFFECTS OF ALTERNATIVE DIETS . . . .38
5.1 Introduction . . . .38
5.2 Methodology . . . .38
5.2.1 Overview . . . .38
5.2.2 Adjusting EU livestock production and feed demand . . . .39
5.2.3 Land use scenarios . . . .40
5.2.4 Emissions of nitrogen and greenhouse gases . . . .40
5.2.5 Nitrogen deposition . . . .41
5.2.6 Nitrogen fluxes, NUE and cereal balances . . . .42
5.2.7 Bio-energy crops . . . .42
5.3 Results . . . .42
5.3.1 EU meat and dairy production . . . .42
5.3.2 Effects of alternative diets on livestock feed requirements . . . .42
5.3.3 Scenario effects on land use . . . .44
5.3.4 Scenario effects on nitrogen use, emissions and deposition . . . .44
5.3.5 Nitrogen deposition and exceedance of critical loads . . . .48
5.3.6 Bio-energy production . . . .50
5.3.7 Effect on GHG emissions . . . .50
5.3.8 Effect on import and export of agricultural commodities . . . .51
5.4 Discussion . . . .53
6 GENERAL DISCUSSION AND OVERALL CONCLUSIONS . . . .54
6.1 Assumptions regarding alternative diets and land use scenarios . . . .54
6.2 Economic consequences for the European agricultural sector . . . .55
6.3 Policies and possible pathways to dietary change . . . .56
6.4 Overall conclusions . . . .57
7 REFERENCES . . . .59
FOREWORD
This report has its origins in the very first meeting of the Task Force on Reactive Nitrogen (TFRN-1), which took place in Wageningen, The Netherlands, May 2008. The Task Force had recently been established by the Executive Body of the UNECE
Convention on Long-range
Transboundary Air Pollution (LRTAP), reflecting an emerging recognition of the importance of nitrogen in the environment. Traditionally, the work of the LRTAP Convention had focused primarily on technical measures as a means to achieve national reductions in air pollution emissions. But, as the discussions of TFRN-1 developed, it
became clear that total reactive nitrogen (Nr) emissions are also very sensitive to society’s food choices. For some in the Convention this initially seemed an uncomfortable topic for discussion. The focus of such an inter-governmental framework was seen as being on the technical options to be implemented by source sectors, such as electricity generation, transport and agriculture. Was not dietary choice outside the remit of the Convention and too sensitive a matter to discuss? Those initial discussions at TFRN-1 made it clear that dietary choice had to be part of the wider analysis with which the group was tasked. The parallel was quickly made with emissions of nitrogen oxides (NOx) from transport: technical measures – in the form of three-way catalysts and engine improvements – had greatly reduced emissions per vehicle mile, but these gains had been significantly offset by a substantial increase in vehicle miles driven. The discussion about nitrogen and food was, in principle, no different (Sutton, 2008). The potential gains made by future adoption of low nitrogen emission practices in farming could easily be lost by an increase in consumption of high-nitrogen foods, which applied especially to livestock products (Steinfeld et al., 2006).
This thinking led to the development of new global scenarios (up to 2100) of a more balanced meat and dairy consumption in the developed world, as compared with a consideration of “food equity”, where rates of dietary intake would increase among the world’s poorest (Erisman et al., 2008)1. It also fed into the development of the European Nitrogen Assessment, ENA (Sutton et al., 2011a). The same week of TFRN-1 in Wageningen saw the first workshop of the ENA process, allowing its outcomes to be reported immediately to the Task Force. It became clear that the eventual ENA product would need chapters that considered future dietary aspirations, including consideration of a smaller meat consumption (e.g. ‘healthy diet’ scenario, Winiwarter et al., 2011) and the challenge to communicate nitrogen to society (Reay et al., 2011b). The experience of launching the ENA has shown that there is huge merit in coupling discussions about agricultural technical measures with society’s food choice aspirations. Few members of the public get excited to talk about improved manure management options. But everyone is interested in food. By discussing both together, there is the opportunity to engage the public in why they need to know about the nitrogen cycle. In this way, the scientific community can highlight the many benefits and threats of reactive nitrogen across the planet, ranging from food and energy security to threats to water, air and soil quality, climate and biodiversity. It also illustrates how a joined-up approach to managing the nitrogen cycle would lead to multiple benefits for society (Sutton et al., 2011a).
While publication of the ENA represented a key advance in raising the profile of these issues, it was not possible to bring all the threads to completion by that time. There were urgent matters in hand, especially in synthesizing the technical options for ammonia mitigation to support revision of the Gothenburg Protocol. These included options for revision of the Protocol’s Annex IX (UNECE, 2011), updating the estimated costs of ammonia abatement (UNECE, 2011), revising the supporting Ammonia Guidance Document and Ammonia Framework Code (UNECE, 2012; Bittman et al., 2014, UNECE, 2015) and developing a new guidance document on national nitrogen budgets (UNECE, 2012). Effective progress in these actions was achieved by the Task Force working through its Expert Panel on Mitigation of Agricultural Nitrogen (EPMAN) and its Expert Panel on Nitrogen Budgets (EPNB).
1 An update of the Erisman et al. (2008) scenarios, which were based on the SRES approach (Special Report on Emissions Scenarios), has been made by Winiwarter et al. (2013) using the RCP approach (Representative Concentration Pathways).
In order to bring forward the scientific analysis on food choice relationships, the Task Force therefore agreed in 2009 to establish a new Expert Panel on Nitrogen and Food (EPNF) (UNECE, 2009, paragraphs 25-26). The Panel was subsequently launched in 2010 under the co-chairmanship of Mr Henk Westhoek (PBL, The Netherlands) and Mr Christian Pallière (Fertilizers Europe, Belgium).
The emerging messages from the work of the Expert Panel have already been reported to the LRTAP Convention’s ‘Working Group on Strategies and Review’ (UNECE, 2012). Since then, the work has continued, allowing completion of the present full report, accompanied by two peer review papers (Westhoek et al., 2014; Leip et al., 2014). As a logical continuation of the European Nitrogen Assessment, we here publish the findings in the form of an ‘ENA Special Report’.
Based on these outcomes, the Executive Summary of the present report was presented to the press in April 2014, supported with the further details given by Westhoek et al. (2014). The strong press interest and public feedback has clearly illustrated the power of the food choice debate in highlighting the role of nitrogen in the environment.2
Consistent with the mandate of the Expert Panel, the present report does not focus on how to achieve such changes in diets across European society. The task for the moment is to demonstrate the close relationship between our food choices, environmental pollution and human health indicators. The next step is to develop the discussion further with the public, politicians, international treaties and across academia, including between environmental scientists and nutritionists. In this way, the LRTAP Convention’s work on nitrogen provides a starting point for governments and society to discuss what is the right balance of effort: between implementing new technical measures in agriculture, reducing food waste etc. and fostering change in dietary choices. Whatever the outcome of that debate, it is clear from the present report that reducing European consumption of meat and dairy products would make a significant contribution to reducing nitrogen air and water pollution and greenhouse gas emissions. At the same time there is potential for significant human health benefits, while freeing up substantial areas of agricultural land to help meet global food security and energy security goals.
Mark A. Sutton, Oene Oenemaa, Tommy Dalgaardb, Claudia M d S Cordovilc
Co-chairs of the UNECE Task Force on Reactive Nitrogen.
aCo-chair until 2013; bCo-chair from 2014; cCo-chair from 2015
Clare M. Howard
Task Force Co-ordinator, TFRN.
Edinburgh, Wageningen, Aarhus and Lisbon, June 2015
2 See for example, Agriculture and Rural Convention (2014), Press Association (2014), Chertsey (2014), www.dNmark.org, Jones (2014), Kirby (2014), Midgley (2014), Vaugham (2014) and Webster (2014) and associated public discussion.
SUMMARY FOR POLICY MAKERS
Key findings
1. The European Nitrogen Assessment (ENA)1illustrated the role of agriculture as a major source of nitrogen losses. Despite the relatively high nitrogen use efficiency (NUE)2of agriculture in the European Union, the current total loss of reactive
nitrogen from European Union (EU) agriculture amounts to an estimated 6.5 - 8 million tonnes per year, representing around 80 % of reactive nitrogen emissions from all sources to the EU environment [2.3.1 and 5.3.4].3These nitrogen losses are mainly in the form of ammonia to the air, of nitrate to ground and surface waters and of nitrous oxide (a powerful greenhouse gas).
2. This report examines these losses from the EU agri-food system further by (i) allocating nitrogen losses to food commodity groups (to determine nitrogen ‘footprints’) and (ii) by exploring the effect of alternative diets on nitrogen emissions, greenhouse gas emissions and land use.
3. There are large differences between food commodities in terms of nitrogen losses per unit of protein produced.
Plant-based foods, such as cereals, have relatively low losses while livestock products have much higher losses. Nitrogen losses
per unit of food protein from beef are more than 25 times those from cereals. For pig and poultry meat, eggs and dairy, the losses are 3.5 to 8 times those from cereals [2.3.2]. Corresponding values for nitrogen use efficiency (NUE) are low for meat and dairy products (5-30%) as compared with plant-commodities (45-75%).
4. The results show that livestock production chains have a high share in nitrogen losses. Around 81-87% of the total emissions related to EU agriculture of ammonia, nitrate and of nitrous oxide are related to livestock production [2.3.2]. In these values for livestock production the emissions related to feed production (as cereals and fodder crops) are included. 5. The current average nitrogen ‘footprint’4per person differs by a factor 2-4 between European countries, mainly as a
result of differences in average food consumption patterns [3.3.3]. Countries with high intake of animal products (such
as France and Denmark) in general have considerably larger nitrogen footprints than countries with a low intake of animal products (such as Bulgaria and Slovakia). Overall for the EU-27, 52% of protein intake comes from meat, with 34% from dairy, 7% from eggs and 7% from fish and other seafood.
6. The current average per capita protein intake in the EU is about 70% higher than would be required according to the
World Health Organization (WHO) recommendations [3.3.2]. This provides opportunities for a shift towards a change
in European food consumption habits with lower nitrogen footprints, reducing adverse environmental impacts on water, air and soil quality, climate and biodiversity. The current intake of saturated fats is 42% higher than the recommended maximum dietary intake, leading to increased risk of cardiovascular diseases. As 80% of saturated fats originate from animal products, a reduction in animal products would in general be favourable to human health as well [3.3.2].
Scenarios and key outcomes
7. In this study the effects of a number of alternative diets with lower intake of meat and dairy were assessed considering
their impact on nitrogen losses from EU agriculture, as well as on greenhouse gas emissions, land use and human health.
A reduction in pig meat, poultry meat and eggs was explored in one set of alternative diets. In another, a reduction in beef and dairy was explored. The reduction in all types of livestock products was also explored, in each case considering the consequences of 25% and 50% reductions. These reduction percentages were chosen primarily to illustrate how the food system could respond under major change, which could be achieved by a range of possible intake strategies (e.g. changed frequency of meat and dairy consumption or reduced portion size). The effects on feed requirement, crop production, land requirements and nitrogen losses were examined.
8. Reducing meat and dairy consumption frees up large areas of agricultural land in the EU providing new opportunities
of how to manage this land. We considered two alternative scenarios: Greening Scenario and a High Prices Scenario [5.2.3].
In the Greening Scenario, land no longer needed for feed production is used for the production of perennial biomass crops. Furthermore, the lower demand for grass is assumed to lead to an extensification of grassland use by lowering mineral N fertilizer input. In the High Prices Scenario, tight global commodity markets and therefore high cereal prices are assumed.
1 Sutton, M.A., Howard, C.M., Erisman, J.W., Billen, G., Bleeker, A., Grennfelt, P., van Grinsven, H., Grizzetti, B., (eds.) (2011) The European Nitrogen Assessment: Sources, Effects and Policy Perspectives. Cambridge University Press, Cambridge, pp. 612.
2 The nitrogen use efficiency is here defined as the ratio of nitrogen outputs to nitrogen inputs, all the way from the fertilizer input to nitrogen in final food and bioenergy products.
3 References in this summary (e.g., [1.1, 5.3.1]) refer to chapter and section numbers of this Special Report. 4 This footprint is calculated as the total nitrogen loss to the environment per unit of product.
Land no longer required for fodder production (including temporary grassland and a fraction of the permanent grasslands) is used for cereal production.
9. In the Greening Scenario, a 50% reduction in livestock product consumption and production would reduce current
European agricultural reactive nitrogen emission by 42% (Table S1, Figure S1). In this alternative diet, the ammonia
emissions are 43% lower, nitrous oxide emissions are 31% lower and nitrate emissions are reduced by 35% [5.3.4]. The emissions are reduced most in alternative diets involving decreased beef and dairy production. In general, ammonia emission reductions are higher than the reduction in nitrous oxide and nitrate leaching. This is because ammonia emissions are mainly from livestock production, whereas both livestock and arable field-based activities contribute large shares of the nitrous oxide and nitrate emissions. Greenhouse gas emissions from agriculture are predicted to be reduced by over 42%. Bioenergy crops expand by 14.5 million, being equal to 40% of the projected use of bio-energy material in the EU in 2020 [5.3.6].
10. In the High Prices Scenario, a 50% reduction in livestock product consumption and production would also reduce
current European agricultural reactive nitrogen emission by around 37% (Table S1, Figure S1). In this alternative diet,
the ammonia emissions are 40% lower, nitrous oxide emissions are 24% lower and nitrate emissions are reduced by 29% [5.3.4]. Greenhouse gas emissions from agriculture are predicted to be reduced by 19%. In this scenario, cereal export would increase from the current 3 million tonnes per year to over 170 million tonnes [5.3.8].
11. In both scenarios, the requirement for imported soybeans, as meal currently used as animal feed, is reduced by 75%
(Table S1). The combination of increased export of cereals with reduced import of soy has great implications for global
commodity markets, which in turn influence global land use change [5.3.8].
12. A shift to a more plant-based diet will lead to a large decrease in the nitrogen footprint of EU citizens. In the most radical scenario assessed (a 50% reduction in the consumption of all meat and dairy products), the nitrogen footprint of the average diet will be reduced by 40% [4.3.3]. The current large differences in per capita nitrogen footprint between EU member states will also become smaller.
13. The reductions in reactive nitrogen emissions will have benefits not only within the EU but at continental and global
scales. Both atmospheric ammonia and nitrates in water-bodies cross national frontiers, with the consequence that the
dietary scenarios investigated make a significant contribution to reducing international pollution export. The reduced emissions of the greenhouse gases methane, nitrous oxide and carbon dioxide are relevant both at EU level and globally. 14. The scenarios lead to food consumption patterns that are better aligned with international dietary
recommendations. All of the reduction scenarios lead to a reduced intake of saturated fats, the main source of which is
animal products. Even though the reductions are significant, only the most radical scenario - representing a 50% reduction in all meat and dairy consumption, brings the average intake of saturated fats within a range recommended by the World Health Organization (WHO) [4.3.2]. This scenario represents a 40% reduction in the intake of fats. The same radical scenario is also the only one assessed where the average intake of red meat is reduced to being only slightly above the maximum recommended by World Cancer Research Fund (WCRF) (Table S1, [4.3.2]). Based on the current WHO and WCRF dietary recommendations, the results are clear: the reduced intake of red meat and saturated fats in these reduction scenarios means that public health risks would be reduced.
15. The alternative diets would lead to major changes in EU agriculture, with the expectation of large socio-economic
consequences. Livestock production is currently responsible for 60% of the value-added on EU farms, and this revenue
would be greatly reduced under the alternative diets [Chapter 6]. By contrast, the High Prices Scenario leads to increased cereal exports and associated revenue. The net farm-level economic effect would depend on world market conditions and especially whether the additional cereal can be sold at a price that is profitable for European farmers. In the scenario where additional cereals are exported, this might have beneficial effects on global commodity markets in terms of food security. However this also has the risk of suppressing production and thus market opportunities for local farmers in developing countries, which is avoided in the increased bioenergy scenario [Chapter 6].
16. Considering the major benefits of reduced European meat and dairy consumption for environment, climate and
human health, there is a need to explore further the market, educational aspects, and policy and other options which would enable the barriers-to-change to be addressed.
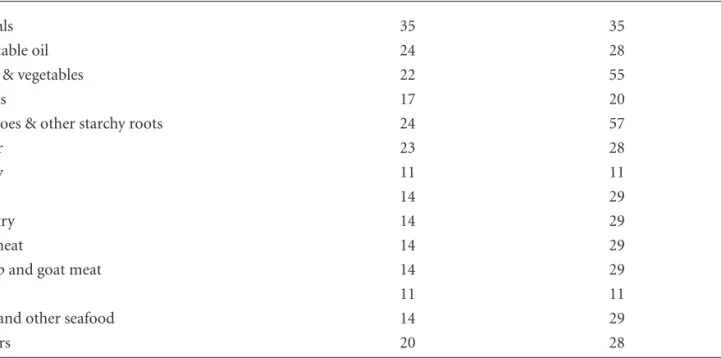
Aspect Unit Reference -50% meat, dairy and eggs1
Protein
Average daily intake g per person per day 83 75
Proportion of animal origin2 % 60% 36%
Saturated fats
Average daily intake g per person per day 36 22
Compared with the RMDI3 % 142% 86%
Red meat
Average daily intake g per person per day 88 47
Compared with the RMDI4 % 207% 107%
Reference High Prices Greening Scenario Scenario Environment
Total losses of Nr(EU) Million tonnes per year 6.5 4.1 3.8
Losses of NH3N to air 2.8 1.6 1.6
Losses of Nrto water 3.3 2.1 2.0
Losses of N2O N to air 0.37 0.27 0.25
Losses of N2 6.7 4.2 3.9
GHG emissions (EU) Million tonnes per year 464 347 268
NUE5food system (EU) % 22 47 41
Agriculture
Soy imports (as beans) Million tonnes per year 34 8 8
Cereal exports Million tonnes per year 3 174 54
Additional production of bioenergy EJ per year - - 2.3
Potential contribution to EU bio-energy
projection for 2020 % 40
Table S1Summary of data on average food intake in Europe and environmental indicators under current conditions (based on 2004) and under a 50% reduction in the consumption of animal products [synthesis from 4.3.3 and 5.3].
1 sheep and goat meat are not reduced 2 including fish and other seafood
3 RMDI = Recommended Maximum Dietary Intake
4 RMDI as advised by the World Cancer Research Fund and American Institute for Cancer Research (WCRF, AICR (2007))
5 Nitrogen use efficiency of the total food system (total output of N in the form of food crops and livestock products /total input of N into agricultural
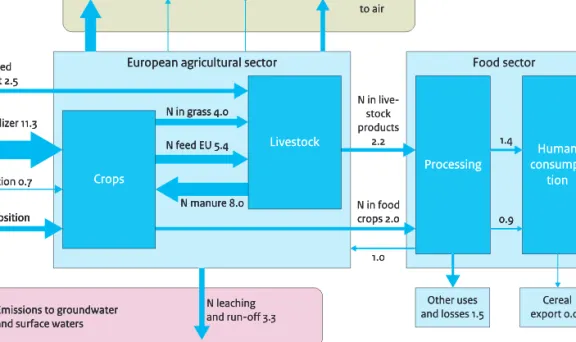
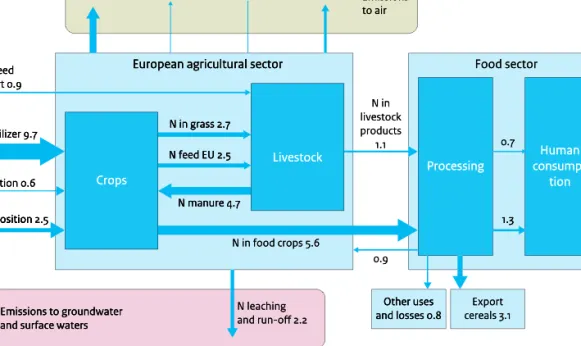
Figure S1 (A and B)Nitrogen flows in the EU agricultural and food system in the reference situation for 2004 (A)and in case of the alternative diet with 50% reduction in consumption of meat, dairy and eggs in the Greening Scenario (B)and in the High Prices Scenario (C, see next page). Values shown here are based on application of the MITERRA model.
Nitrogen flows in the agricultural food system in EU27, reference 2004 based on Miterra data
NH3 2.8 N in food crops 2.0 N leaching and run-off 3.3 N in feed import 2.5 N2O 0.37 NOx 0.08 N2 6.7 N feed EU 5.4 N in grass 4.0 N manure 8.0 N in live-stock products 2.2 1.4 0.9 1.0 Other uses and losses 1.5 N fertilizer 11.3 N fixation 0.7 N deposition 3.2 Tg per year (1 000 000 000 kg) Emissions to air Emissions to groundwater and surface waters
European agricultural sector
Crops Livestock Cereal export 0.05 Human consump-tion Processing Food sector
Nitrogen flows in the agricultural food system in EU27, reference 2004 based on Miterra data
(1 000 000 000 kg)
Tg per year
Nitrogen flows in the agricultural food system in EU27, reference 2004 based on Miterra data
6.7
(1 000 000 000 kg) N2 N2O 0.37
Tg per year
Nitrogen flows in the agricultural food system in EU27, reference 2004 based on Miterra data
0.08 x
NO NH3 2.8
to air Emissions
Nitrogen flows in the agricultural food system in EU27, reference 2004 based on Miterra data
Emissions import 2.5 N in feed N deposition N fixation 0.7 N fertilizer 11.3 import 2.5 N manure 8.0 N in grass 4.0 N feed EU 5.4
European agricultural sector
N in feed N deposition N fixation 0.7 N fertilizer 11.3 Crops 2.2 N manure 8.0 products stock N in live-crops 2.0 N in grass 4.0 N feed EU 5.4
European agricultural sector
N in food Livestock 0.9 1.4 Food sector Processing tion consump-Human
and surface waters 3.2
N deposition
Emissions to groundwater N deposition
and surface waters Emissions to groundwater and run-off 3.3 1.0 crops 2.0 N leaching and losses 1.5 0.9 Other uses export 0.05 Cereal
Nitrogen flows in the agricultural food system in EU27, -50% all meat and dairy Greening scenario
Emissions to air Human consump-tion Food sector 0.9 Processing NH3 1.6 N in food crops 3.9 N leaching and run-off 2.0 N in feed import 0.9 N2O 0.25 NOx 0.05 N2 3.9 N feed EU 2.5 N manure 4.7 N in livestock products 1.1 N in grass 2.7 N fertilizer 8.0 N fixation 0.6 N deposition 2.4 Tg per year (1 000 000 000 kg) Emissions to groundwater and surface waters
European agricultural sector
Crops Livestock 0.7 1.3 Other uses and losses 0.8 Bioenergy crops 0.6 Export cereals 0.9
Nitrogen flows in the agricultural food system in EU27, -50% all meat and dairy Greening scenario
(1 000 000 000 kg)
Tg per year
Nitrogen flows in the agricultural food system in EU27, -50% all meat and dairy Greening scenario
3.9
(1 000 000 000 kg) N2 N2O 0.25 Tg per year
Nitrogen flows in the agricultural food system in EU27, -50% all meat and dairy Greening scenario
to air Emissions 0.05
x
NO NH3 1.6
Nitrogen flows in the agricultural food system in EU27, -50% all meat and dairy Greening scenario
Emissions import 0.9 N in feed N deposition N fixation 0.6 N fertilizer 8.0 import 0.9 N manure 4.7 N feed EU 2.5 N in grass 2.7 N in feed N deposition
European agricultural sector
N fixation 0.6 N fertilizer 8.0 Crops 1.1 N manure 4.7 products livestock N in crops 3.9 N feed EU 2.5 N in grass 2.7 N in food
European agricultural sector
Livestock Food sector tion 1.3 consump-Human Processing 0.7
and surface waters 2.4
N deposition
Emissions to groundwater N deposition
and surface waters Emissions to groundwater
and run-off 2.0
0.9
and losses 0.8 crops 3.9
N leaching Other uses
and losses 0.8 1.3 Other uses cereals 0.9 crops 0.6 Export Bioenergy Figure A Figure B
Nitrogen flows in the agricultural food system in EU27, -50% all meat and dairy High prices scenario Emissions to air Human consump-tion Food sector 0.9 Processing NH3 1.6 N in food crops 5.6 N leaching and run-off 2.2 N in feed import 0.9 N2O 0.27 NOx 0.05 N2 4.2 N feed EU 2.5 N manure 4.7 N in livestock products 1.1 N in grass 2.7 N fertilizer 9.7 N fixation 0.6 N deposition 2.5 Tg per year (1 000 000 000 kg) Emissions to groundwater and surface waters
European agricultural sector
Crops Livestock 0.7 1.3 Other uses and losses 0.8 Export cereals 3.1
Nitrogen flows in the agricultural food system in EU27, -50% all meat and dairy High prices scenario
(1 000 000 000 kg)
Tg per year
Nitrogen flows in the agricultural food system in EU27, -50% all meat and dairy High prices scenario
4.2
(1 000 000 000 kg) N2 N2O 0.27 Tg per year
Nitrogen flows in the agricultural food system in EU27, -50% all meat and dairy High prices scenario
to air Emissions 0.05
x
NO NH3 1.6
Nitrogen flows in the agricultural food system in EU27, -50% all meat and dairy High prices scenario
Emissions import 0.9 N in feed N deposition N fixation 0.6 N fertilizer 9.7 import 0.9 N manure 4.7 N feed EU 2.5 N in grass 2.7 N in feed 2.5
European agricultural sector
N deposition N fixation 0.6 N fertilizer 9.7 Crops 1.1 N manure 4.7 products livestock N in N feed EU 2.5 N in grass 2.7 European agricultural sector
Livestock Food sector tion 1.3 consump-Human Processing 0.7
and surface waters N deposition
Emissions to groundwater 2.5
and surface waters N deposition Emissions to groundwater and run-off 2.2 0.9 and losses 0.8 N in food crops 5.6
N leaching Other uses and losses 0.8 1.3 Other uses cereals 3.1 Export Figure C
Figure S1 continued (C)Nitrogen flows in the EU agricultural and food system in the case of the alternative diet with 50% reduction in consumption of
1
INTRODUCTION
In Europe, agriculture is the major source of emissions of reactive nitrogen1(Sutton et al., 2011a). On the one hand, nitrogen is an essential element for crop and animal production, as well as for human life. Crops need nitrogen in the form of nitrate or ammonia to grow. This nitrogen can stem from different sources, as mineral fertilizer, manure, organic matter or bacteria. Animals and humans need proteins, of which nitrogen is a key component. On the other hand, nitrogen emissions can be harmful for humans and for biodiversity, and have negative effects on many natural resources. Agriculture is the dominant source of emissions in Europe for each of nitrates to ground and surface waters, as well of emissions of ammonia and nitrous oxide to the air (ENA, 2011). High nitrate concentrations in drinking water are considered a risk to human health. In surface waters and coastal zones nitrogen enrichment causes eutrophication, which leads to biodiversity loss, algae blooms and fish kills. Emission and consequent deposition of ammonia
leads to loss of terrestrial biodiversity, while nitrous oxide is a powerful greenhouse gas. Due to policy interventions, economic circumstances and technological improvements nitrogen emissions from agriculture in Europe have decreased since their peak in around 1985. Nevertheless, in many areas in Europe nitrogen emissions are still causing problems with regard to either human health or loss of biodiversity.
In the European Nitrogen Assessment seven key actions were identified to reduce nitrogen emission. With respect to agriculture the following four key actions are most relevant:
1. Improving nitrogen use efficiency in crop production; 2. Improving nitrogen use efficiency in animal production; 3. Increasing the fertilizer N equivalence value of animal manure; 4. Lowering the human consumption of animal protein.
Over the past 20 years, much research has been done and techniques have been developed and deployed to reduce these emissions and improve nitrogen use efficiency in agricultural production systems. In other words, a great deal of attention has been paid to reducing emissions on the ‘supply’ side, exploring the potential of the first three actions.
This report focuses on the potential consequences of lowering the human consumption of animal protein in Europe. The potential achievements from such dietary changes should be seen as complementary to the outcomes of the first three key actions listed above. It is a matter for society to decide on the relative effort placed on the different key actions, as informed by scientific evidence on the opportunities and their relationships.
While agriculture is the main source of nitrogen emissions in Europe, it has also been shown that livestock production is the key driver of total nitrogen losses (ENA, 2011). Ammonia emissions mainly originate from stables and manure storages and spreading. Livestock manure is also a major source of nitrate leaching, for example due to wrong timing of manure application, or due to over-application of manure. Although much research has been done on emissions of GHG and land use related to animal products, little research has been done to investigate the nitrogen footprint of different food products (Leip et al, 2014). Even less studies have explored the effects on nitrogen emissions of large scale dietary shifts. This report aims to fill this gap, by analysing current nitrogen flows and emissions, as well as the nitrogen footprints of different types of food. Based on a set of assumptions, the report explores how alternative diets by European citizens would alter nitrogen pollution and its relationship with other relevant issues.
1 The term ‘reactive nitrogen’ refers to all types of nitrogen form other than unreactive nitrogen (N2), which makes up nearly 80% of the world’s atmosphere. Reactive nitrogen (also termed, Nr) includes nitrates, ammonia, nitrous oxide, nitrogen in proteins etc.
In Chapter 2 we focus on the current nitrogen emissions from agriculture. In this chapter the following questions are addressed:
1. What are the emissions of reactive nitrogen related to the EU agricultural sector as a whole? 2. What are the emissions of reactive nitrogen per EU agricultural subsector?
3. What are the emissions of reactive nitrogen per unit of produce for the most important food commodities? Further information concerning this chapter has been reported by Leip et al. (2014).
Chapter 3 explores the historic and current composition of European diets, with a focus on animal protein. It also assesses current diets in the light of dietary recommendations.
In Chapter 4 and 5 the consequences of a hypothetical shift in European diets are explored, by assessing diets with a 25 to 50% lower consumption of animal products. By using biophysical models and methods, the effects on nitrogen emissions, greenhouse gas emissions as well as land use are evaluated. Chapter 4 focuses on the dietary aspects; Chapter 5 on the environmental outcomes. Further information concerning this chapter has been reported by Westhoek et al. (2014). Finally, Chapter 6 places the results of Chapters 2 to 5 in a broader context, discussing the potential economic consequences and the question of how these dietary shifts could be brought about.
For practical reasons including the availability of data and suitable models, this study was confined to EU-27. Livestock production and consumption in the EU are tightly linked and EU livestock production is largely for European consumption with relatively little trade across the EU’s border (Leip et al., 2011a).
2
CURRENT NITROGEN EMISSIONS FROM THE EU
AGRICULTURAL SECTOR AND BY FOOD COMMODITY
2.1
Introduction
Agricultural activities are intrinsically linked to the use and loss of reactive nitrogen, including both intended and unintended nitrogen flows (Sutton et al., 2011a,b). Examples of intended use of reactive nitrogen are fertilisation of crops (either with mineral fertilizers or manure) to increase yields, and the feeding of animals. Unintended losses of reactive nitrogen occur, for example, from manure in housing systems or manure management systems, or upon application of manure to agricultural land or from grazing animals. In addition, the application of mineral fertilizer leads to losses of reactive nitrogen, both to the atmosphere and to ground and surface waters.
Reactive nitrogen (Nr) emissions to the atmosphere from agriculture occur mainly in the form of ammonia (NH3). About 95% of total ammonia emissions to the atmosphere over Europe are of agricultural origin. However, other Nrgases are also emitted, such as nitrogen oxides (NOx) and nitrous oxide (N2O) (Leip et al., 2011b). The main source for overall NOx emissions is the use of fossil fuel derived energy and thus the agricultural proportion of total NOxfluxes is only 3%. However this does not include the use of fossil fuel required to cultivate the crops, house the animals, transport feed and food, and finally distribute to the consumer, prepare and dispose. In addition NOxis also emitted from agricultural soils.
Nitrogen emissions to the hydrosphere occur from agricultural sources (mainly diffuse) and from sewerage systems (mainly point sources). Nremissions to ground and surface waters are mostly in the form of nitrates (NO3-), but also in the form of ammonium and dissolved organic nitrogen. These losses are closely linked to the level of nitrogen surplus (input of nitrogen minus output in useful products). High rates of nitrogen surplus – the total loss of nitrogen to the environment – are closely related to the presence of livestock (Leip et al., 2011a).
Finally, Nris lost from the agri-food chain by denitrification back to di-nitrogen (N2). Such N2losses are closely associated with denitrification to form N2O. Although N2emission does not contribute to radiative forcing of climate, the emission rates of N2are typically at least ten times larger than those of N2O. Denitrification to N2therefore represents as significant loss of available Nrpools, indirectly contributing to climate forcing because of the CO2equivalent used to produce Nrin the first place.
In this chapter we focus on three main questions:
1. What are the Nremissions related to the EU agricultural sector as a whole? 2. What are the Nremissions per EU agricultural subsector?
3. What are the Nremissions per unit of produce for the most important food commodities?
This analysis provides the foundation to establish a baseline scenario against which different dietary scenarios are considered in Chapters 4 and 5.
2.2
Methodology
We specified losses of reactive nitrogen for twelve main food commodity groups, which cover about 97% of EU food crop production. Six of these food commodity groups are plant-derived (cereals, potato, fruit and vegetables, sugar, vegetable oils and pulses) and six are from animals (dairy products, beef, pork, eggs, poultry meat, and sheep and goat meat). Emissions from fish and fish products are not simulated in the models used and have therefore not been included. Even though the assessment is restricted to food produced within the EU, the emissions of imported feed are considered. The relevance of this approach is that for a commodity such as beef or eggs the emissions related to the feed production are taken into account as well as the nitrogen emissions related to the livestock part of the production. This means that the emissions related to the commodity-group ‘cereals’ only relate to that part of the cereals which are directly consumed by humans. Emissions from cereals and other products used to feed livestock are allocated to those livestock.
All data presented refer to the time period 2003-2005 which is the current ‘base year’ of the models employed. Quantification of nitrogen losses from the agricultural sector is done on the basis of the agri-economic model CAPRI (Britz and Witzke, 2012). The calculations presented in Chapter 5 also use MITERRA-EUROPE. Both the CAPRI and MITERRA-EUROPE models have previously been used in assessing the contribution of the European livestock sector to anthropogenic greenhouse gas (GHG) fluxes in Europe (Leip et al., 2010; Lesschen et al., 2011; Weiss and Leip, 2012).
2.2.1
Nitrogen losses from the agricultural sector
The CAPRI model uses a mass-flow approach to represent the nitrogen cycle in agricultural systems (Figure 2.1) (Leip et al., 2011a; de Vries et al., 2011a). Emissions of reactive nitrogen occurring in earlier stages, such as during the storage of manure, are subtracted from the nitrogen pool before calculating emissions at a later stage, such as following the application of manure. Emission factors used are consistent with methodologies developed by IPCC (IPCC, 2006) or the GAINS model (Klimont and Brink, 2004; Winiwarter, 2005).
2.2.2
Cradle to farm gate life-cycle assessment
In a life-cycle assessment (LCA), emissions occurring at various stages during the life of a product are cumulatively attributed to the product, on the basis of a defined ‘functional unit’ (ISO, 2006a, 2006b; Food SCP RT, 2013). The functional unit is the marketable mass of the product, for example one kilogram of beef or cereals, as it is sold at the ‘farm gate’ or – in the case of meat products – at the gate of the abattoir as carcass meat. The ‘life’ of a product includes all the inputs required to produce the product, from the land on which it grows to the emissions related to production of mineral fertilizer and emissions during the transport of feed products to emissions occurring on the farm through the use of fuel for cultivating the soil and on-farm energy use. Such an approach is thus called a ‘cradle-to-farm gate’ LCA (Food SCP RT, 2013). An LCA model (as implemented in CAPRI, Weiss and Leip, 2012) considers the emissions related to the use of energy, as well as those from imported feed-product energy, as combustion of fuel leads to the emissions of NOx. Table 2.1 gives a complete list of emission sources considered in this study.
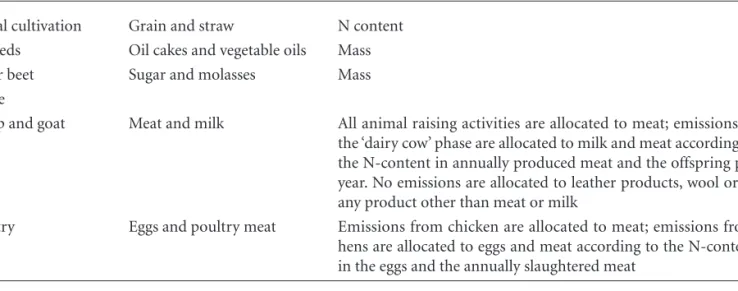
In an LCA, decisions need to be made on the allocation of fluxes of Nrin the cases where one production activity leads to more than one product. For example, one dairy cow produces milk and meat once slaughtered, but also produces calves that may be used for either meat or (mainly) milk production. The production of sheep and goat meat, sugar and oils, yields by-products such as wool, molasses, and oil cakes, which are not considered here. A large part of the useable proteins (in the case of sugar and oils virtually all the nitrogen in the products) is contained in the by-products and the product (e.g. oils) is used for its energy content. Allocation of emissions is done on the basis of biomass, and emission intensities per unit of nitrogen are calculated for the primary crop (e.g. rape seed). Wool as a by-product is considered in the CAPRI model. Table 2.2 gives more details on the allocation methods used.
Table 2.1Emission sources considered in this study (adapted from Weiss and Leip, 2012).
Emission source Livestock Crop/feed UNFCCC rearing production sector
• Livestock excretion
• Manure management (housing and storage) X Agriculture
• Deposition of N by grazing animals X Agriculture
• Manure management (housing and storage) X Agriculture
• Indirect emissions following N-deposition of volatilized NH3/NOxfrom agricultural soils
and leaching/run-off of nitrate X Agriculture
• Use of fertilizers for production of crops dedicated to animal feeding crops (directly or as blends or feed concentrates, including imported feed)
• Manufacturing of fertilizers X Energy/Industry
• Use of fertilizers, direct emissions from agricultural soils X Agriculture
• Use of fertilizers, indirect emissions following N-deposition of volatilized NH3/NOxfrom agricultural soils and leaching/
run-off of nitrate X Agriculture
• Cultivation of organic soils X Agriculture
• Emissions from crop residues (including leguminous feed crops) X Agriculture
• Feed transport (including imported feed) X Energy
• On-farm energy use (diesel fuel and other fuel electricity,
indirect energy use by machinery and buildings) X X Energy
• Pesticide use X Energy
2.3
Results
Figure 2.1 presents an overview of the nitrogen flows in the agricultural and food sector across EU-27 (Leip et al., 2014). Around 15 million tonnes of nitrogen (equivalent to 15 Tg N) is taken up by biomass annually on agricultural land, and used as livestock feed, food, fibre or fuel. This is driven by a supply of nitrogen to agricultural land of 21.2 million tonnes N per year, mainly in the form of mineral fertilizers (10.9 million tonnes N per year) and the input of manure nitrogen (7.2 million tonnes N per year). At the same time, about 7.0 million tonnes N per year are extracted from agricultural production, for other societal use, which is supplemented by an import of 2.3 million tonnes N per year, mainly in crop products. Finally, only 2.3 million tonnes N per year are consumed by European citizens, while more than 10 million tonnes N per year is emitted from agricultural systems to the atmosphere or hydrosphere in Europe.
2.3.1
Nitrogen losses from the agricultural sector
The close link between livestock and crop production systems through the exchange of feed and manure with emissions of nitrogen compounds to the environment from both sub-systems can also be seen in Figure 2.1. Agriculture supplies around 2.7 million tonnes N per year in animal products and 3.9 million tonnes N per year in vegetable products, out of which 3 million tonnes N per year are processed to animal feed (not shown) or for other purposes. Only 2.3 million tonnes N per year are actually consumed by European citizens, therefore slightly more proteins are consumed in animal products than in vegetable products (see Chapter 3).
The geographical distribution of the emission rates of the two main agricultural pollutants to the atmosphere and the hydrosphere (Figure 2.2) clearly represents the pattern of agricultural intensity. Hot-spots in the Netherlands, Brittany, Northern Italy and North Germany where livestock production specifically is very intensive can be seen, while regions characterised by extensive production systems and/or specialisation in crop production show lower emissions (de Vries et al., 2011b; Leip et al., 2011a).
2.3.2
Emissions by food commodity group
Calculations made using the CAPRI model indicate that each year European agricultural production systems cause total losses of reactive nitrogen amounting to 2.8 million tonnes N as ammonia, 6.3 million tonnes N leached to aquatic systems, 0.46 million tonnes N as N2O and 0.43 million tonnes N as NOx.
Livestock production systems dominate the losses of reactive nitrogen, being responsible for an estimated 81% of agricultural nitrogen input to aquatic systems and 87% of the NH3fluxes from agriculture production to the atmosphere (Figure 2.3). The four food commodity groups which dominate the nitrogen losses are beef, dairy, pork and cereals. Cattle are estimated to be responsible for 69% of Nrlosses from animal product food commodities considered, and 56% of all losses (still a high proportion) when all twelve food commodity groups are considered. Pork contribute an estimated 17% of the agricultural N losses and 14% of the total losses, respectively.
Cereals contribute the bulk of Nrlosses from vegetable products for direct human consumption (57%), but only 10% of total food-related emissions. Relatively high shares of vegetable emissions are also related to the production of oil products (16%) or fruits and vegetables (12%).
Table 2.2Allocation methods of the emission sources applied in this study.
Activity Products Allocation method
Cereal cultivation Grain and straw N content
Oilseeds Oil cakes and vegetable oils Mass
Sugar beet Sugar and molasses Mass
Cattle
Sheep and goat Meat and milk All animal raising activities are allocated to meat; emissions in
the ‘dairy cow’ phase are allocated to milk and meat according to the N-content in annually produced meat and the offspring per year. No emissions are allocated to leather products, wool or to any product other than meat or milk
Poultry Eggs and poultry meat Emissions from chicken are allocated to meat; emissions from
hens are allocated to eggs and meat according to the N-content in the eggs and the annually slaughtered meat
Nitrogen flows in the agricultural food system in EU27, 2004 based on CAPRI data NH3 2.6 Vegetable products 3.9 N leaching and run-off 5.0 N in feed import 2.7 N2O 0.3 NOx 0.1 N2 3.5 Grass 2.4 N in applied manure 7.2 Fodder 5.0 Compound feed 1.5 Animal products 2.7 Losses 1.0 N in mineral fertilizer 10.9 Atmospheric deposition 2.1 Biological fixation 1.0 Import products 0.04 Tg per year (1 000 000 000 kg) Emissions to air Emissions to groundwater and surface waters
EU27 agricultural sector
Crops Livestock Sewage systems 2.3 Human intake Processing
EU27 food system
N in animal products 1.3 N in vegetable products 1.1 Waste and other uses 2.8
itrogen flows in the agricultural food system in EU27, 2004 based on CAPRI data N
(1 000 000 000 kg)
Tg per year
itrogen flows in the agricultural food system in EU27, 2004 based on CAPRI data
3.5
(1 000 000 000 kg) N2 N2O 0.3
Tg per year
itrogen flows in the agricultural food system in EU27, 2004 based on CAPRI data
0.1 x
NO NH3 2.6
to air Emissions
itrogen flows in the agricultural food system in EU27, 2004 based on CAPRI data
to air Emissions import 2.7 N in feed fixation 1.0 Biological deposition 2.1 Atmospheric fertilizer 10.9 N in mineral import 2.7 Fodder 5.0 manure 7.2 N in applied Grass 2.4 EU27 agricultural sector N in feed fixation 1.0 Biological deposition 2.1 Atmospheric fertilizer 10.9 N in mineral Crops 2.7 Fodder 5.0 products Animal feed 1.5 Compound 3.9 manure 7.2 N in applied EU27 agricultural sector
products Vegetable Livestock Processing products 1.1 Processing intake N in vegetable products 1.3 N in animal EU27 food system
Human
and surface waters products 0.04 Import fixation 1.0 Emissions to groundwater products 0.04 and run-off 5.0 Losses 1.0 N leaching and surface waters
Import fixation 1.0 Emissions to groundwater 3.9 and run-off 5.0 Losses 1.0 N leaching systems 2.3 other uses 2.8 Waste and Sewage
kg N per km2 per year
Total NH3 emissions
kg N per km2 per year
Less than 250 250 – 500 500 – 1 000 1 000 – 2 500 2 500 – 10 000 More than 10 000 Less than 10 10 – 50 50 – 100 100 – 500 500 – 1 000 More than 1 000
Nitrogen input to aquatic systems
Distribution of reactive nitrogen losses, 2000
emissions otal NH
T
Distribution of reactive nitrogen losses, 2000 Distribution of reactive nitrogen losses, 2000
Nitrogen input to aquatic systems Nitrogen input to aquatic systems emissions emissions N otal NH otal NH NH3 T
T Nitrogen Nitrogen input to aquatic systemsgen input to aquatic systemsggen e quatic systems quatic systems c systems
per year 2 kg N per km Less than 10 10 – 50 50 – 100 100 – 500 500 – 1 000 More than 1 000 per year 2 kg N per km Less than 250 250 – 500 500 – 1 000 500 – 1 000 More than 1 000 1 000 – 2 500 2 500 – 10 000 More than 10 000
Figure 2.1Flows of nitrogen in agricultural systems in EU-27 based on the CAPRI model. The flows show the transport of nitrogen between the livestock
and crop production systems, the environment and the consumer. (For further details see Leip et al., 2014). These numbers update the agricultural component of the European nitrogen budget in ENA (Leip et al. 2011a).
Figure 2.2Geographical distribution of NH3emission (left) over EU-27 and total input to the aquatic system (right) [kg N km-1yr-1]. Based on Leip et al.
(2011a) and Leip (2011), using the Indicator Database for European Agriculture.
Emissions of NOxare particularly high for energy-intensive crops such as oilseeds and fruits and vegetables. For these crops, the share of NOxof total Nremissions is 11% for oilseeds and 22% for fruits and vegetables. Emissions of N2O account for around 4-7% of total Nrlosses for all food commodity groups considered in which the share for crop products (6%) is generally higher than for animal products (4%).
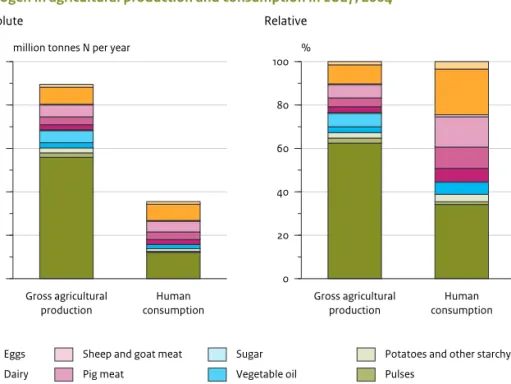
Figure 2.4 (left) shows that the share of nitrogen in 12 main food commodity groups expressed as gross agricultural production is very different from that expressed as estimated human consumption. This latter value corresponds to the amount of product that is offered to the consumers. This value is different to actual human intake, as losses still occur between purchase and intake (see also Chapter 3). The total gross production amounts to 9.1 million tonnes of N, excluding grassland and dedicated feed crops such as fodder maize and fodder beet. In particular cereals are used both to feed the
animals and to supply human food. In terms of protein supply, cereals represent around 60% of the total, however they represent only around 30% of the total proteins consumed (Figure 2.4, right). Overall, these 12 food commodity groups supply about 3.9 million tonnes of nitrogen to the consumer.
The share of protein supplied to the consumer (‘Human Consumption’) that comes from animal sources (55%) is more than double that in the total agricultural production (23%) (Figure 2.4, right). This in part reflects the fact that the protein from many plant products are used as livestock feeds (e.g. molasses and oil cakes).
2.3.3
Emission by functional unit of produce
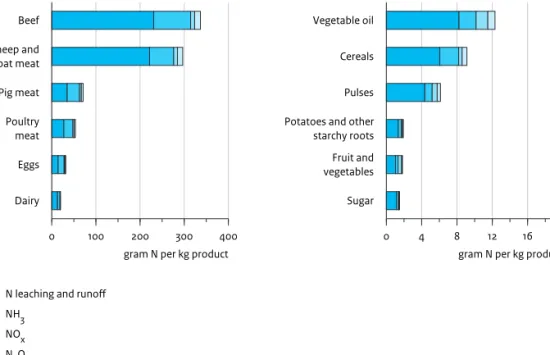
Emission intensities (or unit emissions), expressed per functional unit of product (Figure 2.5), show that producing one kilogram of beef or meat from sheep and goats requires the use of 200-340 kg reactive nitrogen, which is a factor of 200
0 20 40 60 80 100
%
Cereals Pulses
Potatoes and other starchy roots Fruit and vegetables
Vegetal oil Sugar Beef Poultry meat Pig meat
Sheep and goat meat Dairy
Eggs
Emissions of reactive nitrogen in EU27, 2004
N2O 0.46 Tg N per year NH3 2.78 Tg N per year NOx 0.43 Tg N per year
N leaching and runoɌ 6.32 Tg N per year Gross agricultural production Human consumption 0 2 4 6 8 10
million tonnes N per year
Eggs Dairy
Sheep and goat meat Pig meat
Poultry meat Beef
Sugar Vegetable oil Fruit and vegetables
Potatoes and other starchy roots Pulses
Cereals Absolute
Nitrogen in agricultural production and consumption in EU27, 2004
Gross agricultural production Human consumption 0 20 40 60 80 100 % Relative
Figure 2.3Share of reactive nitrogen emissions for the twelve main food commodity groups as calculated using the CAPRI model. The width of the bars
indicates the emissions per source. Note that these emissions include also emissions caused outside the EU by cultivation of imported feed products. 1 Tg = 1 million tonnes. This figure includes the direct Nremissions from agricultural activities (see Leip et al.,2014, Figure 3) plus Nremissions from energy linked to food production.
Figure 2.4Absolute nitrogen content (left panel) and share of nitrogen (right panel) in 12 main food commodity groups in ‘gross production’ (left bars) and
‘human consumption’ (right bars) as defined in the Eurostat market balance (right panel). Conversion losses in animal production (from feed to meat and dairy) are the main cause of the ‘gap’ between gross production and human consumption. According to this approach, the additional effect of food losses between purchase and actual intake is not included, so that actual human consumption is even less. The values shown here exclude grassland and dedicated feed crops such as fodder maize and fodder beet, but food crops that are used as livestock feed are included in the vegetable commodity groups.
larger than for potatoes and fruits and vegetables. The estimated emission intensities for potatoes, fruit and vegetables are in the range of 1.0-1.9 kg reactive nitrogen per kg product. Also the emissions related to pig meat, poultry and eggs are considerably higher than those of crop products. The highest emissions in the group of crop products are from oils, followed by cereals and leguminous crops (with some differences in this sub-group between the models). The lowest emissions are calculated for sugar beet, potatoes and fruits and vegetables.
Some products contain a lot of water, with a relatively low nitrogen (and thus protein) content. For example, dairy products have much lower nitrogen content compared with meat. Therefore, the nitrogen emission intensities are also expressed relative to their nitrogen content, as shown in Figure 2.6, which is partly reflective of the characteristic protein concentrations of different products. Dairy products have a low protein content compared with other animal products, and their emission intensities are around 2.5-3.8 kg Nremissions per kg nitrogen in milk. This is at a similar level to the emission nitrogen intensities of pig meat, but higher than the emission N-intensities of poultry meat and eggs. A similar effect is seen for emission nitrogen intensities for the fruits and vegetables.
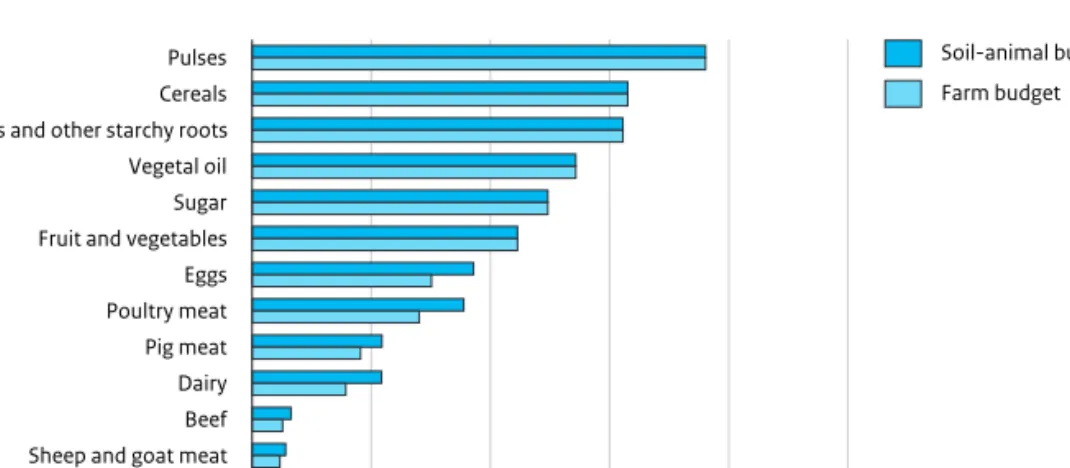
Figure 2.7 shows the nitrogen use efficiency (NUE) of the twelve main food commodity groups as calculated using the CAPRI model. The NUE is defined as the ratio of useable products resulting from an economic activity compared to the total nitrogen input that is invested (Leip et al., 2011b). As nitrogen investments, inputs of nitrogen to the soil are considered for vegetable products (mineral fertilizer, manure, atmospheric deposition, biological nitrogen fixation, and nitrogen in crop residues), and animal feed for animal products. NUE can be estimated for the actual production activity (soil or animal) or at a farm level.
The NUE of crops are between 45% and 76% in the European Union and are – as all agri-environmental Nr-indicators – subject to large variability among countries and within each country (Leip et al., 2011c, 2011b). Nevertheless, agricultural production systems in Europe belong globally to those with a relatively high efficiency (Bouwman et al., 2009; FAO, 2010a). Usually, a farm-level NUE is defined for a mix of products that exits the farm while internal flows of nitrogen in manure, feed, and crop residues are considered neither as in- nor as output flows. In the current assessment, the ‘farm concept’ is applied to individual products, assuming that the required feed is produced within the farm and manure is recycled up to the level that is required for growing the feed. Crop residues are considered as internal flows in the ‘farm budget’, while in the soil budget concept they are used as fertilizer – and as such also as useable products.
The NUE at the animal level measures how much of the nitrogen in feed is recovered in animal products (also called feed nitrogen recovery, see Sutton et al., 2011b, Figure SPM.6 ). The animal-NUE ignores the fact that part of the excreted nitrogen is used as fertilizer, but also losses that occur at the stage of feed production. Figure 2.7 shows that these two factors do not completely compensate and result in a NUE for animal products at the farm level which is about 20% lower than the NUE at the animal level.
Figure 2.5Emission intensities per kg food product for N2O, NOx, NH3and N leaching and run-off for the twelve main food commodity groups (six animal
products, left; six vegetal products, right), based on the CAPRI-model (Leip et al., 2014).
Beef Sheep and goat meat Pig meat Poultry meat Eggs Dairy 0 100 200 300 400 gram N per kg product
N leaching and runoɌ NH3
NOx N2O Animal products
Emissions intensities of reactive nitrogen in EU27, 2004
Vegetable oil
Cereals
Pulses
Potatoes and other starchy roots Fruit and vegetables
Sugar
0 4 8 12 16 20 gram N per kg product Vegetal products
The lower values of farm NUE for animal products than the animal NUE (feed conversion efficiency) is less than what would be expected on the basis of the animal-budget NUE and the soil-budget NUE of feed crops (also fodder are performing at a similar level than shown here for the food crops), which demonstrates the benefit of integrated production systems.
2.4
Discussion
While the results presented in this chapter are based on the CAPRI model, Leip et al. (2014) have compared the results with similar calculations with the MITERRA model. Although the two models are not completely independent, there are some differences in methodology. One of the main differences is that in MITERRA the feed intake and excretion were from different sources, i.e. feed intake from CAPRI and N excretion from GAINS, which can lead to mismatches for some countries and animal types. CAPRI on the other hand has, by definition, a closed animal N budget, as the excretion is the result of the feed intake minus the N in livestock products and waste.
Figure 2.6Emission intensities per unit of nitrogen in food product for N2O, NOx, NH3and N leaching and run-off for the twelve main food commodity
groups (six animal products, left; six vegetal products, right) , based on the CAPRI-model (Leip et al., 2014).
Beef Sheep and goat meat Dairy Pig meat Eggs Poultry meat 0 4 8 12 16
gram N per kg N in product
N leaching and runoɌ NH3
NOx N2O
Animal products
Emission intensities of reactive nitrogen per unit of nitrogen in food products in EU27, 2004
Fruit and vegetables
Sugar
Potatoes and other starchy roots
Vegetable oil
Cereals
Pulses
0.0 0.2 0.4 0.6 0.8 1.0 gram N per kg N in product
Vegetal products
Pulses Cereals Potatoes and other starchy roots Vegetal oil Sugar Fruit and vegetables Eggs Poultry meat Pig meat Dairy Beef Sheep and goat meat
0 20 40 60 80 100
%
Soil-animal budget Farm budget
Nitrogen use eɏciency in EU27, 2004
Figure 2.7Nitrogen Use Efficiency (NUE) for the twelve main food commodity groups (kg N in product per kg N input). The NUE is defined here as the ratio
of useable products resulting from an economic activity compared to the total nitrogen input that is invested. For animal products, the NUE is given both at the definition of the ‘animal’ (feed conversion) and at the level of a ‘farm’. The estimated N inputs account for all sources of new nitrogen required in the food commodity production chain including fertilizers, biological nitrogen fixation, atmospheric deposition as well as net inputs of manure, while outputs here include feed, food and bioenergy products.
Differences between the models also result from different assumptions about the fraction of Nrleaching to the groundwater. This term is about twice as high if simulated with the CAPRI model than if simulated with the MITERRA model (de Vries et al., 2011a). The CAPRI model calculates the fraction of nitrogen lost to the groundwater on the basis of the IPCC (2006) approach, while the MITERRA model uses an own nitrogen leaching and runoff module (Velthof et al., 2009).
Results on the level of the EU-27, as presented in this chapter using CAPRI are fairly similar to estimates calculated with MITERRA. Differences at country level can however be considerable. Both models agree in the tendency for higher Nr losses from animal products compared to vegetal products.
2.5
Summary and conclusions
Despite a relatively high efficiency of agriculture in the European Union, the production of food in Europe contributes considerably to losses of Nrto the environment. Total losses amount to between 7.2 and 10.4 million tonnes of reactive nitrogen, depending on model assumptions. Leip et al. (2011a) estimated total Nrlosses to the environment of 17.7 million tonnes of Nr; hence, food production in Europe is responsible for about half the total emissions of reactive nitrogen in European countries.
This study allocated the nitrogen losses to food commodity groups. The results show that livestock production chains have a high share in nitrogen losses. Over 80% of the agricultural ammonia emissions to air and nitrogen emissions to water are related to livestock production.
There are large differences between food commodities in terms of nitrogen losses per unit of protein produced. Plant-based commodities, such as cereals, have relatively low losses and livestock products have much higher losses. The nitrogen losses per unit of protein from beef are estimated at 20 times those from cereals. Poultry meat, which has the lowest nitrogen emissions intensity from the animal product groups considered, still represents up to twice as much as that from fruits and vegetables for the same quantity of protein intake. Corresponding values for nitrogen use efficiency are small for animal commodities (6-37%) and considerably higher for plant-based commodities (45-76%).
Beef and dairy products account for 56% of total Nremissions in Europe, and the production of all animal products causes 82% of total Nremissions from agriculture (Figure 2.3). Cereal production is the dominant source of emissions amongst vegetable products. With an emission intensity 6-9 g nitrogen per kg product cereals are also major sources of nitrogen per unit if compared to other vegetal products, second only to oils (10-12 g Nrper kg product), but this is still much smaller than the most emission-intensive meat from ruminants (up to 300 g Nrper kg product). However, per unit of protein, cereals perform equally or better than most other crops with about 0.45 g N emission per kg N in the product. An exception are leguminous crops, with only 0.10-0.15 g N emission per kg N in the product, which is reflected in their higher nitrogen use efficiency.
![Table S1 Summary of data on average food intake in Europe and environmental indicators under current conditions (based on 2004) and under a 50% reduction in the consumption of animal products [synthesis from 4.3.3 and 5.3]](https://thumb-eu.123doks.com/thumbv2/5doknet/3235352.19811/11.977.126.850.170.781/summary-environmental-indicators-conditions-reduction-consumption-products-synthesis.webp)
![Figure 2.2 Geographical distribution of NH 3 emission (left) over EU-27 and total input to the aquatic system (right) [kg N km -1 yr -1 ]](https://thumb-eu.123doks.com/thumbv2/5doknet/3235352.19811/20.977.232.690.610.974/figure-geographical-distribution-emission-total-input-aquatic-right.webp)