Berekeningen en metingen bij ventilatie
Kennisbank BouwfysicaAuteurs: dr. Edward Prendergast (moBius consult) en dr.ir. Peter van den Engel
1 CO2-concentratie
The amount of fresh air that should be supplied depends on the occupancy of a room and the required air quality standard:
The CO2-level is a good general indicator of air quality in a room, if the polluting factor in a room are people. A typical outdoor concentration of CO2 is 390 - 400 ppm. People are only affected by the CO2 itself at higher concentrations. Drowsiness and headaches occur at concentrations of 10,000 ppm and higher. For an adequate air quality, the CO2-concentration should be kept under 1,200 ppm. Levels from 600 – 1000 ppm are recommended. With windows that can be opened. With displacement ventilation it is possible to realize lower CO2 -levels with less fresh air supply per person than with mixing ventilation.
Pollution-levels can be calculated with the following equation in which there is an emission of a pollution in a room (qm), and supplied air (qv)1:
sup
( )
(0)
(1
v)
q t m V IDA IDA vq
C
t
C
C
e
q
(1) where:cIDA(t) = concentration in the room at time t [ppm]
cIDA(0) = concentration in the room in the beginning (t=0) [ppm]
csup = concentration in the supplied air [ppm]
qv = mass flow of the supplied air [m3s-1]
qm = mass flow of the emission in the room [m3 s-1 *1000000]
V = volume of the air in the room [m3]
t = time [s]
For CO2-emission (the gas is already in the outdoor air) this equation can be reduced to:
( )
(0)
(1
v)
q t m V IDA IDA vq
C
t
C
e
q
(2)With this equation the following CO2-concentrations (CIDA = 0) have been calculated (table 1): - CIDA(0) = outdoor CO2-concentration present in the indoor air = 400 ppm
- qm = 20 dm3/h CO2 per student = 0,0000056 m3 s-1 *1000000 - qv = 0.0070 – 0.0280 m3/s per student
- t = 2700 s
- volume classroom V = 150 m3 with 25 students = 6 m3 per student - mixing type of ventilation
For steady state situations this equation can be reduced even more:
( )
(0)
m IDA IDA vq
C
t
C
q
(3)For a quick general assessment equation 3 is already sufficient.
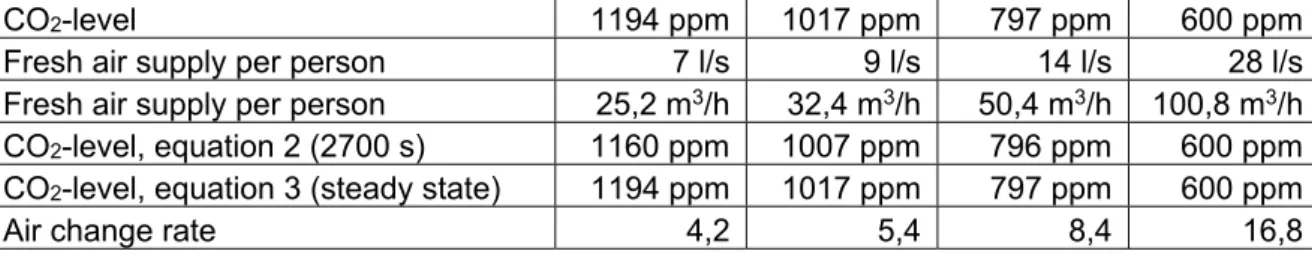
table 1 CO2-levels and fresh air supply per student
CO2-level 1194 ppm 1017 ppm 797 ppm 600 ppm
Fresh air supply per person 7 l/s 9 l/s 14 l/s 28 l/s
Fresh air supply per person 25,2 m3/h 32,4 m3/h 50,4 m3/h 100,8 m3/h
CO2-level, equation 2 (2700 s) 1160 ppm 1007 ppm 796 ppm 600 ppm
CO2-level, equation 3 (steady state) 1194 ppm 1017 ppm 797 ppm 600 ppm
Air change rate 4,2 5,4 8,4 16,8
The table shows that very large air flows per person are necessary to reach a low CO2-level, which could be recommended. Normally this high air change rate is only economical possible with additional use of operable windows.
2 Coanda-effect
When natural air supply is used, the air inlet is situated close to the ceiling. If well designed, the natural phenomena of air clinging to a surface can be used to minimise draught problems. It is very difficult to predict the length of the air jet along the ceiling “Classical” jet equations cannot be used. The airflow volume of the jet is relatively small compared to the effect of resistance of the surrounding air. With air flow (CFD) simulations a prediction of thermal comfort is possible, but measurements are still necessary to check and develop these simulations and to evaluate thermal comfort. Usually, the length of the jet will become √2 larger due to the coanda-effect. When the position of the air inlet is just near the ceiling and the air volume (>20 dm3/sm) and air velocity is high enough (> ca 1.5 m/s) the air flow will “cling” to the ceiling. This is called the coanda-effect.
In order to understand the coanda-effect, it is important to know the mechanical energy balance and the Bernouilli equation:
const
p
h
g
v
p
h
g
v
2 2 2 2 1 1 2 1.
1
/
2
.
.
.
2
/
1
(4) where v = air velocity m/sp = static absolute pressure Pa
g = gravitational acceleration m/s2
h = height of the airflow above reference level (usually ground level) m
= volumetric mass of air kg/m3
The term g.h is only important when there are temperature differences in then air (chimney-effect). When there is little or no temperature difference and little or no difference in height, this term can be neglected for gas flows like air. This is because the density of the air in the
atmosphere decreases when the air flows from a low to a high point and increases in the opposite direction. Neglecting this term for, the Bernouilli equation for air is:
2 2 2 1 2 1
1
/
2
.
.
.
.
2
/
1
v
p
v
p
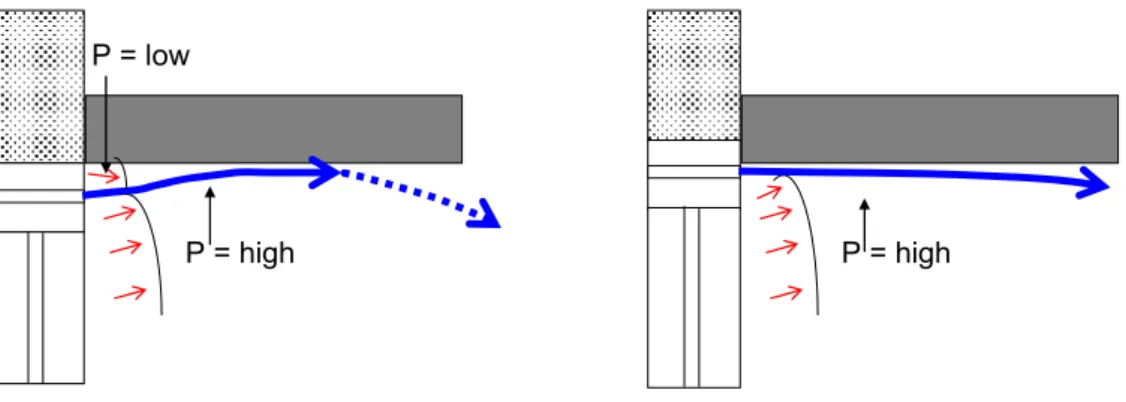
(5)When the velocity decreases, the pressure will increase. Air jets will induce surrounding air and this will reduce the velocity (more resistance) and the static surrounding pressure will become higher. When there is little air to induce, near a surface, the air velocity will remain higher than at a side where there is much air to induce, so the pressure at the upper side will become lower. This in fact is the coanda-effect. The closer the air inlet is near the ceiling, the longer the flow will “cling” to the ceiling (fewer eddies, less turbulence).
figure 1 Illustration of the coanda-effect Pressure difference and air flow
The maximum air velocity related to minimum height of the air inlet can be evaluated with the following equation, which can be derived from Bernouilli's equation:
P
v
2
(6)v = velocity of supply air m/s
P = pressure difference over the inlet Pa
= volume mass of air kg/m3
When the air velocity of the inlet is lower than 50% of the maximum value the aerodynamic properties of the inlet should be improved.
3 Tocht
The feeling of draught is influenced by many parameters. Usually draught is produced by high air velocity combined with high air turbulence and a moderate or low operative temperature. The lower the temperature, the easier draught will occur. To predict local thermal discomfort, the Draught Rating approach is used.
With measurements and simulations the amount of people that will be dissatisfied with thermal comfort can be predicted. In the NEN-EN-ISO 7730 there are three categories:
A. maximal 10 % dissatisfied users B. maximal 20% dissatisfied users C. maximal 30% dissatisfied users
P = low
The following equation is used to predict the amount of dissatisfied users::
34
,
,
0
.
05
0.620
.
37
,
3
.
14
t
v
v
Tu
DR
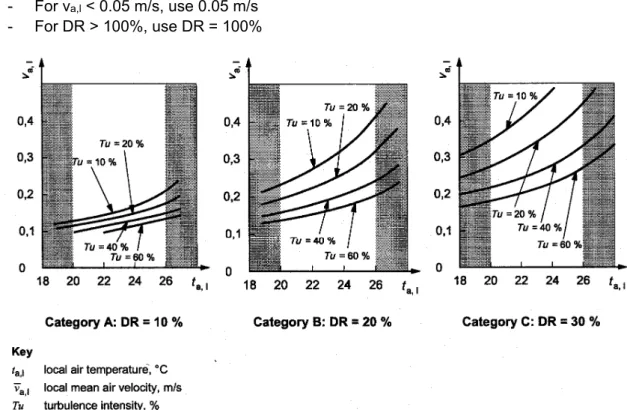
al al al (7)- ta,l is the local air temperature in degrees Celsius, between 20 and 26oC - va,l is the local mean air velocity in metres per second, < 0.5 m/s
- Tu is the local turbulence intensity, in percent, between 10 and 60%, if unknown 40% may be used
- For va,l < 0.05 m/s, use 0.05 m/s - For DR > 100%, use DR = 100%
figure 2 relation between air velocity, turbulence intensity and air temperature and draught rating category
Draught ratings are usually measured at 0.1 m (near the feet) and 1.1 m (neck height of a sitting person) above the floor.
The risk of draught depends on the amount of fresh air that has to be supplied per m2. In houses the occupancy is usually low, for instance 1 person per 20 m2. In schools, the occupancy is high, for instance 1 person per 2 m2. This means more air has to be supplied.
table 2 some typical occupancy levels related to different functions
Function House Office School Theatre, cafe
m2 per person
15 – 35 6.5 – 20 1.3 – 4 0.5 – 3
Archimedes number
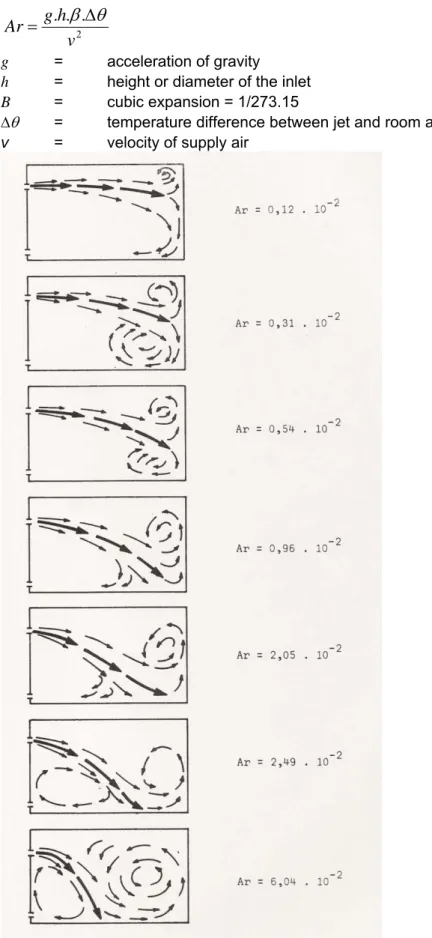
The draught-preventing qualities of the air inlet can be checked by calculating the Archimedes number of the air inlet , with the following equation the deflection of the jet can be
2
.
.
.
v
h
g
Ar
(8) g = acceleration of gravity m/s2h = height or diameter of the inlet m
B = cubic expansion = 1/273.15 1/K
= temperature difference between jet and room air K
v = velocity of supply air m/s
figure 3 comparison of the deflection of the air jet with Ar = 0.0012 to AR = 0.0604
4 Het Mollier-diagram
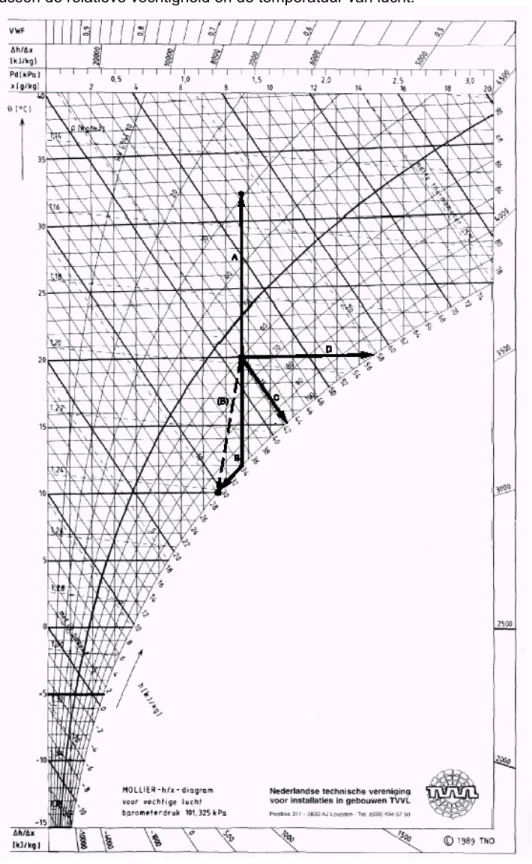
Het Mollier-diagram voor vochtige lucht (figuur 4) geeft de samenhang weer tussen de absolu-te vochtigheid (x) en de enthalpie (h). Het diagram kan gebruikt worden om absolu-te bepalen wat er gebeurt met de lucht als de fysische omstandigheden veranderen. Bijvoorbeeld de relatie tussen de relatieve vochtigheid en de temperatuur van lucht.
4.1 Formules
Per definitie is de enthalpie (warmte-inhoud) van droge lucht bij 0 oC gelijk aan 0 kJ/kg. De enthalpie van vochtige lucht is:
h = cpl.θ + cpw.x.θ + x.r kJ/kg (8)
waarin:
cpl = soortelijke warmte van lucht bij constante druk = 1,007 kJ/(kg.K) bij 20oC cpw = soortelijke warmte van waterdamp bij constante druk = 4,18 kJ/(kg.K) bij 20oC r = verdampingswarmte van water = 2454 kJ/kg bij 101.325 Pa
x = absolute vochtigheid in kg water per kg lucht θ = droge luchttemperatuur ("droge bol") in oC De absolute vochtigheid is:
x = 0,622 . pd / (B - pd) kg/kg (9)
waarin:
pd = partiele dampspanning van de waterdamp in Pa B = atmosferische druk in Pa
De absolute vochtigheid (x) is in het Mollier-diagram op de horizontale as uitgezet, schaal in g/kg bevindt zich aan de bovenzijde. De enthalpie (h) is niet op de verticale as uitgezet maar op een as die een hoek met de verticale as maakt. Dit is gedaan om het diagram uit elkaar te trekken en het daardoor beter te kunnen aflezen. De waarde van de enthalpie staat bij de lijn RV = 100%.
De relatieve vochtigheid is gedefinieerd als:
RV = pd / ps fractie (10)
of in procenten:
RV = 100 . pd / ps % (11)
waarin:
pd = partiele dampspanning van waterdamp in Pa
ps = partiele dampspanning van waterdamp bij volledige verzadiging in Pa
De gebogen lijnen in het Mollier-diagram zijn de lijnen van gelijke relatieve vochtigheid. De onderste lijn is de verzadigingslijn (RV=100%). De hoeveelheid waterdamp die lucht kan bevatten is afhankelijk van de luchtdruk. Het Mollier-diagram geldt voor een barometerdruk van 101.325 Pa.
De partiele dampspanning bij verzadiging is:
ps = exp (23,561 - 4030,18 / (θ + 235)) Pa (12)
De partiele dampspanning is op de schaal bovenaan het diagram af te lezen.
De soortelijke massa van vochtige lucht bedraagt:
ρ = 273 (1,273. B - 0,48 . pd) / (100000 . (θ + 273)) kg/m3 (13)
Het dauwpunt is de temperatuur waarbij condensatie gaat optreden als lucht wordt gekoeld, zonder dat vocht wordt toe- of afgevoerd. De dauwpunttemperatuur wordt berekend met:
θtdp = 4030,18 / (23,561 - ln pd) - 235 oC (14)
4.2 Karakteriseren van de toestand van de lucht (conditie van de lucht)
De toestand van vochtige lucht is met twee grootheden uit het Mollier-diagram te karakteriseren, bijvoorbeeld met een droge luchttemperatuur θ = 20 oC en een relatieve vochtigheid van 60%. De conditie van deze lucht is ook met andere grootheden te karakteriseren: θ = 20 oC en x = 8,8 g/kg θ = 20 oC en θn = 15,2 oC θ = 20 oC en h = 42,5 kJ/kg θ = 20 oC en θdp = 12,0 oC θ = 20 oC en pd = 1400 Pa
De dauwpunttemperatuur wordt gevonden op het snijpunt van de verticale lijn van de absolute vochtigheid (x) (in het diagram in g/kg) en de lijn RV = 100%.
De in het Mollier-diagram aangegeven "natte thermometer" is de psychrometrische natte luchttemperatuur (θn). De waarde wordt gevonden door vanuit het beschouwde punt in het diagram (dat de conditie van de lucht karakteriseert) een lijn te trekken evenwijdig aan de gestippelde "natte thermometer"-lijnen. Op het snijpunt van deze lijn met de verzadigingslijn (RV = 100%) is de waarde af te lezen op de schaal van de droge luchttemperatuur (verticale as). Voorbeeld: lucht met een droge luchttemperatuur van 20 oC en RV van 60% heeft een natte luchttemperatuur van bijna 14 oC.
4.3 Toestandverandering
Wordt lucht die een temperatuur heeft van 20 oC en relatieve vochtigheid van 60% (θ=20 oC, RV=60%) verwarmd tot 32 oC dan verandert de toestand van de lucht in het Mollier-diagram verticaal langs de lijn x=8,8 g/kg (proceslijn A). Bij 32 oC is de relatieve vochtigheid bijna 30% (θ=32 oC, RV=30%).
Bij het koelen van lucht (θ=20 oC, RV=60%) tot θ=10 oC verandert de toestand van de lucht in het Mollier-diagram verticaal langs de lijn x=8,8 g/kg tot het dauwpunt θdp=12,0 oC is bereikt. Daarna verloopt de verandering langs de lijn RV = 100% tot θ=10 oC waarbij waterdamp op de koeler condenseert en de absolute vochtigheid 7,6 g/kg wordt (proceslijn B). In werkelijkheid zal het proces meer de stippellijn volgen omdat niet alle lucht homogeen gemengd met het koeloppervlak in contact komt.
Het bevochtigen van lucht door het vernevelen van water verloopt bij benadering langs de lijnen met gelijke natte luchttemperatuur (θn) (proceslijn C). Het bevochtigen van lucht met droge verzadigde stoom verloopt bij benadering langs de lijnen van gelijke droge luchttemperatuur (θ) (proceslijn D).
Bij gelijktijdig toe- of afvoer van warmte en vocht kan voor het bepalen van de nieuwe toestand de Δh/Δx-schaal worden gebruikt.
De VWF-schaal, bovenaan het diagram, geeft de verhouding weer tussen de hoeveelheid voelbare en totale (voelbaar + latent) warmte die bij koeling wordt afgevoerd. De VWF is te bepalen door in het Mollier-diagram een lijn te trekken tussen het begin- en eindpunt van het koelproces en, evenwijdig hieraan, een lijn vanuit het nulpunt naar de VWF-schaal. De betekenis van deze factor is dat de koelmachine 1/VWF maal de berekende koellast aan warmte moet afvoeren.
4.4 Mengen van lucht
Bij het mengen van gelijke hoeveelheden lucht met verschillende temperatuur en vochtigheid is de conditie van het mengsel te bepalen door in het Mollier-diagram de karakteristieke punten met een rechte lijn te verbinden. Het midden van die lijn karakteriseert de toestand van het mengsel. Bij het mengen van ongelijke hoeveelheden lucht is de conditie van het mengsel te bepalen door de verbindingslijn verhoudingsgewijs te verdelen.
5 Meten van klimaatcondities
Het meten van klimaatcondities is minder eenvoudig dan vaak wordt gedacht. Er moet voor zorg worden gedragen dat het meetinstrument is afgeschermd van ongewenste meeteffecten. De droge luchttemperatuur (θ) is te meten met een droge voor straling afgeschermde
thermometer. Om te zorgen dat de gemeten temperatuur overeenkomt met de temperatuur van de omgeving, moet zorg gedragen worden voor een goede luchtbeweging rond de
thermometer. Dit kan bijvoorbeeld door omgevingslucht gedurende enige tijd geforceerd langs de thermometer te geleiden.
De psychrometrische natte luchttemperatuur (θn) wordt gemeten met een voor straling afge-schermde thermometer met een vochtig kousje om het gevoelige gedeelte. Tijdens de meting moet de lucht met een snelheid van ten minste 3 m/s langs het kousje stromen. Het apparaat waarmee deze meting kan worden uitgevoerd heet "psychrometer". Hierin is een kleine ventilator ingebouwd die voor de luchtstroming zorgt.
De dauwpunttemperatuur (θdp) is te meten met een apparaat waarin een metalen spiegeltje elektrisch wordt gekoeld. De temperatuur van het spiegeltje wordt elektronisch gemeten. Als het spiegeltje beslaat wordt dit door een optisch instrument in het apparaat waargenomen en de bijbehorende spiegeltemperatuur uitgelezen.
De stralingstemperatuur (θr) is nauwkeurig te meten met een warmtestralingsmeter. Iets minder nauwkeurig - maar doorgaans nauwkeurig genoeg - is de gemiddelde
stralingstemperatuur af te leiden uit de globetemperatuur (θg), de luchttemperatuur (θ) en de luchtsnelheid (v). Voor de luchtsnelheden zoals die normaal in verblijfsruimten voorkomen geldt bij benadering:
θr = [(θg +273)4 + 0,4.108 x θg - θ1/4 x ( θg - θ)]1/4 -273 oC (15)
De globetemperatuur of zwartebol-temperatuur, wordt gemeten met een thermometer in het hart van een holle metalen globe. De standaardglobe heeft een diameter van 0,15 m en is voorzien van een laag mat-zwarte verf die een absorptiecoëfficiënt voor straling heeft van ten minste 0,95.
Omdat een psychrometer een kostbaar en kwetsbaar instrument is werd de luchtvochtigheid voorheen vaak met een haar-hygrometer bepaald. Het is een instrument waarin enkele paardenharen met een metalen veertje en een hefboompje onder spanning worden gehouden. Bij een hoge luchtvochtigheid worden de haren langer, waardoor het hefboompje beweegt. Aan het hefboompje zit een wijzer die langs een schaal beweegt met daarop de relatieve
vochtigheid. Het is geen nauwkeurig instrument. Tegenwoordig zijn er relatief goedkope elektronische sensoren in de handel die de RV meten.
De luchtsnelheid is het beste met een hittedraad-anemometer te meten. Met dit instrument kunnen vrij nauwkeurig zowel hoge (>10 m/s) als lage (0,05 m/s) snelheden worden gemeten. Het meetinstrument meet in wezen de afkoeling van een warme draad. Het is - afhankelijk van het type – wel of niet richtingsgevoelig.
Om een goed beeld over tocht te krijgen is ook de variatie van de luchtsnelheid in de tijd van belang. Snelle fluctuaties worden turbulentie genoemd. De turbulentie-intensiteit kan ook gemeten worden. Er moet een keuze worden gemaakt voor tijdsperiode die kan worden gemeten (tijdsconstante). Deze varieert in de praktijk tussen de 0,01 en 1 seconde. Voor de evaluatie van turbulentie zoals besproken in de NEN-EN-ISO 7730 (zie § 3) is een tijdsconstante van 0,1 seconde voldoende.
Tegenwoordig zijn er relatief goedkope en robuuste instrumentjes in de handel waarmee de belangrijkste (binnen)klimaatcondities gemonitoord kunnen worden. De apparaatjes meten op intervallen zaken als (lucht)temperatuur, RV en eventueel CO2-concentratie. De apparaatjes kunnen in een gewone werkomgeving (kantoor/school) worden neergezet, zonder dat dit het werkproces verstoord.
Er zijn apparaten waarmee alle hier besproken grootheden gelijktijdig zijn te meten. Dit wordt vaak een “meetboom” genoemd. Een meetboom in relatief groot en kwetsbaar. De metingen kunnen (eventueel direct met vooraf geprogrammeerde mensgebonden gegevens, zoals activiteit en kleding) worden omgerekend naar comfortindices zoals PMV en PPD.
Voor speciale gevallen (bijvoorbeeld voor het opbouwen van een 3D-beeld van het klimaat) kan ook met akoestische signalen temperatuur, luchtsnelheid, relatieve vochtigheid en CO2 worden gemeten.
De overige grootheden, zoals enthalpie (h), absolute vochtigheid (x), natte
luchttemperatuur (θn) en dampspanning (pd) worden niet gemeten maar berekend of uit het Mollier-diagram afgeleid.