005495
This is a publication of:
National Institute for Public Health and the Environment
P.O. Box 1 | 3720 BA Bilthoven The Netherlands www.rivm.nl June 2013
Environmenta
radioactivity
in the Nether
Environmental radioactivity in the Netherlands
Results in 2011
Environmental radioactivity in the Netherlands
Environmental radioactivity in the
Netherlands
Results in 2011
Colophon
© RIVM 2013
Parts of this publication may be reproduced, provided acknowledgement is given to the 'National Institute for Public Health and the Environment', along with the title and year of publication.
NV. Electriciteit-Productiemaatschappij Zuid-Nederland EPZ
G.J. Knetsch (editor), RIVM
Contact:
G.J. Knetsch
Centre for Environmental Safety and Security
gert-jan.knetsch@rivm.nl
This investigation has been performed by order and for the account of the Ministry of Economic Affairs, within the framework of Project 610891: environmental monitoring of radioactivity and radiation.
Abstract
Environmental radioactivity in the Netherlands Results in 2011
In 2011 the Netherlands fulfilled the European obligation to annually measure radioactivity in the environment and in food. According to the Euratom Treaty of 1957, all Member States of the European Union are obliged to perform these measurements each year. In addition the Netherlands complies with the guidelines established in 2000 for performing the measurements uniformly. The measurements provide background values of radioactivity that are present under normal circumstances. These background values can be used as reference values, for instance, during a disaster. The National Institute for Public Health and the Environment (RIVM) reports on behalf of the Netherlands to the European Union about radioactivity in the environment.
Radioactivity during two radiological incidents
In 2011 two radiological incidents occurred which could be detected in the Netherlands. Radionuclides originating from the incident at the nuclear site at Fukushima (Japan) were detected from 18 March until 10 June and radionuclides originating from an incident at an institute for medical isotopes in Budapest (Hungary) were detected from 3 until 11 November. The levels of radionuclides measured in the Netherlands as a result of these incidents were very low and do not pose a threat to public health.
Radioactivity in air, food and milk
Except for the measurements during these two radiological incidents, measurements in the air and environment showed normal levels, which are within the range of previous years. The deposition of polonium-210 showed the highest level since 1993, but this level does not pose a threat to public health. Radioactivity levels in food and milk were well below the export and
consumption limits set by the European Union, except for one sample. Of 231 samples game and poultry one sample of boar (originating from the
Netherlands in January 2011) contained 1.4 times more cesium-137 than the set limit.
Radioactivity in surface water
In some locations, the radioactivity levels in surface water were above the target values set by the Vierde Nota waterhuishouding (1998). However, these levels do not pose a threat to public health. Target values should preferably not be exceeded, but they are not limits as such.
Keywords:
Rapport in het kort
Radioactiviteit in het Nederlandse milieu Resultaten in 2011
In 2011 voldeed Nederland aan de Europese verplichting om jaarlijks de hoeveelheid radioactiviteit in het milieu en in voeding te meten. Volgens het Euratom-verdrag uit 1957 zijn alle lidstaten van de Europese Unie verplicht deze metingen jaarlijks te verrichten. Nederland voert daarbij de aanbevelingen uit die in 2000 zijn opgesteld om de metingen volgens een bepaald stramien uit te voeren. De metingen leveren achtergrondwaarden op, oftewel radioactiviteits-niveaus die onder normale omstandigheden aanwezig zijn. Deze waarden kunnen bijvoorbeeld bij calamiteiten of rampen als referentie dienen. Het RIVM rapporteert namens Nederland over radioactiviteit in het milieu aan de Europese Unie.
Radioactiviteit gedurende twee radiologische incidenten
In 2011 vonden twee radiologische incidenten plaats waarna in Nederland radionucliden te meten waren. Van 18 maart tot en met 10 juni zijn radionucliden aangetroffen die afkomstig waren van het incident met de
nucleaire installatie bij Fukushima (Japan), en van 3 tot 11 november afkomstig van een incident bij een instituut voor medische isotopen in Budapest
(Hongarije). De niveaus van radionucliden die in Nederland als gevolg van deze incidenten zijn aangetoond, waren zeer laag en vormen geen risico voor de volksgezondheid.
Radioactiviteit in lucht, voedsel en melk
De metingen in lucht en omgeving lieten een normaal beeld zien, dat niet verschilde van voorgaande jaren. De depositie van polonium-210 is het hoogst sinds 1993, de aangetroffen radioactiviteitsniveaus zijn echter niet schadelijk voor de volksgezondheid. De radioactiviteitsniveaus in voedsel en melk liggen net als in voorgaande jaren duidelijk onder de Europese limieten die zijn
opgesteld voor consumptie en export, op één monster na. Van de 231 monsters wild en gevogelte bevatte één monster wild zwijn (van januari 2011) 1,4 keer meer cesium-137 dan de gestelde limiet.
Radioactiviteit in oppervlaktewater
In het oppervlaktewater liggen de radioactiviteitsniveaus op een aantal locaties boven de streefwaarden die in de Vierde Nota waterhuishouding (1998) zijn bepaald. De overschrijdingen zijn echter zodanig dat ze niet schadelijk zijn voor de volksgezondheid. Voor oppervlaktewater bestaan er geen limieten voor radioactieve stoffen, waarop wordt toegezien en gehandhaafd. Wel zijn er streefwaarden, die bij voorkeur niet overschreden mogen worden.
Trefwoorden:
Preface
The following institutes contributed to the report:
The National Institute for Public Health and the Environment Rijksinstituut voor Volksgezondheid en Milieu (RIVM)
Data on air dust, deposition, ambient dose rates and drinking water. ing. G.J. Knetsch (editor), ing. R.B. Tax (RIVM/VLH), ir. J.F.M. Versteegh (RIVM/DMG)
Rijkswaterstaat (RWS)
Data on seawater and surface water from the main inland waters. C. Engeler, ing. M van der Weijden
The Netherlands Food and Consumer Product Safety Authority Nederlandse Voedsel en Waren Autoriteit (NVWA)
Data on foodstuffs.
drs. K. Zwaagstra, ing. G. Visser
RIKILT Wageningen UR
Data on milk and foodstuffs.
dr. G. C. Krijger, J.M. Weseman, ing. A. Vos van Avezathe, J. Verbunt
N.V. Elektriciteits-Produktiemaatschappij Zuid-Nederland (EPZ)
Data on environmental samples around the nuclear power plant at Borssele, measured by the Nuclear Research & Consultancy Group (NRG).
Contents
Summary—11
Samenvatting—15
1
Introduction—21
2
Airborne particles—23
2.1
Long-lived α and β activity—24
2.2
γ-emitting nuclides—27
2.3
Additional results following the incidents at Fukushima (Japan) and Budapest
(Hungary)—31
3
Deposition—35
3.1
Long-lived α and β activity—35
3.2
γ-emitting nuclides—40
3.3
Additional results following the incident at Fukushima (Japan)—43
4
National Radioactivity Monitoring Network—45
5
Surface water and seawater—51
5.1
Introduction—51
5.2
The results for surface water—55
5.3
The results for seawater—66
6
Water for human consumption—75
7
Milk—77
8
Food—79
8.1
Honey—79
8.2
Game and poultry—79
9
Grass—81
10
Nuclear power plant at Borssele—83
10.1
Air—84
10.2
Soil and grass—86
10.3
Water—86
11
Conclusions—89
Appendix A – Tables of results—91
Appendix B – Presentation of data—119
Appendix C – Glossary—121
Summary
The Dutch government is obliged to measure radioactivity in air, water and soil under the terms of the Euratom Treaty of 1957. In 2000, the European Union specified this treaty by means of recommendations describing the matrices to be measured (air dust, ambient dose, surface water, drinking water, milk and food) and the frequency of the measurements. The results should be published yearly. This report presents the results of radioactivity measurements made in the Dutch environment in 2011. The measurements were carried out by RIVM, RWS, RIKILT, NVWA and (tasked by N.V. EPZ) NRG.
In 2011 two radiological incidents occurred which could be detected in the Netherlands. In the weeks (from 18 March until 10 June) following the incident at the nuclear site at Fukushima (Japan) radionuclides originating from the incident (129Te, 129mTe, 132Te, 131I, 132I, 134Cs, 136Cs and 137Cs) were measured in
air, air dust and deposition. During week 45 (from 3 until 11 November) 131I
could be measured in air dust most probably as a result of an incident at the Institute of Isotopes, Budapest.
The levels of radionuclides measured following the Fukushima and Budapest incidents do not pose a threat to the public health. The absorbed dose as a result of inhalation of 131I following the Fukushima incident is less than
0.00001 mSv. To put this into perspective, the dose which a resident of the Netherlands receives annually is 2.4 mSv on average. The dose from other paths of exposure and from the other radionuclides measured following the Fukushima incident is much lower than the dose as a result of inhalation of 131I, and is
therefore insignificant, as is the dose as a result of 131I following the Budapest
incident.
During the Fukushima incident 23–41% of 131I in air was aerosol bound, 10-31%
was elementary I2 and 41–57% was organically bound (e.g. CH3I).
Yearly averaged activity concentrations in air dust were determined for gross α, gross β, 7Be, 137Cs and 210Pb.
The yearly total activity in deposition was determined for gross α, gross β, 3H, 7Be, 137Cs, 210Pb and 210Po. Gross α and gross β is the total activity of nuclides emitting
α and β radiation, respectively. The results are presented in Table S1 and are within the range of those in previous years, except for the yearly total activity in
deposition from 210Po (61.4 Bq∙m-2), which was the highest since 1993, although
this level does not pose a threat to public health.
The National Radioactivity Monitoring Network (NMR) was used to determine the activity concentrations of gross α and artificial β (β radiation emitted by man-made nuclides) in air dust. The difference between the NMR data and those mentioned above is due to the contribution of short-lived natural radionuclides (radon daughters). The yearly averaged gross α activity concentration in air dust was 4.1 Bq·m-3. The yearly average of the artificial β activity concentration did
not deviate significantly from zero. The NMR was also used to determine the ambient dose equivalent rate: the yearly averaged measured value was 73.1 nSv·h-1.
In surface water, the yearly averaged activity concentrations of gross α, residual β (gross β minus naturally occurring 40K), 3H, 90Sr and 226Ra were determined. The
yearly averaged activity concentrations of 60Co, 131I, 137Cs and 210Pb were
determined in suspended solids in surface water. In seawater, the yearly averaged activity concentrations were determined for gross α, residual β, 3H and 90Sr. The
yearly averaged activity concentrations of 137Cs and 210Pb were determined in
suspended solids in seawater. The results are presented in Table S1.
The gross α activity concentrations in the IJsselmeer, Noordzeekanaal, Nieuwe Waterweg, Rhine, Scheldt and Meuse exceeded the target value (100 mBqL-1) in
1 out of the 12, 9 out of the 12, 10 out of the 13, 1 out of the 13, 13 out of the 13 and 1 out of the 13 samples taken, respectively. The yearly averaged gross α activity concentrations in the Noordzeekanaal, Nieuwe Waterweg and Scheldt (165, 180 and 290 mBq∙L-1, respectively) were above the target value, but
within the range of those in previous years.
The residual β activity and 90Sr activity concentrations (both individual samples
and yearly average) were below the target value (200 mBqL-1 and 10 mBq∙L-1,
respectively).
The 3H activity concentrations in the Rhine, Scheldt and Meuse exceeded the target
value (10 BqL-1) in 2 out of the 13, 5 out of the 7 and 10 out of the 13 samples
taken, respectively. The yearly averaged 3H activity concentrations in the Scheldt
and Meuse (14.0 and 28.0 Bq∙L-1, respectively) were above the target value, but
within the range of those in previous years.
The 226Ra activity concentrations in the Nieuwe Waterweg and Scheldt exceeded
the target value (5 mBqL-1) in 1 out of the 7 and 5 out of the 7 samples taken,
respectively. The yearly averaged 226Ra activity concentration in the Scheldt
(7.3 mBq∙L-1) was above the target value, but within the range of those in
previous years.
The 60Co activity concentration in suspended solids in the Meuse exceeded the
target value (10 Bqkg-1) in 3 out of the 52 samples taken, but the yearly
averaged 60Co activity concentration was below the target value.
The 131I activity concentrations in suspended solids in the Noordzeekanaal and
Meuse exceeded the target value (20 Bqkg-1) in 6 out of the 6 and 16 out of the
52 samples taken, respectively. The yearly averaged 131I activity concentration in
the Meuse was below the target value. The yearly averaged 131I activity
concentration in the Noordzeekanaal (54 Bq∙kg-1) was higher than those in
previous years and exceeded the target value. The contribution of the Fukushima incident to the 131I activity concentration in suspended solids is
insignificant.
The 137Cs activity concentrations (both individual samples and yearly average) in
suspended solids in surface water were below the target value (40 Bq∙kg-1).
The 210Pb activity concentrations in the Nieuwe Waterweg, Rhine, Scheldt and
Meuse exceeded the target value (100 Bqkg-1) in 3 out of the 7, 4 out of the 6,
2 out of the 7 and 6 out of the 6 samples taken, respectively. The yearly averaged
210Pb activity concentrations in the Rhine and Meuse (104 and 165 Bq∙kg-1,
respectively) were above the target value, but within the range of those in previous years.
137Cs and 210Pb activity concentrations in suspended solids in seawater were within
the range of those in previous years.
Typical activities found in raw input water for drinking water production are
presented in Table S1. There is little potassium (and thus 40K) present in this water.
The gross α activity concentrations were equal or below 0.1 Bq·L-1. The gross β
activity concentrations were below 1.0 Bq·L-1 and the 3H activity concentrations
were below 100 Bq·L-1.
The results of the monitoring program for milk and mixed diet are presented in Table S1. Radioactivity was measured in well over 1,500 food products, of which 26 samples contained 137Cs. Eight samples of honey and eighteen samples of
game contained 137Cs. Only one sample was above the set limit of 600 Bqkg1. A
sample of boar (originating from the Netherlands in January 2011) contained 830 ± 26 Bqkg-1137Cs.
In addition to measurements on milk and food, RIKILT Wageningen UR
performed measurements on grass samples on two separate occasions in 2011. None of the grass samples taken during either campaign contained artificial radionuclides above the detection limits. Naturally occurring 40K was detected in
111 out of the 130 samples taken; the activity varied from 5 to 300 Bqm-2.
Data on environmental samples taken around the nuclear power plant at Borssele are presented in Table S2. The levels of 131I detected in air and grass (as an
equivalent of deposition) on 6 April are in range with the levels found by RIVM in air and deposition in the weeks following the Fukushima incident.
In 2011, the Netherlands complied with the Euratom recommendations on annually measuring radioactivity in the environment and in food.
Samenvatting
In het kader van het Euratom Verdrag uit 1957 is de Nederlandse overheid verplicht om radioactiviteitsgehalten te meten in de compartimenten lucht, water en bodem. In 2000 heeft de Europese Unie dit nauwkeuriger
gespecificeerd middels aanbevelingen. Hierin wordt in detail beschreven wat moet worden gemeten (luchtstof, de omgevingsdosis, oppervlaktewater, drinkwater, melk en voedsel) en met welke frequentie. De resultaten dienen jaarlijks te worden gerapporteerd. In dit rapport worden de resultaten gegeven van radioactiviteitsmetingen in het Nederlandse milieu in 2011. De metingen zijn verricht door RIVM, RWS, RIKILT, NVWA en (in opdracht van N.V. EPZ) NRG. In 2011 vonden twee radiologische incidenten plaats die in Nederland te meten waren. In de weken (van 18 maart tot en met 10 juni) na het incident bij de nucleaire installatie bij Fukushima (Japan) zijn in lucht, luchtstof en depositie radionucliden aangetroffen die afkomstig zijn van het incident (129Te, 129mTe, 132Te, 131I, 132I, 134Cs, 136Cs en 137Cs). In week 45 (3 tot en met 11 november)
werd 131I aangetroffen in luchtstof dat zeer waarschijnlijk afkomstig is van een
incident bij het Institute of Isotopes in Budapest.
De aangetoonde niveaus van radionucliden als gevolg van de incidenten te Fukushima en Budapest vormen geen risico voor de volksgezondheid. De opgelopen dosis van inhalatie van 131I als gevolg van het incident te Fukushima
is minder dan 0,00001 mSv. Om dit in perspectief te plaatsen: de dosis die een persoon in Nederland jaarlijks oploopt is 2,4 mSv. De doses als gevolg van andere blootstellingroutes en andere radionucliden zijn nog veel lager dan die als gevolg van inhalatie van 131I, en daarmee insignificant. Hetzelfde kan gezegd
worden voor de dosis van 131I als gevolg van het incident te Budapest.
Gedurende het incident te Fukushima was 23-41% van het 131I in lucht aerosol
gebonden, 10-31% was elementair I2 en 41-57% was organisch gebonden
(CH3I).
In luchtstof werd de jaargemiddelde activiteitsconcentratie bepaald van totaal-α, totaal-β, 7Be, 137Cs en 210Pb.
In depositie werd de totale jaarlijkse activiteit bepaald van totaal-α, totaal-β, 3H, 7Be, 137Cs, 210Pb en 210Po. Totaal-α respectievelijk totaal-β is de totale activiteit
aan α- dan wel β-straling uitzendende nucliden. De resultaten zijn weergegeven in Tabel S1 en vallen binnen het bereik van voorgaande jaren, met uitzondering van de depositie van 210Po (61,4 Bq·m-2) die het hoogst sinds 1993 is. Dit niveau
vormt geen gevaar voor de volksgezondheid.
Met het Nationaal Meetnet Radioactiviteit (NMR) werden activiteitsconcentraties bepaald in luchtstof voor totaal-α en kunstmatige β (β-straling uitgezonden door nucliden ontstaan door menselijk handelen). Het verschil tussen de
NMR-metingen en bovenstaande metingen wordt veroorzaakt door de bijdrage van kortlevende natuurlijke radionucliden (radondochters). Het jaargemiddelde voor de totaal-α-activiteitsconcentratie in luchtstof was 4,1 Bq·m-3. Het
jaargemiddelde voor de kunstmatige β-activiteitsconcentratie in luchtstof week niet significant af van nul. Met het NMR werd daarnaast het
omgevingsdosisequivalenttempo bepaald, de jaargemiddelde meetwaarde was 73,1 nSv h-1.
In oppervlaktewater werd de jaargemiddelde activiteitsconcentratie bepaald van totaal-α, rest-β (totaal-β minus het van nature aanwezige 40K), 3H, 90Sr en 226Ra
en de jaargemiddelde activiteitsconcentratie van 60Co, 131I, 137Cs en 210Pb in
zwevend stof. In zeewater werd de jaargemiddelde activiteitsconcentratie bepaald van totaal-α, rest-β, 3H en 90Sr. In zwevend stof in zeewater werd de
jaargemiddelde activiteitsconcentratie bepaald van 137Cs en 210Pb. De resultaten
zijn weergegeven in Tabel S1.
De totaal α-activiteitsconcentratie in het IJsselmeer, het Noordzeekanaal, de Nieuwe Waterweg, de Rijn, de Schelde en de Maas overschrijdt de streefwaarde (100 mBqL-1) in respectievelijk 1 van de 12, 9 van de 12, 10 van de 13, 1 van de
13, 13 van de 13 en 1 van de 13 genomen monsters. De jaargemiddelde totaal α-activiteitsconcentraties in het Noordzeekanaal, de Nieuwe Waterweg en de Schelde (respectievelijk 165, 180 en 290 mBq∙L-1) zijn boven de streefwaarde,
maar vallen binnen het bereik van voorgaande jaren.
De rest β-activiteitsconcentraties en de 90Sr-activiteitsconcentraties (van zowel
de individuele monsters als het jaargemiddelde) in oppervlaktewater zijn beneden de streefwaarde (respectievelijk 200 en 10 mBq∙L-1).
De 3H-activiteitsconcentratie in de Rijn, de Schelde en de Maas overschrijdt de
streefwaarde (10 BqL-1) in respectievelijk 2 van de 13, 5 van de 7 en 10 van de 13
genomen monsters. De jaargemiddelde 3H-activiteitsconcentraties in de Schelde en
de Maas (respectievelijk 14,0 en 28,0 BqL-1) zijn boven de streefwaarde, maar
vallen binnen het bereik van voorgaande jaren.
De 226Ra-activiteitsconcentratie in de Nieuwe Waterweg en de Schelde overschrijdt
de streefwaarde (5 mBqL-1) in respectievelijk 1 van de 7 en 5 van de 7 genomen
monsters. De jaargemiddelde 226Ra-activiteitsconcentratie in de Schelde
(7,3 mBq∙L-1) is boven de streefwaarde, maar valt binnen het bereik van
voorgaande jaren.
De 60Co-activiteitsconcentratie in zwevend stof in de Maas overschrijdt de
streefwaarde (10 Bqkg-1) in 3 van de 52 genomen monsters. De jaargemiddelde 60Co-activiteitsconcentratie is echter beneden de streefwaarde.
De 131I-activiteitsconcentratie in zwevend stof in het Noordzeekanaal en de Maas
overschrijdt de streefwaarde (20 Bqkg-1) in respectievelijk 6 van de 6 en
16 van de 52 genomen monsters. De jaargemiddelde 131I-activiteitsconcentratie in
de Maas is echter beneden de streefwaarde. De jaargemiddelde
131I-activiteitsconcentratie in het Noordzeekanaal (54 Bq∙kg-1) is hoger dan in
voorgaande jaren en overschrijdt de streefwaarde. De bijdrage van het incident in Fukushima aan de 131I-activiteitsconcentratie in zwevend stof is niet significant.
De 137Cs-activiteitsconcentraties (van zowel de individuele monsters als het
jaargemiddelde) in zwevend stof in oppervlaktewater zijn beneden de streefwaarde (40 Bq∙kg-1).
De 210Pb-activiteitsconcentratie in zwevend stof in de Nieuwe Waterweg, de Rijn, de
Schelde en de Maas overschrijdt de streefwaarde (100 Bqkg-1) in respectievelijk
3 van de 7, 4 van de 6, 2 van de 7 en 6 van de 6 genomen monsters. De jaargemiddelde 210Pb-activiteitsconcentraties in de Rijn en de Maas
(respectievelijk 104 en 165 Bq∙kg-1) zijn boven de streefwaarde, maar vallen
De jaargemiddelde totaal α-, rest β-, 3H- en 90Sr-activiteitsconcentraties in
zeewater vallen binnen het bereik van voorgaande jaren. De jaargemiddelde
137Cs- en 210Pb-activiteitsconcentraties in zwevend stof in zeewater vallen binnen
het bereik van voorgaande jaren.
Gangbare activiteitsconcentraties die in ruw water voor de drinkwaterproductie gevonden worden, zijn weergegeven in Tabel S1. In dit water is weinig kalium, en dus 40K, aanwezig. In 2011 waren de totaal α-activiteitsconcentraties gelijk
aan of lager dan 0,1 BqL-1. De totaal β-activiteitsconcentraties waren lager dan
1,0 BqL-1 en de 3H-activiteitsconcentraties waren lager dan 100 BqL-1.
De resultaten van het meetprogramma voor melk en voedsel zijn weergegeven in Tabel S1. Radioactiviteit werd geanalyseerd in meer dan 1500 voedselprodukten waarvan 26 monsters 137Cs bevatte. Acht monsters honing en 18 monsters wild
bevatte 137Cs. Slechts één monster was boven de limiet van 600 Bqkg-1. Een
monster wild zwijn (afkomstig uit Nederland van januari 2011) bevatte 830 ± 26 Bqkg-1137Cs.
Naast metingen in melk en voedsel heeft RIKILT Wageningen UR in 2011 metingen in gras uitgevoerd in twee aparte campagnes. In de grasmonsters genomen tijdens beide campagnes werden geen kunstmatige radionucliden boven de detectielimieten aangetroffen. Natuurlijk voorkomend 40K werd aan
getroffen in 111 van de 130 grasmonsters, waarbij de activiteit varieerde van 5 tot 300 Bqm-2.
Gegevens betreffende milieumonsters genomen rondom de kerncentrale
Borssele zijn weergegeven in Tabel S2. De gemeten niveaus 131I in lucht en gras
(als een equivalent van depositie) op 6 april vallen binnen het bereik van de niveaus in lucht en depositie gemeten door het RIVM in de weken na het Fukushima incident.
Nederland voldeed in 2011 aan alle Europese aanbevelingen ten aanzien van de jaarlijkse radioactiviteitsmetingen in het milieu en in voedsel.
Table S1: Summary of the results of the Dutch monitoring program in 2011
Matrix Parameter Locations Values Frequency
(per year)
Air dust (1) Gross α 1 0.029 mBq·m-3 52
Gross β 1 0.494 mBq·m-3 52 7Be 1 3.820 mBq·m-3 52 137Cs 1 0.00472 mBq·m-3 (2) 52 210Pb 1 0.496 mBq·m-3 52 Deposition (2) Gross α 1 45.0 Bq·m-2 12 Gross β 1 123 Bq·m-2 12 3H 1 332–1,540 Bq·m-2 (3) 12 7Be 1 1,320 Bq·m-2 52 137Cs 1 0.5–1.5 Bq·m-2 (3) 52 210Pb 1 104 Bq·m-2 52 210Po 1 61.4 Bq·m-2 12
Surface water (1) Gross α 6 12–514 mBq·L-1 12–13 (4)
Residual β 6 < 1–192 mBq·L-1 12–13 (4) 3H 6 784 – 55,100 mBq·L-1 6–13 (4) 90Sr 3 < 1–6 mBq·L-1 6–7 (4) 226Ra 4 1–13.6 mBq·L-1 6–7 (4) Suspended solids 60Co 6 < 1–23.7 Bq·kg-1 6–52 (4) in surface water (1) 131I 6 < 1–114 Bq·kg-1 6–52 (4) 137Cs 6 1–16.1 Bq·kg-1 6–52 (4) 210Pb 4 60.1–253 Bq·kg-1 6–7 (4) Seawater (1) Gross α 8 70–1,080 mBq·L-1 4–13 (4) Residual β 8 47–226 mBq·L-1 4–13 (4) 3H 8 108–5,870 mBq·L-1 4–13 (4) 90Sr 4 < 1–7 mBq·L-1 4–13 (4) Suspended solids 137Cs 4 < 1–8.41 Bq·kg-1 3–4 (4) in seawater (1) 210Pb 4 56.3–127 Bq·kg-1 3–4 (4)
Drinking water (1) Gross α 185 < 0.1 Bq·L-1 355 (5)
Gross β 191 < 0.1 Bq·L-1 414 (5) Residual β 174 < 0.2 Bq·L-1 377 (5) 3H 188 < 4.2 Bq·L-1 400 (5) Milk (1) 40K 24 59.3 Bq·L-1 891 (5) 60Co 24 < 1.4 Bq·L-1 891 (5) 90Sr 24 < 0.6 Bq·L-1 50 (5) 131I 24 < 0.6 Bq·L-1 891 (5) 134Cs 24 < 0.6 Bq·L-1 891 (5) 137Cs 24 < 0.5 Bq·L-1 891 (5)
Table S1: Continued
Matrix Parameter Locations Values Frequency
(per year) Food (6, 7, 8)
Grain and grain products 137Cs - < 10 Bq·kg-1 70 (0) (9)
Vegetables 137Cs - < 10 Bq·kg-1 130 (0) (9)
Fruit and fruit products 137Cs - < 10 Bq·kg-1 57 (0) (9)
Milk and dairy products 137Cs - < 10 Bq·kg-1 44 (0) (9)
Meat and meat products 137Cs - < 10 Bq·kg-1 61 (0) (9)
Game and poultry 137Cs - < 10 Bq·kg-1 35 (0) (9)
Salads 137Cs - < 10 Bq·kg-1 30 (0) (9)
Oil and butter 137Cs - < 10 Bq·kg-1 36 (0) (9)
Honey 137Cs - 15–209 Bq·kg-1 91 (8) (9)
Food (6, 7, 10)
Vegetables 137Cs - < 0.5 Bq·kg-1 50 (0) (9)
Meat and meat products 137Cs - < 0.5 Bq·kg-1 667 (0) (9)
Game and poultry 137Cs - 3.3–830 Bq·kg-1 196 (18) (9)
Eggs 137Cs - < 0.5 Bq·kg-1 125 (0) (9)
Fish and seafood products
137Cs - < 0.5 Bq·kg-1 151 (0) (9)
Mixed diet 90Sr - < 5 Bq·kg-1 41 (0) (9)
(1) Yearly average.
(2) Excluding the Fukushima period (18 March until 10 June 2011) the yearly average for 2011 was 0.000445 mBq·m-3. (2) Yearly total.
(3) A 68% confidence range. (4) Frequency depends on location.
(5) Total number of samples taken combined over all locations. (6) Given range represents values of individual (positive) samples.
(7) Samples were analysed for 134Cs as well, but it was below the detection limit. (8) As measured by the Netherlands Food and Consumer Product Safety Authority. (9) Total number of samples taken. Number of positive samples in brackets. (10) As measured by RIKILT Wageningen UR.
Table S2: Summary of the results of the monitoring program in the vicinity of the nuclear power plant at Borssele in 2011
Matrix Parameter Locations Values (1) Frequency
(per year)
Air dust Gross α 5 0.001–0.295 mBq·m-3 12
Gross β 5 0.131–0.98 mBq·m-3 12 60Co 5 (2) < 0.016–< 0.08 mBq·m-3 12 131I el (3) 5 (2) < 0.1–0.172 mBq·m-3 12 131I or (3) 5 (2) < 0.2–0.42 mBq·m-3 12 137Cs 5 (2) < 0.014–< 0.06 mBq·m-3 12 Nat. (4) 5 (2) 0.9–2.3 mBq·m-3 12 Grass 60Co 5 (2) < 1–< 5 Bq·kg-1 12 131I 5 (2) < 0.9–10.5 Bq·kg-1 12 137Cs 5 (2) < 0.9–< 4 Bq·kg-1 12 Soil 54Mn 4 < 0.2 Bq·kg-1 1 60Co 4 < 0.2 Bq·kg-1 1 134Cs 4 < 0.2 Bq·kg-1 1 137Cs 4 0.72–1.95 Bq·kg-1 1 Water Residual β 4 0.036–0.141 Bq·L-1 12 3H 4 7.1–9.9 Bq·L-1 12 Suspended solids Gross β 4 0.3–1.64 kBq·kg-1 12 Seaweed 60Co 4 (2) < 2–< 4 Bq·kg-1 12 131I 4 (2) 0.9–< 3 Bq·kg-1 12 137Cs 4 (2) < 2–< 3 Bq·kg-1 12 Sediment 60Co 4 (2) < 0.3–< 0.4 Bq·kg-1 12 131I 4 (2) < 0.2–< 0.4 Bq·kg-1 12 137Cs 4 (2) 0.34–2.28 Bq·kg-1 12
(1) Given range represents values of individual samples.
(2) Analysis was performed on a combined sample of the monthly samples in all four or five locations. (3) Elemental respectively organically bound 131I.
1
Introduction
Levels of radioactive nuclides of natural origin, such as 40K and daughters from
the uranium and thorium series may be enhanced as a result of human activities (e.g. emissions from factories processing ores). Man-made radionuclides are found in the environment as a result of, for example, nuclear weapons tests or discharges from nuclear installations. Monitoring radiation in the environment provides knowledge about radiation levels under normal circumstances and enables the confirmation of abnormal levels. This report presents the results of radioactivity measurements made in the environment in the Netherlands. The aims of this report are threefold: 1) to present a survey of radioactivity
measurements made in the Dutch environment under normal circumstances (in 2011 it was extended with measurements following two radiological incidents abroad); 2) to determine the compliance of monitoring programs in the
Netherlands with the EU recommendation and to report possible omissions; 3) to constitute the Dutch national report on radioactivity in the environment to the EU and to other Member States.
In the chapters, the results will be presented in graphs and tables. More detailed tables are presented in Appendix A. Chapters 2 to 8 are subdivided according to the structure of the Recommendation on the Application of Article 36 of the Euratom Treaty [1] and give the results of measurements for various
environmental compartments. Chapter 9 is an additional chapter for 2011 and contains data on measurements on grass samples. Chapter 10 contains data on environmental samples taken around the nuclear power plant at Borssele. General conclusions from Chapters 1 to 10 are presented in Chapter 11. A glossary of frequently occurring terms is given in Appendix C.
2
Airborne particles
Table 2.1 describes the monitoring program for determining radioactive nuclides in air dust. The sampling was done on the RIVM premises in Bilthoven,
Netherlands. Air dust samples for the measurement of gross α, gross β and γ-emitters were collected weekly with a high volume sampler. In 2011 the former high volume sampler, as described in [2], was replaced by a Snow White high volume sampler from Senya Ltd.
The change in equipment coincided with a change in the filter type (polypropylene G-3 instead of glass fibre GF10), the volume sampled (125,000 m3 instead of
50,000 m3) and the sampling height (on top of a three-storey building instead of
1.8 m above ground level). Samples were collected weekly according to a standard procedure [3].
The collection efficiency of the filter type G-3 was determined to be 96 ± 1% with a flow rate of approximately 760 Nm3h-1 based on 7Be and 210Pb results
[4]. The results presented in this chapter are corrected for this collection efficiency.
After sampling, the G-3 filters were dried and weighed to determine the dust load. Then a sub-sample was taken from the filter for the determination of gross α and gross β according to a standard procedure [5]. The remainder of the filter was folded into a 250 ml container and measured on a coaxial detector (3 days delay time, 100,000 seconds counting time) to determine volatile γ-emitters according to standard procedures [5, 6].
Following this measurement the filter was dry-ashed at 450 ºC for 16 h. Calcium sulphate was added to the resulting residue to achieve a sample of 4 g, which was homogenised and transferred into a polyethylene vial. Measurements were carried out on a coaxial well-type detector (10 days delay time, 178,200 seconds counting time) according to standard procedures [5, 6].
The data from 1991 to 2004 were reanalysed to determine the yearly averages by the method described in Appendix B [7]. This can lead to small differences between the data presented in this report and the data reported prior to 2005. Table 2.1: Monitoring program for the determination of radioactive nuclides in air dust; differences between the sampling procedures until 2011 and from 2011 onwards
Matrix Location Parameter Sample Sample Analysis
period volume frequency Sampling with former HVS on a glass fibre filter (Schleicher & Schuell GF10) until 2011 Air dust Bilthoven gross α, gross β week 500 m3 (1) weekly
Bilthoven γ-emitters (2) week 50,000 m3 weekly
Sampling with Snow White HVS on a polypropylene filter (G-3) from 2011 onwards Air dust Bilthoven gross α, gross β week 925 m3(3) weekly
Bilthoven γ-emitters (2) week 125,000 m3 weekly
(1) A sub-sample of 1% from the filter through which about 50,000 m3 is sampled. (2) γ-spectroscopic analysis of specific γ-emitting nuclides.
Paragraphs 2.1 and 2.2 present data on radioactive nuclides measured regularly. Data on additional radioactive nuclides measured following the incidents at Fukushima (Japan) and Budapest (Hungary) are presented in paragraph 2.3.
2.1 Long-lived α and β activity
The weekly results of gross α and β activity concentrations in air dust are given in Figure 2.1 and Table A1 (see Appendix A). Due to large uncertainties caused by variations in dust thickness on the filters, gross α activity concentrations in air dust should be regarded as indicative values [5]. The period between sampling and analysis was five to ten days, which is long compared with the decay time of the short-lived decay products of 222Rn and 220Rn. This is done to
ensure that these naturally occurring decay products do not contribute to the measured α and β activity concentrations. The frequency distributions of gross α activity and gross β activity concentrations in air dust are given in Figures 2.2 and 2.3, respectively.
The yearly averages of the gross α and β activity concentrations of long-lived nuclides in 2011 were within the range of the results from the period
1992-2010, as illustrated in Figure 2.4. Since 2007, a new (more realistic) calibration for gross α has been implemented. The new calibration factor is 1.4 times higher than the one used in previous years, which results in lower reported gross α activities.
A change in equipment with a coinciding change in filter type resulted in a change in the reported gross α (-24%) and gross β (-15%) results for which no correction is applied [4]. A possible explanation is a deeper permeation of the air dust in the filter type G-3 than in the filter type GF10. This results in a difference in self-absorption of the α and β particles measured, i.e. lower gross α and gross β results.
0.0 0.5 1.0 1.5 2.0 1 4 7 10 13 16 19 22 25 28 31 34 37 40 43 46 49 52 a c tiv it y c o n c e n tr a tio n (m B q /m ³) week in 2011
gross alpha gross beta
Figure 2.1: Weekly averaged gross α and β activity concentrations of long-lived nuclides in air dust sampled at RIVM
0 5 10 15 20 25 0.00-0.02 0.02-0.04 0.04-0.06 0.06-0.08 0.08-0.10 0.10-0.12 0.12-0.14 0.14-0.16 nu m b er o f w eeks
gross alpha activity concentration (mBq/m³)
Figure 2.2: Frequency distribution of gross α activity concentration of long-lived nuclides in air dust collected weekly in 2011
The yearly average was 0.029 (SD=0.017) mBqm-3. SD is the standard deviation and illustrates the variation in weekly averages during the year.
0 5 10 15 20 25 30 35 0.0-0.2 0.2-0.4 0.4-0.6 0.6-0.8 0.8-1.0 1.0-1.2 1.2-1.4 1.4-1.6 1.6-1.8 1.8-2.0 n u m b er of w eeks
gross beta activity concentration (mBq/m³)
Figure 2.3: Frequency distribution of gross β activity concentration of long-lived nuclides in air dust collected weekly in 2011
The yearly average was 0.494 0.008 (SD=0.4) mBqm-3.
0.0 0.2 0.4 0.6 0.8 1992 1993 1994 1995 1996 1997 1998 1999 2000 2001 2002 2003 2004 2005 2006 2007 2008 2009 2010 2011 act iv it y co nce n tr at io n ( m B q /m ³) year
gross alpha gross beta
Figure 2.4: Yearly averaged gross α and gross β activity concentrations of long-lived nuclides in air dust at RIVM in 1992–2011
2.2 γ-emitting nuclides
Several nuclides were detected regularly, 7Be (52 times), 210Pb (52 times) and 137Cs (43 times). The results are presented in Table A3 and Figures 2.5, 2.6 and
2.7. The detection limits for the nuclides considered in the gammaspectroscopic analysis of the HVS samples are given in Table A2. Between 2000 and the middle of 2009, the detection limit of 137Cs was higher than from 1991 to 1999
due to a different detector set-up. Since July 2009, a new detector set-up has been used, which results in lower detection limits.
The behaviour of 7Be in the atmosphere has been studied worldwide [8, 9, 10,
11, 12, 13, 14]. Natural 7Be (half-life of 53.3 days) is formed by spallation
reactions of cosmogenic radiation with atmospheric nuclei such as carbon, nitrogen and oxygen resulting in the formation of BeO or Be(OH)2 molecules.
Approximately 70% of 7Be is produced in the stratosphere and the remaining
30% is produced in the troposphere. It has an estimated residence time of about one year in the stratosphere and about six weeks in the troposphere. Most of the 7Be produced in the stratosphere does not reach the troposphere, except
during spring when seasonal thinning of the tropopause takes place at mid-latitudes, resulting in air exchange between the stratosphere and the troposphere.
In the troposphere, 7Be rapidly associates mainly with submicron-sized aerosol
particles. Gravitational settling and precipitation processes accomplish transfer to the earth’s surface. Seasonal variations in the concentration of 7Be in surface
air are influenced by the following main atmospheric processes: wet and dry deposition, mass exchange between stratosphere and troposphere, vertical transport in the troposphere and horizontal transport of air masses from the subtropics and mid-latitudes to the tropics and polar regions.
The red line in Figure 2.5 shows the seasonal variation of the 7Be activity
concentration, with peaks during the spring and summer periods, reflecting the seasonal variations in the transport rate of air from stratosphere to troposphere. Figure 2.5 further shows the influence of the solar cycle. The maxima at 1997 and 2007–2009 and the minimum at 2000–2002 are consistent with the solar minima (measured by radio flux and sunspot count) of 1996–1997 and
2008-2009 and the solar maximum of 2000–2002 [15]. In the summer of 1991 two severe geomagnetic storms caused a significant worldwide disturbance of the earth’s geomagnetic field. This resulted in a considerable decrease in cosmogenic radiation, unprecedented in at least the previous four decades [16]. The absence of a 1991 summer peak in the 7Be activity concentration can be
explained by the decrease in cosmogenic radiation. The concentrations found for
7Be in 2010 fit into the pattern described above.
The nuclide 137Cs (half-life of 30.2 years) is of anthropogenic origin. Until 2011
the two main sources of 137Cs in the environment were nuclear weapons tests
and the Chernobyl accident, and resuspension of previously deposited activity was the main source of airborne 137Cs activity.
0 2000 4000 6000 8000 10000 7B e -act iv it y conce n tr at io n ( µ B q /m ³) year 1993 1995 1997 1999 2001 1991 2003 2005 2007 2009 2011
Figure 2.5: Weekly averaged 7Be activity concentrations (blue) in air dust at
RIVM in 1991–2011
The red line is a moving average of 13 weeks. The yearly average for 2011 was 3820 50 (SD=1200) μBqm-3.
Figure 2.6 shows a peak during May 1992. During the same period several wildfires occurred near the Chernobyl area [17] and the level of airborne 137Cs
activity increased ten times in the 30 km exclusion zone around Chernobyl. It is plausible that the airborne 137Cs was transported to Western Europe by the
weather conditions in the same period (dry with a strong easterly wind [18]). On 29 May 1998, an incident occurred at Algeciras (Spain): an iron foundry melted a 137Cs source concealed in scrap metal [19]. As a result, elevated levels of
airborne 137Cs activity were measured in France, Germany, Italy and Switzerland
during late May and early June. Figure 2.6 shows a slightly elevated level of
137Cs activity (second peak) around the same period (29 May until 5 June 1998).
Such slightly elevated levels are not uncommon, as can be seen in Figure 2.6. These elevations may be related to resuspension of previously deposited dust, especially during a strong wind from the continent [19]. From 18 March until 10June 2011, elevated levels of 137Cs activity were measured as a result of the
incident at Fukushima (Japan). More detailed results on 137Cs during that period
are presented in paragraph 2.3.
The primary source of atmospheric 210Pb (half-life of 22.3 years) is the decay of 222Rn exhaled from continental surfaces. Therefore, the atmospheric
concentration of 210Pb over continental areas is generally higher than that over
oceanic areas (222Rn exhalation from the ocean is 1,000 times less than that
from the continents). The reported reference value of 210Pb in air dust is
500 μBqm-3 [20]. In the atmosphere this radionuclide is predominantly
associated with submicron-sized aerosols [21, 22]. The mean aerosol (carrying
0 4 8 12 16 137 C s -act iv it y co ncen tr a ti o n (µ B q /m ³) year 1995 1997 1999 2001 1991 1993 2003 2005 2007 2009 2011 54
Figure 2.6: Weekly averaged 137Cs activity concentrations in air dust at RIVM in
1991–2011
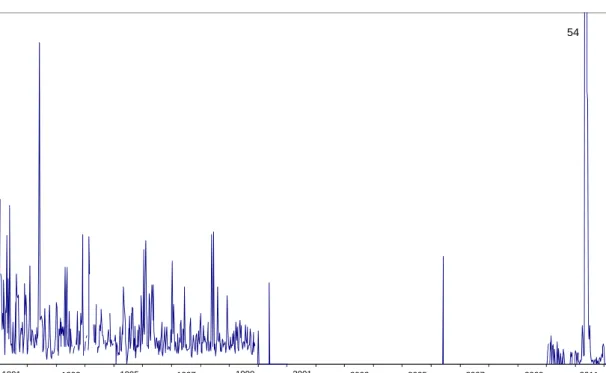
Nine out of the 52 measurements were below the detection limit in 2011. The yearly average for 2011 was 4.72 0.18 (SD=12) μBqm-3,including the period following the Fukushima incident. Excluding the Fukushima period (18 March until 10 June 2011) the yearly average for 2011 was 0.445 0.011(SD=0.5) μBqm-3. Between 2000 and the middle of 2009, the detection limit was higher than during 1991–1999, due to a different detector set-up. Since July 2009, a new detector set-up has been used, which results in lower detection limits (see Table A2).
Other sources of 210Pb in air dust are volcanic activity and industrial emissions
[24, 25, 26, 27, 28, 29]. Examples of industrial emissions are discharges from power plants using fossil fuels, discharges from fertiliser and phosphorus industries, and exhaust gases from traffic. In the Netherlands, emissions by power plants are only of local importance regarding 210Pb deposition. Emissions
by the phosphorus industry contribute a negligible part of the yearly total 210Pb
deposition [29]. Volcanic eruptions bring uranium decay products into the atmosphere, such as 226Ra, 222Rn, 210Pb and 210Po. Beks et al. [26] estimate that
volcanoes contribute 60 TBqyear-1 to the atmospheric 210Pb stock. If the
volcanic deposition were evenly distributed worldwide, the contribution to the yearly total 210Pb deposition would be negligible.
Unusual 210Pb values might be explained by natural phenomena such as an
explosive volcanic eruption, Saharan dust [30, 31, 32] or resuspension of (local) dust. Normally there is a good correlation between 210Pb and gross β activity
concentrations, as was the case in 2011 (Figure 2.8). The weekly averaged 210Pb
activity concentrations in 2011 were within the range of those found in previous years (Figure 2.7).
0 500 1000 1500 2000 2500 3000 3500 21 0P b -act iv it y con c e n tr a ti o n ( µ B q /m ³) year 1993 1995 1997 1999 2001 1991 2003 2005 2007 2009 2011
Figure 2.7: Weekly averaged 210Pb activity concentrations in air dust at RIVM in
1991–2011
The yearly average for 2011 was 496 9 (SD=500) μBqm-3.
0.0 0.5 1.0 1.5 2.0 2.5 1 4 7 10 13 16 19 22 25 28 31 34 37 40 43 46 49 52 a c tiv it y c o n c e n tr a tio n (m B q /m ³) week in 2011 gross beta Pb-210
Figure 2.8: Figure illustrating the correlation between weekly averaged gross β and 210Pb activity concentrations in air dust at RIVM
2.3 Additional results following the incidents at Fukushima (Japan) and Budapest (Hungary)
In the weeks (from 18 March until 10 June) following the incident at the nuclear site at Fukushima (Japan), sampling was carried out with the Snow White highvolume sampler with a sampling period of 3 days to 1 week. In addition, sampling was carried out with the former high volume sampler [2] with a sampling period of 24 hours (when possible) and in a measuring vehicle with a three-stage sampler (glass fibre filter, carbon filter and carbon filter cartridge) with a sampling period of 3 days and a flow rate of 4.5 m3h-1. A more detailed
description of the measurements following the incident at Fukushima is given elsewhere [33].
During week 45 (from 3 until 11 November) 131I was measured in air dust
sampled with the Snow White high-volume sampler. According to the Hungarian Atomic Energy Authority (HAEA), the source of the 131I detected in Europe was
probably a release to the atmosphere from the Institute of Isotopes, Budapest. The Institute of Isotopes produces radioisotopes for healthcare, research and industrial applications. According to the HAEA, the release occurred from 8 September to 16 November 2011 [34].
The additional results of both incidents (other than those presented in
paragraph 2.2) are presented in Tables A4 to A7 and in case of the Fukushima incident also in Figures 2.9 to 2.12. The results presented in this report can differ from those presented in [33]. The results presented here are corrected for coincidence and collection efficiency (necessary only for the Snow White high volume sampler), unlike those presented in [33]. In addition, the results of extra samples and extra measurements (using a well-type detector) are presented in this report in comparison with those presented in [33].
Figure 2.9: Activity concentrations of γ-emitters in air dust sampled with the Snow White high volume sampler and measured directly as a folded filter on a coaxial Ge detector 0.00 0.01 0.02 0.03 0.04 0.05 0.06 0.07 12 13A 13B 14 15 16 17 18 19 20 21 22 23 act iv it y conce n tr at io n ( m Bq/ m ³) week in 2011 Cs-134 Cs-136 Cs-137 Te-129m Te-129
Figure 2.10: Activity concentrations of γ-emitters in air dust sampled with the Snow White high volume sampler and measured after several days as ash residue on a well-type Ge detector
0.0 0.1 0.2 0.3 0.4 0.5 0.6 0.7 0.8 0.00 0.01 0.02 0.03 0.04 0.05 0.06 0.07 12 13A 13B 14 15 16 17 18 19 20 21 22 23 131 I-act iv it y co ncen tr at io n ( m B q /m ³) act iv it y co nce n tr at io n ( m B q /m ³) week in 2011
0.0 0.2 0.4 0.6 0.8 1.0 1.2 1.4 0.00 0.02 0.04 0.06 0.08 0.10 0.12 0.14 0.16 0.18
12A 12C 13B 13D 13F 14A 14C 14E 14G 15B 15D 15F 16A 16C 17A 18A 19B
131 I-a c ti v ity c o n c e n tr a tio n (m B q /m ³) a c ti v ity c o n c e n tr a tio n (m B q /m ³) part of week in 2011
Cs-134 Cs-136 Cs-137 Te-129 Te-132 I-132 I-131
Figure 2.11: Activity concentrations of γ-emitters in air dust sampled with the former high volume sampler and measured directly as a folded filter on a coaxial Ge detector 0.00 0.20 0.40 0.60 0.80 1.00 1.20
13A 13B 13C 14A 14B 15A 15B
131 I-act iv it y co ncen tr at io n ( m B q /m ³) part of week in 2011 aerosol elementary organic
Figure 2.12: 131I activity concentrations in air sampled with a three-stage
sampler and measured on a coaxial Ge detector
131I is either aerosol bound, elementary I
The segmentation of the different forms of 131I can be deduced from Figure 2.12
and Table A6. The levels of radionuclides measured following the Fukushima incident do not pose a threat to public health, as can be seen by the following calculation.
The most relevant path of exposure during the Fukushima incident was the inhalation of 131I. Tables A4 and A7 show that 131I was measured from 23 March
to 13 May. As shown in Table A7, the average daily 131I activity concentration in
air dust is 240 μBqm-3 during that period. Table A6 shows that on average 29%
of 131I was aerosol bound; thus the combined (for all iodine fractions) average
daily 131I activity concentration inhaled during that period was 820 μBqm-3.
Assuming that an average person inhales air at a rate of 1.2 m3h-1 and the
inhaled 131I is totally absorbed by the lungs, during the period of 51 days (from
23 March to 13 May) that person will have absorbed 1 Bq of 131I. To convert this
into the absorbed dose one must use dose conversion factors [35]. By applying the relevant dose conversion factor for 131I, the absorbed dose is less than
0.00001 mSv. To put this into perspective, the dose which a resident of the Netherlands receives annually is 2.4 mSv on average [36]. The dose from other paths of exposure and from the other radionuclides measured following the Fukushima incident are much lower than the dose as a result of inhalation of
131I, and is therefore insignificant.
The measured level of 131I following the incident at Budapest is even lower than
the level following the Fukushima incident and therefore does not pose a threat to public health.
3
Deposition
Table 3.1 describes the monitoring program for determining radioactive nuclides in deposition. Sampling was done on the RIVM premises in Bilthoven. Samples were collected weekly for γ-emitters and monthly for gross α, gross β, 3H and 210Po according to a standard procedure [37].
The weekly samples for γ-emitters and monthly samples for gross α and gross β were acidified with sulphuric acid and evaporated. The resulting sulphate residue was analysed according to standard procedures [6, 38, 39].
The monthly samples for 3H were made alkaline by the addition of sodium
carbonate and then distilled. An 10 ml aliquot of the distillate was mixed with an equal amount of scintillation solution (Ultima Gold LLT) in a plastic counting vial and then counted on an anti-coincidence liquid scintillation counter for
1,000 minutes per sample.
The monthly samples for 210Po were reduced in volume by evaporation. The
resulting solution was analysed according to a standard procedure [40], with a minor difference. The ingrowth of 210Po from 210Pb was derived from the 210Pb
results from the weekly samples for y-emitters instead of the procedure described in [40].
The data from 1993 to 2004 were reanalysed to determine the yearly totals by the method described in Appendix B [7]. This can lead to small differences between data presented in this report and data reported prior to 2005.
Table 3.1: Monitoring program for the determination of radioactive nuclides in deposition
Matrix Location Parameter Sample Sample Analysis
period volume Frequency
Deposition Bilthoven γ-emitters (1) week variable weekly
Bilthoven gross α, gross β, and 210Po month variable monthly
Bilthoven 3H month variable quarterly
(1) γ-spectroscopic analysis of specific γ-emitting nuclides.
3.1 Long-lived α and β activity
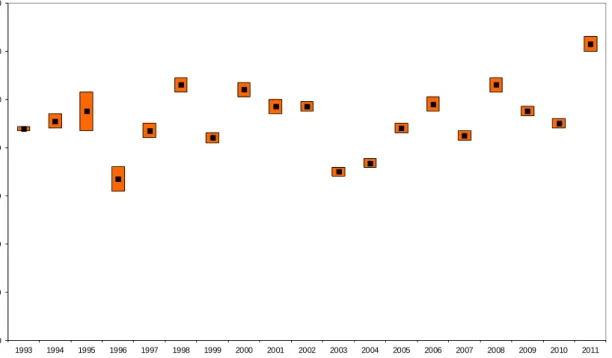
The monthly deposited gross α and gross β activities of long-lived nuclides are given in Figure 3.1, Figure 3.3 and Table A8. The yearly total deposition of gross α and gross β were 45.0 ± 1.5 and 123 ± 3 Bq∙m-2, respectively. These
values are within the range of those from previous years, as illustrated in Figure 3.2, Figure 3.4 and Table A9.
The monthly deposition of 3H is given in Table A8. In 2010, the yearly total
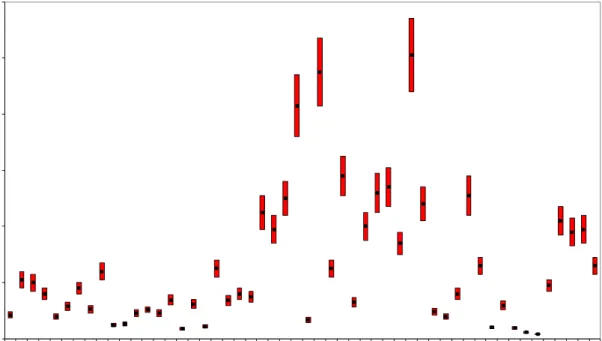
deposition of 3H ranged between 332 and 1,540 Bq·m-2 (68% confidence level).
The yearly total consisted of 12 samples, and 8 of the 12 measurements were below the detection limit. Therefore, detection limits were used for the
contribution to the yearly total. The range in 2011 did not differ significantly from those measured since 1993, as illustrated in Figure 3.5 and Table A9. Until 1998, samples were electrolytically enriched before counting, which resulted in a much lower detection limit than after 1997.
0.0 2.0 4.0 6.0 8.0 10.0 12.0
Jan Feb Mar Apr May Jun Jul Aug Sep Oct Nov Dec
gr oss al p h a act iv it y i n d e posi ti o n ( B q/ m ²) month in 2011
Figure 3.1: Monthly deposited gross α activity of long-lived nuclides at RIVM
Monthly totals (black dots) are shown with a 68% confidence range (coloured bars).
0 10 20 30 40 50 60 1993 1994 1995 1996 1997 1998 1999 2000 2001 2002 2003 2004 2005 2006 2007 2008 2009 2010 2011 g ro ss al p h a act iv it y i n depo si ti on ( B q /m ²) year
Figure 3.2: Yearly gross α activity of long-lived nuclides deposited at RIVM from 1993 to 2011
Yearly totals (black dots) are shown with a 68% confidence range (coloured bars). Only the 68% confidence range is shown if the yearly result is made up of at least one detection limit.
0 5 10 15 20 25
Jan Feb Mar Apr May Jun Jul Aug Sep Oct Nov Dec
gr oss bet a act iv it y i n dep o si ti o n ( B q /m ²) month in 2011
Figure 3.3: Monthly deposited gross β activity of long-lived nuclides at RIVM
Monthly totals (black dots) are shown with a 68% confidence range (coloured bars).
0 20 40 60 80 100 120 140 1993 1994 1995 1996 1997 1998 1999 2000 2001 2002 2003 2004 2005 2006 2007 2008 2009 2010 2011 gr oss b e ta ac ti vi ty in depo si ti on ( B q /m ²) year
Figure 3.4: Yearly gross β activity of long-lived nuclides deposited at RIVM from 1993 to 2011
0 500 1000 1500 2000 2500 3000 1993 1994 1995 1996 1997 1998 1999 2000 2001 2002 2003 2004 2005 2006 2007 2008 2009 2010 2011 3H -act iv it y i n dep o si ti o n ( B q /m ²) year
Figure 3.5: Yearly deposition of 3H at RIVM from 1993 to 2011
Yearly totals (black dots) are shown with a 68% confidence range (coloured bars). Only
the 68% confidence range is shown if the yearly result is made up of at least one
detection limit. 0.0 2.0 4.0 6.0 8.0 10.0 12.0
Jan Feb Mar Apr May Jun Jul Aug Sep Oct Nov Dec
210 P o -act iv it y i n d e po s it ion ( B q /m ²) month in 2011
Figure 3.6: Monthly deposited 210Po activity at RIVM
0 10 20 30 40 50 60 70 1993 1994 1995 1996 1997 1998 1999 2000 2001 2002 2003 2004 2005 2006 2007 2008 2009 2010 2011 210 P o -act iv it y i n depo si ti on ( B q/ m ²) year
Figure 3.7: Yearly 210Po activity deposited at RIVM from 1993 to 2011
Yearly totals (black dots) are shown with a 68% confidence range (coloured bars). Only the 68% confidence range is shown if the yearly result is made up of at least one detection limit. 0 2 4 6 8 10 12
Jan Feb Mar Apr May Jun Jul Aug Sep Oct Nov Dec
act iv it y i n dep o si ti o n ( B q/ m 2) month in 2011
gross alpha Po-210
Figure 3.8: Figure illustrating the correlation between monthly total gross α and
The monthly α spectroscopy results for 210Po are given in Figure 3.6 and
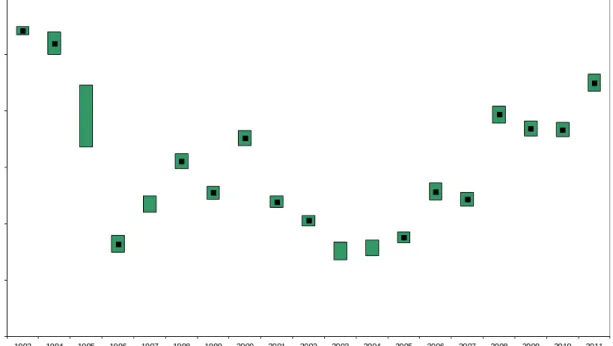
Table A10. The results for previous years are given in Figure 3.7 and Table A11. The yearly total deposition of 210Po in 2011 was 61.4 ± 1.0 Bq∙m-2 (68%
confidence level). This is the highest yearly total since 1993, but this level does not pose a threat to public health. Contrary to expectation, the correlation between the level of 210Po and the level of gross α is less evident in January to
March and May 2011, as can be seen in Figure 3.8.
3.2 γ-emitting nuclides
Detectable quantities of the naturally occurring nuclides 7Be and 210Pb were found
in all 52 weekly samples. The yearly total deposition of 7Be was 1,320 30 Bq·m-2
and the yearly total deposition of 210Pb was 104 2 Bq·m-2. The nuclide 137Cs was
detected in 8 of the 52 weekly samples (the detection limit for 137Cs is 0.02
Bq·m-2). The yearly total deposition of 137Cs ranged between 0.5 and 1.5 Bq·m-2
(68% confidence level). The weekly results for deposition of 7Be, 137Cs and 210Pb
are given in Table A12 and Figures 3.9 and 3.12. The results for previous years are given in Table A11 and Figures 3.10, 3.11 and 3.13.
0 20 40 60 80 100 120 1 4 7 10 13 16 19 22 25 28 31 34 37 40 43 46 49 52 7Be -a c ti v it y in d e po s it ion ( B q/ m ²) week in 2011
Figure 3.9: Weekly deposited 7Be activity at RIVM
0 500 1000 1500 2000 2500 1993 1994 1995 1996 1997 1998 1999 2000 2001 2002 2003 2004 2005 2006 2007 2008 2009 2010 2011 7B e -act iv it y i n depo si ti on ( B q /m ²) year
Figure 3.10: Yearly 7Be activity deposited at RIVM from 1993 to 2011
Yearly totals (black dots) are shown with a 68% confidence range (coloured bars). Only the 68% confidence range is shown if the yearly result is made up of at least one detection limit. 0 1 2 3 4 5 6 7 8 9 1993 1994 1995 1996 1997 1998 1999 2000 2001 2002 2003 2004 2005 2006 2007 2008 2009 2010 2011 13 7C s -a c ti v it y in d e p o s iti o n (B q /m ²) year
Figure 3.11: Yearly 137Cs activity deposited at RIVM from 1993 to 2011 Yearly averages are shown solely as a 68% confidence range since the yearly result is made up of at least one detection limit. From 2000 to June 2009, the detection limit was higher than during 1993–1999, due to a different detector set-up. Since July 2009, a new detector set-up has been used, which results in lower detection limits.
0 2 4 6 8 1 4 7 10 13 16 19 22 25 28 31 34 37 40 43 46 49 52 210 Pb -act iv it y in de position (B q/m ²) week in 2011
Figure 3.12: Weekly deposited 210Pb activity at RIVM
Weekly averages (black dots) are shown with a 68% confidence range (coloured bars).
0 20 40 60 80 100 120 140 160 180 200 1993 1994 1995 1996 1997 1998 1999 2000 2001 2002 2003 2004 2005 2006 2007 2008 2009 2010 2011 21 0P b -a c ti v it y in d e p o s iti o n (B q /m ²) year
Figure 3.13: Yearly 210Pb activity deposited at RIVM from 1993 to 2011
Yearly averages (black dots) are shown with a 68% confidence range (coloured bars). Only the 68% confidence range is shown if the yearly result is made up of at least one detection limit.
3.3 Additional results following the incident at Fukushima (Japan)
In the weeks following the incident at the nuclear site at Fukushima (Japan), a few changes were made to the regular monitoring program.
During weeks 12 to 15 a sub-sample was taken out of the original sample and measured in a 250 ml container on a coaxial detector (70,000–86,400 seconds counting time) to determine volatile γ-emitters. After this measurement the sub-sample was added to the original sample and the standard procedure, as described at the beginning of this chapter, was followed.
In addition, sampling was carried out with a different frequency (3 and 4 days instead of 1 week) in week 13. The relevant results are presented in Table 3.2. Table 3.2: Deposited 131I activity (1) at RIVM in the period following the
Fukushima incident Week Period 131I number Bq·m-2 12 18/03–25/03 < 12 13A 25/03–28/03 < 2 13B 28/03–01/04 3.4 ± 1.3 14 01/04–08/04 1.4 ± 0.3 15 08/04–15/04 < 9