RIVM report 680125002/2006
MNP report 500080002/2006
Methane and nitrous oxide emissions from
animal manure management, 1990 - 2003
Background document on the calculation method
for the Dutch National Inventory Report
K.W. Van der Hoek and M.W. Van Schijndel
* *Netherlands Environmental Assessment Agency
(MNP)
Contact:
K. W. Van der Hoek
Laboratory for Environmental Monitoring (LVM)
Klaas.van.der.hoek@rivm.nl
M. W. Van Schijndel
Agriculture and Rural Areas Team (LDL)
Marian.van.schijndel@mnp.nl
This investigation has been performed by order and for the account of SenterNovem, within
the framework of project 1331-04-02-02-005/4700007562 and
0377-04-01-06-003/4700008403.
Abstract
Methane and nitrous oxide emissions from animal manure management, 1990 - 2003
Background document on the calculation method for the Dutch National Inventory Report
Since 2005 the Netherlands has used a new country-specific method to calculate the methane
and nitrous oxide emissions from animal manure management. Compared to the default
methods provided by the Intergovernmental Panel on Climate Change, this method has led to
a more realistic estimate of the emissions. Manure management in the Netherlands comprises
manure storage, manure production in the meadow and manure processing. Methane and
nitrous oxide contribute to the greenhouse effect and, in order to meet the commitments of
the Kyoto protocol, have to be reported annually in the Dutch National Inventory Report.
This protocol encourages countries to use country-specific methods rather than the default
methods provided by the Intergovernmental Panel on Climate Change. The report describes
the calculation schemes and data sources used for methane and nitrous oxide emissions from
animal manure management in the Netherlands. The elaborate explanation will facilitate
expert reviewing. Finally, the report also presents an overview of the methane and nitrous
oxide emissions from animal manure management and the underlying data used in the 1990 -
2003 period.
Key words: methane, nitrous oxide, greenhouse gases, emissions, animal manure, Kyoto
protocol, climate change, IPCC
Het rapport in het kort
Methaan en lachgas emissies bij opslag en behandeling van dierlijke mest, 1990 - 2003
Achtergronddocument van de berekeningsmethode voor het Nederlandse National Inventory
Report
Nederland berekent vanaf 2005 met een nieuwe methode de uitstoot van methaan en lachgas
die optreedt bij mestopslag en -behandeling. Hierdoor wordt een betere schatting van de
uitstoot verkregen dan wanneer de standaard berekeningsmethode van het Kyoto protocol
gebruikt wordt. In Nederland omvat mestbehandeling naast mestbewerking ook
mestproductie in de weide. Methaan en lachgas dragen bij aan het broeikaseffect. In het
Kyoto protocol is afgesproken dat Nederland een emissiereductie tot stand brengt en jaarlijks
rapporteert over de broeikasgasemissies in het National Inventory Report. Het Kyoto protocol
moedigt landen aan een landspecifieke methode te gebruiken in plaats van de standaard
berekeningsmethode die het Intergovernmental Panel on Climate Change aanbiedt. Het
rapport geeft een transparante beschrijving van de rekenregels en de gebruikte databronnen
voor de Nederlandse methaan en lachgas uitstoot ten gevolge van mestbehandeling. De
uitvoerige toelichting maakt beoordeling door experts mogelijk. Het rapport omvat tenslotte
een overzicht van de methaan- en lachgasemissies bij mestbehandeling en van alle
onderliggende data voor de periode 1990 – 2003.
Trefwoorden: methaan, lachgas, broeikas, emissies, dierlijke mest, Kyoto protocol,
klimaatverandering, IPCC
Contents
Summary
7
1.
Introduction
9
2.
Animal manure production in the Netherlands
11
3.
Methane emissions from animal manure management
15
3.1
Contribution of agricultural methane emissions to total Dutch GHG emissions
15
3.2
Scientific background of methane emissions from animal manure management
15
3.3
Method of calculating methane emissions from animal manure management
17
3.4
Relevant statistical data necessary for calculating methane emissions
19
3.5
Emission factors for methane emissions from animal manure management
24
3.6
Overview of methane emissions from animal manure management 1990 - 2003
30
4.
Nitrous oxide emissions from animal manure management
33
4.1
Contribution of agricultural nitrous oxide emissions to total Dutch GHG emissions
33
4.2
Scientific background of nitrous oxide emissions from animal manure management
33
4.3
Method of calculating nitrous oxide emissions from animal manure management
34
4.4
Relevant data necessary for calculating nitrous oxide emissions
35
4.5
Emission factors for nitrous oxide emissions from animal manure management
39
4.6
Overview of nitrous oxide emissions from animal manure management 1990 - 2003
39
References
41
Appendix 1. Animal numbers in the Netherlands 1990 – 2003
44
Appendix 2. Overview of methane emissions from animal manure management 1990 - 2003
46
Summary
The countries that have ratified the Kyoto protocol are obliged to provide an annual National
Inventory Report (NIR) on the relevant greenhouse gas (GHG) emissions. To facilitate the
production of national emission inventories, the Intergovernmental Panel on Climate Change
(IPCC) has issued Guidelines. At the same time the IPCC encourages countries to use
country-specific methods and data if these give a more realistic picture of the emission of
greenhouse gases. However, if a country uses country-specific methods and data, it has to
provide a transparent description of the emission calculation method and data sources used.
This report describes the calculation schemes and data sources used for methane and nitrous
oxides emissions from animal manure management in the Netherlands. Manure management
comprises manure storage, manure production in the meadow and manure processing.
The Netherlands is characterised by a high animal density, allowing the use of considerable
statistical data on animal manure to comply with environmental protection and manure
legislation. The availability of these data in the Netherlands means that country- and
year-specific manure and nitrogen excretion data for year-specific animal categories in the Netherlands
can be used as well as country-specific data on manure characteristics.
In facilitating expert reviewing, this report clearly indicates the Dutch approach and also
provides an overview of the Dutch data which have been used for the calculations. The main
advantage of this approach is the use of a common national database with data on animal
numbers and manure excretion to calculate the agricultural methane, nitrous oxide and
ammonia emissions in the Netherlands.
This report not only provides the calculation schemes but also presents an overview of both
the methane and nitrous oxide emissions from animal manure management and all underlying
data used in the 1990 – 2003 period.
1.
Introduction
The United Nations Framework Convention on Climate Change (UNFCCC), agreed on in
Rio de Janeiro in 1992, is aimed at stabilizing emissions of greenhouse gases to levels that
prevent a negative impact of human activities on climate. It was ratified by the Netherlands
and came into force in March 1994. One of the commitments for Parties under the
Convention is to develop, publish and regularly update national emission inventories of
greenhouse gases.
The awareness that further steps were needed led in 1997 to the Kyoto Protocol, in which
Annex 1 Parties agree to reduce greenhouse gas emissions by some 5% in the 2008-2012
period relative to 1990. Reduction commitments differ per country. The agreements reached
in Kyoto and, subsequently, in the European Union have resulted in a 6% emission reduction
commitment for the Netherlands. This target pertains to the most important greenhouse gases:
carbon dioxide (CO
2), nitrous oxide (N
2O), methane (CH
4) and a number of fluorinated (F)
gases.
The Netherlands has implemented a series of policies and measures to achieve a reduction in
greenhouse gas emissions. Emissions and emission reductions have to be monitored,
registered and reported in compliance with international (IPCC) standards.
The monitoring process in the Netherlands
The Netherlands has, for many years, had a system for the registration and reporting of
relevant emissions to air, water and soil. This system, the Pollutant Emission Register (PER),
was implemented under responsibility of the Ministry of Housing, Spatial Planning and the
Environment (VROM). Since April 2004, the Netherlands Environmental Assessment
Agency (MNP in Dutch) coordinates the PER on behalf of the ministry. The MNP acts as the
interface between science and policy. It assesses the quality of the environment for people
and ecosystems so to advise national and international policy-makers.
Several institutes are involved in the process of compiling the national greenhouse gas
inventory. Actual data collection and elaboration is done by institutes such as CBS,
MNP/RIVM, LEI and TNO, on the basis of the annual environmental reports from
companies, questionnaires and studies. Agricultural data are collected and reported by LEI
(Agricultural Economics Research Institute) and CBS (Statistics Netherlands). MNP
calculates the methane and nitrous oxide emissions on the basis of the annual agricultural
census data.
In December 2005 SenterNovem was designated by law as National Inventory Entity. In
addition to co-ordinating the establishment of a national system for greenhouse gas
emissions, the tasks of SenterNovem include the overall co-ordination of (improved) quality
control and quality assurance activities as part of the National System and co-ordination of
the support/response to the UNFCCC review process. In that context, SenterNovem was
involved in development of monitoring protocols for greenhouse gas emissions and also
commissioned the development of this background document.
The Monitoring Improvement Programme
The Kyoto Protocol under the UNFCCC prescribes Parties to implement a national system
for greenhouse gas emissions. In the Netherlands such a programme has been implemented
under responsibility of VROM. This has led to the establishment of the National System,
required by the end of 2005. Practical co-ordination of this programme was assigned to
SenterNovem.
The most important projects included:
● Adapting the monitoring procedures (where needed) to new international requirements,
with methods, instructions, working processes, tasks and responsibilities described in
protocols. Where necessary, agreements with sectors and institutes were made on adaptations
of the present methods, to comply with new international standards.
● Updating and elaborating the quality assurance and control process of greenhouse gas
monitoring.
● Improving the uncertainty assessment and management in emission data. Many data
necessarily imply estimates or rough assessments; the climate convention requires an
assessment of related uncertainties.
● Studies into more accurate and detailed emission factors and/or methodologies.
This background document
This report is the result of a study carried out as part of the improvement programme. It
provides background information for four agricultural protocols which are available via
www.greenhousegases.nl
and include:
● methane emissions from manure management: cattle;
● methane emissions from manure management: swine;
● methane emissions from manure management: other;
● nitrous oxide emissions from manure management.
It also provides an overview of emissions and underlying statistical data used.
This report starts with a brief overview of animal manure production in the Netherlands,
followed by a description of the Dutch procedures for calculating methane and nitrous oxide
emissions from manure management in the two subsequent chapters. These two chapters may
be read independently.
2.
Animal manure production in the Netherlands
The Netherlands with a total agricultural area of 20,000 km
2has a high animal density. The
animal categories used in this report are the same as in the annual Dutch agricultural census
(available via
www.cbs.nl
, select Statline). For reasons of transparency these distinct
categories will be used throughout this report; in some tables categories are aggregated to
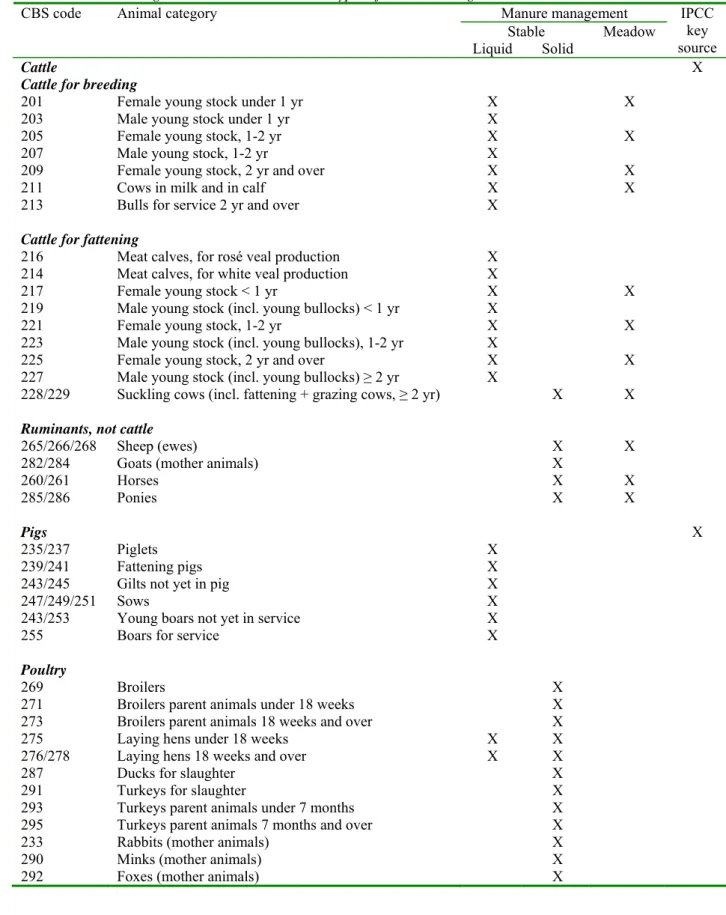
IPCC categories. Table 2.1 overviews the Dutch animal categories with the type of manure
management: liquid, solid or meadow, given per category.
For sheep, goats, rabbits, mink and foxes only the numbers of mother animals are presented.
The offsprings’ manure production is already included in the mothers’ manure production.
This also holds for sows. Although the number of piglets is presented in the Dutch
agricultural census, their manure production has already been included in the manure
production of the sows, so the manure production of the piglets is not registered separately.
Most of the animal manure in the Netherlands is in liquid form. From the ruminants, only
suckling cows, sheep, goats, horses and ponies have solid manure. With the exception of
laying hens, poultry produces only solid manure. Both laying hens under 18 weeks, and
18 weeks and over have, during the last 25 years, switched from almost 100% liquid manure
to >90% solid manure systems. Nearly 100% of the pigs are held on liquid manure systems.
Ruminants spend some time in the meadow during the summer. Pigs and poultry are held in
animal housing all year round.
Table 2.1 Animal categories in the Netherlands and types of manure management
CBS code
Animal category
Manure management
Stable
Meadow
Liquid
Solid
IPCC
key
source
Cattle
X
Cattle for breeding
201
Female young stock under 1 yr
X
X
203
Male young stock under 1 yr
X
205
Female young stock, 1-2 yr
X
X
207
Male young stock, 1-2 yr
X
209
Female young stock, 2 yr and over
X
X
211
Cows in milk and in calf
X
X
213
Bulls for service 2 yr and over
X
Cattle for fattening
216
Meat calves, for rosé veal production
X
214
Meat calves, for white veal production
X
217
Female young stock < 1 yr
X
X
219
Male young stock (incl. young bullocks) < 1 yr
X
221
Female young stock, 1-2 yr
X
X
223
Male young stock (incl. young bullocks), 1-2 yr
X
225
Female young stock, 2 yr and over
X
X
227
Male young stock (incl. young bullocks) ≥ 2 yr
X
228/229
Suckling cows (incl. fattening + grazing cows, ≥ 2 yr)
X
X
Ruminants, not cattle
265/266/268 Sheep
(ewes)
X
X
282/284 Goats
(mother
animals)
X
260/261 Horses
X X
285/286 Ponies
X X
Pigs
X
235/237 Piglets
X
239/241 Fattening
pigs
X
243/245
Gilts not yet in pig
X
247/249/251 Sows
X
243/253
Young boars not yet in service
X
255
Boars for service
X
Poultry
269 Broilers
X
271
Broilers parent animals under 18 weeks
X
273
Broilers parent animals 18 weeks and over
X
275
Laying hens under 18 weeks
X
X
276/278
Laying hens 18 weeks and over
X
X
287
Ducks for slaughter
X
291 Turkeys
for
slaughter
X
293
Turkeys parent animals under 7 months
X
295
Turkeys parent animals 7 months and over
X
233 Rabbits
(mother
animals)
X
290 Minks
(mother
animals)
X
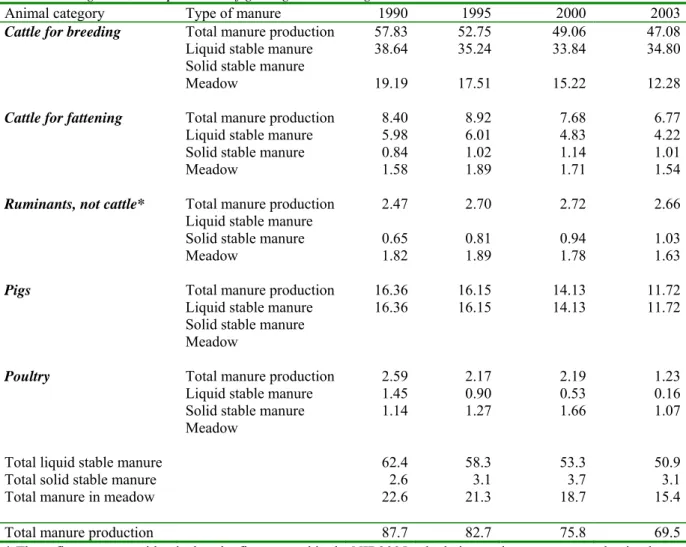
Table 2.2 overviews the Dutch manure production for aggregated animal categories. The
manure production has decreased from 87.7 to 69.5 * 10
9kg in the 1990 - 2003 period. This
is mainly a result of the Dutch manure policy, especially for pigs, poultry and cattle for
fattening. The EU policy on milk quotas resulted in declining manure production for cattle
for breeding. Milk production per cow increased as a result of genetic changes in cattle due to
breeding programmes and the changing composition of feed intake. With the national milk
quota remaining unchanged during the 1990 - 2003 period, dairy cattle numbers for female
cows decreased by the same order of magnitude. Manure production per cow increased, but
to a smaller extent than the decrease in total cow numbers, causing an overall decrease in
total manure production by breeding cattle.
The animal numbers have declined and for most animal categories the manure production per
animal also declined. For cattle for breeding, the sharp decline in manure production in the
meadow is the result of the shorter period of time spent in the meadow. The poultry values
for the year 2003 are exceptionally low due to the outbreak of fowl plague in that year.
Table 2.2 Animal manure production in the Netherlands, classified into main animal categories and type of
manure management, with production figures given in 10
9kg
Animal category
Type of manure
1990
1995
2000
2003
Cattle for breeding
Total manure production
57.83
52.75
49.06
47.08
Liquid
stable
manure
38.64
35.24
33.84
34.80
Solid
stable
manure
Meadow
19.19
17.51
15.22
12.28
Cattle for fattening
Total manure production
8.40
8.92
7.68
6.77
Liquid
stable
manure
5.98
6.01
4.83
4.22
Solid
stable
manure
0.84
1.02
1.14
1.01
Meadow
1.58
1.89
1.71
1.54
Ruminants, not cattle*
Total manure production
2.47
2.70
2.72
2.66
Liquid
stable
manure
Solid
stable
manure
0.65
0.81
0.94
1.03
Meadow
1.82
1.89
1.78
1.63
Pigs
Total manure production
16.36
16.15
14.13
11.72
Liquid
stable
manure
16.36
16.15
14.13
11.72
Solid
stable
manure
Meadow
Poultry
Total manure production
2.59
2.17
2.19
1.23
Liquid
stable
manure
1.45
0.90
0.53
0.16
Solid
stable
manure
1.14
1.27
1.66
1.07
Meadow
Total liquid stable manure
62.4
58.3
53.3
50.9
Total solid stable manure
2.6
3.1
3.7
3.1
Total manure in meadow
22.6
21.3
18.7
15.4
Total manure production
87.7
82.7
75.8
69.5
* These figures are not identical to the figures used in the NIR2005 calculations, where manure production by
horses and ponies in the stable and in the meadow was estimated as being too low for 1990 - 2003 (see also
Table 3.3). The adjusted figures, as shown in Table 2.2, will be used in the methane emission calculations in
NIR2006.
3.
Methane emissions from animal manure
management
This chapter focuses on methane emissions from animal manure stored in liquid form,
manure stored in solid form and manure excreted during pasture time. Manure is normally
stored inside the animal housing and for a certain period of time also in storage facilities
outside the animal housing.
3.1
Contribution of agricultural methane emissions to total
Dutch GHG emissions
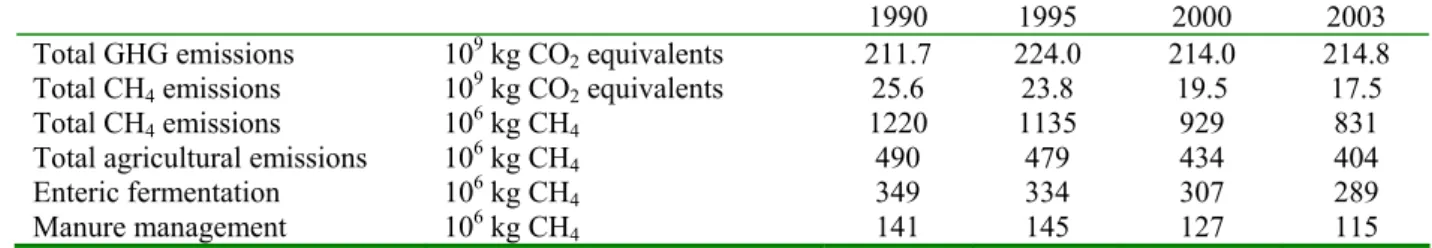
Total Dutch greenhouse gas emissions amounted to about 215 * 10
9kg CO
2equivalent in
2003 (Klein Goldewijk et al., 2005). Roughly 10% is CH
4-based and the share of agriculture
in CH
4emissions is roughly 50% (Table 3.1). Enteric fermentation is animal based and
accounts for circa 70% of the agricultural methane emissions. Manure management
comprises methane emissions from animal manure stored in the animal housing and in
storage facilities outside the animal housing. These emissions account for circa 30% of the
agricultural methane emissions.
Table 3.1 Relevance of agricultural methane emissions in the Netherlands
1990 1995 2000 2003
Total GHG emissions
10
9kg CO
2
equivalents
211.7 224.0 214.0 214.8
Total CH
4emissions
10
9kg CO
2equivalents
25.6
23.8
19.5
17.5
Total CH
4emissions
10
6kg CH
41220
1135
929
831
Total agricultural emissions
10
6kg CH
4
490
479
434
404
Enteric fermentation
10
6kg CH
4
349
334
307
289
Manure management
10
6kg CH
4
141
145
127
115
Source: Klein Goldewijk et al., 2005
3.2
Scientific background of methane emissions from animal
manure management
Once excreted by the animal, the organic matter in animal manure is subject to aerobic and
anaerobic breakdown. Liquid animal manure storage is characterised by strict anaerobic
conditions due to the high BOD (Biochemical Oxygen Demand) content of manure and the
slow diffusion of oxygen into the liquid manure. Normally the organic matter is hydrolysed
and converted into volatile fatty acids. The initial number of methane-producing bacteria is
too small to produce a significant amount of methane. The presence of ammonia in liquid
manure also inhibits the methane production. Only when the manure is stored for a long time,
does the multiplication of the methane producers result in a substantial release of methane.
The required number of methane bacteria is reached sooner at higher temperatures during
storage of animal manure or when the initial number of methane bacteria is high. The latter
occurs when the manure storage facility is not fully emptied when land spreading takes place,
leaving part of the manure in the storage facility.
A breakdown of organic matter occurs during storage of liquid manure. The first two
processes, hydrolysis and acidification, normally occur during storage of manure and volatile
acids are produced. The conversion of volatile fatty acids into methane and carbon dioxide
depends on storage conditions.
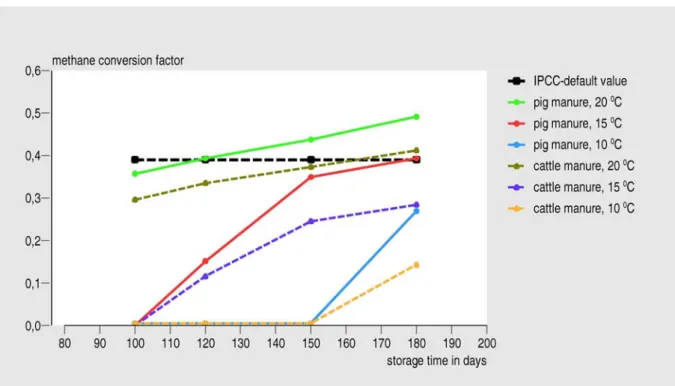
The effect of storage time and temperature on methane production is presented in Table 3.2
and in Figure 3.1. The methane production is represented as a MCF, Methane Conversion
Factor, meaning that the actual methane production is expressed as the ratio between the
actual and the ultimate methane production; the latter occurs with very long storage times.
The IPCC default MCF value is also plotted. This default value is considered by IPCC as
representative for a storage time of longer than 30 days and a temperature of 15 ºC (Zeeman
and Gerbens, 2002). However, this is a very crude approach. Figure 3.1 shows this IPCC
default value to be more representative for pig manure with a storage time longer than
3 months at 20
oC or for pig manure with a storage time longer than 5 months at 15 ºC. This
is discussed in more detail in Section 3.3.
Table 3.2 Effect of storage time and temperature on methane emission from stored liquid manure
Storage time in days
100
120
150
180
Pig manure, 10 ºC
0
0
0
0.269
Pig manure, 15 ºC
0
0.151
0.349
0.393
Pig
manure,
20
ºC
0.357 0.393 0.437 0.491
Cattle
manure
10
ºC
0 0 0
0.143
Cattle
manure
15
ºC
0 0.116 0.245 0.284
Cattle
manure
20
ºC
0.296 0.335 0.373 0.412
IPCC default value
0.39
0.39
0.39
0.39
Emissions are expressed as MCF, the ratio between actual emission and ultimate methane production under
ideal circumstances.
Source: Zeeman, 1994
Figure 3.1. The Methane Conversion Factor (MCF) increases with an increase in temperature and storage time
of liquid animal manure. Note the difference between cattle and pig manure: this is due to the difference in
organic matter characteristics in both manure types. Source: Zeeman, 1994.
Biogas production from liquid animal manure is aimed at maximum production of methane.
This is achieved by choosing the appropriate process conditions in terms of temperature and
residence time in the anaerobic fermentor. A prerequisite is to use fresh manure in order to
conserve the methane that would be emitted during storage inside or outside the animal
house. So the use of fresh manure will lower the methane emissions. On the other hand,
digested animal manure in an open storage could emit methane. Covering the storage of
digested manure with a balloon will prevent methane emissions to the environment and in
this way contribute to an enhanced biogas yield (Angelidaki et al., 2004).
Storage of solid manure can be characterised by both anaerobic and aerobic conditions. When
the structure of the pile is open there is ample supply of oxygen and aerobic conditions
prevail. If there is less access for oxygen, anaerobic processes dominate, but to a certain
extent the emitted methane is oxidised in the outer layers of the pile. Solid manure is
nowadays commonly found in Dutch poultry houses. For low emission rates of ammonia, the
solid manure should be kept dry, a condition which also offers a very low potential for
methane emissions. Excretion of manure in the meadow is also expected to offer a very low
potential for methane emission; this is due to the aerobic conditions in the topsoil.
3.3
Method of calculating methane emissions from animal
manure management
Until recently the methane emissions from animal manure management were calculated using
precursor IPCC Guidelines and country-specific emission factors established in the early
nineties (Van Amstel et al., 1993). Later on, the calculation methods were summarized in
Spakman et al. (1997, 2003). In 2005 the calculation methods were brought in line with the
IPCC Guidelines (1997, 2001); the country-specific emission factors used were also
reviewed. This report describes the new calculation methods, activity data, and emission
factors as used for calculating methane emissions from animal manure management in the
Netherlands from 2005 on. The report also provides background information for three
agricultural protocols which are available via
www.greenhousegases.nl
. These include:
● methane emissions from manure management: cattle (VROM, 2005a);
● methane emissions from manure management: swine (VROM, 2005b);
● methane emissions from manure management: other (VROM, 2005c).
Equation (1) from the IPCC Guidelines is used to estimate methane emissions from animal
manure management. In this equation for a specific animal category (i), the emission factor is
expressed as the amount of methane (in kg) emitted per animal per year.
Total Emission = ∑ Number of animals
i* Emission factor per animal
i(1)
Since the Netherlands is characterised by a high animal density a lot of statistical data on
animal manure is available in this country to comply with environmental protection and
manure legislation. Therefore the Netherlands does not use the IPCC emission factor but,
instead, a country-specific emission factor for a specific animal category, which is expressed
as amount of methane emitted per kg animal manure. This emission factor is calculated using
equation (2).
EF = OM * Bo * MCF * 0.662
(2)
where:
EF
=
Emission Factor, kg CH
4per kg animal manure
OM
=
Organic Matter, kg OM per kg animal manure
Bo = ultimate
CH
4production, m
3CH
4per kg OM
MCF =
Methane Conversion Factor, the actual methane conversion rate as
percentage of the ultimate conversion rate
0.662 =
specific weight of methane, kg per m
3The Dutch approach differs from the IPCC method in that the Dutch use the organic matter
(OM) content instead of volatile solids (VS) content in the calculation equations. However, in
general terms there is no difference in outcome between methane calculations based on OM
(Organic Matter) values, as used by the Netherlands, and methane calculations based on VS
(Volatile Solids) values used in calculation equations provided by IPCC. The reason is that
the Dutch maximum potential of CH
4production (Bo) is also expressed in terms of organic
matter content.
The total Dutch emission is calculated with equation (3):
Total Emission = ∑ Number of animals
i* manure production per animal
i* emission factor
per kg animal manure
i(3)
In fact there is no difference between this method and the default IPCC method. Both
approaches produce the same national emissions.
Because there are different CH
4emission factors for manure produced in the meadow and
also for liquid and solid manure production in animal housing, there are three calculations:
one for manure produced in the meadow, one for liquid stable manure and one for solid stable
manure. Note that CH
4emissions from manure excreted in the meadow are also accounted
for in this calculation. In accordance with IPCC Guidelines two different approaches are used
for reporting CH
4and N
2O emissions from animal waste produced in the meadow during
grazing. CH
4emissions from animal waste produced in the meadow are included in source
category Manure management. N
2O emissions from animal waste produced in the meadow
are included in source category Agricultural soil (see also Section 4.3).
In the case that biogas production from animal manure increases in the Netherlands in the
near future, the method for calculating methane emissions from manure management has to
be extended to include the effects of biogas production. Focus should also be placed on N
2O
emissions when digested manure is applied to the soil.
3.4
Relevant statistical data necessary for calculating
methane emissions
Statistical data on the following is needed for calculating the national methane emissions
from manure management (see also equations 2 and 3):
- the number of animals in each animal category as indicated in Table 2.1
- the amount of manure produced by each animal per year for each animal category,
distribution of manure type over the animal housing (liquid, solid) and the meadow
- the content of organic matter per kg manure for each animal category.
The animal numbers in each animal category are taken from the annual agricultural census.
These data are reported in Agricultural Data (Landbouwcijfers), issued by LEI (Agricultural
Economics Research Institute) and CBS (Statistics Netherlands). These data are also
available on
www.cbs.nl
(select Statline). See Appendix 1 for a presentation of these data.
The amount of manure per animal is calculated by the WUM (Working Group on Uniform
Data for Animal Excretion) on a yearly basis for all animal categories except horses and
ponies. The first WUM reports describe the methodology in detail (WUM, 1994a, b and c);
an annual publication is available for subsequent years (Van Eerdt, 1995a, b, 1996, 1997,
1998, 1999; Van Eerdt et al., 2003; Van Bruggen, 2003, 2004, 2005). The annual manure
production data are collected in Table 3.3. The shares of liquid and solid manure, along with
the amount of manure produced in the meadow, are also published by WUM. The annual
excretion data for horses and ponies are taken from the Belgian legislation, where the
excretion values used represent the average for horses and ponies (VLM, 2000). It is assumed
that 70% of the manure is produced in the stable and 30% in the meadow. If Dutch figures for
manure composition of stable horse manure and average figures for cattle manure in the
meadow are used, the annual manure production in stable and meadow can be calculated as
follows:
Amount
of
manure
kg
N
kg
P
2O
5Stable
5,000
35
15
Meadow
3,500
15
6
Total
8,500
50
21
The content of organic matter in the different types of animal manure is taken from the
tables in the Guidelines for Fertilization of Grassland and Arable Crops. These Guidelines,
used by the Agricultural Advisory Services in the Netherlands, are available for general use.
The content of organic matter and minerals in animal manure (including horses) is based on
the BLGG analyses (BLGG = Laboratory for Soil and Crop Testing). Data for 1990 - 1994
are taken from Anonymous (1988), and data for 1995 - 1999 from Van Dijk (1999); data
from 2000 onward are found in Anonymous (2002). Table 3.4 presents the organic matter
content of the different types of manure collected.
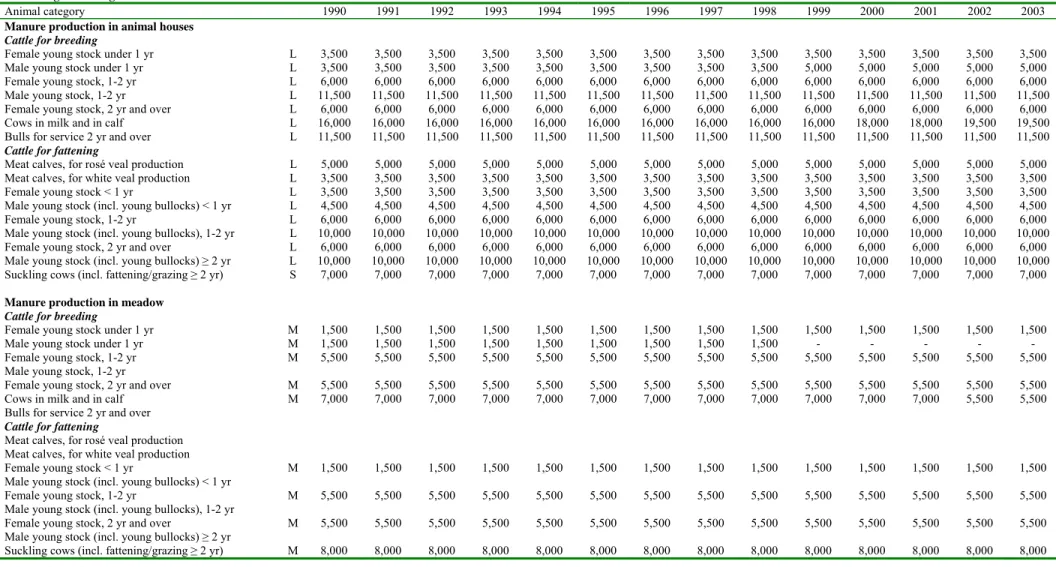
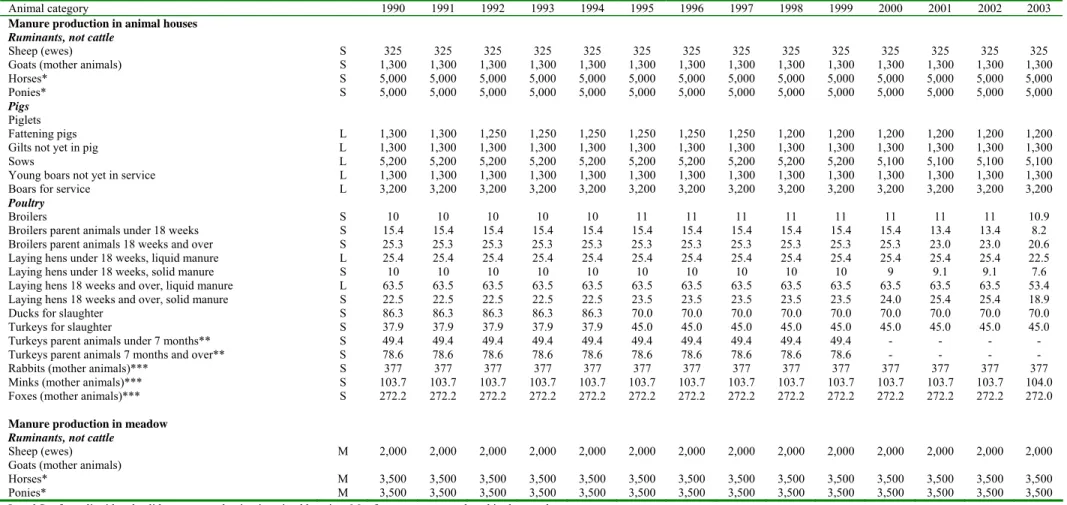
Table 3.3 Animal manure production per animal type for the 1990 – 2003 period. Values are given in kg per animal per year and reflect the total manure production,
including cleaning water
Animal category 1990 1991 1992 1993 1994 1995 1996 1997 1998 1999 2000 2001 2002 2003
Manure production in animal houses
Cattle for breeding
Female young stock under 1 yr L 3,500 3,500 3,500 3,500 3,500 3,500 3,500 3,500 3,500 3,500 3,500 3,500 3,500 3,500
Male young stock under 1 yr L 3,500 3,500 3,500 3,500 3,500 3,500 3,500 3,500 3,500 5,000 5,000 5,000 5,000 5,000
Female young stock, 1-2 yr L 6,000 6,000 6,000 6,000 6,000 6,000 6,000 6,000 6,000 6,000 6,000 6,000 6,000 6,000
Male young stock, 1-2 yr L 11,500 11,500 11,500 11,500 11,500 11,500 11,500 11,500 11,500 11,500 11,500 11,500 11,500 11,500
Female young stock, 2 yr and over L 6,000 6,000 6,000 6,000 6,000 6,000 6,000 6,000 6,000 6,000 6,000 6,000 6,000 6,000
Cows in milk and in calf L 16,000 16,000 16,000 16,000 16,000 16,000 16,000 16,000 16,000 16,000 18,000 18,000 19,500 19,500
Bulls for service 2 yr and over L 11,500 11,500 11,500 11,500 11,500 11,500 11,500 11,500 11,500 11,500 11,500 11,500 11,500 11,500 Cattle for fattening
Meat calves, for rosé veal production L 5,000 5,000 5,000 5,000 5,000 5,000 5,000 5,000 5,000 5,000 5,000 5,000 5,000 5,000
Meat calves, for white veal production L 3,500 3,500 3,500 3,500 3,500 3,500 3,500 3,500 3,500 3,500 3,500 3,500 3,500 3,500
Female young stock < 1 yr L 3,500 3,500 3,500 3,500 3,500 3,500 3,500 3,500 3,500 3,500 3,500 3,500 3,500 3,500
Male young stock (incl. young bullocks) < 1 yr L 4,500 4,500 4,500 4,500 4,500 4,500 4,500 4,500 4,500 4,500 4,500 4,500 4,500 4,500
Female young stock, 1-2 yr L 6,000 6,000 6,000 6,000 6,000 6,000 6,000 6,000 6,000 6,000 6,000 6,000 6,000 6,000
Male young stock (incl. young bullocks), 1-2 yr L 10,000 10,000 10,000 10,000 10,000 10,000 10,000 10,000 10,000 10,000 10,000 10,000 10,000 10,000
Female young stock, 2 yr and over L 6,000 6,000 6,000 6,000 6,000 6,000 6,000 6,000 6,000 6,000 6,000 6,000 6,000 6,000
Male young stock (incl. young bullocks) ≥ 2 yr L 10,000 10,000 10,000 10,000 10,000 10,000 10,000 10,000 10,000 10,000 10,000 10,000 10,000 10,000
Suckling cows (incl. fattening/grazing ≥ 2 yr) S 7,000 7,000 7,000 7,000 7,000 7,000 7,000 7,000 7,000 7,000 7,000 7,000 7,000 7,000
Manure production in meadow
Cattle for breeding
Female young stock under 1 yr M 1,500 1,500 1,500 1,500 1,500 1,500 1,500 1,500 1,500 1,500 1,500 1,500 1,500 1,500
Male young stock under 1 yr M 1,500 1,500 1,500 1,500 1,500 1,500 1,500 1,500 1,500 - - - - -
Female young stock, 1-2 yr M 5,500 5,500 5,500 5,500 5,500 5,500 5,500 5,500 5,500 5,500 5,500 5,500 5,500 5,500
Male young stock, 1-2 yr
Female young stock, 2 yr and over M 5,500 5,500 5,500 5,500 5,500 5,500 5,500 5,500 5,500 5,500 5,500 5,500 5,500 5,500
Cows in milk and in calf M 7,000 7,000 7,000 7,000 7,000 7,000 7,000 7,000 7,000 7,000 7,000 7,000 5,500 5,500
Bulls for service 2 yr and over
Cattle for fattening
Meat calves, for rosé veal production
Meat calves, for white veal production
Female young stock < 1 yr M 1,500 1,500 1,500 1,500 1,500 1,500 1,500 1,500 1,500 1,500 1,500 1,500 1,500 1,500
Male young stock (incl. young bullocks) < 1 yr
Female young stock, 1-2 yr M 5,500 5,500 5,500 5,500 5,500 5,500 5,500 5,500 5,500 5,500 5,500 5,500 5,500 5,500
Male young stock (incl. young bullocks), 1-2 yr
Female young stock, 2 yr and over M 5,500 5,500 5,500 5,500 5,500 5,500 5,500 5,500 5,500 5,500 5,500 5,500 5,500 5,500
Male young stock (incl. young bullocks) ≥ 2 yr
Table 3.3 continued. Animal manure production per animal type for the 1990 – 2003 period. Values are given in kg per animal per year and reflect the total manure
production, including cleaning water
Animal category 1990 1991 1992 1993 1994 1995 1996 1997 1998 1999 2000 2001 2002 2003
Manure production in animal houses
Ruminants, not cattle
Sheep (ewes) S 325 325 325 325 325 325 325 325 325 325 325 325 325 325
Goats (mother animals) S 1,300 1,300 1,300 1,300 1,300 1,300 1,300 1,300 1,300 1,300 1,300 1,300 1,300 1,300
Horses* S 5,000 5,000 5,000 5,000 5,000 5,000 5,000 5,000 5,000 5,000 5,000 5,000 5,000 5,000
Ponies* S 5,000 5,000 5,000 5,000 5,000 5,000 5,000 5,000 5,000 5,000 5,000 5,000 5,000 5,000
Pigs Piglets
Fattening pigs L 1,300 1,300 1,250 1,250 1,250 1,250 1,250 1,250 1,200 1,200 1,200 1,200 1,200 1,200
Gilts not yet in pig L 1,300 1,300 1,300 1,300 1,300 1,300 1,300 1,300 1,300 1,300 1,300 1,300 1,300 1,300
Sows L 5,200 5,200 5,200 5,200 5,200 5,200 5,200 5,200 5,200 5,200 5,100 5,100 5,100 5,100
Young boars not yet in service L 1,300 1,300 1,300 1,300 1,300 1,300 1,300 1,300 1,300 1,300 1,300 1,300 1,300 1,300
Boars for service L 3,200 3,200 3,200 3,200 3,200 3,200 3,200 3,200 3,200 3,200 3,200 3,200 3,200 3,200
Poultry
Broilers S 10 10 10 10 10 11 11 11 11 11 11 11 11 10.9
Broilers parent animals under 18 weeks S 15.4 15.4 15.4 15.4 15.4 15.4 15.4 15.4 15.4 15.4 15.4 13.4 13.4 8.2
Broilers parent animals 18 weeks and over S 25.3 25.3 25.3 25.3 25.3 25.3 25.3 25.3 25.3 25.3 25.3 23.0 23.0 20.6
Laying hens under 18 weeks, liquid manure L 25.4 25.4 25.4 25.4 25.4 25.4 25.4 25.4 25.4 25.4 25.4 25.4 25.4 22.5
Laying hens under 18 weeks, solid manure S 10 10 10 10 10 10 10 10 10 10 9 9.1 9.1 7.6
Laying hens 18 weeks and over, liquid manure L 63.5 63.5 63.5 63.5 63.5 63.5 63.5 63.5 63.5 63.5 63.5 63.5 63.5 53.4
Laying hens 18 weeks and over, solid manure S 22.5 22.5 22.5 22.5 22.5 23.5 23.5 23.5 23.5 23.5 24.0 25.4 25.4 18.9
Ducks for slaughter S 86.3 86.3 86.3 86.3 86.3 70.0 70.0 70.0 70.0 70.0 70.0 70.0 70.0 70.0
Turkeys for slaughter S 37.9 37.9 37.9 37.9 37.9 45.0 45.0 45.0 45.0 45.0 45.0 45.0 45.0 45.0
Turkeys parent animals under 7 months** S 49.4 49.4 49.4 49.4 49.4 49.4 49.4 49.4 49.4 49.4 - - - -
Turkeys parent animals 7 months and over** S 78.6 78.6 78.6 78.6 78.6 78.6 78.6 78.6 78.6 78.6 - - - -
Rabbits (mother animals)*** S 377 377 377 377 377 377 377 377 377 377 377 377 377 377
Minks (mother animals)*** S 103.7 103.7 103.7 103.7 103.7 103.7 103.7 103.7 103.7 103.7 103.7 103.7 103.7 104.0
Foxes (mother animals)*** S 272.2 272.2 272.2 272.2 272.2 272.2 272.2 272.2 272.2 272.2 272.2 272.2 272.2 272.0
Manure production in meadow
Ruminants, not cattle
Sheep (ewes) M 2,000 2,000 2,000 2,000 2,000 2,000 2,000 2,000 2,000 2,000 2,000 2,000 2,000 2,000
Goats (mother animals)
Horses* M 3,500 3,500 3,500 3,500 3,500 3,500 3,500 3,500 3,500 3,500 3,500 3,500 3,500 3,500
Ponies* M 3,500 3,500 3,500 3,500 3,500 3,500 3,500 3,500 3,500 3,500 3,500 3,500 3,500 3,500
L and S refer to liquid and solid manure production in animal housing, M refers to manure produced in the meadow
*These figures are not identical to the figures used in the NIR2005 calculations, where the solid stable manure production and manure production in the meadow by horses and ponies was incorrectly estimated as 4,670 and 2,330 kg, respectively (see also Table 2.2). In NIR2006 the adjusted figures as shown in Table 3.3 will be used in the methane emission calculation
**These figures are not identical to the figures used in the NIR2005 calculations, where the solid stable manure production by turkeys’ parent animals was incorrectly estimated as 37.9 between 1990 and 1995, as 45.0 between 1995 and 1998 and was not accounted for in 1999. In NIR2006 the adjusted figures as shown in Table 3.3 will be used in the methane emission calculation
*** Figures for 1990 and 1991 are not available; the 1992 figures were used in order to develop a consistent time series for the emission calculation Source: WUM and VLM (horses and ponies)
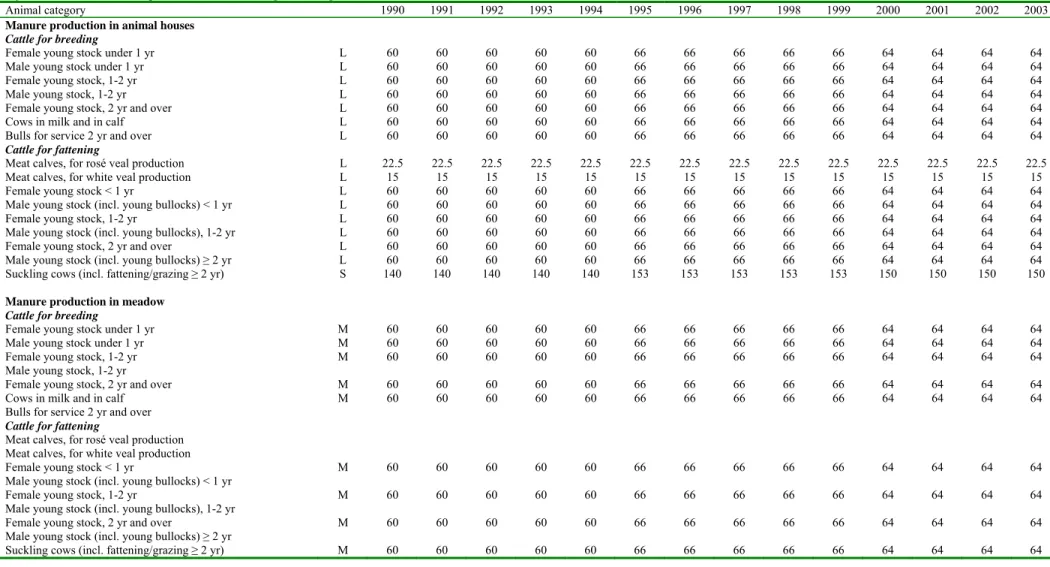
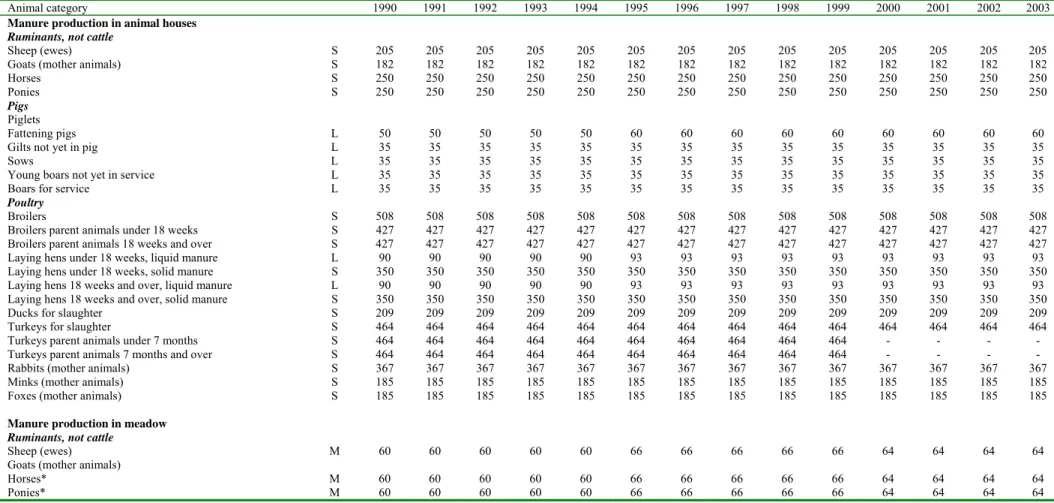
Table 3.4 Organic matter content of the different types of animal manure for the 1990 - 2003 period. Values are given in kg organic matter per 1000 kg animal manure and
reflect the total manure production, including cleaning water
Animal category 1990 1991 1992 1993 1994 1995 1996 1997 1998 1999 2000 2001 2002 2003
Manure production in animal houses
Cattle for breeding
Female young stock under 1 yr L 60 60 60 60 60 66 66 66 66 66 64 64 64 64
Male young stock under 1 yr L 60 60 60 60 60 66 66 66 66 66 64 64 64 64
Female young stock, 1-2 yr L 60 60 60 60 60 66 66 66 66 66 64 64 64 64
Male young stock, 1-2 yr L 60 60 60 60 60 66 66 66 66 66 64 64 64 64
Female young stock, 2 yr and over L 60 60 60 60 60 66 66 66 66 66 64 64 64 64
Cows in milk and in calf L 60 60 60 60 60 66 66 66 66 66 64 64 64 64
Bulls for service 2 yr and over L 60 60 60 60 60 66 66 66 66 66 64 64 64 64
Cattle for fattening
Meat calves, for rosé veal production L 22.5 22.5 22.5 22.5 22.5 22.5 22.5 22.5 22.5 22.5 22.5 22.5 22.5 22.5
Meat calves, for white veal production L 15 15 15 15 15 15 15 15 15 15 15 15 15 15
Female young stock < 1 yr L 60 60 60 60 60 66 66 66 66 66 64 64 64 64
Male young stock (incl. young bullocks) < 1 yr L 60 60 60 60 60 66 66 66 66 66 64 64 64 64
Female young stock, 1-2 yr L 60 60 60 60 60 66 66 66 66 66 64 64 64 64
Male young stock (incl. young bullocks), 1-2 yr L 60 60 60 60 60 66 66 66 66 66 64 64 64 64
Female young stock, 2 yr and over L 60 60 60 60 60 66 66 66 66 66 64 64 64 64
Male young stock (incl. young bullocks) ≥ 2 yr L 60 60 60 60 60 66 66 66 66 66 64 64 64 64
Suckling cows (incl. fattening/grazing ≥ 2 yr) S 140 140 140 140 140 153 153 153 153 153 150 150 150 150
Manure production in meadow
Cattle for breeding
Female young stock under 1 yr M 60 60 60 60 60 66 66 66 66 66 64 64 64 64
Male young stock under 1 yr M 60 60 60 60 60 66 66 66 66 66 64 64 64 64
Female young stock, 1-2 yr M 60 60 60 60 60 66 66 66 66 66 64 64 64 64
Male young stock, 1-2 yr
Female young stock, 2 yr and over M 60 60 60 60 60 66 66 66 66 66 64 64 64 64
Cows in milk and in calf M 60 60 60 60 60 66 66 66 66 66 64 64 64 64
Bulls for service 2 yr and over
Cattle for fattening
Meat calves, for rosé veal production
Meat calves, for white veal production
Female young stock < 1 yr M 60 60 60 60 60 66 66 66 66 66 64 64 64 64
Male young stock (incl. young bullocks) < 1 yr
Female young stock, 1-2 yr M 60 60 60 60 60 66 66 66 66 66 64 64 64 64
Male young stock (incl. young bullocks), 1-2 yr
Female young stock, 2 yr and over M 60 60 60 60 60 66 66 66 66 66 64 64 64 64
Male young stock (incl. young bullocks) ≥ 2 yr
Table 3.4 continued. Organic matter content of the different types of animal manure for the 1990 - 2003 period. Values are given in kg organic matter per 1000 kg animal
manure and reflect the total manure production, including cleaning water
Animal category 1990 1991 1992 1993 1994 1995 1996 1997 1998 1999 2000 2001 2002 2003
Manure production in animal houses
Ruminants, not cattle
Sheep (ewes) S 205 205 205 205 205 205 205 205 205 205 205 205 205 205
Goats (mother animals) S 182 182 182 182 182 182 182 182 182 182 182 182 182 182
Horses S 250 250 250 250 250 250 250 250 250 250 250 250 250 250
Ponies S 250 250 250 250 250 250 250 250 250 250 250 250 250 250
Pigs Piglets
Fattening pigs L 50 50 50 50 50 60 60 60 60 60 60 60 60 60
Gilts not yet in pig L 35 35 35 35 35 35 35 35 35 35 35 35 35 35
Sows L 35 35 35 35 35 35 35 35 35 35 35 35 35 35
Young boars not yet in service L 35 35 35 35 35 35 35 35 35 35 35 35 35 35
Boars for service L 35 35 35 35 35 35 35 35 35 35 35 35 35 35
Poultry
Broilers S 508 508 508 508 508 508 508 508 508 508 508 508 508 508
Broilers parent animals under 18 weeks S 427 427 427 427 427 427 427 427 427 427 427 427 427 427
Broilers parent animals 18 weeks and over S 427 427 427 427 427 427 427 427 427 427 427 427 427 427
Laying hens under 18 weeks, liquid manure L 90 90 90 90 90 93 93 93 93 93 93 93 93 93
Laying hens under 18 weeks, solid manure S 350 350 350 350 350 350 350 350 350 350 350 350 350 350
Laying hens 18 weeks and over, liquid manure L 90 90 90 90 90 93 93 93 93 93 93 93 93 93
Laying hens 18 weeks and over, solid manure S 350 350 350 350 350 350 350 350 350 350 350 350 350 350
Ducks for slaughter S 209 209 209 209 209 209 209 209 209 209 209 209 209 209
Turkeys for slaughter S 464 464 464 464 464 464 464 464 464 464 464 464 464 464
Turkeys parent animals under 7 months S 464 464 464 464 464 464 464 464 464 464 - - - -
Turkeys parent animals 7 months and over S 464 464 464 464 464 464 464 464 464 464 - - - -
Rabbits (mother animals) S 367 367 367 367 367 367 367 367 367 367 367 367 367 367
Minks (mother animals) S 185 185 185 185 185 185 185 185 185 185 185 185 185 185
Foxes (mother animals) S 185 185 185 185 185 185 185 185 185 185 185 185 185 185
Manure production in meadow
Ruminants, not cattle
Sheep (ewes) M 60 60 60 60 60 66 66 66 66 66 64 64 64 64
Goats (mother animals)
Horses* M 60 60 60 60 60 66 66 66 66 66 64 64 64 64
Ponies* M 60 60 60 60 60 66 66 66 66 66 64 64 64 64
L and S refer to liquid and solid manure production in animal housing, M refers to manure produced in the meadow
*These figures are not identical to the figures used in the NIR2005 calculations, where the organic matter content for horse manure produced in the meadow was incorrectly estimated as 250 for 1990 - 2003. In NIR2006 the adjusted figures, as shown in Table 3.4 will be used in methane emission calculations.
3.5
Emission factors for methane emissions from animal
manure management
As described in Section 3.3 the Netherlands does not use the IPCC proposed emission factor
per animal but, instead, a country-specific emission factor per kg animal manure. Multiplying
the Dutch emission factor by the amount of manure produced by an animal gives the methane
emission per animal. The following equation is used (see also Section 3.3):
EF = OM * Bo * MCF * 0.662
(2)
where:
EF
=
Emission Factor, kg CH
4per kg animal manure
OM
=
Organic Matter, kg OM per kg animal manure
Bo = ultimate
CH
4production, m
3CH
4per kg OM
MCF =
Methane Conversion Factor, the actual methane conversion rate as
percentage of the ultimate conversion rate
0.662 =
specific weight of methane, kg per m
3The Dutch approach differs from the IPCC method in that the Dutch use the organic matter
(OM) content instead of volatile solids (VS) content in the calculation equations. However, in
general terms there is no difference in outcome between methane calculations based on OM
(Organic Matter) values, as used by the Netherlands, and methane calculations based on VS
(Volatile Solids) values used in calculation equations provided by IPCC. The reason is that
the Dutch maximum potential of CH
4production (Bo) is also expressed in terms of organic
matter content.
Data sources for the OM content of animal manure are described in Section 3.4, and data
sources for Bo and MCF in this Section (3.5). The Netherlands also uses country-specific
values for Bo and MCF in association with the OM contents.
Based on results of Dutch research on animal manure digestion, we use Bo = 0.25 for all
cattle manure and Bo = 0.34 m
3CH
4
per kg OM for all pig and poultry manure (Zeeman,
1994; Zeeman and Gerbens, 2002). These Bo values are presented in Table 3.7. The IPCC
Guidelines use slightly different values for Western Europe: for dairy cattle 0.24, for
non-dairy cattle 0.17 and for pigs 0.45 m
3CH
4per kg VS.
The IPCC Guidelines use the following default MCF values for storage of liquid manure:
MCF = 0 for storage time less than 1 month and MCF = 0.39 for storage time exceeding
1 month. This is a very crude approach, since the MCF value of 0.39 is based on a storage
time of 6 months with a manure temperature of 15 °C (Zeeman and Gerbens, 2002).
In the Netherlands animal manure is stored in cellars under the slatted floors in the animal
house and if that storage is full the manure is pumped into a storage facility outside the
animal housing. Storage times are different because in spring and summer animal manure is
applied to the field and temperature during storage changes over the year and temperature is
also different inside and outside the animal house.
A survey in the early 1990s showed that storage capacity inside the animal house was about
4 months and outside the animal house about 2 months (Van der Hoek, 1994; CBS, 1997).
Information about temperature profiles in manure storages is scarce and mostly based on
models (De Mol and Hilhorst, 2003, 2004).
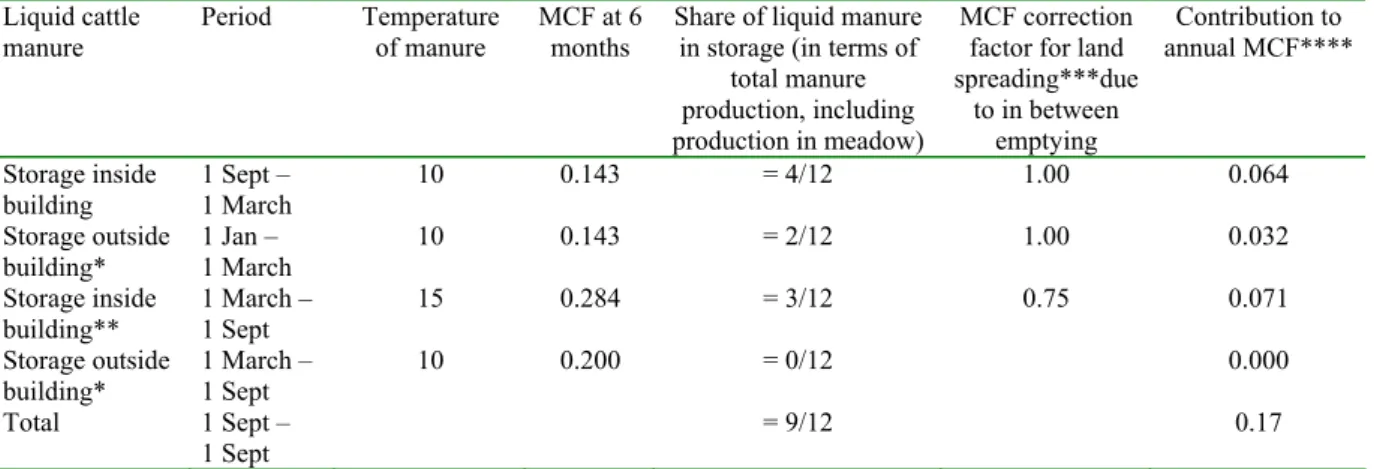
The following assumptions are made for the calculation of the MCF values for liquid cattle
and pig/poultry manure:
- all manure storage facilities are empty per 1 September;
- the storage inside the animal house is filled up first;
- the animal house per 1 January is filled to capacity with manure, and subsequently,
half of its content is transferred to a storage facility outside the animal house;
- all manure storage facilities are empty per 1 March.
This cycle is repeated from March 1 to September 1 with the exception of the storage
facilities being partly emptied before September 1; furthermore part of the cattle manure is
produced in the meadow (and not stored). Tables 3.5 and 3.6 give all the details on the
calculation of MCF values for liquid cattle and pig/poultry manure.
The IPCC Guidelines recommend MCF = 0.01 for stored solid cattle manure and MCF =
0.015 for stored solid poultry manure. However, the literature shows methane emissions from
stored solid cattle manure to be possibly higher (Amon et al., 2001). For this reason we set
the MCF value for stored solid cattle manure equal to the MCF for stored solid poultry
manure. The IPCC Guidelines recommend MCF = 0.01 for manure produced in the meadow
This value is also used in the Dutch methane emission inventory.
Table 3.5 Scheme for calculating the year-round MCF value for liquid cattle manure
Liquid cattle
manure
Period Temperature
of manure
MCF at 6
months
Share of liquid manure
in storage (in terms of
total manure
production, including
production in meadow)
MCF correction
factor for land
spreading***due
to in between
emptying
Contribution to
annual MCF****
Storage inside
building
1 Sept –
1 March
10 0.143 =
4/12
1.00
0.064
Storage outside
building*
1 Jan –
1 March
10 0.143 =
2/12
1.00
0.032
Storage inside
building**
1 March –
1 Sept
15 0.284 =
3/12
0.75
0.071
Storage outside
building*
1 March –
1 Sept
10 0.200 =
0/12
0.000
Total
1 Sept –
1 Sept
=
9/12
0.17
* This 2 month storage concerns manure that has been stored 4 months previously inside the building; in the case the
temperature of the manure in the outside storage is 5 °C lower than in the inside storage, we used 70% of the original MCF.
** 25% of the annual manure production is deposited in the meadow (= 3 months or 3/12). The remaining 75% is collected
in the storage, of which 50% in wintertime (= 6 months or 6/12, divided into 4/12 in storage inside and 2/12 in storage
outside) and 25% in summertime (= 3 months or 3/12).
The full summertime manure is collected in the animal housing because dairy cattle are milked inside the animal house;
secondly, male cattle is in the stable all year round.
*** For 1 March – 1 September a correction factor 0.75 is used because part of the manure is spread on the land beforehand.
**** The contribution to the annual MCF is calculated as:
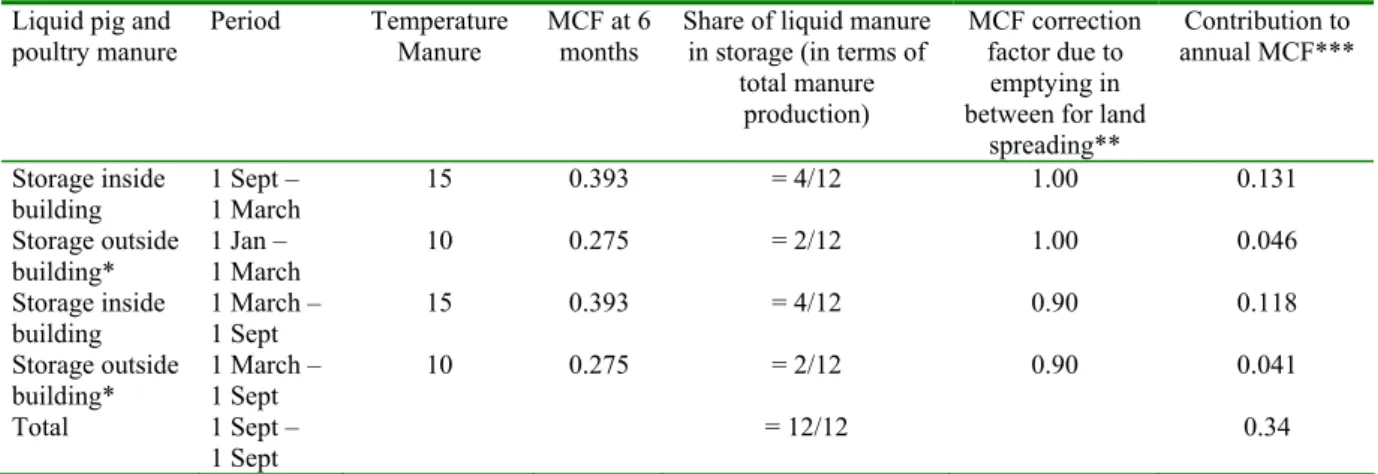
Table 3.6 Scheme for calculating the year-round MCF value for liquid pig and poultry manure
Liquid pig and
poultry manure
Period Temperature
Manure
MCF at 6
months
Share of liquid manure
in storage (in terms of
total manure
production)
MCF correction
factor due to
emptying in
between for land
spreading**
Contribution to
annual MCF***
Storage inside
building
1 Sept –
1 March
15 0.393 =
4/12
1.00
0.131
Storage outside
building*
1 Jan –
1 March
10 0.275 =
2/12
1.00
0.046
Storage inside
building
1 March –
1 Sept
15 0.393 =
4/12
0.90
0.118
Storage outside
building*
1 March –
1 Sept
10 0.275 =
2/12
0.90
0.041
Total
1 Sept –
1 Sept
=
12/12
0.34
* This 2 month storage is for manure that has been stored 4 months previously inside the building; in the case the
temperature of the manure in the outside storage is 5 °C lower than in the inside storage, we used 70% of the original MCF.
** For 1 March – 1 September a correction factor 0.90 is used because part of the manure is spread on the land beforehand.
*** The contribution to the annual MCF is calculated as:
Table 3.7 Overview of the Bo and MCF as used in the Dutch calculations. Bo is given as m
3CH
4per kg organic
matter; MCF is the actual methane emission as a fraction of the ultimate methane production under ideal
circumstances
Animal category
Liquid manure
Solid manure
Meadow
Bo
MCF
Bo
MCF
Bo
MCF
Cattle for breeding
Female young stock under 1 yr
0.25
0.17
0.25
0.01
Male young stock under 1 yr
0.25
0.17
0.25
0.01
Female young stock, 1-2 yr
0.25
0.17
0.25
0.01
Male young stock, 1-2 yr
0.25
0.17
Female young stock, 2 yr and over
0.25
0.17
0.25
0.01
Cows in milk and in calf
0.25
0.17
0.25
0.01
Bulls for service 2 yr and over
0.25
0.17
Cattle for fattening
Meat calves, for rosé veal production
0.25
0.14
Meat calves, for white veal production
0.25
0.14
Female young stock < 1 yr
0.25
0.17
0.25
0.01
Male young stock (incl. young bullocks) < 1 yr
0.25
0.17
Female young stock, 1-2 yr
0.25
0.17
0.25
0.01
Male young stock (incl. young bullocks), 1-2 yr
0.25
0.17
Female young stock, 2 yr and over
0.25
0.17
0.25
0.01
Male young stock (incl. young bullocks) ≥ 2 yr
0.25
0.17
Suckling cows (incl. fattening/grazing cows, ≥ 2 yr)
0.25
0.015
0.25
0.01
Ruminants, not cattle
Sheep (ewes)
0.25
0.015
0.25
0.01
Goats (mother animals)
0.25
0.015
0.25
0.01
Horses
0.25
0.015
0.25
0.01
Ponies
0.25
0.015
0.25
0.01
Pigs
Piglets
Fattening pigs
0.34
0.34
Gilts not yet in pig
0.34
0.34
Sows 0.34
0.34
Young boars not yet in service
0.34
0.34
Boars for service
0.34
0.34
Poultry
Broilers
0.34
0.015
Broilers parent animals under 18 weeks
0.34
0.015
Broilers parent animals 18 weeks and over
0.34
0.015
Laying hens under 18 weeks
0.34
0.34
0.34
0.015
Laying hens 18 weeks and over
0.34
0.34
0.34
0.015
Ducks for slaughter
0.34
0.015
Turkeys for slaughter
0.34
0.015
Turkeys parent animals under 7 months
0.34
0.015
Turkeys parent animals 7 months and over
0.34
0.015
Rabbits (mother animals)
0.34
0.015
Minks (mother animals)
0.34
0.015
Table 3.8 Overview of the emission factors for methane emissions from animal manure management as used in the Dutch calculations. The emission factor is given as kg CH
4per kg animal manure
Animal category 1990 1991 1992 1993 1994 1995 1996 1997 1998 1999 2000 2001 2002 2003
Manure production in animal houses
Cattle for breeding
Female young stock under 1 yr L 0.00169 0.00169 0.00169 0.00169 0.00169 0.00186 0.00186 0.00186 0.00186 0.00186 0.00180 0.00180 0.00180 0.00180 Male young stock under 1 yr L 0.00169 0.00169 0.00169 0.00169 0.00169 0.00186 0.00186 0.00186 0.00186 0.00186 0.00180 0.00180 0.00180 0.00180 Female young stock, 1-2 yr L 0.00169 0.00169 0.00169 0.00169 0.00169 0.00186 0.00186 0.00186 0.00186 0.00186 0.00180 0.00180 0.00180 0.00180 Male young stock, 1-2 yr L 0.00169 0.00169 0.00169 0.00169 0.00169 0.00186 0.00186 0.00186 0.00186 0.00186 0.00180 0.00180 0.00180 0.00180 Female young stock, 2 yr and over L 0.00169 0.00169 0.00169 0.00169 0.00169 0.00186 0.00186 0.00186 0.00186 0.00186 0.00180 0.00180 0.00180 0.00180 Cows in milk and in calf L 0.00169 0.00169 0.00169 0.00169 0.00169 0.00186 0.00186 0.00186 0.00186 0.00186 0.00180 0.00180 0.00180 0.00180 Bulls for service 2 yr and over L 0.00169 0.00169 0.00169 0.00169 0.00169 0.00186 0.00186 0.00186 0.00186 0.00186 0.00180 0.00180 0.00180 0.00180 Cattle for fattening
Meat calves, for rosé veal production L 0.00052 0.00052 0.00052 0.00052 0.00052 0.00052 0.00052 0.00052 0.00052 0.00052 0.00052 0.00052 0.00052 0.00052 Meat calves, for white veal production L 0.00035 0.00035 0.00035 0.00035 0.00035 0.00035 0.00035 0.00035 0.00035 0.00035 0.00035 0.00035 0.00035 0.00035 Female young stock < 1 yr L 0.00169 0.00169 0.00169 0.00169 0.00169 0.00186 0.00186 0.00186 0.00186 0.00186 0.00180 0.00180 0.00180 0.00180 Male young stock (incl. young bullocks) < 1 yr L 0.00169 0.00169 0.00169 0.00169 0.00169 0.00186 0.00186 0.00186 0.00186 0.00186 0.00180 0.00180 0.00180 0.00180 Female young stock, 1-2 yr L 0.00169 0.00169 0.00169 0.00169 0.00169 0.00186 0.00186 0.00186 0.00186 0.00186 0.00180 0.00180 0.00180 0.00180 Male young stock (incl. young bullock), 1-2 yr L 0.00169 0.00169 0.00169 0.00169 0.00169 0.00186 0.00186 0.00186 0.00186 0.00186 0.00180 0.00180 0.00180 0.00180 Female young stock, 2 yr and over L 0.00169 0.00169 0.00169 0.00169 0.00169 0.00186 0.00186 0.00186 0.00186 0.00186 0.00180 0.00180 0.00180 0.00180 Male young stock (incl. young bullocks) ≥ 2 yr L 0.00169 0.00169 0.00169 0.00169 0.00169 0.00186 0.00186 0.00186 0.00186 0.00186 0.00180 0.00180 0.00180 0.00180 Suckling cows (incl. fattening/grazing ≥ 2 yr) S 0.00035 0.00035 0.00035 0.00035 0.00035 0.00035 0.00035 0.00035 0.00035 0.00035 0.00037 0.00037 0.00037 0.00037
Manure production in meadow
Cattle for breeding
Female young stock under 1 yr M 0.00010 0.00010 0.00010 0.00010 0.00010 0.00011 0.00011 0.00011 0.00011 0.00011 0.00011 0.00011 0.00011 0.00011 Male young stock under 1 yr M 0.00010 0.00010 0.00010 0.00010 0.00010 0.00011 0.00011 0.00011 0.00011 0.00011 0.00011 0.00011 0.00011 0.00011 Female young stock, 1-2 yr M 0.00010 0.00010 0.00010 0.00010 0.00010 0.00011 0.00011 0.00011 0.00011 0.00011 0.00011 0.00011 0.00011 0.00011
Male young stock, 1-2 yr
Female young stock, 2 yr and over M 0.00010 0.00010 0.00010 0.00010 0.00010 0.00011 0.00011 0.00011 0.00011 0.00011 0.00011 0.00011 0.00011 0.00011 Cows in milk and in calf M 0.00010 0.00010 0.00010 0.00010 0.00010 0.00011 0.00011 0.00011 0.00011 0.00011 0.00011 0.00011 0.00011 0.00011
Bulls for service 2 yr and over
Cattle for fattening
Meat calves, for rosé veal production
Meat calves, for white veal production
Female young stock < 1 yr M 0.00010 0.00010 0.00010 0.00010 0.00010 0.00011 0.00011 0.00011 0.00011 0.00011 0.00011 0.00011 0.00011 0.00011 Male young stock (incl. young bullocks) < 1 yr
Female young stock, 1-2 yr M 0.00010 0.00010 0.00010 0.00010 0.00010 0.00011 0.00011 0.00011 0.00011 0.00011 0.00011 0.00011 0.00011 0.00011
Male young stock (incl. young bullock), 1-2 yr
Female young stock, 2 yr and over M 0.00010 0.00010 0.00010 0.00010 0.00010 0.00011 0.00011 0.00011 0.00011 0.00011 0.00011 0.00011 0.00011 0.00011 Male young stock (incl. young bullocks) ≥ 2 yr