RIVM report 711701040 / 2007
Human health risks due to consumption of vegetables from contaminated sites
Towards a protocol for site-specific assessment FA Swartjes, EM Dirven-Van Breemen, PF Otte, P Van Beelen, MGJ Rikken, J Tuinstra*,
J Spijker, JPA Lijzen
This investigation has been performed by order and for the account of the Ministry of Housing, Spatial Planning and the Environment (VROM) of the Netherlands, Directorate General for the Environment (DGM), Directorate of Soil, Water and Rural Areas (BWL), within the framework of project 711701, Risk in relation to Soil Quality.
RIVM, P.O. Box 1, 3720 BA Bilthoven, telephone: 31 - 30 - 274 91 11; telefax: 31 - 30 - 274 29 71
*
Royal Haskoning bv, Rotterdam
Present affiliation: Technical Soil Committee, The Hague
Contact: FA Swartjes
RIVM/Laboratory for Ecological Risk Assessment fa.swartjes@rivm.nl
Rapport in het kort
Gezondheidsrisico’s bij consumptie van groenten gekweekt op verontreinigde bodems. Naar een protocol voor locatie-specifieke beoordeling.
Om te kunnen bepalen of de consumptie van groenten die zijn gekweekt op verontreinigde bodems gezondheidsrisico’s met zich meebrengt, heeft het RIVM een procedure ontwikkeld. De procedure is stapsgewijze opgezet om een degelijke onderbouwing van de gegevens en een efficiënte werkwijze te waarborgen. Het principe is: simpel indien mogelijk, complex indien noodzakelijk. Als in een eerdere stap een risico kan worden uitgesloten, kan de procedure worden gestaakt. Zo niet, dan is een vervolgstap nodig. Daarin wordt de
beoordeling steeds specifieker op de omstandigheden van de locatie gericht. Op die manier leidt de procedure tot een realistischere uitkomst, maar hij wordt ook tijdrovender.
De procedure, die uit vier stappen bestaat, is als volgt. In stap 0, die voorafgaat aan de reken- en meetstappen, wordt de mogelijkheid ingeschat of de consumptie van groenten op een bepaalde locatie schadelijk kan zijn voor de gezondheid. In Stap 1 worden vervolgens de bodemgehalten van schadelijke stoffen gemeten en vergeleken met zogeheten Kritische
bodemgehalten (de waarden waarbinnen groenten telen veilig is). Stap 2 omvat een gedetailleerde bepaling van het locatie-specifieke gezondheidsrisico, op basis van
berekening. Ten slotte is in Stap 3 een gestandaardiseerd meetprotocol beschreven. Dat is
een richtlijn om op een locatie te bepalen welk typen groenten, en de hoeveelheid daarvan, het beste kunnen worden bemonsterd als indicatie voor de gezondheidsrisico’s.
Abstract
Human health risks due to consumption of vegetables from contaminated sites. Towards a protocol for site-specific assessment.
RIVM has developed an approach which allows human health risks of vegetable consumption from contaminated sites to be assessed. A tiered approach was used to guarantee the scientific basis and efficient use in practice. The underlying principle is: simple when possible and complex when necessary. If the risk can be eliminated in an early step, the assessment can be stopped. If not, assessment continues in the next tier, becoming more site-specific with each tier. This results in a more realistic, but also more time-consuming, assessment. The approach consists of four tiers that are laid out as follows. Tier 0, which precedes the calculation and measurement tiers, investigates the possibilities for experiencing adverse human health effects due to vegetable consumption. Subsequently, the soil concentrations of pollutants are measured in Tier 1 and compared with so-called Critical soil concentrations (for which vegetable consumption from contaminated sites is safe). Tier 2 offers the possibility for a
detailed assessment of the site-specific risks for human health on the basis of calculation.
Finally, Tier 3 shows a standardized measurement protocol. This protocol offers guidance and advice on the type and amount of crops that can be sampled in the field, thereby providing an indication for human health risks.
Acknowledgment
The authors would like to express their appreciation for the involvement of several colleagues in the project on accumulation of contaminants in vegetables. Ms. Annelike Dusseldorp (field testing) and Ms. Dr. Petra Krystek (analytical aspects) participated in the discussions on the protocol to measure contaminant concentrations in plants in the field. The input on
discussions on the plant – soil relations for metals (chapter 5) from Dr. Kees Versluijs is highly appreciated. Dr. Dick de Zwart was so helpful to translate an earlier version of the measurement protocol (chapter 9) from Dutch to English. Finally, the authors thank Dr. Willie Peijnenburg and Mrs. Ellen Brand for the useful peer review.
Contents
SAMENVATTING... 9 SUMMARY... 11 1. INTRODUCTION... 13 1.1 Objective ... 13 1.2 Requirements... 13 1.3 Tiered approach ... 142. HUMAN HEALTH RISKS DUE TO CONSUMPTION OF HOME-GROWN VEGETABLES ... 15
2.1 Human exposure... 15
2.1.1 Site-specific exposure... 15
2.1.2 Reference dose... 16
2.2 Critical soil concentration... 17
2.3 Evaluation of contaminant concentrations in vegetables... 18
2.3.1 Toxicological assessment ... 18
2.3.2 Other quality criteria... 19
2.4 Critical vegetable concentration (cadmium) ... 19
3. THEORY ON ACCUMULATION OF CONTAMINANTS IN PLANTS... 21
3.1 Representative concentration in plants ... 21
3.2 Characteristics of uptake... 21
3.2.1 Metals ... 22
3.2.2 Other inorganic contaminants... 23
3.2.3 Organic contaminants ... 23
3.3 Differences in accumulation between contaminants and plants... 24
3.3.1 Metals ... 24
3.3.2 Organic contaminants ... 26
3.3.3 Variation between plants ... 27
4. VEGETABLE CONSUMPTION ... 29 4.1 Introduction ... 29 4.2 Consumption rates ... 29 4.2.1 General population ... 29 4.2.2 Kitchen gardeners... 31 4.3 Consumption pattern ... 32
5. ACCUMULATION OF METALS IN VEGETABLES ... 35
5.1 Critical vegetable concentration (cadmium) ... 35
5.2 Experimental data in soils and vegetables... 36
5.2.1 The influence of soil properties ... 38
5.3 Calculation procedure... 39
5.3.1 BioConcentrationFactors (BCFs) ... 39
5.3.2 Plant – soil relations ... 40
5.3.3 Mixed model... 42
5.3.4 Soil type correction... 42
5.3.5 Vegetable-group-consumption-rate-weighted BCFs ... 44 5.3.6 Discussion ... 45 5.4 Cadmium... 48 5.4.1 Mixed model... 48 5.4.2 Vegetable-group-consumption-rate-weighted BCF... 49 5.4.3 Comparison ... 53
5.5 Critical soil concentrations for cadmium ... 53
5.6 Lead ... 55
5.7 Arsenic... 59
5.8 Other metals... 60
6. ACCUMULATION OF OTHER INORGANIC CONTAMINANTS IN VEGETABLES ... 63 6.1 Introduction ... 63 6.2 Present procedure ... 63 6.3 Cyanide... 64 6.4 Fluorine ... 65 6.5 Bromide... 66 6.6 Résumé ... 67
7. ACCUMULATION OF ORGANIC CONTAMINANTS IN VEGETABLES ... 69
7.1 Introduction ... 69
7.2 Calculation procedure... 70
7.2.1 Model description... 70
7.2.2 Model equations ... 72
7.3 Evaluation of important plant parameters and model concepts ... 76
7.3.1 Plant parameters ... 76
7.3.2 Root parameters... 78
7.3.3 Above-ground plant parts parameters... 80
7.5 Comparison of model estimations with measured data ... 82
7.5.1 Roots... 83
7.5.2 Above-ground plant parts ... 86
7.6 Résumé ... 90
7.6.1 Roots... 90
7.6.2 Above-ground plant parts ... 91
8. MEASURING THE AVAILABLE FRACTION IN SOIL ... 93
8.1 Introduction ... 93
8.1.1 Metals ... 93
8.1.2 Organic contaminants ... 94
9. MEASURING OF CONTAMINANTS IN VEGETABLES ... 97
9.1 Introduction ... 97
9.2 Field sampling procedures... 98
9.2.1 Preliminary investigation... 98
9.2.2 Properties and size of the sampling location ... 98
9.2.3 Types of plants and the quantity required for analysis ... 99
9.2.4 Quality restrictions ... 102
9.3 Sample pre-treatment in the laboratory... 102
9.3.1 Cleaning... 102
9.3.2 Fragmentation and homogenization of sub samples... 104
9.3.3 Storage of plant samples... 105
9.3.4 Drying of plant samples... 105
9.3.5 Grinding of dried samples ... 106
9.4 Proxy plant... 106
9.5 A seeding, growing harvesting program... 107
9.5.1 A field program ... 107
9.5.2 Vegetable selection... 107
9.5.3 Soil management ... 110
10. BASIS OF THE PROTOCOL ... 111
10.1 Layout... 111
10.2 Preliminary qualitative evaluation (Tier 0)... 112
10.3 Critical soil concentrations (Tier 1) ... 113
10.4 Site specific calculation (Tier 2) ... 114
10.5 Measurement (Tier 3) ... 115
11. CONCLUSIONS AND RECOMMENDATIONS ... 117
11.1 Conclusions ... 117
11.2 Recommendations ... 118
11.2.1 Short term ... 118
Samenvatting
Met het doel om zowel op degelijke onderbouwde als op efficiënte wijze de risico’s te
kunnen bepalen van het consumeren van groenten gekweekt op verontreinigde bodems is een stapsgewijze procedure ontwikkeld. In de lagere stappen wordt een meer conservatieve benadering gevolgd. In elke hogere stap wordt de beoordeling meer locatie-specifiek, realistischer en derhalve complexer. Als gevolg neemt in elke stap de complexiteit, en dientengevolge de benodigde inspanning en kosten toe. Als in een specifieke stap een onacceptabel risico voor de menselijke gezondheid niet kan worden weerlegd dient de bepaling in de volgende stap te worden uitgevoerd. Het onderliggende principe is: “simpel indien mogelijk en complex indien noodzakelijk”.
De stapsgewijze procedure is als volgt gestructureerd: Stap 0 betreft een voorafgaande kwalitatieve evaluatie van de mogelijkheden of het consumeren van groenten tot negatieve effecten op de gezondheid kan leiden. In Stap 1 worden de gemeten totale bodemgehalten (gemiddelden of relatief hoge waarden) vergeleken met Kritische bodemgehalten (alleen voor cadmium). Deze Kritische bodemgehalten zijn afgeleid op basis van een conservatief
blootstellingsscenario. Stap 2 biedt de mogelijkheid voor een gedetailleerde bepaling van het
locatie-specifieke risico op basis van berekening. Uiteraard verschilt de locatie-specifieke
berekening van het contaminant-gehalte in groenten voor metalen, overige anorganische contaminanten en organische contaminanten. Voor metalen zijn Freundlich-achtige plant - bodem relaties (afhankelijk van het totaalgehalte en de belangrijkste bodemeigenschappen) en geometrisch gemiddelden van de BioConcentratieFactoren (gecorrigeerd voor organisch stof- en kleigehalte) gecombineerd. De accumulatie van overige anorganische contaminanten is gebaseerd op passieve opname. De berekening van de concentratie van organische
contaminanten in groenten is gebaseerd op een aangepast Trapp en Matthies model. In dit model wordt de partitie van contaminanten tussen het poriewater en de plantenwortels en vervolgens de verplaatsing naar de bovengrondse plantendelen berekend, resulterend in het contaminant-gehalte van de bovengrondse plantendelen. Tenslotte is in Stap 3 een
gestandaardiseerd meetprotocol beschreven. Met dit protocol kan in het veld een significant
aantal representatieve groenten worden bemonsterd, waarvan de eetbare gedeelten worden voorbehandeld in het laboratorium in analogie met de gangbare keukenpraktijk. De gemeten concentratie in groenten kan vervolgens worden ingevoerd in een blootstellingsberekening en indien van toepassing worden getoetst aan toelaatbare concentraties in groenten.
Als belangrijkste onderzoeksaanbevelingen voor de toekomst gelden het uitbreiden van de RIVM plant – bodem dataset voor metalen en het uitvoeren van een uitgebreide
validatiestudie. Nut voor het beleid
De procedure voor de bepaling van de locatie-specifieke humane risico’s ten gevolge van consumptie van op verontreinigde bodems geteelde groenten kan dienen als ondersteuning bij
het bodembeheer in geval van de bodemgebruiksvormen “Moestuin/Volkstuin” en “Wonen met tuin”. Bovendien dient het protocol te worden geïntegreerd in de algemene procedure van (stapsgewijze) bepaling van de locatie-specifieke humane risico’s ten gevolge van
blootstelling aan verontreinigde bodems. Deze algemene procedure zal onderdeel uit gaan maken van de inhoudelijke basis van de Wet bodembescherming, welke momenteel wordt herzien. Nieuwe toepassingen betreffen het Saneringscriterium en Locale Ambities voor bodemkwaliteit.
Summary
To be able to assess the human health risks of vegetable consumption from contaminated sites in a scientifically-based and efficient way a tiered approach has been developed. Successively, in each tier the degree of conservatism decreases, while site-specificism increases. As a consequence, complexity and hence effort and finances needed also increase in each tier. When in a specific tier an unacceptable human health risk can not be rejected the assessment in the following tier has to be performed. The underlying principle is: simple when possible and complex when necessary.
The tiered approach is laid out as follows: Tier 0 concerns a preliminary qualitative
evaluation of the possibilities for experiencing adverse human health effects due to vegetable consumption. In Tier 1 the actual total soil concentrations (average or relatively high values) are compared with Critical soil concentrations (for cadmium only). These Critical soil concentrations have been derived on the basis of a conservative exposure scenario. Tier 2 offers the possibility for a detailed assessment of the site-specific risks on the basis of
calculation. Obviously, the site-specific calculation of the contaminant concentration in
vegetables differs for metals, other inorganic contaminants and organic contaminants. For metals Freundlich-type plant - soil relations (dependent of the total soil concentration and the major soil properties) and geometric means of the BioConcentrationFactors (corrected for organic matter and clay contents) are combined. The accumulation of other inorganic contaminants is based on passive uptake. The calculation of the concentration of organic contaminants in vegetables is based on an adapted Trapp and Matthies model. In this model the partitioning of contaminants between pore water and roots and subsequently translocation to the upper plant parts is calculated, resulting in the contaminant concentration in the above-ground plant parts. Finally, in Tier 3, a standardized measurement protocol has been
developed. This protocol allows for sampling of a significant number of representative vegetables in the field, for which the edible parts of the plants are treated in the laboratory in analogy with standard kitchen preparation. Subsequently, the measured concentration can be used in an exposure calculation and, when appropriate, compared to acceptable
concentrations in vegetables.
The most important recommendations for future research are extension of the database for metals and the performance of a comprehensive validation study.
Contribution to Dutch soil policy
The procedure to assess the site-specific human health risks assessment for consumption of vegetables from contaminated sites can be used to support planning or soil management in relation to the soil uses “Vegetable garden” and “Residential sites with garden”. Moreover, the protocol should be incorporated in the general procedure on the (tiered) procedure to assess the site-specific human health risks due to exposure to contaminated sites. This general procedure will be included in the technical basis of the Dutch Soil Protection Act, which act
is presently under revision. New applications concern the Remediation criterion and the Local Ambitions for soil quality.
1.
Introduction
1.1
Objective
This study is focused on the site-specific human health risk assessment related to
consumption of vegetables from contaminated sites. The following objective is recognized:
Development of the basis for a protocol which allows site-specific assessment of the human health risks for consumption of vegetables from contaminated sites.
The protocol should be applicable for the following situations:
• vegetable gardens;
• residential sites with gardens that offer the possibility of home-grown vegetables;
• undeveloped or fallow sites that will be taken into development and future land-use enables the possibility for vegetable cultivation.
Besides the model algorithms for the exposure pathway “exposure due to vegetable
consumption” in the CSOIL exposure model must be improved. These model algorithms are
part of the protocol.
1.2
Requirements
The protocol should be applicable for site-specific risk assessment1 and focuses on metals, other inorganic contaminants and organic contaminants. In the framework of the revision of the Dutch Soil Protection Act (Ministry of VROM, 2003) it must be turned into a user-friendly protocol. Possibly it will be incorporated into a protocol to assess the site-specific risks for human health from a wider perspective. This protocol will replace the present standardized procedure to assess the site-specific risks for human health as included in the procedure to determine the urgency of remediation (Koolenbrander, 1995).
A primary requirement is a sound scientific basis of the protocol and the model algorithms. However, the protocol should also enable a practical, efficient and uniform application. A crucial factor in relation to the risks of vegetable consumption is the “representative concentration” in vegetables that grow, or could grow, on a contaminated site. It is generally accepted that the assessment of this representative concentration on the basis of a calculation or on the basis of a measurement involves a limited reliability. Therefore the protocol offers the possibilities in higher tiers for calculating as well as measuring this concentration.
1.3
Tiered approach
With the purpose to optimise the balance between quality and practicability the protocol is based on a tiered approach. This tiered approach includes the possibility for fast screening in case of a clear decision and only compels an intensive effort when necessary (“easy when possible, more complex when necessary”). The following assessment steps will be
investigated for inclusion in different tiers:
• a preliminary qualitative evaluation of the possibilities for experiencing adverse human health effects due to vegetable consumption;
• comparison of measured soil concentrations (average or relatively high values) with
Critical soil concentrations;
• a detailed assessment of the actual risk on the basis of a site-specific risk calculation; • a standardized measurement protocol for sampling and testing of a significant number of
representative vegetables in the field.
2.
Human health risks due to consumption of
home-grown vegetables
The risks for human health depend on exposure and the effects in the human body that follow exposure.
2.1
Human exposure
2.1.1 Site-specific exposure
The exposure to humans largely depends on two factors: the amount of vegetables consumed and the concentration of contaminants in these vegetables. Chapter 4 focuses on the amount of vegetables consumed. The determination of a representative concentration of contaminants in the vegetables is extensively described in chapters 5 (metals), 6 (other inorganic
contaminants) and 7 (organic contaminants).
The calculation of exposure is rather straightforward:
W
f f
C Q
Exposurevegetables =
∑
vegetablei × vegetablei× home−grown× bioavailability Eq. 2.1in which
Exposurevegetables Exposure due to vegetable consumption [mg/kgbody weight/d]
Qvegetable i Consumption rate of vegetable i [kgdw/d]
Cvegetable i Contaminant concentration in vegetable i [mg/kgdw]
fhome-grown Fraction of vegetables that is home-grown [-]
fbioavailability Correction for relative bioavailability in the human body [-]
W Body weight [kgbody weight]
In almost all European exposure models this pathway is included (Carlon, in prep.), like for example in the Dutch CSOIL exposure model (Van den Berg, 1991/ 1994/1995; Otte et al., 2001). This model is also used to derive the human toxicological-based part of the Dutch Intervention Values.
The specification of the fraction of vegetables that is home-grown, fhome-grown, partly concerns
a political decision. Usually, this fraction is not specified for each vegetable separately. In the Netherlands the following default data are used for this fraction, depending on site use: • “Residential site, with garden”: 10%
The differentiation of the fraction of vegetables that is home-grown between potatoes and other vegetables is made, because it is not realistic to use a value of 100% for potatoes. Because consumption rate for potatoes is rather high, an exceptionally large vegetable garden would be needed.
No decent statistics on the amount of the fraction of vegetables that is home-grown in the Netherlands exist. Besides, this fraction will differ between cities and rural areas. The values given above mainly concern a political decision: “the soil quality must offer the possibility to consume at least a specified percentage of vegetables from the own garden”. Since it is a sensitive parameter, it is recommended to further investigate the fraction of vegetables that is home-grown in the Netherlands, in the future.
At this moment no information on the differences between intake and uptake of contaminants via a vegetable matrix exists. Therefore, the correction for bioavailability in the human body, fbioavailability, in this protocol is like in any other existing exposure model, 1.0.
To assess the risk due to vegetable consumption it is essential to include exposure due to soil ingestion in most cases, because hand-mouth contact is relatively intensive during gardening.
2.1.2 Reference dose
With the purpose to judge the risk due to exposure, the actual exposure must be compared to a Reference dose (or acceptable or critical exposure; in the Dutch Soil Protection Act: Maximum Permissible Risk for intake; MPRhuman). To derive values for this Reference dose a distinction
has been made between non-threshold contaminants (genotoxic carcinogens) and threshold contaminants (non-carcinogens and non-genotoxic carcinogens) (Baars et al., 2001). For the threshold contaminants, a Reference dose can be derived for which no adverse effects for humans are likely to occur in cases where this exposure is not exceeded. For the non-threshold contaminants even the lowest exposure rate results in an increased chance of adverse effects for humans.
For non-genotoxic carcinogens and non-carcinogenic contaminants (threshold contaminants), the toxicological Tolerable Daily Intake (TDI) is taken as the Reference dose (Maximum Permissible Risk for intake; MPRhuman). A TDI is the threshold exposure of a contaminant to
which humans can be orally exposed daily on the basis of body weight without experiencing adverse effects on health. For genotoxic carcinogens (non-threshold contaminants), the Reference dose (MPRhuman) is defined as the dose of a contaminant (based on body weight for
oral intake or air volume for inhalative intake) which forms a risk of one additional case of lethal tumour in 10,000 lifelong exposed individuals. This definition is based on a political decision (Ministry of VROM, 1988).
An overview of the most recent values of the Reference dose in the Netherlands is found in Baars et al. (2001).
2.2
Critical soil concentration
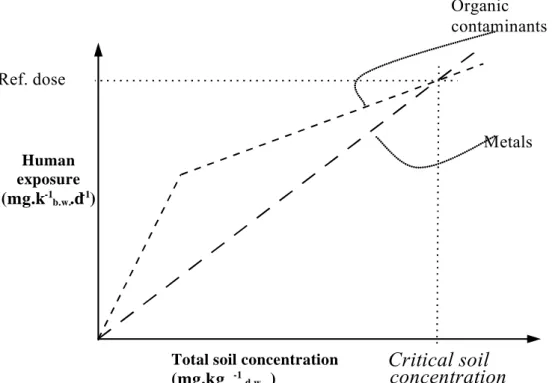
A Critical soil concentration can be derived on the basis of exposure and Reference dose. The definition of a Critical soil concentration is: the soil quality resulting in an exposure equal to the Reference dose (see Figure 2.1). In this figure the lifelong-averaged exposure is given for metals and organic contaminants, according to the so-called standardized exposure scenario. Note that only exposure of similar type (i.e. oral or inhalative) should be combined. Soil quality standards, for example the Serious Risk Concentration as one of the two pillars of the Dutch Intervention Values (Swartjes, 1999) are examples of Critical soil concentrations.
Critical soil
concentration
Total soil concentration (mg.kg -1 d.w. ) Human exposure (mg.k-1 b.w. .d -1) Ref. dose Metals Organic contaminants
Fig. 2.1: Derivation of a Critical soil concentration.
An exposure scenario must be defined to describe the conditions that are suitable for a specific type of Critical soil concentration. Because in this study Critical soil concentrations are used in an early stage of the tiered approach a rather conservative exposure scenario is appropriate. This conservative exposure is based on:
• higher consumption rates for kitchen gardeners than for the general population (see section 4.2.2);
• a high contribution of vegetable consumption from the contaminated site: 50% of the potatoes and 100% of the other vegetables;
• a BioConcentration Factor (BCF) for conservative soil properties (relatively high plant uptake).
However, in the Netherlands background exposure is not incorporated in most applications (except for the Remediation criterion, i.e. relating to good soil quality after remediation). This is a political decision. Also for the assessment of risks due to vegetable consumption, as proposed in this study, calculated exposure is compared to the Reference dose, not considering background exposure. From a medical viewpoint this is a non-conservative approach.
Since calculation of the concentration in vegetables is relatively unreliable, certainly at low soil concentrations, Critical soil concentrations could also be derived from measured data. When, for example, the concentration in vegetables is plotted against the soil concentration, a Critical soil concentration could graphically be derived from a Critical vegetable
concentration.
2.3
Evaluation of contaminant concentrations in vegetables
2.3.1 Toxicological assessment
The human health risks of measured concentrations of contaminants in vegetables could be evaluated in analogy with the derivation of Critical soil concentrations (section 2.2). As a first step a relevant exposure scenario must be defined. As starting point either a standard
“Residential site with garden” or “Vegetable garden” scenario can be selected from the CSOIL exposure model. If appropriate, these standard scenarios could be adapted to local circumstances. In the next step the calculated or measured concentration in vegetables must be entered in CSOIL. Finally, the resulting exposure is evaluated against the Maximum Permissable Risk for human exposure (MPRhuman). To this purpose it is tested whether the
sum of the oral (inclusive dermal) and inhalative risk indexes is less than or equal to 1:
(Σ oral exposure/ MPRhumanoral)+(Σ inhalative exposure/ MPRhumaninhalative) ≤ 1? Eq. 2.2
In which:
MPRhumanoral Maximum Permissible Risk for oral intake [mg/kgbody weight/day]
MPRhumaninhalative Maximum Permissible Risk for inhalative intake [mg/kgbody weight/day]
In that case there are no unacceptable risks. When the sum of the oral (including dermal) and inhalatory risk indexes exceeds 1 a next step in the tiered approach must be followed or, when in the final tier, there is an “unacceptable risk” for human health.
Usually exposure to one specific contaminant is considered (no combined exposure). This is a limitation of the protocol described in this report.
2.3.2 Other quality criteria
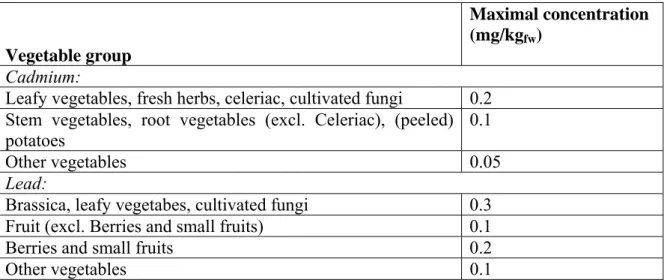
In case of commercial vegetable production, the contaminant concentrations in crops must be additionally compared to appropriate food quality criteria, according to the Commission Regulation (EC) No 466/2001 (EC, 2004). In Table 2.1 the appropriate food quality criteria are given for cadmium and lead, two important metals in regard to human health effects due to vegetable consumption. Unfortunately, food quality criteria for arsenic, also an important metal in regard to human health effects due to vegetable consumption, are missing in this regulation.
Vegetable group
Maximal concentration (mg/kgfw)
Cadmium:
Leafy vegetables, fresh herbs, celeriac, cultivated fungi 0.2 Stem vegetables, root vegetables (excl. Celeriac), (peeled) potatoes
0.1
Other vegetables 0.05
Lead:
Brassica, leafy vegetabes, cultivated fungi 0.3
Fruit (excl. Berries and small fruits) 0.1
Berries and small fruits 0.2
Other vegetables 0.1
Table 2.1: Food quality criteria for cadmium and lead, according to the Commission Regulation (EC) No 466/2001
2.4
Critical vegetable concentration (cadmium)
When consuming vegetables with an average concentration below a Critical vegetable
concentration, human health effects are unlikely. This Critical vegetable concentration can be calculated using the procedure described in section 2.2, with exposure equals the Reference dose (Maximum Permissible Risk for intake, MPRhuman). Under the assumption that exposure
through vegetable consumption is the dominant exposure pathway, which is the case for e.g. cadmium, it follows from Eq. 2.1:
ility bioavailab grown e hom i vegetable human vegetable f f Q W MPR CR C
∑
× × × = − Eq. 2.3 in whichCvegetableCR Critical vegetable concentration [mg/kgdw]
MPRhuman Maximum Permissible Risk for intake [mg/kgbody weight/day]
Qvegetable i Consumption rate of vegetable i [kgdw/d]
fhome-grown Fraction of vegetables that is home-grown [-]
fbioavailability Correction for relative bioavailability in the human body [-]
3.
Theory on accumulation of contaminants in plants
The “representative concentration” in plants is the combined result from uptake, transport, accumulation and possibly degradation of contaminants. In this paragraph an overview is given of the characteristics of the major processes.
3.1
Representative concentration in plants
A “representative concentration” refers to the amount of a contaminant (metals, other inorganic contaminants or organic contaminants) that humans are exposed to when
consuming these vegetables. This implies that attention is focused on the concentration in or on the edible parts of the vegetables at the moment that these vegetables are harvested and after these vegetables have been prepared (washing, peeling) in a “conventional” way.
3.2
Characteristics of uptake
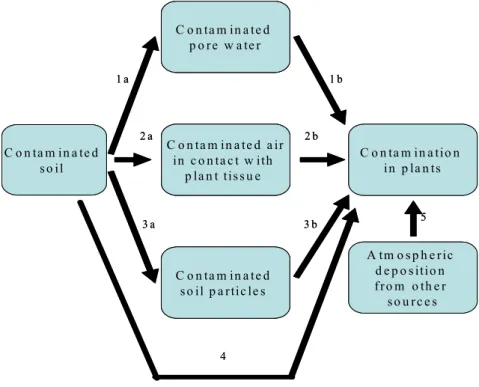
Figure 3.1 shows the pathways for uptake of contaminants into vegetables.
C o n ta m in a te d s o il C o n ta m in a tio n in p la n ts A tm o s p h e ric d e p o s itio n f ro m o th e r s o u r c e s C o n ta m in a te d s o il p a rtic le s C o n ta m in a te d p o r e w a te r C o n ta m in a te d a ir in c o n ta c t w ith p la n t tis s u e 1 a 1 b 2 a 2 b 3 a 3 b 4 5 C o n ta m in a te d s o il C o n ta m in a tio n in p la n ts A tm o s p h e ric d e p o s itio n f ro m o th e r s o u r c e s C o n ta m in a te d s o il p a rtic le s C o n ta m in a te d p o r e w a te r C o n ta m in a te d a ir in c o n ta c t w ith p la n t tis s u e C o n ta m in a te d s o il p a rtic le s C o n ta m in a te d p o r e w a te r C o n ta m in a te d a ir in c o n ta c t w ith p la n t tis s u e 1 a 1 b 2 a 2 b 3 a 3 b 4 5
Figure 3.1: Pathways for contaminant uptake in vegetables.
Root uptake via pore water (1a, 1b); foliar uptake via air (2a, 2b); uptake via rain splash (3a, 3b); direct uptake (4); atmospheric deposition from other sources (5).
Uptake through the roots via the pore water (route 1a and 1b) is the dominant pathways. Other pathways are less important (uptake through the leaves, via the air (organic
contaminants only, route 2a and 2b; uptake via rain splash: route 3; direct uptake: route 4) or not related to contaminated soil (atmospheric deposition from other sources: route 5).
Roots are primary organs for the contact with ions and uptake from soil. Root uptake can vary with the soil properties, water content of the soil, as well as plant characteristics such as type of root system and lipid content (Paterson and Mackay, 1994). The soil zone
surrounding the roots is called the rhizosphere. In the rhizosphere there is a large influence of the plant roots on the soil properties. Plant roots excrete CO2 and organic substances which
can decrease the pH and increase microbial activity.
Contaminants in the pore water may reach the root surface by mass flow, penetrate the root, enter the xylem and be transported in the transpiration stream. Once in the transpiration stream, chemicals may be metabolized (detoxified) by plant enzymes, or escape by gaseous diffusion through stomata in leaves. Climatic conditions as temperature and rainfall
determine plant transpiration rates, which in turn control the rates of water movement to the root surface and in the xylem.
Organic contaminants also enter vegetation from the atmosphere by gasphase and particle -phase deposition onto the waxy cuticula or through the stomata of the leaves and are
translocated by the phloem. However, from the perspective of soil quality assessment only the contaminants that originate from soil are relevant.
Soil and dust particles can be deposited on the plant by wind or rain (also called rain splash or soil resuspension). Even after washing, a significant fraction of the attached contaminant particles may stick to the leafs, e.g. circa 50% for lead (Meeuwissen, 1989). The contribution to the representative plant concentration is difficult to estimate and depends on many factors (e.g. the geometry of the plant, soil type).
Other factors affecting the differences in uptake of metals, other inorganic contaminants and organic contaminants concern the heterogeneity of contaminants in the soils (e.g. Miller et al. (2004) for cadmium in lettuce) and the heterogeneity of nutrient supply (e.g. Haines (2002) for zinc in Thlaspi caerulescens). Also dilution by growth will influence the concentration in
the plant.
3.2.1 Metals
Each metal has a different affinity for plant uptake. In general, cadmium or zinc uptake, for example, is higher than mercury or lead uptake. Partitioning processes determine the uptake of metals in the root zone of plants. It is widely recognised that the total soil concentration is an inappropriate parameter for crop uptake (e.g. McLaughlin et al., 2000). The soil
properties, which determine the fraction available in the pore water are very important for plant uptake. Most of the metals are more available at lower soil pH. However, some
metalloids (like arsenic) form oxyanions in solution, which show a stronger sorption at lower pH (McLaughlin et al., 1998). Other soil properties that control the availability for metals in the pore water and hence uptake by plants, are the organic matter content, clay content and the presence of (hydr)oxides of manganese, iron and aluminium. Also the availability of soil nutrients plays a role in regard to plant uptake.
The fungi and bacteria in the rhizosphere can also have a strong impact on metal uptake (Kleikamp and Joergensen, 2006). This uptake is also influenced by the lowering of the pH by the excretion of CO2 and organic acids. Smolders and McLaughlin (1996) investigated the
cadmium uptake in Swiss chord [Beta vulgaris ssp. cicla (L.) Koch, cv. Fordhook Giant) in
the presence of chloro-complexes of cadmium, while the activity of cadmium [2+] in solution was buffered during plant growth. They showed that when solution chloride concentration increased, cadmium concentrations in plant shoots and roots also increased. Another factor influencing sorption and, hence, plant uptake are the redox conditions in the soil affecting the form and reactivity of some soil oxides (e.g. McLaughlin et al., 1998).
There are several active detoxification mechanisms for the plant to defend against excess heavy metal loads in the soil, for example metallothionines synthesis, or enzymatic synthesis of phytochelatines.
3.2.2 Other inorganic contaminants
The group of other inorganic contaminants is a rather heterogeneous group. Not much attention has been focused on the accumulation of other inorganic contaminants in plants, except for compounds that are typically used in agricultural practise like nitrogen and phosphate. In respect to local soil contamination, however, the most relevant representatives of this group concern cyanides and to a lesser extent chloride, bromide and fluorine
compounds2.
Although the group is relatively heterogeneous, a general characteristic of many
representatives is that they dissolve easily in pore water and, hence, are well available to for root uptake by plants.
3.2.3 Organic contaminants
Uptake from soil is a passive process for most organic contaminants. Uptake in roots is governed by physical sorption. Water-soluble contaminants that pass the membranes in the roots are transported to the leaf in the transpiration stream in the xylem of the plants. The foliar uptake via the gas phase is often neglected. In general, air concentrations are too low to result in a significant uptake, because of dilution by the wind. Nevertheless, for closed vegetation close to the ground (e.g. grasses, lettuce) and high soil concentrations, foliar uptake can play a (minor) role. For PAHs the internal concentration measurements give an indication that the concentrations in the foliage of terrestrial plants are mainly the
2 At present no Intervention Values have been formulated for these compounds (Min. of VROM, 2000). The
consequence of uptake of atmospheric PAHs. However, only a limited part of these PAHs originate from soil contamination.
Elimination of an organic contaminant may take place in the leaf tissue by metabolism or photolysis. In plant metabolism organic chemical contaminants are metabolically
transformed. Plants have evolved contaminant-specific detoxification (metabolic) pathways and can enzymatically oxidise, reduce, or hydrolyse organic contaminants. The products of these transformation reactions are attached to water-soluble parts, that are removed from the cytoplasm, either by transport into vacuoles or by conversion into insoluble complexes with the cell wall (a process called “lignification”) (Sandermann, 1992). Certain reports in the literature suggest that mineralization of organic contaminants within plant tissues may be possible.
Physicochemical properties that may influence plant uptake of organic contaminants include water solubility, vapour pressure, Henry’s Law constant and hydrophobicity.
3.3
Differences in accumulation between contaminants and
plants
3.3.1 Metals
There are plants which can accumulate large amounts of heavy metals in above-ground plants and roots and those which are not effective in the uptake of heavy metals. The former type of plants can sometimes be used for phytoremediation. Plants like Brassicaceae (cabbage), Poaceae (grasses), Papilonaceae (pods) are known as good phytoremediating families
(Gawronski, 2000). Some plants are extremely tolerant for soil metals. These plants grow in areas where natural ores of heavy metals occur in the upper layers of the soil. A well-known example of a heavy metal adapted plant is the zinc violet.
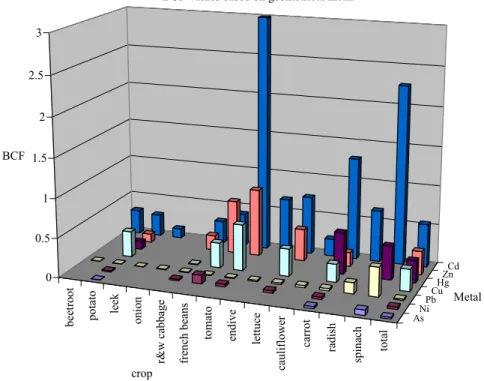
A BCF (BioConcentrationFactor) is traditionally used to describe the ratio between the concentration of (the edible part of) the plant and the soil concentration (for details see section 5.1). These BCF values, however, are not a constant value for a specific metal in a specific vegetable, but vary with soil properties and type of plants, among others. Therefore, generic BCFs can only be considered as an indicator for the affinity for plant uptake of a specific metal. Details on the limitations of a generic BCF are also given in section 5.1. In Figure 3.2 the geometric mean of the BCFs for arsenic, cadmium, cupper, lead, mercury, nickel and zinc are given from the RIVM plant –soil database, for several relevant vegetables. From this figure it can be concluded that the affinity for accumulation of different metals differs substantially. Generally the plants exclude metals like arsenic and nickel giving low BCF values. Cadmium however shows a relatively high accumulation for all vegetables. For the derivation of the human health based risk limits of the revised Intervention Values, exposure due to vegetable consumption is important for all metals (Lijzen et al., 2001). The contribution of exposure due to vegetable consumption to total exposure is very high for
cadmium (93%) and cobalt (96%) and varies between 80% and 90% of total exposure for copper, mercury, molybdenum and zinc. For the other metals this contribution is also substantial: for nickel 55%, for barium 42%, for lead 31% and for arsenic 28%. For most metals, however, ecological effects are far more critical than effects on human health. An exception is lead (ecological and human health risk limits are of the same order of
magnitude) and cadmium (ecological risk limit is two times more stringent than human health risk limit), and to a lesser extent arsenic, mercury and molybdenum (ecological risk limits are circa eight times more stringent). For the other metals the ecological risk limits are in
between one and two orders of magnitude more stringent than the human health risk limits. When the frequency of occurrence of the different metals is also taken into account, the exposure pathway vegetable consumption, and hence, the determination of a representative vegetable concentration, is mainly important for cadmium and lead and, to a lesser extent, arsenic, mercury, nickel, barium and molybdenum.
Moreover, Figure 3.2 shows that accumulation of metals can vary with one or two orders of magnitude between different types of vegetables. The BCFs are the highest for fast growing leafy vegetables, as spinach and endive. The high BCF values for tomatoes are surprising. Maybe these BCFs have been determined by low metal concentrations and soil properties that stimulate plant uptake.
bee tr oot po tato leek on io n r&w ca bbag e fr en ch be ans
tomato endive lettuce
caulifl ow er carro t ra di sh spina ch to ta l As NiPb CuHg ZnCd 0 0.5 1 1.5 2 2.5 3 BCF crop Metal BCF-values based on geometrical mean
As Ni Pb Cu Hg Zn Cd
Figure 3.2: Geometrical mean of BCFs (BioConcentrationFactors) from the RIVM plant – soil database, for seven metals and for several relevant vegetables
3.3.2 Organic contaminants
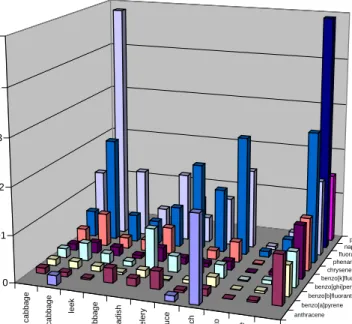
Plant species vary in root lipid content, uptake mechanism (e.g. diffusion or advection) and anatomy, so uptake of organic contaminants is also vegetable-dependent. Moreover, different varieties within certain plant species can also account for large differences. Contaminant concentrations in plants should be normalized to the lipid content of the plants or its leave surface area, especially when directly comparing different species and tissues (Simonich and Hites, 1995). As a consequence the variation between the BCFs of different plants can be large. In zucchini and pumpkin, for example, two orders of magnitude higher concentrations of PCDD/PCDF are found than in other fruits and vegetables (cucumber). As an example the variation between the BCFs for PAHs for different relevant vegetables is illustrated in Figure 3.3. c h in es e c a b bag e g ree n c a bba ge lee k tu rni p c a bbag e radi s h ce le ry lettuce s p inac h to m a to la mb 's le tt u c e ca rr o t anthracene benzo[a]pyrene benzo[b]fluoranthene benzo[ghi]perylene benzo[k]fluoranthene chrysene phenanthrene fluoranthene naphtalene pyrene 0 0.01 0.02 0.03 0.04 0.05 crop PAH Average BCF values (dryweight)
anthracene benzo[a]pyrene benzo[b]fluoranthene benzo[ghi]perylene benzo[k]fluoranthene chrysene phenanthrene fluoranthene naphtalene pyrene
Figure 3.3: BCFs (BioConcentrationFactors) for PAHs, for several relevant vegetables.
Furthermore, Fig. 3.3 shows that accumulation of the different PAHs varies substantially. For the derivation of the human health based risk limits of the revised Intervention Values contribution of exposure due to vegetable consumption to total exposure is very high for several organic contaminants (Lijzen et al., 2001). The contribution of exposure due to vegetable consumption to total exposure is over 90% for several aromatic compounds (phenols, catechol, resorcinol and hydroquinone), for some chlorinated compounds
(hexachlorobenzene, pentachlorophenol, several PCBs, chlorophenols) and for several
pesticides (DDT, DDE, aldrin, carbofuran, propoxur, atrazine, di(2-ethylhexyl)phthalate). For many dioxins this contribution is close to 80%.
3.3.3 Variation between plants
The former sections showed a huge variation in accumulated contaminant concentrations between different plant species (interspecies variation), for both metals and organic
contaminants. However, Stenz et al. (1997) show that the metal concentrations in different samples from the same vegetable type (intraspecies variation) from the same plot can differ widely, mainly for cadmium (minimum and maximum values differ often more than one order of magnitude). Alonso et al. (2003) showed large differences for copper and zinc uptake between different samples of the same edible mushrooms species. Also Ruttens (2006a) refers to large intraspecies differences. However, it is generally unknown how this variation relates to the variation in accumulated contaminant concentrations for different plants of the same plant species. This information is important in regard to the number of data needed on soil and plant concentrations for a specific plant species, to be able to derive reliable models that enable calculation of the representative concentration in crops.
Moreover, it is important for the field measurement protocol, because it supports the decision on whether to sample many different plants species or (also) many samples for the same plant species. Therefore, it is recommended to further investigate the variation in accumulated concentrations in plants between different plants species versus the variation in accumulated concentrations between plants of the same plant species, in the future.
Besides, the relation between accumulated concentrations in vegetables and in non-edible plants must be further investigated, in the future. When accumulation in non-edible plants represents accumulation in vegetables, data on non-edible plants can be included in the RIVM plant – soil database which forms the basis of the models to calculate accumulated concentrations in vegetables. Besides it would offer more possibilities in field sampling.
4.
Vegetable consumption
4.1
Introduction
To be able to determine the “representative concentration” in vegetables, the type of vegetables that are relevant for the development for the protocol must be selected. Because the protocol should be applicable for site-specific risk assessment it is an option to focus on the vegetables that are growing on that specific site at the moment of the assessment. However, this assumption is not always appropriate, for the following reasons:
• These vegetables are not always representative for the long time “representative
concentration”, because the type of vegetables might change every few years.
• On many contaminated sites no (representative) vegetables are present.
Besides, the policy on soil contamination is often related to “the possibility to grow
vegetables without experiencing adverse effect on human health”. This political basic requirement implies that, independent of the vegetables that are growing on the site, the attention should be focused on a “representative consumption pattern”.
Relevant Dutch vegetables are potato, carrot, beet, radish, onion, tomato, cucumber,
cauliflower, cabbage, lettuce, spinach, endive, french bean, string bean, nave beans, kidney beans and rhubarb. Other edible vegetables in the Netherlands concern asparagus, leek, celery, brussels sprout, eggplant, okra, green pepper, pod, pea, marrow, lentil, courgette, maize, corn and broccoli.
Note that the calculation of the “representative concentration” in plants offers more
flexibility in the choice of vegetables than field measurements. In the latter case there is no other option than focusing on the type of plant (vegetable or non-vegetable) that is available, unless a “seeding, growing, harvesting program” is performed. In case no vegetables are present at all, representative vegetable concentrations could be calculated. When measuring is more appropriate, attention could be focused on non-edible plants (when available and
assuming that uptake in non-edible plants is related to that in vegetables), or again a “seeding, growing, harvesting program” must be performed.
4.2
Consumption rates
4.2.1 General population
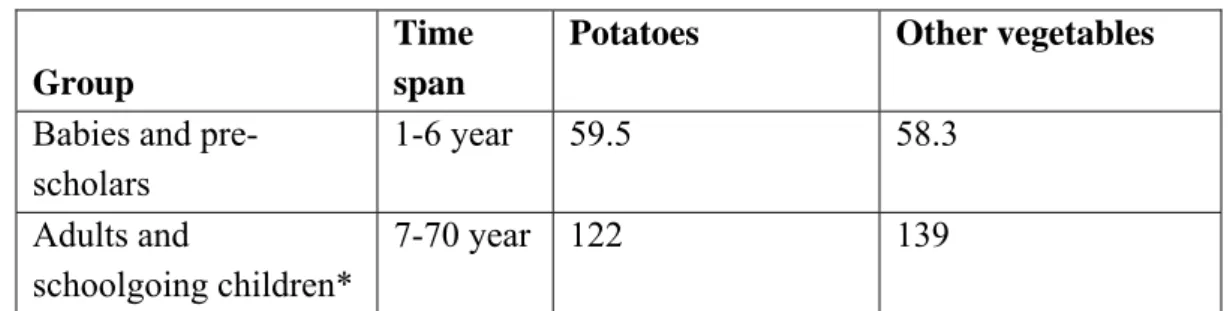
In the Netherlands detailed evaluations of vegetable consumption rates are performed regularly. The latest complete survey is the Dutch National Food Consumption Survey from 1998 (Voedingscentrum, 1998). The average consumption of vegetables in the Netherlands for babies and pre-scholers (1-6 year) and for adults and schoolgoing children (age 7-70 year), for potatoes and other vegetables, is given in Table 4.1.
Table 4.1: The average consumption (gfw/ day) for potatoes and other vegetables in the
Netherlands (source: Dutch National Food Consumption Survey; Voedingscentrum, 1998)
Group
Time span
Potatoes Other vegetables
Babies and pre-scholars
1-6 year 59.5 58.3
Adults and
schoolgoing children*
7-70 year 122 139
*About 6% of the consumed amounts of vegetables and about 9% of the consumed amount of potatoes are obtained outdoors. These amounts are not taken into account.
A more recent food consumption survey was performed in 2003. However this survey was focused on the specific age-group of 19 – 30 year and the data were collected in the fourth quarter of 2003 only (Hulshof et al., 2004). Besides, the methodology of the survey was different from earlier surveys. A new baseline survey for all age-groups is foreseen in 2007. To investigate the development of total vegetable rates in time, several Dutch surveys are compared. National food consumption surveys for all age groups have been performed in 1987-1988 (Ministry of WVC, 1988), 1992 (Voorlichtingsbureau voor de voeding, 1993) and 1997-1998 (Voedingscentrum, 1998). The average lifelong daily consumption rates have been given in Table 4.2. The results of the recent food consumption survey for the specific age-group of 19 – 30 year (Hulshof et al., 2004) are also given in Table 4.2.
Table 4.2: Overview of average lifelong daily consumption rates of potatoes and other vegetables (gfw/day) from Dutch food consumption surveys and for kitchen
gardeners (between brackets: data for the specific age-group of 19-30 year)
General population Kitchen
gardeners
Survey Survey Survey Survey Survey
Year 1988 1992 1998 2003 1988
Potatoes 131 119 114 (96) 147
Other vegetables 150 135 128 (100) 246
The table indicates that since 1988 there is a decreasing trend in both the total consumption rate for potatoes and other vegetables. This trend seems to continue up to the year of 2003, although these data should be interpreted with care since they reflect a specific age group and the methodology of the survey was different from earlier surveys. However, the average lifelong consumption of the age group of 19-30 year, which is expected to be higher than the lifelong average of all age groups, is low compared with the results of the previous years. The data of 2003 confirm the trend of decrease in consumption rates (pers. comm. K. Hulshof, November 2005).
Preferably, the most recent data must be included. However, the data from 2003 are less representative since they refer to a specific age group (19-30 year) and relate to data collected in the fourth quarter of 2003 only. Thus, at this moment the 1998 data are the most actual for total consumption rates in the Netherlands. Because there is a decreasing trend in total consumption rates for potatoes and other vegetables the 1998 data probably give a slight overestimation of the actual vegetable consumption rates.
4.2.2 Kitchen gardeners
In a study focused on 154 households with kitchen gardens (Hulshof, 1988) the average lifelong consumption of potatoes and other vegetables, both from own vegetable garden and from other sources, was 147 and 246 gram per day, respectively (data also included in Table 4.2). Thus, kitchen gardeners consume more vegetables than the general population. Based on the Dutch National Food Consumption Survey (Voedingscentrum, 1998) and Hulshof (1988) the factor of difference considering the average lifelong consumption of potatoes is
approximately 1.1. For the other vegetables this factor is approximately 1.7 for adults and schoolgoing children and 1.2 for babies and pre-scholars.
Although the data for kitchen gardeners refer to a situation in 1988 and the total consumption rates might have changed in time, these factors of difference are considered the most
representative for the difference between the consumption rates of kitchen gardeners and of the general population. Applying these factors to the consumption data of the general
population results in the average lifelong consumption rates for potatoes and other vegetables for kitchen gardeners as calculated in Table 4.3.
Table 4.3: The (calculation of the) average lifetime consumption rates (gfw/day) for
potatoes and other vegetables for kitchen gardeners
Group Time span Potatoes Other vegetables
Babies and pre-scholars 0-6 year 59.5 x 1.1 = 66 58.3 x 1.2 = 70 Adults and schoolgoing
children
4.3
Consumption pattern
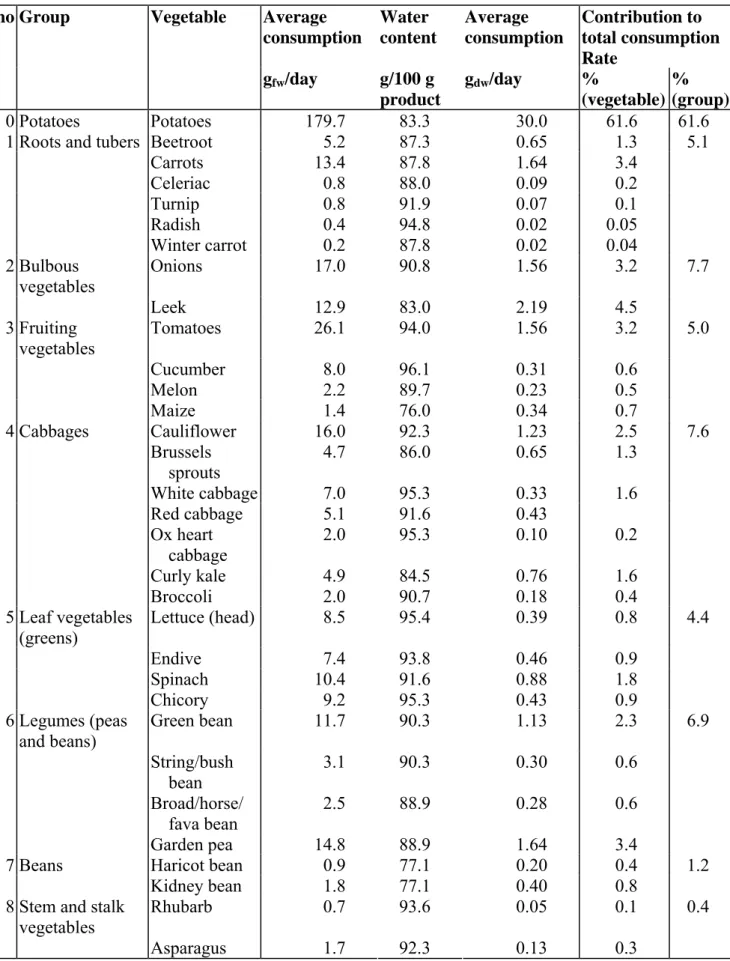
Besides the total consumption rates also the contribution of different vegetables to the total consumption rate (consumption pattern) is of importance. Dooren-Flipsen et al. (1996) used the data of the Dutch National Food Consumption Survey (Voorlichtingsbureau voor de voeding, 1993) to transform the average consumption rates of foodstuffs into consumption rates of primary agricultural products. They considered 32 vegetables, divided over 9 vegetable groups. Table 4.4 gives the average consumption pattern (average for all age groups and both sexes). The consumption pattern, expressed in gram fresh product per day, is converted to the consumption pattern in gram dry weight per day3. Besides the contribution of each vegetable group to total consumption is given.
Note that these data from Dooren-Flipsen et al. (1996) in Table 4.4 and Voorlichtingsbureau voor de voeding (1993) in Table 4.1 show different total rates of consumed potatoes and other vegetables. The reason for this is that the Dutch food consumption survey records in terms of prepared (cooked) actual amounts of foods, which includes composite products. The data in Table 4.4 are based on the fresh product at harvesting (shrink and waste included). The former is applicable for the estimation of the total consumption rates. The latter is applicable for calculation of the generic plant – soil relations (see next chapter). The relative contribution of vegetables to total consumption is expected to be similar in both surveys. In section 1.3 it was explained that the tiered approach allows for two different steps, i.e. the use of Critical soil concentrations in Tier 1 and a detailed assessment of the actual risk on the basis of a site-specific risk calculation in Tier 2. Both Critical soil concentrations and the detailed assessment of the actual risk on the basis of a site-specific risk calculation should be applicable for the majority of cases. Furthermore, it should be considered that the policy on soil contamination is often related to “the possibility to grow vegetables without experiencing
adverse effect on human health”. This political basic requirement implies that, independent of the vegetables that are growing on the site, the attention should be focused on the “average vegetable pattern”, for both calculation steps.
As a consequence, the choice of vegetables does not imply an additional conservative element in the derivation of Critical soil concentrations and the detailed assessment of the actual risk on the basis of a site-specific risk calculation.
Table 4.4: Average consumption pattern in the Netherlands (Dooren-Flipsen et al., 1996)
no Group Vegetable Average
consumption Water content Average consumption Contribution to total consumption Rate gfw/day g/100 g product gdw/day % (vegetable) % (group) 0 Potatoes Potatoes 179.7 83.3 30.0 61.6 61.6
1 Roots and tubers Beetroot 5.2 87.3 0.65 1.3
Carrots 13.4 87.8 1.64 3.4 Celeriac 0.8 88.0 0.09 0.2 Turnip 0.8 91.9 0.07 0.1 Radish 0.4 94.8 0.02 0.05 Winter carrot 0.2 87.8 0.02 0.04 5.1 2 Bulbous vegetables Onions 17.0 90.8 1.56 3.2 Leek 12.9 83.0 2.19 4.5 7.7 3 Fruiting vegetables Tomatoes 26.1 94.0 1.56 3.2 Cucumber 8.0 96.1 0.31 0.6 Melon 2.2 89.7 0.23 0.5 Maize 1.4 76.0 0.34 0.7 5.0 4 Cabbages Cauliflower 16.0 92.3 1.23 2.5 Brussels sprouts 4.7 86.0 0.65 1.3 White cabbage 7.0 95.3 0.33 Red cabbage 5.1 91.6 0.43 1.6 Ox heart cabbage 2.0 95.3 0.10 0.2 Curly kale 4.9 84.5 0.76 1.6 Broccoli 2.0 90.7 0.18 0.4 7.6 5 Leaf vegetables (greens) Lettuce (head) 8.5 95.4 0.39 0.8 Endive 7.4 93.8 0.46 0.9 Spinach 10.4 91.6 0.88 1.8 Chicory 9.2 95.3 0.43 0.9 4.4 6 Legumes (peas and beans) Green bean 11.7 90.3 1.13 2.3 String/bush bean 3.1 90.3 0.30 0.6 Broad/horse/ fava bean 2.5 88.9 0.28 0.6 Garden pea 14.8 88.9 1.64 3.4 6.9
7 Beans Haricot bean 0.9 77.1 0.20 0.4
Kidney bean 1.8 77.1 0.40 0.8 1.2
8 Stem and stalk vegetables
Rhubarb 0.7 93.6 0.05 0.1
Asparagus 1.7 92.3 0.13 0.3
5.
Accumulation of metals in vegetables
This chapter focuses on the procedure for the calculation of the concentration in vegetables. The last few years many data on metal concentrations in soils and vegetables were published. Unfortunately, evaluation and incorporation of these additional data into the RIVM plant – soil database could not be done within the scope of this study.
5.1
Critical vegetable concentration (cadmium)
In respect to exposure through vegetable consumption, cadmium is an important contaminant. It is a very frequently found in soils, at locally contaminated sites as well as diffusely
distributed in agricultural soils. Moreover, human health risks can be crucial for cadmium and the human health risk is dominated by exposure due to vegetable consumption (in section 3.3.1 it was concluded that the contribution of exposure due to vegetable consumption to total exposure is 93% for the standard exposure scenario). For this reasons, attention is focused on the derivation of a Critical vegetable concentration for cadmium, in this separate section. A Critical vegetable concentration is calculated for cadmium and the Vegetable garden site use, using Eq. 2.3. The consumption rates for potatoes and other vegetables are taken from Table 4.1, corrected for the percentage dry weight given in Table 4.4. As a conservative approach it has been assumed that all other vegetables (i.e. vegetables other than potatoes) concern sensitive crops like lettuce, endive, spinach and broccoli.
In this approach a standard adult has a body weight of 70 kg and consumes 10.2 gdw/d of
potatoes (50% of total potatoe consumption of 22.4 gdw/d) and 9.89 gdw/d of the sensitive
vegetables (100% of total consumption of other vegetables). A standard child has a body weight of 15 kg and consumes 4.97 gdw/d of potatoes and 4.14 gdw/d of sensitive vegetables.
The MTRhuman for cadmium is 0.5 μg/kgbody weight/day (Baars et al., 2001). The water content
(see Table 4.4) of potatoes is 83.3% and the average water content for the sensitive vegetables is 92.9%. The correction for relative bioavailability in the human body, fbioavailability, is assumed to be 1.0 (i.e. no correction). This results in a Critical vegetable
concentration of 1.74 mg/kgdw for adults and 0.82 mg/kgdw for children. As a
lifelong-averaged Critical vegetable concentration for cadmium and the Vegetable garden site use a value of 1.66 mg/kgdw results.
In an even more conservative approach the higher consumption rates from kitchen gardeners from Table 4.3 are used. Consumption rates for adults are in that case 11.2 gdw/d of potatoes
and 16.8 gdw/d for sensitive vegetables. For children consumption rates are 5.51 gdw/d of
potatoes and 4.97 gdw/d for sensitive vegetables. This results in a Critical vegetable
lifelong-averaged Critical vegetable concentration for cadmium and the Vegetable garden site use (higher consumption rates) a value of 1.20 mg/kgdw results.
5.2
Experimental data in soils and vegetables
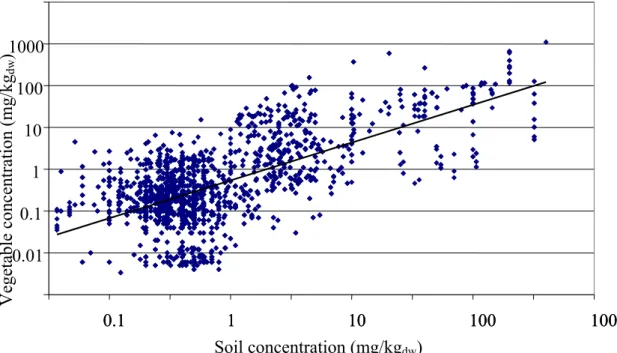
Since cadmium is such an important contaminant for human health risk assessment, it is useful to look into more detail at this metal. The RIVM plant - soil database was extended with few novel data and was used subsequently to plot the cadmium concentration in vegetables as a function of the cadmium concentration in soil, for the whole RIVM plant – soil database (Figure 5.1).
Figure 5.1. The cadmium concentration in vegetables (mg/kgdw) as a function of the
cadmium concentration in soil (mg/kgdw), for all available data in the RIVM
plant – soil database.
Generally the vegetables have higher cadmium concentrations at higher soil concentrations. However, this figure shows that the relation between the cadmium concentration in
vegetables and in soils has a huge variation. At a specific concentration in soil the
concentration in different vegetables can vary with three orders of magnitude. The R2 for this relation is 0.43.
The highest vegetable concentrations are found in the studies were cadmium was added to field plots or in pot experiments. These soils might represent a worst-case situation, because no aging has taken place and, hence, cadmium is readily available for uptake. In most cases,
0.1 1 10 100 1000 0.1 1 10 100 1000 Soil concentration (mg/kgdw) 0.01 0.1 1 10 100 1000 Vegetable concentration (mg/kg dw )
cadmium present at contaminated sites is the result of historical contamination and is, hence, less available. Therefore a more realistic risk assessment must be focused on studies with historically contaminated soils, in the field.
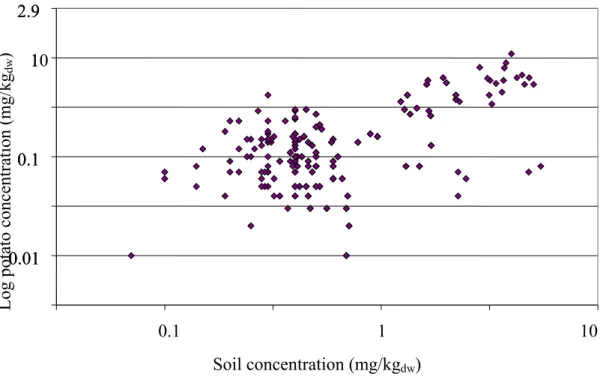
Figure 5.2 shows the cadmium concentration in potatoes as a function of the cadmium concentration in soil.
Figure 5.2: The cadmium concentration in potatoes as a function of the cadmium concentration in soils, for all available data in the RIVM plant – soil database.
Figure 5.2 shows that the relation between the cadmium concentration in potatoes and in soils has a huge variation. At a specific concentration in soil the concentration in potatoes can vary with more than two orders of magnitude. Despite of the high variation, the cadmium
concentration in potatoes is relatively low. Even at the highest tested cadmium concentration in soil of 7 mg/kgdw, the concentration in potatoes is lower than the Critical vegetable
concentration for Vegetable gardens of 1.7 mg/kgdw and even than the more conservative
Critical vegetable concentration for Vegetable gardens (consumption rates for kitchen gardeners) of 1.2 mg/kgdw.
Figure 5.3 shows the cadmium concentration in different sensitive vegetables as a function of the cadmium concentration is soil. Spinach, endive, lettuce and broccoli are shown, because these vegetables can accumulate significant amounts of cadmium. Besides, abundant data were present for these vegetables in the RIVM plant - soil database.
0.01 0.1 1 2.9 0.01 0.1 10 2.9 0.1 1 10 Soil concentration (mg/kgdw)
Log potato concentration (mg/kg
dw
Figure 5.3: The cadmium concentration in sensitive vegetables as a function of the cadmium concentration in soil, for all available data in the RIVM plant – soil database.
The measured cadmium concentrations can be compared with the Critical concentration for cadmium of 1.7 mg/kgdw or 1.2 mg/kgdw. It can be concluded that even at cadmium
concentrations in soil in between 0.1 and 1.0 mg/kgdw the Critical vegetable concentrations of
1.7 or 1.2 mg/kgdw are exceeded in these sensitive crops, in some cases.
5.2.1 The influence of soil properties
As shown in section 3.1.1 soil properties have a major influence on the uptake of metals by vegetables. A study of Römkens and De Vries (2001) showed that cadmium concentrations in spinach and endive correlated with cadmium concentrations in soil. In addition the
percentage of clay, organic carbon and lime were reported in this study. This permits the classification into so-called risk classes. “High-risk” soils have no lime, less than 10% organic matter and less than 5% clay. “Low-risk” soils have more than 5% lime, more than 10% organic matter and more than 25% clay. The soil properties of “intermediate-risk” soils are in between the soil properties of “high-risk” soils and “low-risk” soils. Figure 5.4 shows the cadmium concentration in spinach and endive as a function of the cadmium concentration in soils, for each of the three risk classes of soils.
-1 -0.5 0 0.5 1 1.5 2 2.5 3 3.5 0.01 0.1 1 10 100 1000 Soil concentration (mg/kgdw) Log vegetabl e concentration (mg/kg dw ) spinach endive lettuce broccoli
Figure 5.4: The cadmium concentration in spinach and endive as a function of the cadmium concentration in soil for three different “soil risk classes”. “High-risk”: 0% lime, less than 10% organic matter and 5% clay; “low-risk”: more than 5% lime,10% organic matter and 25% clay; intermediate-risk: not “high-risk” or “low-risk”
This figure shows that even the soils in the so-called “low-risk” category can show high cadmium concentrations in spinach and endive. This implies that there is also a considerable human health risk due to consumption of leafy vegetables, even for soils with high amounts of lime, organic matter and clay.
5.3
Calculation procedure
5.3.1 BioConcentrationFactors (BCFs)
A common parameter for estimating the metal concentration in vegetables and subsequently human exposure through consumption of vegetables is the BioConcentrationFactor (BCF), i.e. the ratio between the concentration of (the edible part of) the vegetable and the soil concentration: -1 -0.5 0 0.5 1 1.5 2 2.5 0.01 0.1 1 10 Soil concentration (mg/kgdw) log plant con centration (mg/kg dw ) high medium low