RIVM report 500034001/2004
The Dutch CAFE baseline: In or out of line?
A review on the current information in the RAINS model BA Jimmink, RJM Folkert, R Thomas, JP Beck,
MM van Eerdt, HE Elzenga, KW van der Hoek, A Hoen, CJ Peek
Contact:
Benno Jimmink
Netherlands Environmental Assessment Agency
Benno.Jimmink@rivm.nl
This investigation has been performed by order and for the account of the Dutch Ministry of Environment and Spatial Planning – Directorate Environment, within the framework of project M/500034
Abstract
Review of the CAFE baseline in RAINS
The European Commission is constructing a strategy on air pollution within the Clean Air For Europe (CAFE) programme. This strategy will be based on assessments using the RAINS model for different policy ambitions where the CAFE baseline scenario and control strategies are employed. The Netherlands Environment Assessment verified the data in RAINS and the CAFE baseline. In this verification the CAFE baseline was shown to be unsuitable for determining the Dutch position in negotiations for new European air pollution policy (like the NEC review). The Netherlands will have to introduce a national scenario of its own to bring forward the Dutch expectations on future developments. While the RAINS model would seem appropriate for calculating abatement scenarios, contra-expertise will still be necessary during the CAFE process to assess differences in RAINS on calculated abatement costs and emission levels.
Rapport in ‘t kort
Beoordeling van de CAFE baseline in RAINS
De Europese Commissie zet een strategie op voor de aanpak van luchtverontreiniging in het Clean Air for Europe (CAFE) programma. De strategie wordt gebaseerd op beoordelingen met het RAINS model van verschillende beleidsambities met de CAFE baseline en bestrijdingsstrategieën. Het Milieu- en Natuurplanbureau van het RIVM heeft de juistheid van gegevens in RAINS en de CAFE baseline gecontroleerd. Uit deze controle bleek dat voor de positiebepaling van Nederland in onderhandelingen over nieuw Europees luchtverontreinigingsbeleid de CAFE baseline niet volstaat. Er is een eigen nationaal scenario nodig om de Nederlandse toekomstverwachtingen goed in te brengen. Het RAINS model lijkt geschikt om beleidsscenario’s uit te rekenen, maar contra expertise blijft nodig voor de beoordeling van verschillen in RAINS op berekende kosten en emissieniveaus in beleidsscenario’s.
Contents
Samenvatting 7
Summary 9
1. Introduction 11
2. CAFE Baseline Scenarios 13
3. Analysis of sectoral emissions 17
3.1 SO2 emissions 17
3.2 NOx emissions 21
3.3 NH3 emissions 24
3.4 VOC emissions 27
3.5 Particulate Matter emissions 29
4. Conclusions 33
References 35
Annex 1 Energy & Industry 36
Annex 2 Domestic 44
Annex 3 Transport 46
Samenvatting
De Europese Commissie stelt een strategie op voor de aanpak van luchtverontreiniging in het Clean Air for Europe (CAFE) programma. De strategie wordt gebaseerd op verkenningen van verschillende beleidsambities met het model RAINS op basis van bestrijdingsstrategieën en de CAFE baseline zoals opgesteld door de Europese Commissie. De juistheid van de gegevens in RAINS voor Nederland is gecontroleerd door deze te vergelijken met nationale cijfers uit de Emissie Registratie en de Nederlandse ‘Referentie Raming’. Het doel van deze controle was na te gaan of RAINS en de CAFE baseline geschikt zijn voor het berekenen van beleidsvarianten voor nieuw luchtverontreinigingsbeleid. Veel fouten in RAINS zijn gecorrigeerd tijdens de bilaterale consultatie met IIASA, maar drie belangrijke overeengekomen voorstellen om de misinterpretatie van emissieberekeningen van visserij, om de lage NOx-emissiefactor voor gasmotoren in de landbouw en om de hoge
PM10-emissiefactor voor huishoudens op te lossen, heeft IIASA niet overgenomen.
De belangrijkste verschillen tussen de aannames in het nationale scenario en de CAFE baseline zijn lager kolengebruik, hogere dieraantallen, lager aandeel dieselauto’s en een hoger gebruik van huishoudelijke brandstoffen (barbecues, houtkachels) in de CAFE baseline. Deze verschillen veroorzaken de belangrijkste verschillen in emissies (tabel S.1). Het lager kolengebruik resulteert in lagere totale emissies van zwaveldioxide (SO2) (28% in
2010). De hogere dieraantallen leiden tot hogere totale emissie van ammoniak (NH3) (12% in
2010) en fijn stof (PM10) (8% in 2010). Het hogere gebruik van huishoudelijke brandstoffen
leidt tot hogere fijn stofemissies en het lagere aandeel dieselauto’s leidt tot lagere emissies van stikstofdioxide (NOx) en fijn stof voor transport in 2020 (respectievelijk 7% en 3%).
Deze scenarioverschillen tussen de CAFE baseline en de nationale gegevens leiden mogelijk tot onjuiste toepassing van bestrijdingsmaatregelen en tot onjuiste emissieniveaus in de beleidsscenario’s. Vooral het lage kolengebruik toont niet de bestrijdingsproblemen en kosten voor SO2 zoals die blijken uit de nationale verwachtingen. Ook het effect van een
lager aandeel dieselauto’s in de CAFE baseline op lagere emissies van NOx, PM10 and PM2.5
is belangrijk omdat veel van de aandacht in CAFE zal komen te liggen op de bestrijding van emissies van PM2.5 en NOx van het wegverkeer.
Het RAINS model zelf levert minder verschil op dan het gebruik van de CAFE baseline gegevens en het niveau van maatregelen in RAINS komt in grote lijnen overeen met het huidig Nederlandse beleid. RAINS lijkt geschikt om totale emissies te berekenen, maar veroorzaakt op sectorniveau wel grote verschillen in emissies. Een groot verschil is toe te schrijven aan de foutieve interpretatie van visserij in RAINS, dat veel hogere totale emissies SO2 (circa 20%), NOx (circa 9%) in 2010 en 2020 veroorzaakt. Andere verschillen zijn het
gevolg van verschillen in emissiefactoren, activiteitendefinities en bestrijdingstechnieken. Deze fouten hinderen mogelijk de berekening van bestrijdingsniveaus tegen de laagste kosten voor alle stoffen. Er is geen eenduidig antwoord te geven op het totale effect van deze verschillen voor kosten en emissieniveaus in beleidsscenario’s.
Voor de positiebepaling van Nederland in onderhandelingen over nieuw Europees luchtverontreinigingsbeleid (zoals de herziening van de NEC richtlijn) volstaat de CAFE baseline niet. Er is een eigen nationaal scenario nodig om de Nederlandse toekomstverwachtingen goed in te brengen. Het RAINS model lijkt geschikt om beleidsscenario’s uit te rekenen. Contra expertise blijft echter wel nodig voor de beoordeling van verschillen in RAINS op berekende kosten en emissieniveaus in beleidsscenario’s.
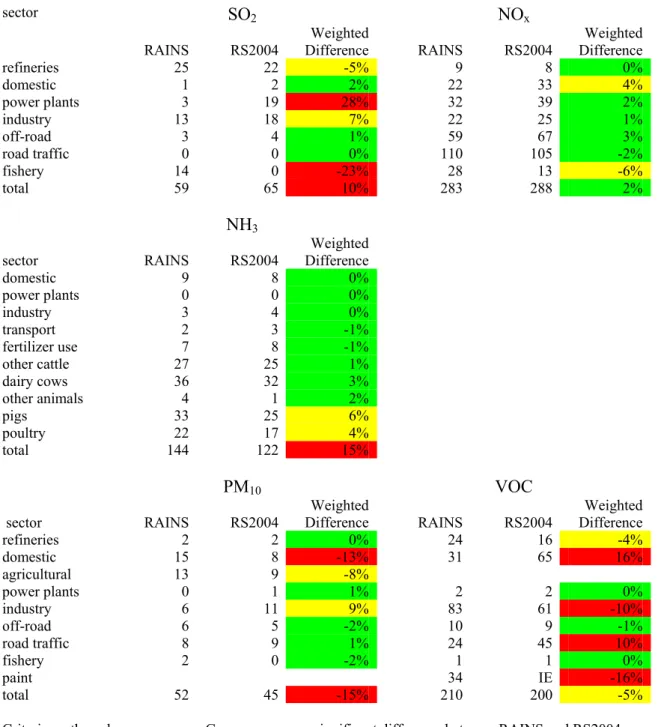
Table S.1 Emissions for SO2 , NOx , NH3 , PM10 and VOC in 2010 from RAINS calculations
compared to the Dutch Reference Scenario emissions(106 kg). Differences are weighted to total emission in RAINS
sector SO2 NOx
RAINS RS2004 Difference RAINS RS2004 Weighted Difference Weighted
refineries 25 22 -5% 9 8 0% domestic 1 2 2% 22 33 4% power plants 3 19 28% 32 39 2% industry 13 18 7% 22 25 1% off-road 3 4 1% 59 67 3% road traffic 0 0 0% 110 105 -2% fishery 14 0 -23% 28 13 -6% total 59 65 10% 283 288 2% NH3 sector RAINS RS2004 Weighted Difference domestic 9 8 0% power plants 0 0 0% industry 3 4 0% transport 2 3 -1% fertilizer use 7 8 -1% other cattle 27 25 1% dairy cows 36 32 3% other animals 4 1 2% pigs 33 25 6% poultry 22 17 4% total 144 122 15% PM10 VOC
sector RAINS RS2004 Difference Weighted RAINS RS2004 Difference Weighted
refineries 2 2 0% 24 16 -4% domestic 15 8 -13% 31 65 16% agricultural 13 9 -8% power plants 0 1 1% 2 2 0% industry 6 11 9% 83 61 -10% off-road 6 5 -2% 10 9 -1% road traffic 8 9 1% 24 45 10% fishery 2 0 -2% 1 1 0% paint 34 IE -16% total 52 45 -15% 210 200 -5%
Criteria on the colors: Green: no significant difference between RAINS and RS2004 Yellow: Small difference between RAINS and RS2004 Red: Large difference between RAINS and RS2004
Summary
The European Commission is constructing a strategy for combating air pollution within the Clean Air for Europe (CAFE) program. The strategy will be based on assessments using the RAINS model for different policy ambitions where control strategies with the CAFE baseline scenario -as framed by the European Commission- are employed. The data in RAINS for the Netherlands was verified through comparison with national figures taken from the emission registration and the Dutch ‘Reference Scenario’. The aim of the verification is to check the suitability of RAINS and the CAFE baseline for calculating abatement scenarios for new air pollution policy. Many errors in RAINS were corrected in the bilateral consultation with IIASA. However, three essential proposals that were agreed to correct the faulty interpretation on fishery, the low NOx emission factor for gas engines in agriculture and the
high PM10 emission factor for residential combustion, have not been adopted by IIASA.
The main differences between the assumptions in the national scenario and the CAFE baseline -lower use of coal, higher animal numbers, lower share of diesel cars and higher use of domestic fuels (barbeques, wood stoves)- are responsible for the main differences in emissions (Table S.1). The lower use of coal results in lower power plant emissions for sulphur dioxide (SO2) (28% on total in 2010). Higher animal numbers lead to higher
emissions of ammonia (NH3) (12% in 2010) and particulate matter (PM10) (8% in 2010).
Higher use of domestic fuels (barbecues and wood stoves) also leads to higher total particulate emissions. Finally a lower share of diesel cars leads to increasingly lower nitrogen dioxide (NOx) and particulate emissions for transport in 2020 (7% and 3%, respectively, in
2020). The differences between RAINS calculations and national assessments may lead to incorrect application of abatement measures and result in incorrect abatement emission levels. Especially the low coal use conceals abatement problems and costs for SO2 when
compared with national expectations on coal-fired plants. The effect of a lower share of diesel cars in the CAFE baseline on lower emission of NOx, PM10 and PM2.5 emissions is also
important because much of the focus in CAFE will be on the abatement of PM2.5 and NOx in
road traffic.
The RAINS model itself causes less difference than the use of the CAFE baseline data and the level of implementation of control measures in RAINS in general reflects the current Dutch policy. RAINS seems appropriate for calculating total emissions but causes big differences in sector emissions. A big difference originates from the faulty interpretation of fishery in RAINS, causing much higher emissions for SO2 (about 20%) and NOx (about 9%)
in 2010 and 2020. Other differences are caused by differences in emission factors, use of control technologies and definitions of activities. These errors can hamper calculation of abatement levels at lowest costs for all components. There is currently no unambiguous answer to what the total effect of these differences is on the abatement costs and levels.
The CAFE baseline is not suitable for determining the Dutch position in negotiations for new European air pollution policy (like the NEC review). The Netherlands will have to introduce a national scenario of its own to bring forward the specific Dutch expectations on future developments. While the RAINS model would seem appropriate for calculating abatement scenarios, contra-expertise will still be necessary during the CAFE process to assess differences in RAINS on calculated abatement costs and emission levels.
1.
Introduction
The European Commission will construct in 2005 a strategy for combating air pollution within the Clean Air For Europe (CAFE) programme. In the CAFE programme future air quality up to 2020 will be assessed with respect to different policy ambitions (abatement levels) with the RAINS model. For this purpose two European-wide scenarios have already been constructed; one scenario including additional climate policy and one excluding it. To support the Dutch Government in constructing the strategy on air pollution in the CAFE program, the Netherlands Environment Assessment Agency at RIVM was asked to verify the CAFE baseline scenarios and the technical abatement options implemented in the RAINS model for the Netherlands. Since in CAFE the scenario including climate policy will draw the most attention we have chosen to focus on this scenario in our analysis. The data presented in this report is the final data for use in the CAFE project.
The aim of the verification is to check the suitability of RAINS and the CAFE baseline for calculating abatement scenarios for new air pollution policy (e.g. review of the NEC directive). Verification took place from November 2003 to September 2004 to compare the data in RAINS with Dutch data. A bilateral consultation with IIASA by sector specialists took place in March.
The data was compared with figures taken from the emission registration for the year 2000; future figures were compared with the Dutch ‘Reference Scenario’ (Beck et al., 2004). Since this scenario ends in 2010 the comparison was restricted to 2010 except for transport, animal numbers and use of coal for which extended or new information was available. The emissions of sulphur dioxide (SO2), nitrogen dioxide (NOx), ammonia (NH3), volatile organic
compounds (VOC) and particulate matter (PM10) have been checked. PM2.5 emissions were
checked to compare the derived ratio from TSP. Due to lack of as well Dutch as European data in RAINS no check has been performed on abatement costs during this consultation. The 2010 and 2020 figures are important for the strategy on air pollution. Since these figures are derived from 2000 figures, much attention has been paid to checking and analysing the 2000 figures. For 2000 figures in RAINS on activity level, abatement levels and unabated emissions were checked and differences corrected to closely match the Dutch 2000 emissions. Future developments on differences in activity and abatement level, as well as total emissions, have also been checked. Corrections in abatement levels have been made; however, difference in activity level could not be corrected because activity levels are scenario-dependent. The CAFE project offered the opportunity to supply a national scenario so as to use other activity levels; however the Netherlands chose not to submit a complete Dutch scenario and has only submitted data on animal numbers.
Chapter 2 describes the main assumptions of the CAFE baseline scenarios and the RAINS model, chapter 3 explains the observed differences, differences after correction and consequences of remaining differences and chapter 4 presents the conclusions.
2.
CAFE Baseline Scenarios
The European Commission assigned the technical integrated assessment activities for the CAFE program to a consortium lead by the International Institute for Applied Systems Analysis (IIASA). The activities include the development of the baseline scenario for CAFE, interacting with stakeholders about the baseline scenario, and applying the integrated assessment model RAINS for a series of policy scenario runs to provide information on the development of the thematic strategy on air pollution.
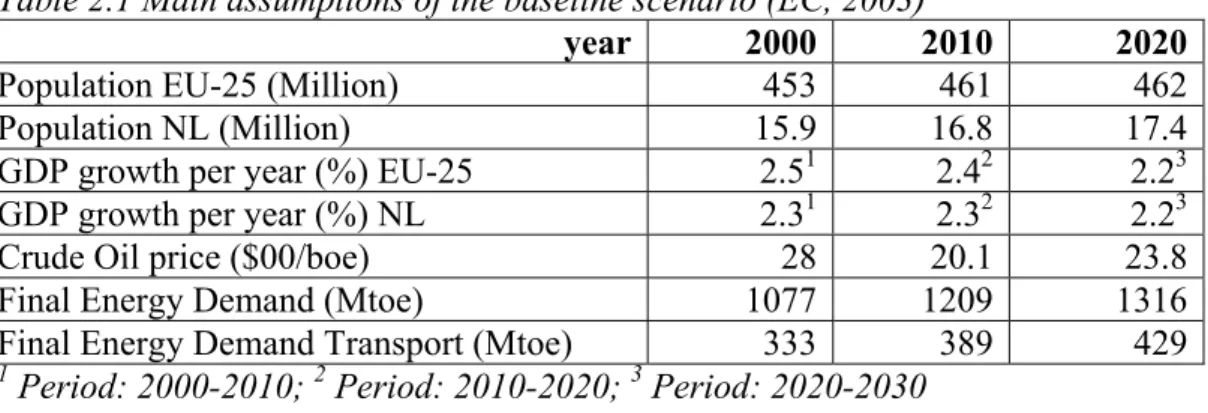
Table 2.1 Main assumptions of the baseline scenario (EC, 2003)
year 2000 2010 2020 Population EU-25 (Million) 453 461 462
Population NL (Million) 15.9 16.8 17.4
GDP growth per year (%) EU-25 2.51 2.42 2.23
GDP growth per year (%) NL 2.31 2.32 2.23
Crude Oil price ($00/boe) 28 20.1 23.8
Final Energy Demand (Mtoe) 1077 1209 1316
Final Energy Demand Transport (Mtoe) 333 389 429
1 Period: 2000-2010; 2 Period: 2010-2020; 3 Period: 2020-2030
The starting point for the European-wide baseline scenario was the energy and transport outlook to 2030 ‘Long Range Energy Modelling’ (LREM) from the European Commission, Directorate-General for Energy and Transport (EC, 2003). This scenario for economic and energy sector development was developed with the use of the PRIMES model run at the National Technical University Athens (NTUA). Table 2.1 summarizes the main assumptions for the CAFE baselines scenarios. The LREM scenario of energy demand describes the sector’s use of different fuel types over time. It includes existing trends and the effects of policies in place. Along with those in the process of being implemented by the end of 2001, whereas tax rates reflect the situation in the EU Member States as of July 2002. The LREM scenario excludes all additional policies and measures that aim at further reductions of CO2
emissions to comply with the Kyoto emission commitments.
The CAFE baseline scenario for agriculture (livestock production and application of mineral N fertilizers) assumes that the common agricultural policy (CAP) reform is not implemented. Projections for the number of animals are based on results from a number of European and global models. For the EU-15, data for the years 2000 until 2010 are derived from the CAPRI model run at the University of Bonn (Common Agricultural Policy and Regionalised Impact Assessment). For accession countries, projections for the same time horizon originate from Directorate-General for Agriculture. For other countries and for the period beyond 2010, the projection is based on trends derived from FAO projections (FAO, 2003). A scenario including CAP reform is under preparation. The forecast of fertilizer consumption up to 2010 for EU-15, Switzerland and Norway is based on data by EFMA (European Fertilizer Manufacturers Association). For other countries and for the period beyond 2010 the projection is based on trends derived from global FAO projections (FAO, 2003).
The consortium constructed three CAFE baseline scenarios (Amann et al., 2004):
- LREM scenario. This is the ‘Energy and Transport - Trends to 2030’ of DG Transport and Energy (EC, 2003) combined with Europe-wide consistent projections of agricultural activities without CAP reform. The control strategy for air pollution in this scenario is current legislation.
- Climate policy scenario. In contrast to the LREM scenario, the existing of an EU-wide CO2 emissions trading regime in this scenario is assumed, with a permit price ranging
from 12 euro per tonne of CO2 in 2010 to 16 euro in 2015 and 20 euro in 2020. These
permit prices lead to adjustment of the behaviour of economic agents, i.e. producers and consumers of energy, through changes in relative prices. In contrast to the LREM scenario, this scenario incorporates new national perspectives in a Europe-wide consistency on assumptions of economic growth rates, energy prices, electricity exports and imports etc. In contrast to the LREM scenario for agriculture this scenario uses a revised version of European-wide consistent projections of agricultural activities without CAP reform. The control strategy for air pollution in this scenario is current legislation. Used as the CAFE baseline it has been reviewed in this report applying Dutch data.
-
National scenario. This scenario contains energy projections incorporating climate policies and national agricultural projections submitted by Member States. Data for other countries are taken up in the climate policy scenario. The control strategy for air pollution in this scenario is current legislation.The RAINS model calculates air pollution from their sources (e.g. power generation, transport or cattle breeding) to their impacts on human health and the environment. The model estimates regional costs and environmental benefits of alternative emission control
RAINS
The Regional Air Pollution Information and Simulation (RAINS) model is a tool for analyzing alternative strategies to reduce acidification, eutrophication, ozone and particulate matter in Europe. RAINS combines a variety of information relevant for the development of cost-effective emission control strategies in Europe, i.e.:
• projections of future economic, agricultural and energy development in 38 European countries, • the present and future emissions of SO2, NOx, NH3, VOC and PM resulting from these activities,
taking into account control strategies
• the technical options for reducing emissions and the costs of these measures,
• the atmospheric dispersion characteristics of sulphur and nitrogen compounds, particulate matter and the formation of ground-level ozone
• the environmental sensitivities of ecosystems towards acidification, eutrofication and ground-level ozone.
• the health effects of ambient levels of particulate matter and ozone
RAINS integrates the latest scientific findings, up-to-date databases and advanced systems-analytical (optimization) tools. The web version and documentation of the model are available
strategies. In the CAFE program the RAINS model will be used with an optimization mode to identify cost-optimal allocations of emission reductions in order to achieve specified deposition and concentration targets formulated in the CAFE program.
Control strategies are packages of emission control measures applied to the different source categories. Control strategies determine the percentage of activity for the entire sector to which a given control measure is to be applied. Control strategies can be considered as general descriptions of legislative packages for emission control, specifying for each individual emission category the type, the timing and the extent of required emission control.
3.
Analysis of sectoral emissions
In order to determine the major differences between emissions registered by the Netherlands (and consequently reported to the convention) and emissions calculated by the RAINS model, the first step of the analysis was to compare total and sectoral emissions per compound for 2010 and 2000. Where major sectoral differences were found, the next step was to determine whether this was due to a difference in the activity level and/or the emission factor. The data for 2000 was taken from Emission Registration (ER2004) and for 2010 the data was taken from the Dutch Reference Scenario (RS2004) (Beck et al., 2004) extended to 2020 for transport (Brink, 2003).
The sectoral split followed in the analysis conformed to RAINS: • power plants,
• refineries,
• domestic and commercial services, • transportation,
• industrial, • non-energy use, • agriculture and
• other emission sources.
The major factors for IIASA in choosing these sectors were the sector split of the available energy balances (e.g., the energy statistics of UN/ECE, OECD/IEA and EUROSTAT) for the energy projections (e.g., of DG TREN) used as exogenous driver to the RAINS model and of the NFR (Nomenclature for Reporting) sector classifications.
In this chapter sections, one for each compound, describes to what extent and why the current RAINS emission (RAINSSep2004) differ from the Dutch data, what corrections have been proposed and how the implemented corrections by IIASA affected the old emission (RAINSJan2004) and last the consequence of remaining differences for calculating abatement scenarios for the Netherlands is given. More details on the consultation process can be found in the Annexes.
3.1
SO
2emissions
DifferencesIn RAINS, SO2 emissions are 6 million kg lower in 2010 and 10 million kg higher in 2000
(Tables 3.2 and 3.3). RAINS applied an incorrect NEC definition for fishery, which causes a 14 million kg higher emission in 2010. The lower SO2 emission in 2010 is caused: firstly
mainly by scenario differences due to a much lower use of hard coal in power generation, resulting in a 16 million kg lower emission in RAINS and secondly by a stabilisation instead of growth in RAINS with respect to aluminium and ceramics production, leading to 5 million kg lower emission.
Corrections
The difference in total SO2 emissions for 2010 in RAINS went from 5 million higher before
consultation to 6 million kg lower after consultation; for 2000 it went from 21 million to 10 million kg higher (Table 3.2 and 3.3).
Corrections for the missing fuel switch (oil to gas) have been implemented by refineries. Since RAINS cannot implement a fuel switch, a fuel switch for 2010 has been largely implemented in RAINS using a dummy control technology, which leads to lower emissions in 2010 and later.
The level of abatement technology for the use of heavy fuel oil for heating has been increased to match the situation in 2000 and the situation expected for 2010. Corrections have been made to accommodate a higher degree of implementation of technical measures and lower unabated emissions from industrial processes, which causes emissions to decline. RAINS upgrades to more efficient control technologies after 2000 have, however, been removed, since they are not expected to be taken under current legislation; this will cause a slight increase in future emissions. Collectively, these corrections cause industrial emissions to decline.
The sulphur content of fuel used for road transport and off-road vehicles for 2000, 2010 and 2020 have been corrected for a better match with the Dutch figures (Table 3.1, 3.2 and Annex 3).
The corrections for fishery emission calculations have not been implemented as indicated. RAINS still treats this category as marine shipping, with the sulphur content of heavy fuel and not medium distillates. This causes much higher SO2 emissions for all years.
The corrections implemented improved the fit of the 2000 figures; however, differences for 2010 emission remain, mainly due to different scenario assumptions and a definition of fishery as mentioned above.
Consequences
Future total emissions in RAINS for SO2 in the Netherlands (2010) are lower at 6 million kg,
while on sector level differences are higher (e.g. power plants have 16 million kg lower emissions, fishery, 14 million kg higher and industry, 5 million kg lower). The sectors important for control options (refineries, power plants and industry) will differ in abated emissions due to lower scenario activity for power plants (coal use) and industry (aluminum and ceramic production) and due to missing cost effective control technology (switch from oil to gas) for refineries (Beck et al., 2004) in RAINS. Especially the low coal use may lead in the RAINS optimization to lower emission targets at lower cost than with higher coal use. This is important because the Netherlands has problems meeting its NEC target for SO2 in
Table 3.1 Emissions of SO2 for 2020 for RAINS calculations before and after correction and
for the Dutch Reference Scenario
2020
SO
2(10
6kg)
sector RAINS Jan2004 RAINS Sept2004 RS2004 Weighted Difference off-road transport 0 4 4 0% road transport 1 0 0 0% fishery 12 14 0 -22% other 60 46 NA NA total 73 65 NA NA(NA: Not yet available)
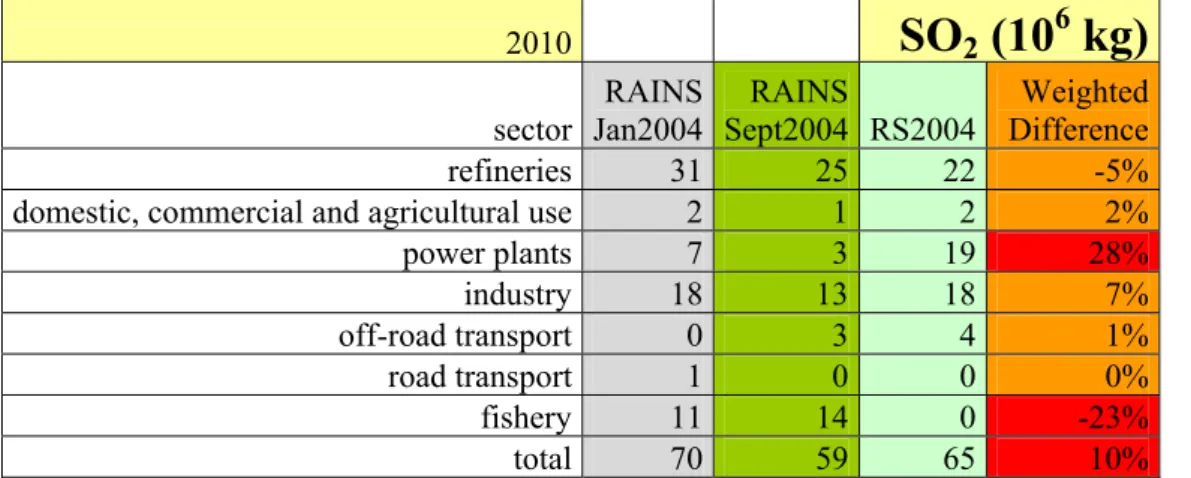
Table 3.2 Emissions of SO2 for 2010 for RAINS calculations before and after correction and
for the Dutch Reference Scenario
2010
SO
2(10
6kg)
sector RAINS Jan2004 RAINS Sept2004 RS2004 Weighted Difference refineries 31 25 22 -5%domestic, commercial and agricultural use 2 1 2 2%
power plants 7 3 19 28% industry 18 13 18 7% off-road transport 0 3 4 1% road transport 1 0 0 0% fishery 11 14 0 -23% total 70 59 65 10%
Table 3.3 Emissions of SO2 for 2000 for RAINS calculations before and after correction and
for the Dutch Emission Registration
2000
SO
2(10
6kg)
sector RAINS Jan2004 RAINS Sept2004 ER2004 Weighted Difference refineries 31 32 33 1%domestic, commercial and agricultural use 4 2 2 0%
power plants 17 16 15 -1% industry 24 16 15 -1% off-road transport 6 5 5 0% road transport 5 3 3 0% fishery 8 11 1 -12% total 96 85 75 -12%
Coal-fired power plants are an important sector for abatement options. The much lower use of coal in RAINS in 2010 and 2020 may, in particular, have consequences. The RAINS forecasts of future emissions of SO2 by power plants will be much lower. The CAFE baseline
is not thought to be the source of the most likely development of coal use in the Netherlands. The cost advantage of production based on hard coal over production based on natural gas gradually diminishes due to a gradually rising price of CO2-emission rights1. But the price
level of CO2-emission rights at which it is actually more expensive to operate a coal-fired
plant than a gas-fired plant (around 35 euro/ton) is not reached in the CAFE baseline and the new Reference projection (annex 1) before 2020. Therefore, it is assumed that existing coal-fired plants will remain in operation until the end of their life span. Dutch comments on future coal use (Annex 1) have been submitted to NTUA for implementation in their latest CAFE baseline run using PRIMES. However, the new figures from CAFE baseline even show a 50% lower share of coal use for power generation in 2010 and 2020 when compared to the previous version. This means that the Dutch comments have not been taken into account. Low SO2 targets for the Netherlands may be in conflict with the national assumption
on power generation with hard coal.
The much higher emissions for fishery (14 million kg in 2010) may cause abatement measures to be applied in RAINS. The higher emissions are caused by RAINS supplying the incorrect NEC definitions. The corrections agreed to solve this have not been implemented by RAINS. In 2010 these emissions are hardly affected by control measures in RAINS, but in 2020 RAINS assumes that about 60% of these emissions will be suitable for abatement. The abatement measure, a switch to fuel with a lower sulphur content, is not applicable since fishery already use fuel with a lower sulphur content (medium distillates) than heavy fuel. This leads to non-existing costs and errors in calculating the cheapest abatement measures in RAINS.
Another important sector for abatement measures are refineries. Here, the projected and measured emission levels match reasonably, although an import abatement measure, ‘switch from oil to gas’, is not incorporated in RAINS. This measure will offer fewer possibilities for abatement of SO2 emission in RAINS when calculating abatement scenarios, and may lead to
higher abatement emissions.
The third important sector for abatement technologies is the industry sector. Industrial emissions are lower than in the Dutch expectations, since RAINS does not project a growth in aluminium and ceramics production. This stagnation will cause lower SO2 levels in this
sector’s policy runs for lower abatement costs than where growth is observed.
1 In this scenario, the price of emission rights is: EUR 8/ton CO
2 in 2010, EUR 11/ton CO2 in 2020, EUR 61/ton CO2 in 2030 and EUR 89/ton CO2 in 2040.
3.2
NO
xemissions
DifferencesTotal NOx emissions in RAINS are currently 5 million kg lower for 2010 and 20 million kg
lower for 2000 (Table 3.5, 3.6). Although the total NOx emission in RAINS matches pretty
well in 2010 there are big differences on sector level: RAINS calculates 50% higher emission for fishery (25 million kg) and lower emissions for gas engines in agriculture (11 million kg), off road transport (8 million kg) and power plants (7 million kg) in 2010. The erroneous interpretation of emissions from fishery causes the biggest difference. However, this causes higher emissions in RAINS for this particular sector. The lower total emissions in RAINS in 2010 are caused by a lower unabated emission factor in RAINS for use of gas engines in agriculture (gas engines in greenhouses have higher emissions per unit energy used). Lower emissions are furthermore caused by a lower assumed activity level for off-road transport (especially air traffic) and – just as for SO2 – a lower assumed use of coal in power plants in
the CAFE baseline.
Although road transport totals of NOx for RAINS and national data are in line, there are
differences on sub-sector level. This concerns a lower share of diesel in light duty vehicles in RAINS, causing lower emission of 3 million and 12 million kg in 2010 and 2020, respectively. This is due to a 20% higher consumption of energy by gasoline cars and a 17% lower consumption by diesels in the CAFE baseline (See Annex 3). However, these lower emissions are countered by higher emissions from heavy duty vehicles in 2010 in RAINS, because less control technology is assumed (implementation of EURO IV engines). In 2020, however, the lower diesel share and differences in the age and composition of the car fleet in RAINS cause a 17 million kg lower emissions for road transport totals.
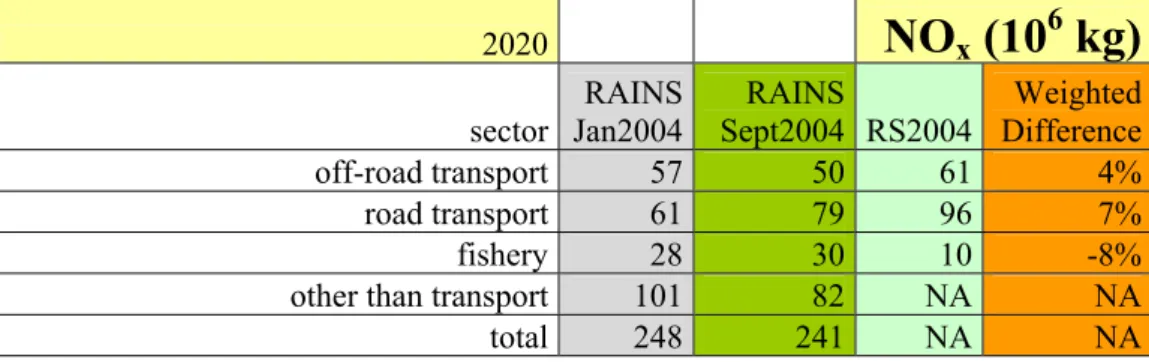
Table 3.4 Emissions of NOx for 2020 for RAINS calculations before and after correction and
for the Dutch Reference Scenario
2020
NO
x(10
6kg)
sector RAINS Jan2004 RAINS Sept2004 RS2004 Weighted Difference off-road transport 57 50 61 4% road transport 61 79 96 7% fishery 28 30 10 -8%other than transport 101 82 NA NA
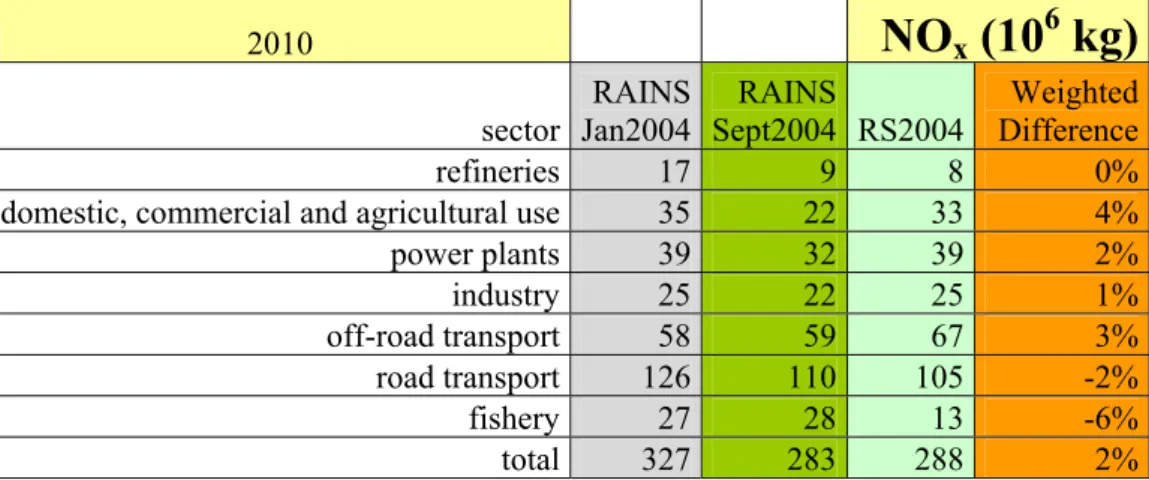
Table 3.5 Emissions of NOx for 2010 for RAINS calculations before and after correction and
for the Dutch Reference Scenario
2010
NO
x(10
6kg)
sector RAINS Jan2004 RAINS Sept2004 RS2004 Weighted Difference refineries 17 9 8 0%domestic, commercial and agricultural use 35 22 33 4%
power plants 39 32 39 2% industry 25 22 25 1% off-road transport 58 59 67 3% road transport 126 110 105 -2% fishery 27 28 13 -6% total 327 283 288 2% Corrections
The difference of RAINS total NOx emissions for 2010 decreased from 39 before
consultation to 5 million kg higher after consultation, and for 2000 total emissions change was from 10 to 20 million kg lower (Table 3.4).
Corrections have been made in RAINS at the low level of penetration of selective catalytic reduction (SCR) on power plants. Levels of control in RAINS have been increased for 2000 (Annex 6); for 2010 and later the degree of implementation is expected to be 100% due to the NOx-emission trading legislation. On the other hand for new gas-fired plant control
technology (SCR) has been removed, because the unabated emission factor of these plants is already so small that control is not logical. Taken collectively, these corrections lead to lower emissions in RAINS for all years.
Emission factors for road transport and for off-road transport for 2020, 2010 and 2000 have been corrected to better match the Dutch figures for all years.
Emissions of industrial combustion processes were adjusted to fit 2000 data by lowering the degree of implementation of control technologies on all combustion fuels (see Annex 1). Industrial process emissions for cement and nitric acid production were lowered in RAINS by applying the highest level of control in RAINS according to Dutch figures. Collectively, this causes a drop in emission for all future years.
Corrections on the missing fuel switch (oil to gas) by refineries have been implemented similarly to SO2. Since RAINS cannot implement a fuel switch, the expected fuel switch for
2010 has been largely implemented in RAINS using a dummy control technology, leading to lower emissions in 2010 and thereafter (8 million kg in 2010).
For domestic emissions from gas engines in agriculture (green houses) proposed corrections to increase unabated emission factors were not taken over by RAINS.
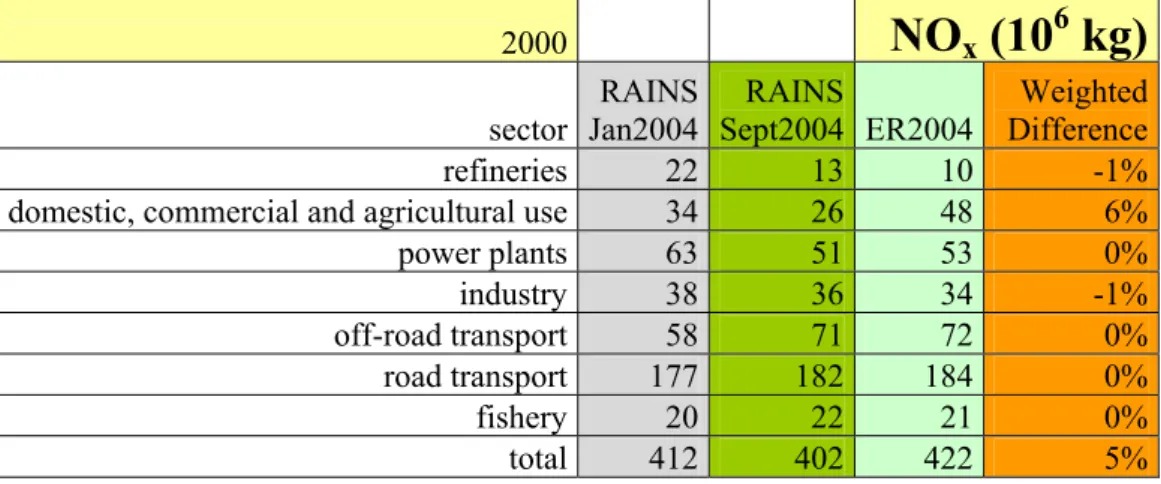
Table 3.6 Emissions of NOx for 2000 for RAINS calculations before and after correction and
for the Dutch Emission Registration
2000
NO
x(10
6kg)
sector RAINS Jan2004 RAINS Sept2004 ER2004 Weighted Difference refineries 22 13 10 -1%domestic, commercial and agricultural use 34 26 48 6%
power plants 63 51 53 0% industry 38 36 34 -1% off-road transport 58 71 72 0% road transport 177 182 184 0% fishery 20 22 21 0% total 412 402 422 5% Consequences
The total NOx emissions in RAINS match fairly well in 2010. However, there are large
differences on sector level. RAINS calculates 50% higher emission for fishery (25 million kg) and lower emissions for gas engines in agriculture (11 million kg), off-road transport (8 million kg) and power plants (7 million kg) in 2010. Because power plants, (off-)road transport and agriculture are the most important sectors for (cost-effective) abatement options, these lower emissions will lead to lower NOx abatement targets for these sectors at
lower cost.
Although there is a good match on sector level for road transport there are differences on sub-sector level. These concern a lower share of diesel in light duty vehicles in RAINS. In 2010 this effect is negated by a lower degree of control technology on heavy duty transport in RAINS. However, in 2020 the lower diesel share in RAINS causes lower emissions in road transport totals. This is important because there will be much focus on traffic for abatement options in CAFE. The differences in diesel share and heavy duty emissions may lead to incorrect application of abatement measures. Current policy (implementation of control measures) in RAINS reflects Dutch policy satisfactory.
The definition for fishery emission calculations has not been implemented in the correct manner in RAINS leading to higher emissions in 2010 and 2020. For fishery there is, to date, no control technology assumed, which means that these emissions will not be affected in abatement scenarios and will have no effect on abatement costs calculated. These erroneous higher emissions are countered by the underestimation of emissions from agriculture, off-road transport and power plants. The effect of this on total abatement costs is currently unclear.
The lower emission for gas engines is caused by a lower emission factor in RAINS. Corrections to solve this have not been implemented. The lower emissions for power plants and off-road transport are caused by lower assumption on activity level in the CAFE baseline on respectively coal use (see SO2) and air traffic.
3.3
NH
3emissions
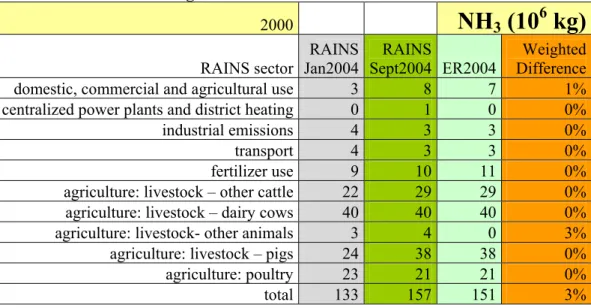
DifferencesRAINS total NH3 emissions for the year 2010 are 22 million kg and in 2000 6 million kg
higher. Agriculture is emitting the lion’s share of the total emissions and is consequently the cause of the lion’s share in differences (Table 3.8 and 3.9). The higher emissions in 2010 are caused mainly by higher animal numbers in the CAFE baseline for pigs (29%), cows (10%) and chickens (18%) (Annex 4). The CAFE baseline holds higher animal numbers since it has not taken the effects into account of the nitrate directive and increasing milk production per dairy cow in the Netherlands in the context of the super levy (ceiling on milk production). The higher animal numbers lead to a 17 million kg higher emission of NH3;8 million kg for
pigs, 6 million kg for cows (2.6 million kg cattle and 3.4 million kg dairy) and 3 million kg for chickens. Another reason for the higher emissions is that RAINS cannot incorporate typically Dutch control technologies such as feed low in nitrogen and low-emission housing for dairy cattle. On the other hand, RAINS calculates lower emissions, since the effects of the EU ban on battery cages has not been taken into account.
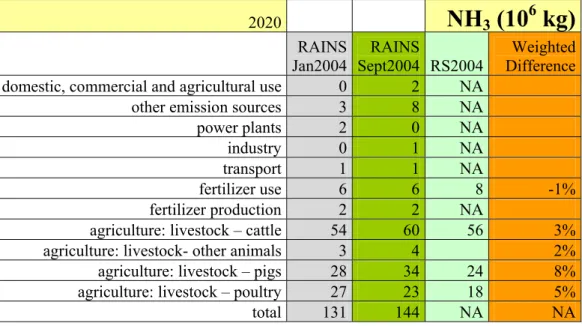
Table 3.7 Emissions of NH3 for 2020 for RAINS calculations before and after correction and
for the Dutch Reference Scenario
2020
NH
3(10
6kg)
RAINS Jan2004 RAINS Sept2004 RS2004 Weighted Differencedomestic, commercial and agricultural use 0 2 NA
other emission sources 3 8 NA
power plants 2 0 NA
industry 0 1 NA
transport 1 1 NA
fertilizer use 6 6 8 -1%
fertilizer production 2 2 NA
agriculture: livestock – cattle 54 60 56 3%
agriculture: livestock- other animals 3 4 2%
agriculture: livestock – pigs 28 34 24 8%
agriculture: livestock – poultry 27 23 18 5%
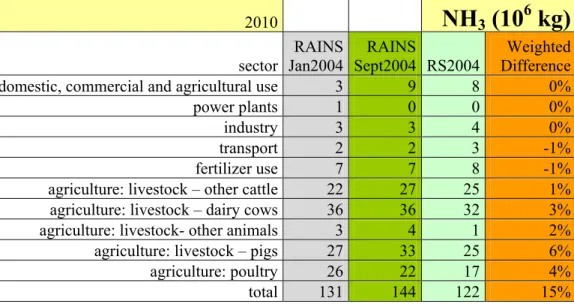
Table 3.8 Emissions of NH3 for 2010 for RAINS calculations before and after correction and
for the Dutch Reference Scenario
2010
NH
3(10
6kg)
sector RAINS Jan2004 RAINS Sept2004 RS2004 Weighted Differencedomestic, commercial and agricultural use 3 9 8 0%
power plants 1 0 0 0%
industry 3 3 4 0%
transport 2 2 3 -1%
fertilizer use 7 7 8 -1%
agriculture: livestock – other cattle 22 27 25 1%
agriculture: livestock – dairy cows 36 36 32 3%
agriculture: livestock- other animals 3 4 1 2%
agriculture: livestock – pigs 27 33 25 6%
agriculture: poultry 26 22 17 4%
total 131 144 122 15%
Corrections
The difference between RAINS and RS2004 total NH3 emissions for 2010 increased from
9 million kg higher before consultation to 22 million kg higher after consultation; for 2000 this went from 18 million kg lower to 6 million kg higher (Table 3.9).
Dutch animal numbers for future years (Annex 4) have been submitted to IIASA to be incorporated in the CAFE baseline in RAINS. IIASA has incorporated this data, however not into the European-wide scenarios, but into the national scenario. This national scenario now holds Dutch data on animal numbers completed with European-wide energy figures from the European wide-scenario including climate policy.
The increase of 12 million kg in livestock emissions for pigs, cattle and other animals in 2010 is caused by adjustments of these emissions to match the 2000 figures. These adjustments cause emissions to increase in 2000 and in future years.
The increase of 6 million kg in the domestic, commercial and agricultural combustion sectors is caused by corrections to match the 2000 emissions of domestic emissions. This causes emissions to increase in 2000 and in future years.
RAINS has not taken into account the effect of the EU ban on battery cages for laying hens. Because of this ban in 2012 housing systems will have to switch from cages to floor-based systems. Battery caged animals excrete about 28% less NH3 than birds in the floor-based
system. RAINS underestimates the forecasted effect of ammonia emission (about 2 million kg NH3 in 2010). Corrections have not been made since they should be applied to
all countries; however, European-wide data has not been available.
RAINS cannot incorporate typically Dutch control technologies like low nitrogen feed and low emission housing for dairy cattle as these abatement options are not available for the RAINS optimization calculation.
Table 3.9 Emissions of NH3 for 2000 for RAINS calculations before and after correction and
for the Dutch Emission Registration
2000
NH
3(10
6kg)
RAINS sector RAINS Jan2004 RAINS Sept2004 ER2004 Weighted Differencedomestic, commercial and agricultural use 3 8 7 1%
centralized power plants and district heating 0 1 0 0%
industrial emissions 4 3 3 0%
transport 4 3 3 0%
fertilizer use 9 10 11 0%
agriculture: livestock – other cattle 22 29 29 0%
agriculture: livestock – dairy cows 40 40 40 0%
agriculture: livestock- other animals 3 4 0 3%
agriculture: livestock – pigs 24 38 38 0%
agriculture: poultry 23 21 21 0%
total 133 157 151 3%
Consequences
Future emissions are higher in RAINS than in RS2004 due to higher animal numbers. However, the Dutch figures have been incorporated in RAINS into the national scenario, so are taken into account in CAFE. The CAFE baseline contains more animals for the Netherlands because this projection has not incorporated the effect of the nitrate directive and the increasing milk production per dairy cow in the Netherlands in the context of the super levy (ceiling on milk production). This causes higher ammonia emissions in RAINS in 2010 and later. Higher emissions may result in more need of control. However, since RAINS is lacking some typical Dutch control technologies such as low nitrogen feed and low emission housing for dairy cattle, there are fewer control technologies available to abate ammonia. The low nitrogen feed is a cost effective measure for farms on sand ground (Beck et al., 2004), whereas low emission housing is an expensive option. The outcome of the optimization process of RAINS will lack these options and will lead to abatement levels with higher calculated emissions and costs than when using lower animal numbers and all control technologies.
3.4
VOC emissions
At the end of the first consultation period (April, 2004) the RAINS database for VOC was far from complete (compare Annexes). Only for the Transport and Gasoline Storage and Distribution, and combustion of fossil fuels had emission data been made available. This is the reason that analysis of the VOC data has been delayed and not completed yet either. Additional consultations took place between April and August 2004, resulting in more and better RAINS data in June and August 2004.
Differences
After consultation the RAINS total VOC emission matched well (Table 3.11). The differences for the sector refineries (including oil and gas distribution), domestic, industry (processes) and road transport are large. These differences are at least partly due to the fact that the emissions caused by the use of paint (a sector in RAINS) are included in the emission of several sectors in RS2004, e.g. industry, services, consumers and construction.
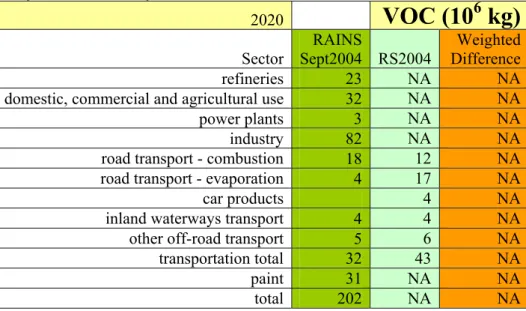
For road transport the main difference is the emission due to the evaporation of gasoline. Further analysis may reduce this difference, but it was not possible within the time-frame of the review to finish this analysis. Aspects to be considered here are the number of non-VOC control cars in 2010, the emission by other means of transport (mopeds, motor cycles) and the emission factors used. As can be expected, the same discrepancies exist for traffic in 2020 (Table 3.12). These aspects have been elaborated in more detail in the Annex.
The analysis of the RAINS result for industrial process emissions is complicated since the emission in RAINS due to the use of paint is partly included in the industrial emissions in the Netherlands. It is very probable, however, that the RAINS projection for VOC emissions from industrial process as well as the VOC emission due to the use of paint are too high in view of the abatement measures that have been applied in the Netherlands in the past 15 years and will be applied in the future.
Table 3.10 Emissions of VOC for 2020 for RAINS calculations before and after correction and for the Dutch Reference Scenario
2020
VOC (10
6kg)
Sector RAINS Sept2004 RS2004 Weighted Difference refineries 23 NA NAdomestic, commercial and agricultural use 32 NA NA
power plants 3 NA NA
industry 82 NA NA
road transport - combustion 18 12 NA
road transport - evaporation 4 17 NA
car products 4 NA
inland waterways transport 4 4 NA
other off-road transport 5 6 NA
transportation total 32 43 NA
paint 31 NA NA
Table 3.11 Emissions of VOC for 2010 for RAINS calculations before and after correction and for the Dutch ‘Reference Scenario’
2010
VOC (10
6kg)
sector RAINS Sept2004 RS2004 Weighted Difference refineries 24 16 -4%domestic, commercial and agricultural use 31 65 16%
power plants 2 2 0% industry 83 61 -10% off-road transport 10 9 -1% road transport 24 45 10% fishery 1 1 0% paint 34 IE -16% total 210 200 -5%
For the year 2000 too (Table 3.12), the total emission is more or less the same as for the two data sets; the same sectoral discrepancies exist as for 2010 (Table 3.11).
Table 3.12 Emissions of VOC for 2000 for RAINS calculations before and after correction and for the Dutch Emission Registration
2000
VOC (10
6kg)
Sector RAINS Sept2004 RS2004 Weighted Difference refineries 27 27 0%domestic, commercial and agricultural use 36 66 11%
power plants 2 4 1% industry 66 58 -3% off-road transport 12 10 -1% road transport 83 97 5% fishery 0 0 0% paint 38 IE -14% total 264 262 -1% Consequences
For 2000 and 2010 the difference between the total emissions in RAINS and RS2004 are relatively small, since the higher RAINS estimate for the emissions due to industrial processes is countered by the lower estimate for road transport. However, when additional abatement scenarios are simulated in RAINS, it is possible that for the VOC emissions from industry, oil-and-gas extraction and distribution, and emissions due to the use of paint, estimates for the Netherlands are therefore too high for the associated abatement cost. The current degree of implementation of the abatement technologies for these sectors in RAINS in 2000 and 2010/2020 is lower than in RS2004. This is not the case for road transport although for this sector, the calculated emission in 2010 is too low.
3.5
Particulate Matter emissions
The PM10 and PM2,5 emissions in the RAINS model are derived from estimated emissions of
Total Suspended Particles (TSP). The RAINS and ER2004 and RS2004 comparison has been performed using data for PM10 only. PM2.5 emissions are more closely linked to
carbon-related combustion processes and less to non-energy-carbon-related mechanical processes. The fractions used to calculate PM2.5 from TSP and PM10 were checked.
Differences
The discrepancy in the total PM10 emission is currently 7 million kg in 2010 and 9 million kg
in the 2000 assessment (Table 3.14 and 3.15). However, there are big discrepancies observed in sectors. RAINS calculates 15 million kg of PM10 emissions from domestic and commercial
use of fuels in 2010, as opposed to 8 million kg in RS2004. Further differences of 4-5 million kg are seen for emissions from agriculture and processes in industry. The 4 million kg higher emissions from agriculture in RAINS in 2010 are mainly the result of a larger livestock number, in particular, pigs. RS2004 expects a decreasing number of pigs compared to the situation in ER2004. The 5 million kg lower emission in RAINS in 2010 is unfortunately due to an unjust correction by matching emission registration (ER2004) figures for 2000. However the inventory of PM10 emissions from industrial processes in 2000 was
incomplete. Similar to the situation with SO2 and NOx, the erroneous interpretation of
emissions from fishery in RAINS is reflected in the 2 million kg difference in this sector in 2010.
It is interesting to note that, similar to NOx, there is reasonable agreement on 2010 emissions
from transport; the sector contributing most. In the further CAFE process this is of importance because several control options will be focusing on this sector. However, just as for NOx, when taking a closer look at the underlying fuel mix, RAINS appears to assume a
20% higher consumption of energy by gasoline cars and a 17% lower consumption by diesels. However, higher emissions from heavy duty vehicles in 2010 in RAINS, due to lower level of control technology (implementation of Euro-4 engines) counter the above effect of energy use, resulting in similar emissions from road transport in 2010. However, in 2020 the combination of different assumptions on the share of diesel and gasoline cars, and the age and composition of the car fleet, lead to about 2 million kg higher PM10 emissions from road
transport. These differences hold for PM2.5 as well due to the equivalence of PM10 and PM2.5
Table 3.13 Emissions of PM10 for 2020 for RAINS calculations before and after correction
and for the Dutch Reference Scenario
2020
PM
10(10
6kg)
sector RAINS Jan2004 RAINS Sept2004 RS2004 Weighted Difference refineries 1 1 NA NAdomestic and commercial use 10 13 NA NA
agricultural 13 13 NA NA power plants 0 0 NA NA industrial processes 9 9 NA NA off-road transport 4 3 3 -1% road transport 7 8 10 3% fishery 2 2 0 -3% total 47 49 NA NA
Table 3.14 Emissions of PM10 for 2010 for RAINS calculations before and after correction
and for the Dutch Reference Scenario
2010
PM
10(10
6kg)
sector RAINS Jan2004 RAINS Sept2004 RS2004 Weighted Difference refineries 1 2 2 0%domestic and commercial use 10 15 8 -13%
agricultural 13 13 9 -8% power plants 0 0 1 1% industrial processes 12 6 11 9% off-road transport 5 6 5 -2% road transport 8 8 9 1% fishery 2 2 0 -2% total 51 52 45 -15% Corrections
The consultation process resulted in an increase in the RAINS estimate of PM10 emissions of
2 million kg in 2010 (Table 3.14). The main change is found in industrial process emissions: a decrease in the RAINS calculation of 6 million kg. Unfortunately, this change was unjust. The error originates in the emission registration (ER2004), where the inventory of PM10
emissions from industrial processes in 2000 was incomplete.
The RAINS emissions from domestic and commercial fuel use increased by 5 million kg, leading to a 13-14% difference with the Dutch data. The increase originates, in particular, from emissions from fireplaces and wood-burning stoves. This happened despite our advice to adjust residential emissions (barbecues, smoking and firework) downward. However, RAINS currently calculates higher emissions from the domestic and commercial sector, mainly due to a 15-fold increase in energy input and a 25-fold increase in the emission factor of fireplaces.
Table 3.15 Emissions of PM10 for 2000 for RAINS calculations before and after correction
and for the Dutch Emission Registration
2000
PM
10(10
6kg)
sector RAINS Jan2004 RAINS Sept2004 ER2004 Weighted Difference refineries 1 2 3 2%domestic and commercial use 11 16 8 -14%
agricultural 12 12 10 -4% power plants 3 1 0 -1% industrial combustion 0 0 3 5% industrial processes 13 7 6 0% off-road transport 5 7 6 -2% road transport 11 11 12 1% fishery 1 1 0 -2% total 56 58 49 -15% Consequences
The higher total PM10 emissions (13-15%) in RAINS are caused by higher emissions from
greater use of domestic fuel and animal numbers in the CAFE baseline. The unjust lower emissions from industrial process emissions in RAINS in 2010 are to some extent countered by this overestimation. The total effect of this on abatement costs is currently unclear.
Although there is a good match on sector level for road transport, there are, just as for NOx ,
differences on sub-sector level. This concerns a lower share of diesel in light duty vehicles in RAINS. In 2010 this effect is negated by the lower degree of control technology in heavy duty transport in RAINS. In 2020, however, the national estimate of PM10 and, consequently
for PM2.5 emissions from road transport (see section on differences), are almost 2 million kg
higher, resulting mainly from the higher emissions from the higher share of diesel. This is an important conclusion because the main focus of the CAFE process will be on PM2.5 :
furthermore, the difference in diesel share and heavy duty emission may lead to faulty application of abatement measures.
The 7 million kg higher RAINS emissions from domestic and commercial use of fuel are expected to lead to higher abatement costs in RAINS. The control of emissions from residential sources takes place through certification of new wood stoves and the use of well-dried wood. Such options may be promising because of the possible reduction of the most health-relevant fraction at street level (Buringh and Opperhuizen, 2002). The potential of these measures, however, is much smaller in RS2004 than in RAINS. The national estimate of the potential of PM10 emission reductions from agriculture is somewhat lower than RAINS
calculates.
Emissions from animal housing systems can be reduced by applying a filter to the air ventilation system. The cost-effectiveness of this measure is limited, however, because ventilation flows are high and dust concentrations are low.
4.
Conclusions
The CAFE baseline is not suitable for determining the Dutch position in negotiations for new European air pollution policy (like the NEC review). The Netherlands will have to introduce a national scenario of its own to bring forward the Dutch expectations on future developments. While the RAINS model would seem appropriate for calculating abatement scenarios, contra-expertise will still be necessary during the CAFE process to assess differences in RAINS on calculated abatement costs and emission levels.
The main differences between the assumptions for the Netherlands in the national scenario and the CAFE baseline comprise a lower use of coal, higher animal numbers, higher domestic use of fuel and a lower share of diesel cars in the CAFE baseline. Less use of coal results in lower power plant emissions for SO2 (28% on total) and NOx (2% on total); higher
animal numbers lead to higher total NH3 (12%) and PM emissions (8%), while greater use of
domestic fuels (barbecues and wood stoves) leads to higher total particulate emissions in 2010 and a lower share of diesel cars leads to increasingly lower NOx and PM emissions up
to 2020 (7% and 3%, respectively, in 2020). Calculations using RAINS with the CAFE baseline scenario assumptions alone are not sufficient for reflecting the national view. Differences in scenario activity between the CAFE baseline and the national scenario are responsible for the main differences in total emissions.
The RAINS model causes less difference than the use of the CAFE baseline data itself and the level of implementation of control measures in RAINS in general reflects the current Dutch policy. RAINS seems appropriate for calculating total emissions. However, RAINS causes big differences in sector emissions. A big difference originates from the faulty interpretation of fishery emission calculations in RAINS, causing much higher emissions for SO2 (about 20%) and NOx (about 9%) in 2010 and 2020. Other differences are caused by
differences in the use of emission factors (VOC and NOx), different definitions of activities
and different use of control technologies (all components). These errors may hamper the calculation of abatement levels at lowest costs for all components. There is currently no unambiguous answer to what the total effect of these differences is on the abatement costs and levels.
Many errors in RAINS were corrected in the bilateral consultation with IIASA. However, three essential proposals that were agreed to correct the faulty interpretation on fishery, the low NOx emission factor for gas engines in agriculture and the high PM10 emission factor for
residential combustion, have not been adopted by IIASA.
In RAINS total emission for SO2 are 10% lower in 2010 due to the use of coal, which was too
low in the CAFE baseline according to national expectations. When calculating abatement scenarios especially differences in coal use may lead to lower levels for SO2. This is
important because the Netherlands has problems meeting its NEC target for SO2 and newly
calculated targets below this ceiling may underestimate or not reveal this problem and its associated costs.
The total NOx emission in RAINS shows a good match with national data in 2010. However
on sector level RAINS calculated higher emission due to a faulty interpretation of fishery and lower emissions due to an underestimation of emission factors of gas engines in agriculture
(11 million kg), lower air traffic levels (8 million kg) and a lower use of coal for power plants (7 million kg). The lower share of diesel cars is masked by lack of control on heavy duty in 2010; however, it becomes apparent in total emissions for transport in 2020 (12 million kg). Since these sectors with lower emissions are the most important sectors for abatement options, resulting abatement levels and associated costs in RAINS may be inappropriate. Future NH3 emissions are higher in RAINS (12%) due to higher animal numbers. RAINS
also lacks some typical Dutch control technologies, so the result of both is leading to higher abatement levels for higher costs in RAINS with respect to national expectations.
The total VOC emissions in RAINS for 2010 match the national data. However, at sector level, the emissions from industrial processes (33 million kg) are higher due to differences in definitions and level of control. The emissions from road transport are lower (21 million kg) due to different emission factors. Emission-associated costs for abatement levels in RAINS will therefore be too high with respect to national expectations.
The higher total PM10 emissions (13-15%) in RAINS in 2010 are caused by higher emissions
due to as well greater use of domestic fuel as higher emission factor for residential combustion (7 million kg) and higher animal numbers in the CAFE baseline (4 million kg). These are partly countered by the underestimated emissions from industrial process (5 million kg) in RAINS in 2010. The total effect of this on total abatement costs is unclear. The effect of a lower share of diesel cars on PM10 and PM2.5 emissions for transport is
masked by higher emissions caused by lack of control on heavy duty in 2010 but becomes apparent in 2020. This is important because much of the focus in CAFE will be on abatement of PM2.5 from road traffic. These differences may lead to a faulty application of abatement
References
Amann M., I. Bertok, J. Cofala, F. Gyarfas, C. Heyes, Z. Klimont, W. Schöpp and W.
Winiwarter, 2004. Two baseline scenarios for the Clear Air for Europe (CAFE) program. Part 1: Explanatory notes, IIASA, Laxenburg.
Beck J.P., R.J.M. Folkert and W.L.M. Smeets, 2004. Evaluation of the Implementation memorandum for emission ceilings, acidification and large-scale air pollution 2003. Report 500037003, RIVM, Bilthoven. In Dutch.
Brink, R.M.M., 2003. Update of emission projection for transport in 2010 and 2020. RIVM memorandum, Bilthoven. In Dutch.
Buringh E. and A. Opperhuizen, 2002. On health risks of ambient PM in the Netherlands, RIVM, Bilthoven.
Egmond, P.M. van, N.J.P. Hoogervorst, G.J. van den Born, B. Hage and S. van Tol, The environmental effects of the Integrated Approach to the Manure problem (IAM). Report 773004009, RIVM, Bilthoven, 2001. In Dutch.
European Commission, 2003. European energy and transport, Trends to 2030, Brussels. European Environmental Agency, 1996, Joint EMEP/CORINAIR Atmospheric Emission Inventory Guidebook, 1st Edition, Copenhagen.
FAO, 2003. World Agriculture: towards 2015/2030. An FAO perspective. Earthscan publications, London.
Hoogeveen, M.W., H.H. Luesink, G. Cotteleer and K.W. van der Hoek, 2003. Ammonia emissions in 2010. Baseline scenario and effects of existing and future legislation. Report 680000001, RIVM, Bilthoven. In Dutch.
Annex 1 Energy & Industry
The following RAINS sector activities will be addressed in this annex. Power plants
Fuel production and conversion: combustion Industry, combustion in boilers
Industry, other combustion Industrial processes
The power plant sector includes the centralized production of electricity and district heating, and is further subdivided into new power plants and existing plants. Existing plants refer to sources that came on line prior to or in 1990. In addition, existing plants are further subdivided into wet-bottom boilers and other types of boilers. The reason for this subdivision is the difference in NOx emission factors. Such a subdivision is not necessary for calculating
sulphur emissions.
The fuel conversion sector includes refineries, coke and briquette production plants, coal gasification plants etc, but does not include the power stations and district heating plants. Energy consumption for fuel conversion as recorded under combustion in the conversion sector includes only the energy consumed in the fuel conversion process and not the energy content of the input materials and final fuel products. The losses during transmission and distribution of the final product are reported under the use of electricity and heat by the fuel conversion sector and by the industrial auto -producers for their own use. The use of electricity and heat by power plants and district heating plants for their own use, and losses during the transmission and distribution of electricity and district heat, are included in this category. The reason for this subdivision is the difference in NOx emission factors. such a
subdivision is not necessary for calculating sulphur emissions.
For industrial energy use, the RAINS database distinguishes between energy combustion in industrial boilers for the auto-production of electricity, and heat and fuel combustion, in other industrial furnaces. This distinction was introduced to assure future comparability with fuel consumption data provided in the CORINAIR 1994 inventory (EEA, 1996). However, the CORINAIR inventory for 1990 did not include full information on energy consumption according to the boiler/furnace category.
The available energy statistics and forecasts also do not always enable splitting industrial combustion between boilers and furnaces. In such a case, all industrial fuel combustion is reported as fuel combustion in other industrial furnaces. In the latest version of CORINAIR (CORINAIR’94) full details on fuel consumption are available, making it possible to attune the industrial energy consumption to more detailed structures.
Furthermore, RAINS also includes the so-called ‘process emissions’ in the industrial sector, i.e., emissions that cannot be directly linked to energy consumption. Industrial processes included in RAINS are
oil refineries, coke plants, sinter plants,
pig iron - blast furnaces, non-ferrous metal smelters,
sulphuric acid plants, nitric acid plants,
cement and lime plants, and pulp mills.
In order to assess future emissions from, for example, power plants, the RAINS model uses PRIMES energy scenarios with and without climate policy. In this scenario, the input of hard coal for the years 2010 and 2020 is much lower than according to a Dutch scenario currently in development. As a consequence, RAINS forecasts of future SO2 and NOx
emissions from power plants will be too low. NEAA believes that the PRIMES scenario is not realistic for the development of coal use in the Netherlands. It was proposed to revise the coal input figures in PRIMES in line with the trend in the latest Dutch scenario. The Dutch assumptions for future hard coal input in power plants are presented here, as well as a short description of the key features of the Dutch scenario.
Scenario background
RIVM and ECN (Energy Research Centre of the Netherlands) are in the course of developing a ‘Referentie Raming’ (Reference Scenario) for the Netherlands. up to the year 2020 for energy use and emissions of CO2, other greenhouse gases, NOx, SO2, NH3, NMVOC, and
PM. The results of this study, commissioned by the Ministries of Economic Affairs, Environment, Agriculture and Transport, will be published in a few months. The projection is based on a scenario including climate policy, which envelops emission trading. The cost advantage of production based on hard coal compared to production based on natural gas gradually diminishes due to a gradually rising price of CO2 emission rights2. But the price
level of CO2 emission rights, which actually makes it more expensive to operate a coal-fired
plant than a gas-fired plant (around EUR 35/ton) will not be reached before 2020. Therefore, it is assumed that existing coal-fired plants will remain in operation for their entire lifespan, but new production capacity will be based on natural gas. Because all existing plants were built after the early eighties, closure of the first coal-fired plants is expected after 2010. The degree of capacity utilization in 2010 is higher than in 2000, resulting in a higher coal input in 2010 than in 2000.
Dutch projection of coal input in electricity plants
2000 2010 2020
Number of coal-fired plants 8 8 5
Total capacity (MWe) 4000 4000 2340
Coal input (PJ) 210 243 160
Coal input (PJ) according to IIASA/PRIMES
(without climate policy effects) 214 81 45
Difference (PJ) -4 162 115
Compared to more recent Dutch insights, the coal input according to PRIMES is much lower. NEAA does not find the PRIMES scenario realistic about this point. The future emissions of NOx and SO2 calculated by IIASA are therefore also too low. It has been proposed to revise
the coal-input figures in PRIMES according to the trend in the latest Dutch scenario. The
2 In this scenario, the price of emission rights is: EUR 8/ton CO
2 in 2010, EUR 11/ton CO2 in 2020, EUR 61/ton CO2 in 2030 and EUR 89/ton CO2 in 2040.