Report 680704012/2010
E. van der Swaluw | J.H. Verboom | J.P.J. Berkhout | A.P. Stolk | R. Hoogerbrugge
A comparison of the old and new
wet-only samplers of the Dutch
National Precipitation Chemistry
Monitoring Network
RIVM Report 680704012/2010
A comparison of the old and new wet-only samplers of
the Dutch National Precipitation Chemistry Monitoring
Network
E. van der Swaluw, Centre for Environmental Monitoring J.H. Verboom, Centre for Environmental Monitoring J.P.J. Berkhout, Centre for Environmental Monitoring A.P. Stolk, Centre for Environmental Monitoring R. Hoogerbrugge, Centre for Environmental Monitoring
Contact:
Eric van der Swaluw
Centre for Environmental Monitoring Eric.van.der.Swaluw@rivm.nl
This investigation has been performed by order and for the account of Directorate-General for Environmental Protection, within the framework of 680704 Reporting Air Quality
© RIVM 2010
Parts of this publication may be reproduced, provided acknowledgement is given to the 'National Institute for Public Health and the Environment', along with the title and year of publication.
Abstract
A comparison of the old and new wet-only samplers of the Dutch National Precipitation Chemistry Monitoring Network
Wet-only samplers measure both acidifying (sulfur) as well as eutrophying (nitrogen) components and heavy metals. Research performed by RIVM has shown that the old and new wet-only samplers measure nearly similar concentrations of these chemical components in rain water. For acidifying and eutrophying components this yields data over long periods (long-term time series), which can be used to monitor the effects of policies. The concentrations found for heavy metals are in less agreement: for lead, cadmium and copper, the new wet-only samplers measure lower concentrations in rain water. The deviations are however small, therefore the obtained long-term time series can still be used. For lead this is not always the case. Especially for the lead concentrations measured at monitoring station De Zilk, the difference in the wet-only samplers yields a break in the time series.
In January 2006 the old wet-only samplers from the eighties of the last century have been replaced with new wet-only samplers in the Dutch National Precipitation Chemistry Monitoring Network. RIVM has performed simultaneous measurements with the old and new wet-only samplers in the period 2004-2006. The results of these measurements have been analyzed and compared.
A more detailed analysis has been performed in order to explain the differences found in the
concentrations for lead and cadmium. No explanation was found. The lower concentrations as found with the new wet-only samplers seem more plausible, since there is better agreement with the measurements in precipitation in nearby countries.
Rapport in het kort
Een vergelijking van de oude en nieuwe regenwatervangers van het Landelijk Meetnet Regenwatersamenstelling
Regenvangers meten in regenwater zowel verzurende (zwavel) als vermestende (stikstof) stoffen en zware metalen. Uit onderzoek van het RIVM blijkt dat oude en nieuwe regenwatervangers nagenoeg dezelfde hoeveelheden stoffen in regenwater meten. Hierdoor zijn voor verzurende en stikstofhoudende stoffen data over langere tijd beschikbaar (langjarige tijdreeksen), waarmee het effect van
beleidsmaatregelen kan worden gemonitord. De concentraties van de zware metalen komen minder goed overeen: voor lood, cadmium en koper worden met de nieuwe regenwatervangers lagere concentraties gemeten. Deze afwijkingen zijn echter dermate gering dat de data van de oude
regenvangers wel voor langjarige tijdreeksen kunnen worden gebruikt. Voor lood is dit niet altijd het geval. Vooral op station De Zilk is de geconstateerde sprong in de langjarige tijdreeks hiervoor te groot.
In januari 2006 zijn de oude regenvangers uit eind jaren tachtig van de vorige eeuw van het Landelijk Meetnet Regenwatersamenstelling vervangen door nieuwe. Het RIVM heeft de metingen met de nieuwe apparatuur in 2004-2006 uitgevoerd en vergeleken met de resultaten van de oude regenvangers uit deze zelfde periode.
Uit een nadere beschouwing van het verschil in de gemeten concentraties voor lood en cadmium is geen expliciete verklaring gekomen. De lagere resultaten van de nieuwe apparatuur lijken wel
plausibeler. Ze komen onder meer beter overeen met metingen van deze stoffen in regenwater in de ons direct omliggende landen.
Contents
Summary 9
1 Introduction 11
2 The changes in the monitoring network over the period
2004-2006 13
3 Method of analysis 17
4 The comparison of major components 21
4.1 Main results 21
4.2 Further analysis of the components H+, Ca and K 22
4.3 Influence on trends 23
5 The comparison of heavy metals 25
5.1 Main result 25
5.2 Influence on trends 27
6 Comparison of the precipitation rate between the rain gauge and the new wet-only sampler 29
6.1 The data 29 6.2 The result 30 7 Conclusions 31 7.1 Major Components 31 7.2 Heavy Metals 31 7.3 Influence on trends 31 7.4 Precipitation measurements 32 References 33
Appendix A Case study of lead 35
Appendix B Case study of cadmium 41
Summary
New wet-only samplers were provided for the Dutch National Precipitation Chemistry Monitoring Network in January 2006 at the sites where major components and heavy metals are being monitored. Simultaneous measurements with the old and new wet-only samplers were performed at three sites of the network in order to determine whether there are deviations in the measurements of concentration as taken by respectively the old and new wet-only sampler.
There is good agreement between the measurements of the concentration in precipitation with the old and new wet-only samplers for the major components. From the measurements of heavy metals it is shown that the concentrations as found with the new wet-only samplers are in general somewhat lower as compared to the old wet-only samplers.
Furthermore it is found that for those components with the strongest deviations between the
concentrations as measured with the old and new wet-only samplers, the influence of this difference on long-term trends is small. This is because the jump in going from the year 2005 to the year 2006, caused by the replacement of the wet-only sampler, is in general within the range of the noise due to the natural variability from year to year.
Finally it is shown that there is no significant difference in amounts of precipitation as measured with the rain gauge and the wet-only sampler. This means that in the absence of reliable rain gauge measurements, the wet-only samplers can be used as an alternative to obtain the amount of precipitation for a sample period.
1
Introduction
Since 1978 the Dutch National Precipitation Chemistry Monitoring Network has been operational in the Netherlands1. In 1988 wet-only samplers replaced bulk samplers which had always been used so far
in this network (Buijsman, 1989). Contrary to bulk samplers, wet-only samplers are closed with a lid when there is no precipitation, hence in the latter there is in principle no contribution from dry deposition into the collecting bottle. The wet-only samplers which came into use in 1988 were developed by the Energy research Centre of the Netherlands (ECN) and were a standard wet-only sampler at that time. Finally in January 2006, the Dutch National Precipitation Chemistry Monitoring Network was again provided with new wet-only samplers. These wet-only samplers (type: Eigenbrodt NSA 181 KHT) are currently used at all sites of the network for both major components and heavy metals2. Since January 2006 there are 11 monitoring stations where major components are continuously
being measured. At 4 of these locations, heavy metals are also continuously monitored. A list of the current monitoring stations is given in Table 1, whereas these stations are also indicated on a map of the Netherlands in Figure 1. A more detailed overview of all changes in the Dutch National
Precipitation Chemistry Monitoring Network over the period 2004-2006 is described in the next section.
Table 1 Monitoring stations of the Dutch National Precipitation Chemistry Monitoring Network. At all stations major components are measured. At stations marked with an asterisk heavy metals are also measured.
Station code Station name Longitude Lattitude
131* Vredepeel – Vredeweg 05°51’13"O 51°32’28"N
134 Beek – Vliegveldweg 05°46’38"O 50°54’57"N
231 Gilze-Rijen – Rijksweg 04°55’58"O 51°33’59"N
318 Philippine – Stelleweg 03°44’58"O 51°17’43"N
434* Rotterdam – Vliegveldweg 04°26’36"O 51°57’14"N 444* De Zilk – Vogelaarsdreef 04°30’37"O 52°17’53"N 538 Wieringerwerf - Medemblikkerweg 05°03’03"O 52°48’17"N
628 De Bilt – Wilhelminalaan 05°10’40"O 52°06’03"N
732 Speuld – Garderenseweg 05°43’17"O 52°16’21"N
929 Valthermond – Noorderdiep 06°55’52"O 52°52’36"N
934* Kollumerwaard – Hooge Zuidwal 06°16’39"O 53°19’54"N Simultaneous measurements with the old and new wet-only samplers were performed in order to determine whether there are deviations in the measurements of concentration as taken by respectively the old and new wet-only sampler. If significant deviations are present, they could for example disturb the long-term trends of the measured components going from the year 2005 to the year 2006 due to the change in wet-only samplers.
The components analyzed in the Dutch National Precipitation Chemistry Monitoring Network are split up in major components and heavy metals. These two categories include:
1 The network was initially a joint project of the National Institute for Public Health and the Environment (RIVM) and the
Royal Netherlands Meteorological Institute (KNMI). In 1989 the network was handed over completely to RIVM.
2 There were more bulk and wet-only samplers operational in the Netherlands which were not replaced with Eigenbrodt NSA
181 KHT in 2006: rain collectors for the measurements of mercury and lindane in precipitation at De Zilk, plus an EMEP wet-only sampler for daily measurements of major components of rain water at Kollumerwaard.
• major components: ammonium (NH4), nitrate (NO3), sulfate (SO4), phosphate (PO4), fluoride
(F), chloride (Cl), sodium (Na), potassium (K), magnesium (Mg), calcium (Ca), strong acid (H+), pH and conductivity (K25);
• heavy metals: vanadium (V), chromium (Cr), iron (Fe), cobalt (Co), nickel (Ni), copper (Cu), zinc (Zn), arsenic (As), cadmium (Cd) and lead (Pb).
934 929 732 628 538 444 434 318 231 134 131 0 12.5 25 50 75 100 Kilometers
Figure 1 The Dutch National Precipitation Chemistry Monitoring Network since January 2006. Green dots indicate that major components are measured, red dots indicate that major components and heavy metals are monitored.
2
The changes in the monitoring network over the
period 2004-2006
934 929 928 732 724 722 631 628 538 444 434 318 235 231 134 131 0 12.525 50 75 100 Kilometers 934 929 732 628 538 444 434 318 231 134 131 012.525 50 75 100 KilometersFigure 2 The Dutch National Air Quality Monitoring Network for Precipitation over the period 1992-2004 (left panel) and since 2006 (right panel). In 2001 the station Witteveen (928) was replaced by the station Valthermond (929).
During the period 1992-2004 the configuration of the Dutch National Air Quality Monitoring Network for Precipitation did not change except for the replacement of the station Witteveen (928) by the station Valthermond (929) in 2001. Valthermond is located 19 kilometre northeast of Witteveen. These two stations were never operational at the same time. Major components and heavy metals were monitored at all
15 stations operational during this period (see Figure 2).
As mentioned in chapter 1, the wet-only samplers used over the period 1992-2004 were developed at the Energy research Centre of the Netherlands (Buijsman, 1989). The opening of the funnel had a collecting area of 400 cm2, at a height of 1.50 meter. The collecting bottles from these samplers were not cooled during the sampling period, but were protected against sun light. After collecting the samples were stored at a temperature of 4 °C until analyses. The sampling frequency was two weeks, however samples of two subsequent periods were combined in the laboratory prior to chemical analysis, so that results were obtained for a period of four weeks.
In January 2005 a reduction took place from 15 to 11 monitoring stations, monitoring of major
components and heavy metals in precipitation at the stations 235, 631, 722, and 724 were stopped. Both major components and heavy metals were monitored at the remaining 11 monitoring stations. The sampling frequency of all components and the wet-only samplers themselves remained however the same as described above.
Finally in January 2006 a reduction took place from 11 to 4 monitoring stations for heavy metals in precipitation, monitoring of heavy metals at the stations 134, 231, 318, 538, 628, 732 and 929 for heavy metals were stopped. However, the monitoring of major components in precipitation continued at all 11 stations.
In January 2006 the wet-only samplers of the Dutch National Precipitation Chemistry Monitoring Network were replaced with the type Eigenbrodt NSA 181 KHT for both major components and heavy metals (see Figure 3). The opening of the funnel has a collecting area of 500 cm2, at a height of 1.5 meter. The collecting bottles from these samplers are cooled during the sampling period and protected against sun light. After collecting the samples are stored at a temperature of 4° C until analyses. The sampling frequency has changed from two weeks to one week. For the major components samples of two subsequent periods are combined in the laboratory prior to chemical analysis, so that results are obtained for a period of two weeks. For heavy metals samples are not combined, so that results are obtained for a period of one week.
Figure 3 The setting up of the wet-only samplers of the Dutch National Air Quality Monitoring Network for Precipitation in Vredepeel (131) with the old samplers (top panel) and the new samplers (bottom panel)
3
Method of analysis
The first comparison between results from measurements with the old and new wet-only samplers were performed during the period 6 October 2004 until 6 April 2005 for major components and heavy metals. This experiment was performed at Bilthoven (RIVM), where the results from measurements with three new wet-only samplers at the RIVM site were compared with results from measurements with the old wet-only samplers used at De Bilt (628) for both major components and heavy metals3.
The distance between these measuring locations is approximately 2.5 kilometres. Additionally the old and new wet-only samplers were used for simultaneous measurements during the whole period of 2006 at De Zilk (444) and Kollumerwaard (934) for major components and heavy metals.
Simultaneous measurements with both the old and new wet-only samplers yield two samples of rainwater per measuring period. Analysis of these two samples therefore yields two values for the measured concentration C of a component: one obtained from the old wet-only sampler and one obtained from the new wet-only sampler4. In this way a set of concentration (C
old, Cnew) is available for
each component. In case when a measured concentration is below the detection limit, the measured value is still taken along in the analysis performed for this report (i.e. so these kind of values are not replaced by a fraction of the detection limit itself).
Next the available sets (Cold, Cnew) for each component from Bilthoven, De Zilk and Kollumerwaard
are treated individually and as one dataset. An orthogonal regression forced through the origin is calculated for each of the datasets such that the regression coefficient (RC) describes the
correspondence between the concentration with the old and new wet-only samplers: old
new
RC
C
C
=
×
. (1)The regression analysis is performed with the template RTOOL, developed at RIVM (Beijk, V1.4.2, 2010). Subsequently a measure for the spreading S of the datasets is calculated as follows:
S = abs ( ( 1 – RC ) / σ ), (2)
here σ is the variance of the regression analysis.
In the following sections we present the analysis results of the datasets of major components and heavy metals yielding the regression coefficient RC and the spreading S as described above. The value obtained for RC indicates the influence on long-term trends of each component in going from the year 2005 to the year 2006 due to the change in wet-only samplers. The spreading S indicates the
significance of the value found for RC. We mark the deviations between the old and new wet-only sampler as too large when the regression coefficient is smaller than 0.8. The spreading is divided in respectively larger than 2σ and 3σ. These values are presented in tables were the following shading is used:
3 There were therefore six new wet-only samplers located at the RIVM site and two old wet-only samplers at KNMI. 4 In the case of the three new wet-only samplers operative at the RIVM ground the mean value is taken from the three values
• RC > 0.8 → green shading; • RC < 0.8 → red shading; • S < 2 → green shading; • 2 < S < 3 → yellow shading; • S > 3 → red shading; • Others → no shading.
An example of the regression analysis is given in Figure 4, which displays the whole dataset of ammonium (NH4). In this example the spreading of the points is not large (S = 0.6).
0.00
0.50
1.00
1.50
2.00
2.50
0.00
0.50
1.00
1.50
2.00
2.50
NH
4(old)
NH
4(n
ew
)
Figure 4 An example of a regression analysis as performed for all components in this report. The example concerns NH4. The analysis yields RC=1.02 and S=0.6.
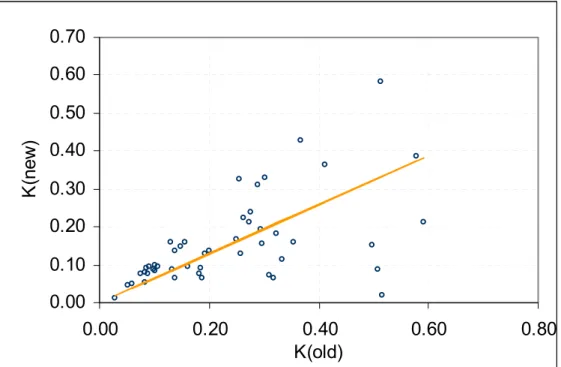
Figure 5 shows another example of a regression analysis for the whole dataset of potassium (K). In this example the spreading of points is large (S = 6.9).
Finally in this report the template MakeSense (Salmi et al., 2002) is used for the case studies (Appendices A and B). MakeSense calculates trends which yields a trend slope for a time series following the Sen's method. This tool has also been used in the recent Comprehensive Atmospheric Monitoring Programme (CAMP) assessments performed for the Oslo-Paris (OSPAR) convention (OSPAR 2005, 2009). MakeSense was also used in a recent RIVM report (van der Swaluw et al., 2010) for the determination of trends in concentration and wet deposition fluxes of major components and heavy metals over the period 1992-2004.
0.00
0.10
0.20
0.30
0.40
0.50
0.60
0.70
0.00
0.20
0.40
0.60
0.80
K(old)
K(
ne
w
)
Figure 5 An example of a regression analysis as performed for all components in this report. The example concerns K). The analysis yields RC = 0.65 and S = 6.9.
4
The comparison of major components
4.1
Main results
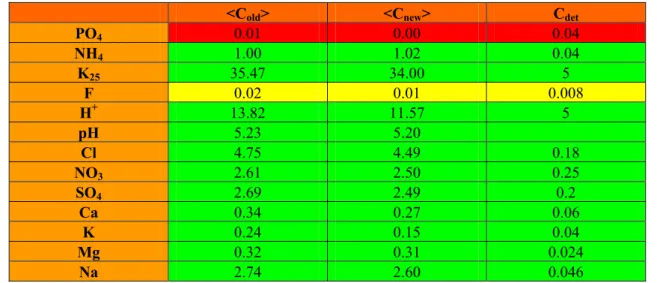
Simultaneous measurements with the old and new wet-only samplers were performed at Bilthoven, De Zilk and Kollumerwaard as described in chapter 3 of this report. Table 2 gives the mean value of the concentration in the complete dataset for each component from respectively the old and the new wet-only sampler in the first two columns plus the detection limit in the last column. The shading is green when the mean values of the concentration are larger than twice the detection limit, red when the mean values of the concentrations are smaller than the detection limit and yellow for values in between. In this way the shading illustrates the sensitivity of the comparison for results below the detection limit: green shading allows for a good comparison; yellow marks that precaution should be taken in the comparison and red shading indicates that a proper comparison is not possible.
Table 2 Mean values of the major components. Units are in mg/l.
<Cold> <Cnew> Cdet
PO4 0.01 0.00 0.04 NH4 1.00 1.02 0.04 K25 35.47 34.00 5 F 0.02 0.01 0.008 H+ 13.82 11.57 5 pH 5.23 5.20 Cl 4.75 4.49 0.18 NO3 2.61 2.50 0.25 SO4 2.69 2.49 0.2 Ca 0.34 0.27 0.06 K 0.24 0.15 0.04 Mg 0.32 0.31 0.024 Na 2.74 2.60 0.046
Table 3 shows the regression coefficient (RC) and the spreading (S) for each major component
obtained from the regression analysis with RTOOL. Table 3 shows the main result of this report for the
major components, providing information on the correspondence between measurements of the concentration with the old and new wet-only samplers. The rows of an element are not shaded in case
when the measured mean concentrations are less than the detection limit. One can see from the table that the components NH4, K25, F, pH, Cl, NO3, SO4, Mg and Na show good agreement between results
from respectively the old and new wet-only samplers (RC > 0.8). For the concentration of PO4 the
detection limit is too close to the observed values, so we can not make a proper comparison between measurements from the old and new wet-only samplers for this component. Finally for the components H+, Ca and K there are significant deviations (RC < 0.8) between the concentrations obtained from the samples with the old and new wet-only sampler.
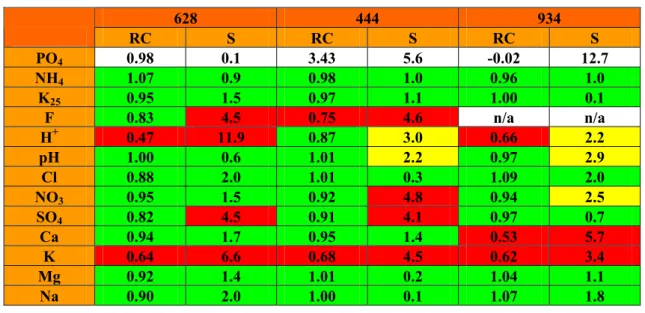
All major components are analyzed further by splitting up the total dataset into three separate datasets from the sites at respectively Bilthoven/De Bilt (628), De Zilk (444) and Kollumerwaard (934). For these three datasets an orthogonal regression analysis forced through the origin is performed again. These results are summarized in Table 4: the regression coefficient (RC) and the spreading (S) are
shown in this table. Again for the components H+, Ca and K there are significant deviations (RC < 0.8) between the concentrations obtained from the samples with the old and new wet-only sampler. In the next subsection it is investigated whether a plausible reason for these deviations can be found. Notice that at De Zilk the component F also has a RC < 0.8, we don't investigate this further because the measured concentrations of F are close to the detection limit (see Table 2).
Table 3 Results of the regression analysis of the major components
RC S PO4 0.02 12.6 NH4 1.02 0.6 K25 0.97 1.4 F 0.82 6.1 H+ 0.54 13.1 pH 0.99 1.5 Cl 1.03 1.1 NO3 0.94 3.5 SO4 0.87 6.6 Ca 0.66 7.2 K 0.65 6.9 Mg 1.01 0.5 Na 1.02 0.7
Table 4 Results of the regression analysis of the major components
628 444 934 RC S RC S RC S PO4 0.98 0.1 3.43 5.6 -0.02 12.7 NH4 1.07 0.9 0.98 1.0 0.96 1.0 K25 0.95 1.5 0.97 1.1 1.00 0.1 F 0.83 4.5 0.75 4.6 n/a n/a H+ 0.47 11.9 0.87 3.0 0.66 2.2 pH 1.00 0.6 1.01 2.2 0.97 2.9 Cl 0.88 2.0 1.01 0.3 1.09 2.0 NO3 0.95 1.5 0.92 4.8 0.94 2.5 SO4 0.82 4.5 0.91 4.1 0.97 0.7 Ca 0.94 1.7 0.95 1.4 0.53 5.7 K 0.64 6.6 0.68 4.5 0.62 3.4 Mg 0.92 1.4 1.01 0.2 1.04 1.1 Na 0.90 2.0 1.00 0.1 1.07 1.8
4.2
Further analysis of the components H
+, Ca and K
The value of RC for potassium (K) is low at all stations (see Table 4). Potassium is an element which is abundant in soil and hence might be contributing to the samples by airborne dust. The reason why the latter contribution is stronger in the old wet-only sampler than in the new wet-only sampler might be explained by the fact that the total opening time of the old wet-only sampler over 2006 is 25 % larger
as compared to the opening time of the new wet-only sampler5. Therefore dry deposition can contribute
to the samples in the following way: if the lid of the old wet-only sampler remains open after a rain event, dry deposition takes places onto the funnel of the wet-only sampler during its additional opening time. During the next rain event the deposit onto the funnel of the wet-only sampler is washed out into the collecting bottle of the wet-only sampler hence enhancing the concentration of the sample
(Buijsman, 1989). This mechanism was shown to give enhancements in the concentrations of bulk samplers of the order of 10 - 40 % (Buijsman, 1989).
Contrary to potassium, calcium shows good agreement between the values of the concentration obtained from the old and new wet-only samplers at Bilthoven (628) and De Zilk (444). Therefore Kollumerwaard (934) is the only location where the concentrations as measured with the new wet-only sampler are significantly smaller than the concentrations measured with the old wet-only sampler. A first explanation might again be that the contribution from airborne dust is significantly enhancing the concentration of calcium in the old wet-only sampler because the total opening time of the old wet-only sampler over 2006 is larger as compared to the opening time of the new wet-only sampler as described above. A second explanation might be found in the location of the old and new wet-only samplers at Kollumerwaard: the old wet-only samplers were located closer to a nearby road of the monitoring station. Traffic on this road is taking place during the harvest period which might cause periods with strong airborne dust events which influence the samples taken with the old wet-only sampler near to the road even stronger: this implies that airborne dust is contributing significantly to the samples in the old wet-only sampler when the lid of the sampler is open. The new wet-only sampler is less influenced since the distance to the road is much larger.
Finally the difference in concentration in the old and new wet-only samplers for the component H+ at De Zilk is the only location for which RC > 0.8, whereas for the other two locations RC < 0.8. A further investigation shows that the regression analysis at 628 is strongly determined by an outlier. Removing this point and repeating the regression analysis yields a RC of the order of unity. This leaves 934 as the only site where H+ results with the old and new wet-only sampler deviate (RC < 0.8).
4.3
Influence on trends
In van der Swaluw et al. (2010) a trend analysis of the concentrations of major components in
precipitation in the Netherlands over the period 1992-2004 is presented. During this period the old wet-only samplers were still being used. It was found that the concentrations of ammonium, nitrate, fluoride and sulfate in precipitation in the Netherlands have a downward trend above the 95 % significance level. The latter three components show RC > 0.8, therefore the results from the new wet-only samplers are expected not to influence the development of the time series for these three components. Since the components Ca, K and H+ do not show a downward trend above the 95 % significance level over the period 1992-2004, we do not investigate further the influence of the results from the new wet-only samplers on the development of the time series for these components.
5 Both at De Zilk and Kollumerwaard it was found that the opening time of the old wet-only samplers are 25 % larger as
compared to the opening time of the new wet-only samplers. Therefore there is an additional contribution from dry deposition in the old wet-only samplers.
5
The comparison of heavy metals
5.1
Main result
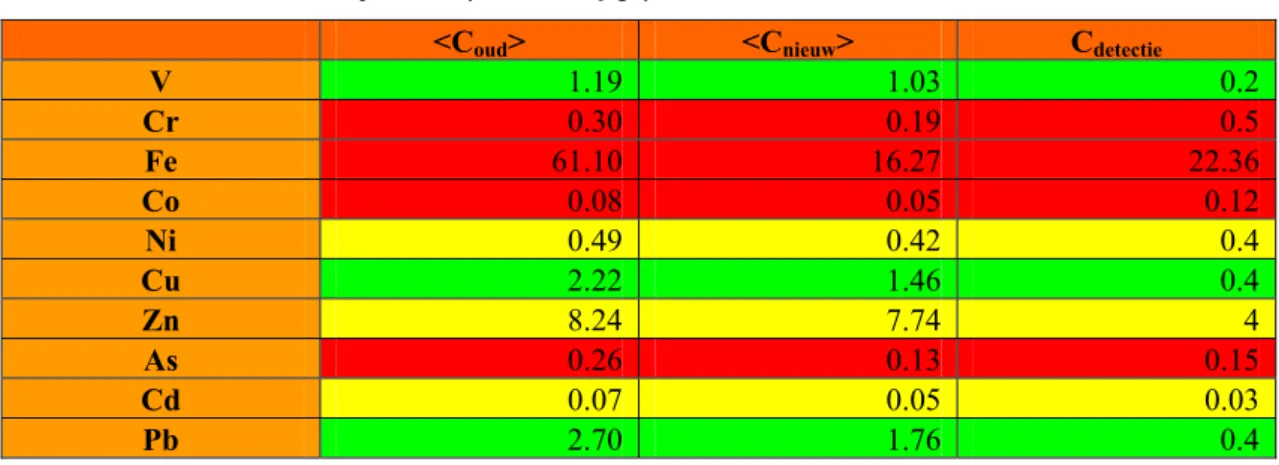
Simultaneous measurements with the old and new wet-only samplers were performed at Bilthoven, De Zilk and Kollumerwaard as described in chapter 3 of this report. Table 5 gives the mean value of the concentration in the complete dataset for each component from respectively the old and the new wet-only sampler in the first two columns plus the detection limit in the last column. The shading is green when the mean values of the concentration are larger than twice the detection limit, red when the mean values of the concentrations are smaller than the detection limit and yellow shaded for values in between. In this way the shading illustrates the sensitivity of the comparison for results below the detection limit: green shading allows for a good comparison; yellow marks that precaution should be taken in the comparison and red shading indicates that a proper comparison in not possible.
Table 5 Mean values of the heavy metals (in units of μg/l)
<Coud> <Cnieuw> Cdetectie
V 1.19 1.03 0.2 Cr 0.30 0.19 0.5 Fe 61.10 16.27 22.36 Co 0.08 0.05 0.12 Ni 0.49 0.42 0.4 Cu 2.22 1.46 0.4 Zn 8.24 7.74 4 As 0.26 0.13 0.15 Cd 0.07 0.05 0.03 Pb 2.70 1.76 0.4
Table 6 shows the regression coefficient (RC) and the spreading (S) for each heavy metal obtained from the regression analysis with RTOOL. Table 6 shows the main result of this report for the heavy
metal components, providing information on the correspondence between measurements of the concentration with the old and new wet-only samplers.
Table 6 Results of the regression analysis of heavy metals
RC S V 0.85 2.5 Cr 0.36 13.7 Fe 0.06 51.2 Co 0.24 16.1 Ni 0.91 1.3 Cu 0.66 6.7 Zn 1.09 1.5 As 0.28 16.7 Cd 0.79 4.1 Pb 0.79 4.2
The rows of an element are not shaded in case when the measured mean concentrations are less than the detection limit. One can see from the table that the components V, Ni, and Zn show good agreement between results from respectively the old and new wet-only samplers (RC > 0.8). For the concentration of Cr, Fe, Co and As the detection limit is too close to the observed values, so we can not make a proper comparison between measurements from the old and new wet-only samplers for this component. Finally for the components Cu, Cd and Pb there are considerable deviations (RC < 0.8) between the concentrations obtained from the samples with the old and new wet-only sampler. In general the heavy metals show much less agreement between the old and new wet-only samplers as compared to the major components.
Next we split up the total dataset into three separate datasets from the sites at respectively Bilthoven/De Bilt (628), De Zilk (444) and Kollumerwaard (934).For these three datasets an orthogonal regression analysis forced through the origin is performed again. The results are summarized in Table 7: the regression coefficient (RC) and the spreading (S) are shown in this table.
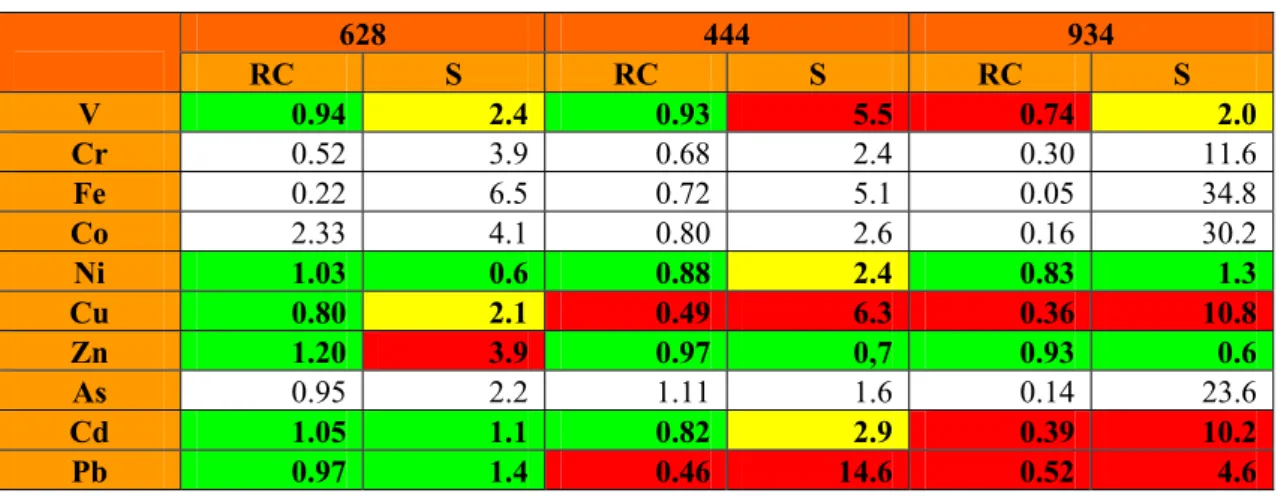
Table 7 Results of the regression analysis at individual sites
628 444 934 RC S RC S RC S V 0.94 2.4 0.93 5.5 0.74 2.0 Cr 0.52 3.9 0.68 2.4 0.30 11.6 Fe 0.22 6.5 0.72 5.1 0.05 34.8 Co 2.33 4.1 0.80 2.6 0.16 30.2 Ni 1.03 0.6 0.88 2.4 0.83 1.3 Cu 0.80 2.1 0.49 6.3 0.36 10.8 Zn 1.20 3.9 0.97 0,7 0.93 0.6 As 0.95 2.2 1.11 1.6 0.14 23.6 Cd 1.05 1.1 0.82 2.9 0.39 10.2 Pb 0.97 1.4 0.46 14.6 0.52 4.6
One can see from the table that the components V, Ni, and Zn again show good agreement between results from respectively the old and new wet-only samplers at all locations. As in the first analysis, the measured concentration of Cr, Fe, Co and As are too close to the detection limit in order to make a proper comparison between measurements from the old and new wet-only samplers. The heavy metals Cu, Cd and Pb do show strong deviations in the concentrations as measured with the old and new wet-only samplers at 444 and 934, but not at 628!
The disagreement between concentrations of Cd, Pb and Cu at De Zilk (444) and Kollumerwaard (934) might again be due to the 25 % longer opening times of the old wet-only samplers as compared to the new wet-only samplers: as argued for the components potassium in section 4.2 the longer opening time could lead to dry deposition on the funnel of the wet-only sampler when there is no precipitation. Next the deposit is washed out into the collecting bottle during the next rain event. Finally, it is remarkable that the locations De Zilk and Kollumerwaard show strong deviations for the heavy metals, whereas at De Bilt/Bilthoven no such deviations were found. The difference between the location of these stations is that both De Zilk and Kollumerwaard are near the coastal area of the Netherlands (respectively 2.5 and 7.5 kilometre), whereas De Bilt/Bilthoven is located in the center of the Netherlands. This casts the question whether the old wet-only samplers have been corroded by the briny air which in turn might have lead to contamination into the samplers.
5.2
Influence on trends
In van der Swaluw et al. (2010) a trend analysis of the concentrations of heavy metals in precipitation in the Netherlands over the period 1992-2004 is presented. During this period the old wet-only samplers were still being used. It was found that the concentrations of Ni, Zn, Cd and Pb in
precipitation in the Netherlands have a downward trend above the 95 % significance level. Since there are significant deviations in the values for the concentrations of Pb and Cd as measured with
respectively the old and new wet-only samplers, it is investigated in two separate case studies for lead (Appendix A) and cadmium (Appendix B) whether these deviations disturb the analysis of the trend in going from the year 2005 to the year 2006. Because the element Cu also shows large deviations between the old and new wet-only samplers (but does not have a statistically significant downward trend) it is shortly discussed in the Appendix C. For the case studies of lead and cadmium it is found that:
• results from new wet-only samplers are more in line with values obtained from other European Monitoring and Evaluation Programme (EMEP) stations;
• except for lead at De Zilk, the influence on the trends of lead and cadmium at other stations is relatively small.
The overall conclusion of the case studies is that measurements with the new wet-only samplers are more reliable as compared to the old wet-only samplers.
6
Comparison of the precipitation rate between the
rain gauge and the new wet-only sampler
In the Dutch National Precipitation Chemistry Monitoring Network there are two ways to measure the amount of precipitation: by means of a rain gauge and the wet-only sampler itself. In case when there is no data available from the rain gauge, the wet-only sampler itself is used to measure the amount of rainfall during a measuring period. Therefore it is of importance to know the correspondence of these two independent ways of measuring the precipitation rate.
6.1
The data
There are 11 measurement stations within the National Monitoring Network Precipitation (see Table 1). All stations are equipped with a rain gauge and a wet-only sampler to measure the major components. An additional wet-only sampler to analyze heavy metals is placed at four stations (131, 434, 444 and 934). The comparison is made over all stations for the years 2006 and 2007.
The data were checked before usage. Data points have not been taken into account, if the equipment showed technical problems during operation. Furthermore, the data of the samplers were converted to millimetre precipitation by dividing the mass in grams by the inlet surface of the sampler in square centimetres. Finally, the data on stations with two samplers have been averaged. Figure 6 shows the relation between two samplers at the same site. The data of all four stations is used.
0.00 20.00 40.00 60.00 80.00 100.00 120.00 140.00 0.00 20.00 40.00 60.00 80.00 100.00 120.00 140.00 Wet only sampler major components (mm)
Wet o nl y s am pl er he av y m et al s (m m ) y y = 0.99x
The figure shows a very good correlation between the two samplers. The slight deviation from y = x was caused by four data points at station 934, where the wet-only sampler for heavy metals collected significantly less than the wet-only sampler for major components. However, the technical reports did not show any problems. So, the data points have been taken into account. This resulted in 470 data points to be used in the comparison.
6.2
The result
The result of the comparison between the rain gauge and the wet-only sampler is given in Figure 6. The relation is determined by orthogonal regression forced through the origin.
Scatterplot with regression estimates
0.00 20.00 40.00 60.00 80.00 100.00 120.00 140.00 0.00 20.00 40.00 60.00 80.00 100.00 120.00 140.00 Rain gauge (mm) W et o nly s amp le r ( m m) y y=x
Figure 7 Wet only samplers versus rain gauge
Figure 7 shows no significant difference between the rain gauge and the wet only sampler. The
correlation coefficient is 0.98. So, in absence of reliable rain gauge data, the wet-only sampler could be used as an alternative to obtain the amount of precipitation for a sample period.
7
Conclusions
7.1
Major Components
A comparison study between measurements of the concentration in precipitation with the old and new wet-only samplers has shown good agreement for the components NH4, K25, F, pH, Cl, NO3, SO4, Mg
and Na. For the concentration of PO4 the detection limit is too close to the observed values, so a proper
comparison between measurements from the old and new wet-only samplers for this component can not be performed. Finally for the components H+, Ca and K there are significant deviations between the concentrations obtained from the samples with the old and new wet-only sampler. In the case of K this is attributed to contribution from airborne dust into the old wet-only samplers due to 25 % longer opening times of the old wet-only sampler. Furthermore it was shown that the concentrations of the element Ca and H+ only deviate at the location of Kollumerwaard. For Ca the deviation is explained by the combination of the longer opening time of the old wet-only sampler and the location of the old sampler near the road. The latter yields a stronger contribution from airborne dust into the sampler when it is open.
7.2
Heavy Metals
A comparison study between measurements of the concentration in precipitation with the old and new wet-only samplers has shown good agreement for the heavy metals V, Ni and Zn. For the concentration of Cr, Fe, Co and As, the detection limit is too close to the observed values, so a proper comparison between measurements from the old and new wet-only samplers can not be performed. The heavy metals Cu, Cd and Pb show strong deviations in concentrations as measured with the old and new wet-only samplers at De Zilk and Kollumerwaard. Like in the case of K and Ca, the disagreement between the concentrations at these sites might be partly explained by the 25 % longer opening times of the old wet-only samplers as compared to the new wet-only samplers. Lead and cadmium are also investigated in more detail in the Appendices A and B. The overall conclusions for both heavy metals are:
• deviations only at coastal sites;
• results from new wet-only samplers are more in line with values obtained from other EMEP stations;
• old wet-only samplers showed longer opening times and therefore the samplers were more exposed to contamination;
• except for lead at De Zilk, the influence on the trends of lead and cadmium at other stations is relatively small;
• measurements with the new only samplers are more reliable as compared to the old wet-only samplers.
7.3
Influence on trends
It was shown that, although there are significant differences between measurements with the old and new wet-only samplers for a few components, the influence on long-term trends since 1992 are at most sites negligible. This is because the jump in going from the year 2005 to 2006 is for most time series within the range of the noise due to the natural variability from year to year.
7.4
Precipitation measurements
It was shown that there is no significant difference in amounts of precipitation as measured with the rain gauge and the wet-only sampler. So, in absence of reliable rain gauge data, wet-only sampler could be used as an alternative to obtain the amount of precipitation for a sample period.
References
Buijsman, E. (1989) Kwaliteitsaspecten van het Landelijk Meetnet
Regenwatersamenstelling. I. Hoofdcomponenten. RIVM report 228703006 (in
Dutch). Rijksinstituut voor Volksgezondheid en Milieu (RIVM), Bilthoven.
OSPAR Commision (2005) Assessment of trends in atmospheric concentration and
deposition of hazardous pollutants to the OSPAR maritime area.
OSPAR Commision (2009) Trends in atmospheric concentrations and deposition of
nitrogen and selected hazardous substance to the OSPAR maritime area.
Salmi, T., A. Määttä, P. Anttila, T. Ruoho-Airola and T. Amnell (2002). Detecting trends
of annual values of atmospheric pollutants by the Mann-Kendall test and Sen's slope
estimates - the excel template application MAKESENS. Report code FMI-AQ-31.
Meteorologiska Institutet, Helsinki.
Van der Swaluw, E., W.A.H. Asman and R. Hoogerbrugge (2010) The Dutch National
Precipitation Chemistry Monitoring Network over the period 1992-2004. RIVM
report 680704009. Rijksinstituut voor Volksgezondheid en Milieu (RIVM),
Bilthoven.
Appendix A Case study of lead
A1 Time series of Lead
In Van der Swaluw et al. (2010) a trend analysis of the concentrations of heavy metals in precipitation in the Netherlands over the period 1992-2004 is presented. During this period the old wet-only
samplers were still used. It was found that the lead concentrations in the Netherlands have a downward trend above the 95 % significance level. As was shown in chapter 5, there are significant deviations in the values for the concentrations of lead as measured with respectively the old and new wet-only samplers. In this appendix it is investigated whether these deviations yield a break in the trend in going from the year 2005 to the year 2006.
The time series of lead for the period 1992-20086 are considered at all four locations where currently
heavy metals are being monitored in the precipitation network. Figures A1-A4 show the time series of lead at Vredepeel (Figure A1), Rotterdam (Figure A2), De Zilk (Figure A3) and Kollumerwaard (Figure A4). Results from the old wet-only sampler are marked with black dots, whereas the results for the new wet-only sampler are marked with red dots. Using Sen's method, a linear fit is calculated for each time series presented in the Figures A1-A4. We refer to this fit as 'Sen's estimate' in these figures (solid line). A linear fit for the data calculated over the period 1992-20056, when the old wet-only samplers were used, does not deviate significantly from the calculated fit for the data over the period 1992-20086, except at the station De Zilk (dashed line in Figure A3 is the fit over the period 1994-2005). This is visually confirmed by looking directly at the Figures A1-A4, from which it is obvious that only at station De Zilk there is a clear break in the trend in going from the year 2005 to the year 2006. This observed break in the trend is caused by the replacement of the old wet-only sampler with the new one.
At the sites of the monitoring stations De Zilk and Kollumerwaard the old and new wet-only samplers were simultaneously performing measurements during the year 2006. The difference in the lead concentrations is order of magnitude 2 at both locations (compare the red and black dot for the year 2006 in the Figures A3 and A4). Additionally the simultaneous measurements at De Zilk and Kollumerwaard have shown that the opening time of the old wet-only sampler was 25 % larger as compared to the opening time of the new only sampler. This means that the samples in the old wet-only sampler are vulnerable to contamination caused by dry deposition as explained in section 4.2. Finally it was mentioned that the old wet-only samplers at the coastal stations might have been
corroded by the briny air which in turn might also lead to contamination in the old wet-only sampler. In this appendix (sections A2 and A3) the measured values of lead at De Zilk and Kollumerwaard with the old and new wet-only samplers in 2006 are compared with concentrations of lead in precipitation in neighbouring countries for the same year. Such a comparison shows whether the concentrations found with the old wet-only samplers are indeed systematically higher (sections A2 and A3).
Finally one can see that the overall trend over the period 1992-2008 does not show a break at Kollumerwaard as a result of the replacement of the wet-only sampler. In fact Figure A4 seems to indicate that only the years 2005 and 2006 with the old wet-only samplers are outliers. This issue is investigated in more detail in the section A3.
0.00 0.50 1.00 1.50 2.00 2.50 3.00 3.50 4.00 4.50 1990 1995 2000 2005 2010 Year
Pb DataSen's estimate
Figure A1 The concentration of lead in rain water (in μg/l) over the period 1992-2008 at the location of Vredepeel
0.00 1.00 2.00 3.00 4.00 5.00 6.00 7.00 1990 1995 2000 2005 2010 Year
Pb DataSen's estimate
Figure A2 The concentration of lead in rain water (in μg/l) over the period 1992-2008 at the location of Rotterdam
0.00 0.50 1.00 1.50 2.00 2.50 3.00 3.50 4.00 4.50 5.00 1990 1995 2000 2005 2010 Year Pb Data Sen's estimate Old sampler
Figure A3 The concentration of lead in rain water (in μg/l) over the period 1995-2008 at the location of De Zilk
0.00 0.50 1.00 1.50 2.00 2.50 3.00 3.50 4.00 4.50 1990 1995 2000 2005 2010 Year
Pb DataSen's estimate
Figure A4 The concentration of lead in rain water (in μg/l) over the period 1992-2008 at the location of Kollumerwaard
A.2 De Zilk
Figure A5 shows the concentration of lead in precipitation as measured at De Zilk with the new and the old wet-only samplers for the year 2006 plus all measurements of that same year from the neighbouring countries of the United Kingdom, Belgium, France, Denmark and Germany as available from the EMEP data base (on-line available at http://www.emep.int). From Figure A5 one can see that the annual averaged value of the concentration of lead in precipitation with the old wet-only sampler at De Zilk is the highest of all shown measurements. Contrary the measurements of the concentration of lead in precipitation with the new wet-only sampler is more in line with the other observed values in neighbouring countries. In a similar figure for the year 2005 (not shown), the value of lead
concentration at De Zilk again has the highest value. For the year 2007 (not shown) the value of lead concentration at De Zilk is more in line again with the other measurements.
The findings from above argue once again that contamination has been significant for lead measurements in precipitation at De Zilk with the old wet-only sampler. From this we therefore conclude that the measurements of lead in precipitation at De Zilk with the new wet-only sampler are more accurate as compared to the measurements with the old wet-only sampler. Finally it is noted that there was a structural break in the trend of the time series at De Zilk after the year 2005 (Figure A3). It is therefore most likely that the old wet-only sampler at De Zilk must have had significant
contamination of lead over a much longer period than only its last 2 years (like in Kollumerwaard). Hence it is not clear when the contamination has started to influence the lead measurements at De Zilk.
A.3 Kollumerwaard
Figure A5 shows the concentration of lead in precipitation as measured at Kollumerwaard with the new and the old wet-only samplers for the year 2006 plus all measurements of that same year from the neighbouring countries of the United Kingdom, Belgium, France, Denmark and Germany as available from the EMEP data base (on-line available at http://www.emep.int). From this figure one can see that the annual averaged value of the concentration of lead in precipitation with the old wet-only sampler at Kollumerwaard is the highest of all shown measurements, except for the measurement at DE0008. Contrary the measurements of the concentration of lead in precipitation with the new wet-only sampler is more in line with the other observed values in neighbouring countries. In a similar figure for the year 2005 (not shown) the value of lead concentration at Kollumerwaard has the highest value of all
measurements. For the year 2007 (not shown) the value of the lead concentration at Kollumerwaard is again more in line with the other measurements. Furthermore, as one can see from Figure A4 the measurements of the lead concentrations in the years 2005 and 2006 with the old wet-only samplers are clear outliers. This is confirmed by Figure A6, which shows the comparison between lead
concentrations in air and precipitation at Kollumerwaard.
From the above arguments we conclude that contamination has been significant for lead measurements in precipitation at Kollumerwaard with the old wet-only sampler in 2005 and 2006. During these two years the measurements of lead in precipitation with the old wet-only sampler at Kollumerwaard seem to have been influenced by significant contamination.
A.4 Vredepeel and Rotterdam
At Vredepeel and Rotterdam no comparison studies were performed between the old and new wet-only samplers. There are no aerosol measurements at these stations available over the period 1992-2008 which would allow for a comparison like was made for the results at Kollumerwaard. Furthermore the Figures A1 and A2 of this report do not show an obvious break in the trend of lead concentrations at
0 0.2 0.4 0.6 0.8 1 1.2 1.4 1.6 1.8 2 D e Z il k ( oud) D e Z ilk (n ie uw ) B E 0014R D E 0001 R D E 0002 R D E 0003 R D E 0007 R D E 0008 R D K 00 08R D K 00 20R D K 00 22R D K 00 31R FR 0013 R FR 0090 R G B 0006R G B 0013R G B 0017R G B 0091R K 'w aa rd ( ni euw ) K 'w aa rd ( oud) Pb ( in u g/l )
Figure A5 Lead concentrations at De Zilk, Kollumerwaard and EMEP stations in the year 2006
0.000 0.500 1.000 1.500 2.000 2.500 3.000 3.500 4.000 4.500 1990 1992 1994 1996 1998 2000 2002 2004 2006 2008 2010 P b (in μ g/ l) 0.0 5.0 10.0 15.0 20.0 25.0 30.0 35.0 Pb ( in n g/ m 3 )
Pb in prec. (old)
Pb in prec. (new)
Pb in air
Figure A6 Lead concentrations in air and precipitation at Kollumerwaard. The concentration in precipitation for the year 2006 is the result with the new wet-only sampler.
Appendix B Case study of cadmium
B.1 Time series of cadmium
In Van der Swaluw et al. (2010) a trend analysis of the concentrations of heavy metals in precipitation in the Netherlands over the period 1992-2004 is presented. During this period the old wet-only
samplers were still being used. It was found that the cadmium concentrations in the Netherlands have a downward trend above the 95 % significance level. As was shown in chapter 5, there are significant deviations in the values for the concentrations of cadmium as measured with respectively the old and new wet-only samplers. In this appendix it is investigated whether these deviations yield a break in the trend in going from the year 2005 to the year 2006.
The time series of cadmium for the period 1992-20087 are considered at all four locations where
currently heavy metals are being monitored in the precipitation network. Figures B1-B4 show the time series of cadmium at Vredepeel (Figure B1), Rotterdam (Figure B2), De Zilk (Figure B3) and
Kollumerwaard (Figure B4). Results from the old wet-only sampler are marked with black dots, whereas the results with the new wet-only sampler are marked with red dots. Using Sen's method a linear fit is calculated for each time series presented in the Figures B1-B4. We refer to this fit as 'Sen's estimate' in these figures (solid line). A linear fit for the data calculated over the period 1992-20057, when the old wet-only samplers were used, does not deviate significantly from the calculated fit for the data over the period 1992-20087. This is visually confirmed by looking directly at the Figures B1-B4, from which it is obvious that no evident breaks are visible in going from the year 2005 to the year 2006.
However, at the sites of the stations De Zilk and Kollumerwaard the old and new wet-only samplers were simultaneously performing measurements during the year 2006. One can see that although the trend over the period 1992-2008 does not show a break at De Zilk and Kollumerwaard in going from the year 2005 to the year 2006, the difference in annual mean concentration for the year 2006 differs by a factor in between 1 and 2. The deviation at monitoring station De Zilk (Figure B3) seems to be only marginal as compared to the year-to-year variations present over the whole period 1992-2008. In the case of Kollumerwaard (Figure B4) it seems like the concentrations measured in the years 2005 and 2006 with the old wet-only samplers are outliers. This issue is investigated in more detail in section B2.
0.00 0.05 0.10 0.15 0.20 0.25 0.30 0.35 0.40 0.45 1990 1995 2000 2005 2010 Year
Cd DataSen's estimate
Figure B1 The concentration of cadmium in rain water (in μg/l) over the period 1992-2008 at the location of Vredepeel 0.00 0.02 0.04 0.06 0.08 0.10 0.12 0.14 0.16 0.18 0.20 1990 1995 2000 2005 2010 Year
Cd DataSen's estimate
Figure B2 The concentration of cadmium in rain water (in μg/l) over the period 1992-2008 at the location of Rotterdam
0.00 0.05 0.10 0.15 0.20 0.25 1990 1995 2000 2005 2010 Year
Cd DataSen's estimate
Figure B3 The concentration of cadmium in rain water (in μg/l) over the period 1992-2008 at the location of De Zilk 0.00 0.05 0.10 0.15 0.20 0.25 0.30 1990 1995 2000 2005 2010 Year
Cd DataSen's estimate
Figure B4 The concentration of cadmium in rain water (in μg/l) over the period 1992-2008 at the location of Kollumerwaard
B.2 Kollumerwaard
Figure B5 shows the concentration of cadmium in precipitation as measured at Kollumerwaard with the new and the old wet-only samplers for the year 2006 plus all measurements of that same year from the neighbouring countries of the United Kingdom, Belgium, France, Denmark and Germany as available from the EMEP data base (on-line available at http://www.emep.int). From this figure one can see that the annual averaged value of the concentration of cadmium in precipitation with the old wet-only sampler at Kollumerwaard is the highest of all shown measurements. Contrary the measurements of the concentration of cadmium in precipitation with the new wet-only sampler is more in line with the other observed values in neighbouring countries. In a similar figure for the year 2005 (not shown) the value of cadmium concentration at Kollumerwaard again has the highest value. For the year 2007 (not shown) the value of cadmium concentration at Kollumerwaard is more in line again with the other measurements. From this we conclude that the measurements of cadmium in precipitation at Kollumerwaard with the new wet-only sampler are more in-line with international measurements as compared to the measurements with the old wet-only sampler. Contrary to the case of lead at
Kollumerwaard the concentrations of cadmium in air and precipitation do not correlate very strongly. Therefore it is not possible to argue from the comparison between cadmium concentrations in air and precipitation that the year 2005 is a clear outlier. Therefore an additional check was made for the comparison between the measurements abroad for the year 2004 (not shown). For this year the value of cadmium is again more in line with the other values observed. From this and the other arguments we conclude that the measurement of cadmium concentration in precipitation at Kollumerwaard with the new wet-only sampler is in line with the measurements performed with the old wet-only sampler over the period 1992-2004. However the measurements with the old wet-only sampler at Kollumerwaard in 2005 and 2006 seem to have suffered from significant contamination.
0 0.01 0.02 0.03 0.04 0.05 0.06 0.07 K 'w aa rd ( oud) K 'waar d ( ni eu w ) B E 0014 R D E 00 01R D E 00 02R D E 00 03R D E 00 07R D E 00 08R D K 00 08R D K 00 20R D K 00 22R D K 00 31R F R 0013R F R 0090R G B 00 06R G B 00 13R G B 00 17R
B.4 Vredepeel and Rotterdam
At Vredepeel and Rotterdam no comparison studies were performed between the old and new wet-only samplers. There are no aerosol measurements at these stations available over the period 1992-2008 which would allow for a comparison like was made for the results at Kollumerwaard. Furthermore the Figures B1 and B2 of this report do not show an obvious break in the trend of cadmium concentrations at Vredepeel and Rotterdam.
Appendix C Time series of copper
In Van der Swaluw et al. (2010) no trend above the 95 % significance level was found for the element copper over the period 1992-2004. During this period the old wet-only samplers were still used. However as shown in chapter 4 of this report, significant deviations are found for copper when samples obtained with the old and new wet-only samplers are compared. In this section we present the time series of copper from 1992-2008 at all four stations were currently heavy metals are measured. Figures C1-C4 show the time series at Vredepeel (Figure C1), Rotterdam (Figure C2), De Zilk (Figure C3) and Kollumerwaard (Figure C4). Visual inspection shows an apparent break in the time series at the monitoring stations Vredepeel and Rotterdam. At monitoring stations De Zilk and Kollumerwaard, however, there is not a clear break due to the already large scattering in the measurement data from year-to-year. No explanation has been found for the above results.
0.00 0.50 1.00 1.50 2.00 2.50 3.00 3.50 4.00 1990 1995 2000 2005 2010 Year
Cu DataSen's estimate
Figure C1 The concentration of copper in rain water (in μg/l) over the period 1992-2008 at the location of Vredepeel 0.00 0.50 1.00 1.50 2.00 2.50 3.00 3.50 4.00 1990 1995 2000 2005 2010 Year
Cu DataSen's estimate
Figure C2 The concentration of copper in rain water (in μg/l) over the period 1992-2008 at the location of Rotterdam
0.00 0.50 1.00 1.50 2.00 2.50 1990 1995 2000 2005 2010 Year
Cu DataSen's estimate
Figure C3 The concentration of copper in rain water (in μg/l) over the period 1992-2008 at the location of De Zilk
0.00 0.50 1.00 1.50 2.00 2.50 3.00 1990 1995 2000 2005 2010 Year
Cu DataSen's estimate
Figure C4 The concentration of copper in rain water (in μg/l) over the period 1992-2008 at the location of Kollumerwaard
RIVM
National Institute for Public Health and the Environment P.O. Box 1
3720 BA Bilthoven The Netherlands www.rivm.nl