DECARBONISATION OPTIONS
FOR THE DUTCH CERAMIC
INDUSTRY
Jorick Besier, Marc Marsidi
21 December 2020
Decarbonisation options for the Dutch ceramic industry
© PBL Netherlands Environmental Assessment Agency; © TNO The Hague, 2020
PBL publication number: 4544
TNO project no. 060.33956 / TNO 2020 P12017
Authors
J.P. Besier and M. Marsidi
Acknowledgements
Special thanks to KNB, and its members, and TCKI, for their cooperation and feedback.
MIDDEN project coordination and responsibility
The MIDDEN project (Manufacturing Industry Decarbonisation Data Exchange Network) was initiated and is also coordinated and funded by PBL and TNO EnergieTransitie. The project aims to support industry, policymakers, analysts, and the energy sector in their common efforts to achieve deep decarbonisation. Correspondence regarding the project may be addressed to:
D. van Dam (PBL), Dick.vanDam@pbl.nl, or S. Gamboa Palacios (TNO), Silvana.Gamboa@tno.nl.
This publication is a joint publication by PBL and TNO EnergieTransitie and can be
downloaded from: www.pbl.nl/en. Parts of this publication may be reproduced, providing the source is stated, in the form: Besier, J. and Marsidi, M. (2020), Decarbonisation options for the Dutch ceramic industry. PBL Netherlands Environmental Assessment Agency and TNO EnergieTransitie, The Hague.
PBL Netherlands Environmental Assessment Agency is the national institute for strategic policy analysis in the fields of the environment, nature and spatial planning. PBL contributes to improving the quality of political and administrative decision-making by conducting outlook studies, analyses and evaluations in which an integrated approach is considered paramount. Policy relevance is the prime concern in all of PBL’s studies. PBL conducts solicited and unsolicited research that is both independent and scientifically sound. TNO EnergieTransitie has a twofold mission: to accelerate the energy transition and to strengthen the competitive position of the Netherlands. TNO conducts independent and internationally leading research and we stand for an agenda-setting, initiating and supporting role for government, industry and NGOs.
This report was reviewed by the Royal Dutch Association For Building Ceramics (KNB), the members of KNB, and independent knowledge and support centre of the Dutch ceramics technical industry (TCKI). PBL and TNO remain responsible for the content. The production volumes and capacity have not been verified by the companies. The specific energy and material consumption results are based on European data and may therefore deviate from the energy and material consumption of the Dutch ceramic industry. These specific consumption values should therefore be treated as indicative values.
Contents
Summary 4
INTRODUCTION
6
1
CERAMIC PRODUCTION IN THE NETHERLANDS
7
1.1 History of ceramic production in the Netherlands 7
1.2 Ceramic production companies in the Netherlands 8
1.3 Estimated production volumes and EU ETS CO2 emissions per location 14
2
CERAMIC PRODUCTION PROCESSES
18
2.1 General description of production processes and emissions 19
2.2 Brick and roof tile production process 22
2.3 Wall and floor tiles production processes 28
2.4 Refractory products production processes 32
3
CERAMIC PRODUCTS AND APPLICATIONS
33
3.1 Main products and applications 33
3.2 Markets 35
4
OPTIONS FOR DECARBONISATION
36
4.1 Fuel substitutions 37
4.2 Use of residual energy 41
4.3 Process design 43
4.4 CO2 capture and storage (or utilisation) 44
4.5 Product design 45
5
DISCUSSION
46
REFERENCES
48
FINDINGS
Summary
The Dutch ceramic industry can be distinguished in four main types of products: bricks, roof tiles, floor & wall tiles and refractory products1. At present, 43 ceramic plants are operational and covered by the Dutch ceramic association (KNB), many of them are located alongside the major rivers in the eastern and southern part of the Netherlands. Their total annual production capacity is estimated to be approximately 3.4 million tonnes end product, and brick and roof tile plants are responsible for 85% of the production. These products are being used as durable building materials with a long technical lifetime and made of renewable raw materials that are locally available.
The manufacturing process of ceramic products has five main steps:
• Preparation: Mixing the raw material (e.g. clay, loam) with water and additives. • Shaping: Shaping the material to the required dimensions by moulding, pressing or
extruding.
• Drying: Lowering the water content of the shaped green ware to less than 1%. • Firing: Heating the dried product so that the required chemical reactions occur. • Subsequent treatment: Additional decoration, packaging for transport.
The manufacturing process uses electricity and heat, supplied by the electricity grid and natural gas grid respectively.
CO2 emissions can be related to two types of emissions during the manufacturing process, namely fuel emissions and process emissions. Fuel emissions result from the burning of natural gas and process emissions result from the calcination process of the ceramic material when it is heated to certain temperatures. The process emissions are on average 26% of total emissions, and the total specific CO2 emissions of a ceramic product ranges from 0.18 to 0.48 tCO2 per tonne end product.
Different decarbonisation options are identified for the Dutch ceramic sector, which can be distinguished according to the abatement categories of MIDDEN.
• Fuel substitution
o Green gas: from the grid or from on-site gasification or digestion of biomass. o Hydrogen: hydrogen from the grid, burned by specific hydrogen burners. o Electric kiln and drying: using electricity – additional research is needed. o Microwave kiln and drying: using microwave radiation – additional research is
needed. • Use of residual energy
o Heat exchange: Extracting energy (heat) from flue gases for drying. o Heat pumps: Closed heat pump system to reuse low temperature waste
heat.
o Hybrid drying: Drying in two steps: aerothermal and semi-steam drying. • Process design
o Ultra-deep geothermal: Extracting heat from layers below 4000m.
o Extended tunnel kiln: More efficient firing, but no residual heat available for drying.
• CO2 capture and storage (or utilisation)
o Post-combustion CCS: Capture of CO2 from stacks followed by compression, or liquefaction, and storage.
• Product design
o Lighter products.
There are options available that could technically decarbonise the drying process in the short term. Technologies to decarbonise the high temperature firing process, however, are still in an early development phase (electric kiln and microwave supported technology) and require further research. To reduce the CO2 process emissions, only CCS can be applied. In addition, the following aspects should be considered in the decision process of implementing
decarbonisation options: long lifetime of equipment (especially the firing kiln), relatively remote location of plants with possible grid capacity problems, and the interaction between decarbonisation options for the drying and firing processes.
FULL RESULTS
Introduction
This report describes the current situation for ceramic production in the Netherlands and the options and preconditions for its decarbonisation. The study is part of the MIDDEN project (Manufacturing Industry Decarbonisation Data Exchange Network). The MIDDEN project aims to support industry, policymakers, analysts, and the energy sector in their common efforts to achieve deep decarbonisation. The MIDDEN project will update and elaborate further on options in the future, in cooperation with the Dutch ceramics industry.
The ceramic industry produces solid materials comprising an inorganic compound of metal or metalloid and non-metal with ionic or covalent bonds. This study focuses on the production of ceramic products used in the construction or industry sectors, such as bricks, roofing tiles, wall- and floor tiles, and refractory products.
Scope
In the Netherlands, production locations covered include:
• 37 ceramic plants that have a minimum production of 75 t per day, thus reported under the EU Emissions Trading System (EU ETS). Many plants are located next to large rivers in the eastern and southern parts of the Netherlands. Six further plants (next to the 37) are not covered in the report since they are smaller than 75 t per day (see Section 1.2).
Production processes include:
• Preparation of material, shaping, drying, firing and subsequent treatment. Products include:
• Facing bricks, paving bricks, inner wall bricks, roof tiles, wall and floor tiles and refractory products.
The main options for decarbonisation are:
• Fuel switching using green gas (either from the grid or produced on-site using gasification or digestion), hydrogen (from the grid), microwave assisted heating and drying or electric kilns and electric dryers, heat exchange from flue gases, heat pumps, ultra-deep geothermal, and CCS.
Reading guide
Section 1 introduces the Dutch ceramic industry. Section 2 describes the current situation for ceramic production processes in the Netherlands. Section 3 describes the main products of these processes, and options for decarbonisation are systematically quantified and evaluated in Section 4. The feasibility of and requirements for those decarbonisation options are discussed in Section 5.
1 Ceramic production
in the Netherlands
This section provides a general overview of the ceramic industry in the Netherlands. The scope is limited to 37 ceramic plants that produce products used by the construction or industry sectors. The majority (29) of the plants produce bricks (i.e. facing bricks, paving bricks and inner wall bricks), five plants produce roof tiles, two plants produce wall and floor tiles and one plant produces refractory products.
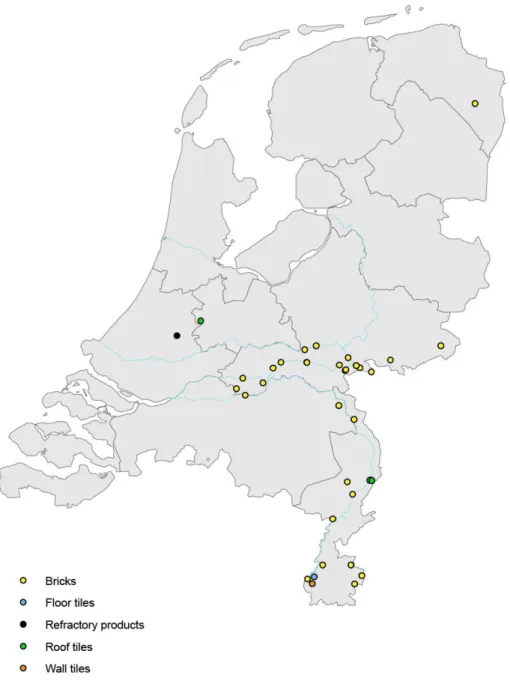
The following sections describe the history of ceramic production in the Netherlands, visualize the production locations of these companies (Figure 3) and elaborates on each company’s history, production locations, employees and revenues. Finally, Table 2 provides an overview of the calculated production volumes per location and EU ETS registered CO2 emissions for 2016.
1.1 History of ceramic production in the Netherlands
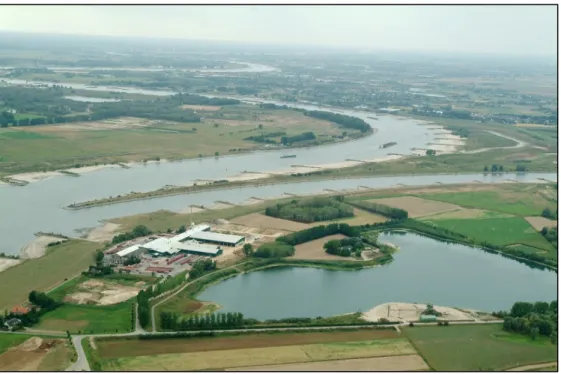
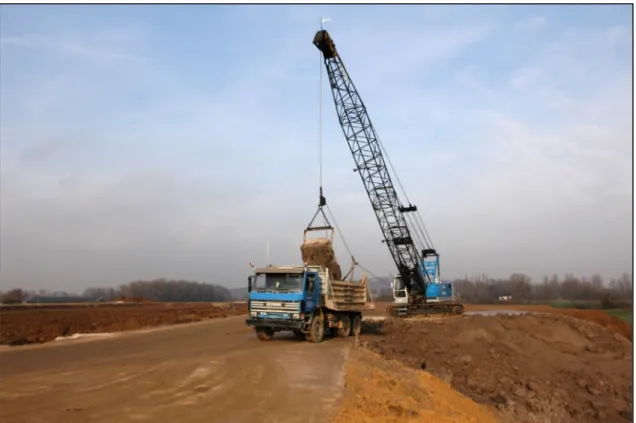
The ceramic industry has a long history in the Netherlands due to the large rivers (e.g. the Rhine and Meuse) that transport sediments from the higher parts of Europe. The raw material (clay) sticks together in so-called embanked floodplains along the rivers, where it can be easily extracted and transported to, often, nearby situated ceramic plants (see Figure 1). Clay is considered a renewable raw material, because it is continuously brought to the Netherlands by the large rivers and ultimately, has to be taken out of the river basin as a means of high water security.
Figure 1. A typical location of a ceramic plant alongside the river. Source: (KNB, 2020).
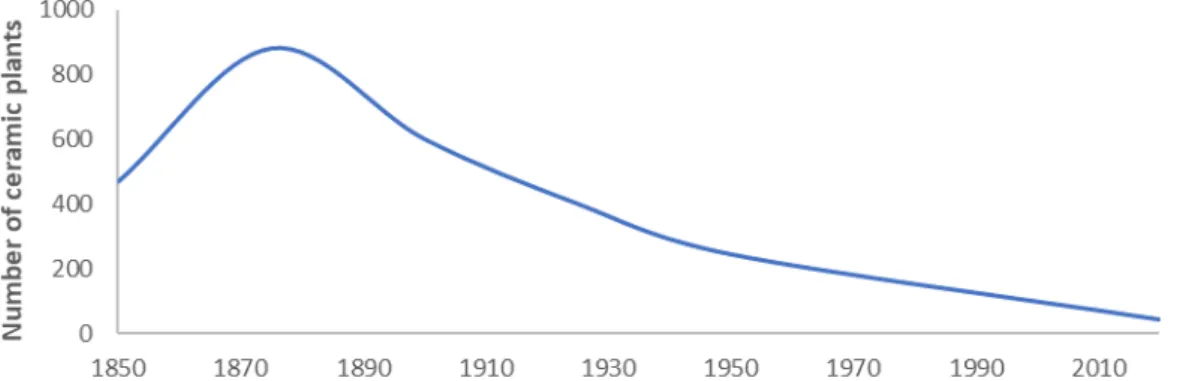
This geographic advantage and rising local demand of ceramic products (mainly building bricks) resulted in the development of many manufacturing sites alongside the rivers with a peak of 900 plants at the second half of the 19th century (see Figure 2). The decennia
following this peak, plants were closed or merged due to a decreasing demand and increased global competition (Lintsen, 1993, p. 271).
Figure 2. The rise and decline of the number of ceramic plants in the Netherlands over the last two centuries. Source: adapted from Corten (Corten, 1994), with the present number of plants included.
Today, there are 43 ‘coarse’2 ceramic plants, owned by 16 companies, represented by the Dutch ceramic branch association (KNB) (KNB, 2020). The location alongside the river means that some of these factories are also located next or close to protected Natura2000 areas3, which were clay extraction sites in the past, but are now restored nature areas. Nowadays, these Natura2000 areas have to be protected against nitrogen oxide depositions from factories, as for example ceramic production plants. This may result in conflicting interests with regards to decarbonisation options and the energy transition, when (the implementation of) CO2 reduction measures may lead to additional nitrogen oxide emissions.
1.2 Ceramic production companies in the Netherlands
This report covers 37 production plants of which 36 are owned by companies represented by the KNB (see Figure 3 for their locations on a map). Six plants (out of the 43 plants that are represented by the KNB) are not included due to their relatively small production volumes (less than 75 t per day)4. Although these plants are not included, the described production process and decarbonisation options in Sections 2 and 4, also apply to them.
DEKO BV is excluded, despite being a member of the KNB. Reason for this is that DEKO is not a brick or tile manufacturer but produces relatively thin strips of bricks by sawing manufactured bricks (named in Dutch: ‘steenzagerij’).
Furthermore, Steenfabriek de Nijverheid and Steenfabriek de Volharding are considered one entity in this report because both are registered at the same address (and in the EU ETS list). The name of this entity is Steenfabriek de Nijverheid.
2 Coarse ceramics are here defined as ceramics used in the construction sector.
3 These are more than 150 special natura conservation areas in the Netherlands, designated according to the
Habitats Directive and Birds Directive of the European Union.
The plant not represented by the KNB but included in this report (and part of the EU ETS) is Gouda Refractories B.V., manufacturer of refractory products. This plant is not represented by the KNB because it is not a manufacturer of building ceramics. Its products are meant for the inner lining of ovens for high temperature processes, such as in the glass or steel industry.
Figure 3. Map with the locations of the ceramic plants included in this MIDDEN report. Many of the plants are located alongside a big river.
1.2.1 Monier B.V.
Monier B.V. is part of the BMI Group, a leading manufacturer of roofing and waterproofing systems that is active in more than 40 countries. The BMI Group originates from 2017, when Braas Monier Building Group (founded in 1941) was acquired by Standard Industries. Around this time, Braas Monier Building Group employed 8000 people and owned 121 production facilities (Icopal, 2017). Within the Benelux, the brand name ‘Monier’ is used. Two plants of Monier B.V. are included in this report: Pannenfabriek Woerden and Pannenfabriek Tegelen. Both plants are manufacturers of roof tiles. The number of employees of Monier B.V. in the Benelux is approximately 180, including two concrete roof tile manufacturing locations and
the head office (Monier B.V., 2020). The annual report of BMI Group shows that in 2016 the net revenues in the Netherlands were 46.9 million Euros (BMI Group, 2017).
Pannenfabriek Woerden has 18 kilns fired by natural gas and 24 drying chambers. The plant runs 24 hours per day continuously except for a few weeks during summer for maintenance work. It has an annual production capacity of 12 million roof tiles (Vos, 2018). The history of the plant goes back to 1793, when family Van der Kas acquired a roof tile bakery named ‘Damlust’. Through the years it has changed ownership many times (and was rebuilt after being destroyed by fire in 1954) until it became part of Braas Monier Building Group in 2008 (Stichting Historie Grofkeramiek, 2020).
The plant in Tegelen has a similar production process (extruding roof tiles) and capacity as Woerden. The plant started manufacturing roof tiles in 1835 (Bouwtotaal, 2019).
1.2.2 Caprice Holding B.V.
Originally named HUWA, the company was renamed to Caprice Holding B.V. when the joint venture HUWA-Vandersanden unbundled in 2010, as a result of predictions that less houses would be built due to the financial crisis (Cobouw, 2010). Before unbundling,
HUWA-Vandersanden owned three plants: Steenfabriek Huissenswaard, Spijk and Hedikhuizen. After unbundling, HUWA-Vandersanden kept Steenfabriek Spijk and Hedikhuizen. Caprice Holding B.V. became the owner of Steenfabriek Huissenswaard (Caprice Holding B.V., 2020). Steenfabriek Huissenswaard is located in Angeren. The first activity of brick manufacturing dates to 1825, when F.C. Cock built the first ceramic plant. Steenfabriek Huissenswaard was the second plant built in Angeren and was founded by Derk Terwindt in 1837. Until 1978, the plant was owned by the Terwindt family. Over the years the plant underwent many
transformations to increase its production, e.g. replacing its field kiln to a reverberatory kiln in 1928. In 1968 the plant started manufacturing facing bricks in addition to paving bricks. By 2004, another renovation led to the modernization of the shaping and drying process (10 drying chambers with each a capacity of 54 thousand bricks). Moreover, a new tunnel kiln was built, 145 meters long and with 14 rows with each row containing 25 gas burners (Wingas, 2020). The shaping of bricks is applied by a ‘De Boer vormbandpers’ that can be set to mould or press bricks in the defined dimensions (Caprice Holding B.V., 2020).
Currently, Steenfabriek Huissenswaard has an annual production capacity of 75 million bricks (Caprice Holding B.V., 2020).
1.2.3 Engels Baksteen
In 1913, Leopold H.H. Engels received a permit to produce bricks in a plant named ‘De Huishoek’ located in Panningen. This was the start of the company Engels Baksteen that has remained within the family Engels to this day. The plant in Panningen was for more than 90 years the only production location of Engels Baksteen, until 2004 when the company acquired a plant located in Oeffelt. Since then, the plant in Panningen was named
Steenfabriek Helden and the plant in Oeffelt was named Steenfabriek Oeffelt. Both plants are manufacturers of bricks: facing bricks in Steenfabriek Engels Helden B.V. and facing bricks & paving bricks in Steenfabriek Engels Oeffelt B.V. (baksteen.nl, 2017). The total number of employees is 40 and the two plants together have an annual production capacity of 130 million bricks WF (Engels Baksteen, 2020).
Steenfabriek Helden has been owned by Engels Baksteen since the beginning (1913). Through the years the plant has undergone many modifications, e.g. adding electricity (instead of steam) and mechanical pressing, but the most important change was the tunnel kiln which was installed in 1965. This tunnel kiln was replaced by a more modern and larger tunnel kiln in 1985, which is still operational. In 1997 a second tunnel kiln was built to double the production capacity (baksteen.nl, 2017, pp. 8, 9). Currently, the production capacity is 70 million bricks WF per year (Engels Baksteen, 2020).
The first sign of brick manufacturing at the current production site of Steenfabriek Oeffelt dates to 1844. At that time, Steenbakkerij Willem Graat was located here (Stichting Historie Grofkeramiek, 2020). In 1889 the location was taken over and named Steenfabriek Het Kruispunt. It was renamed to Steenfabriek Hagens when the family Hagens became owner of the plant. The plant stayed within the family until 2004, when it was acquired by Engels Baksteen. Currently, the plant produces bricks using moulding and pressing techniques (baksteen.nl, 2017, p. 9). The annual production capacity is 60 million bricks WF (Engels Baksteen, 2020).
1.2.4 Euro-Steenhandel B.V.
Euro-Steenhandel B.V. is a family business founded by Hubert Linssen in 1907 (Stichting Historie Grofkeramiek, 2020). The company has owned one plant since the beginning: Steenfabriek Linssen, located in Kerkrade. Currently, this plant has a production capacity of approx. 15 million bricks WF per year and the total number of employees is 20 (Euro-Steenhandel B.V., 2020). The company is specialized in mechanical moulding. It has placed solar panels on the plant’s roof in 2015 (Euro-Steenhandel B.V., 2020).
1.2.5 Steenfabriek Klinkers B.V.
Steenfabriek Klinkers B.V. is a family business that has existed since 1938. Their ceramic plant makes use of local clay and produces facing bricks. The plant is located in Maastricht and the production capacity was increased from 20 million bricks to 23 million bricks in 2018 (L1mburg, 2017). The plant’s manufacturing process uses both manual and mechanical moulding, and has an intermittent kiln with a firing period of nearly two weeks per load of bricks (Steenfabriek Klinkers B.V., 2020).
1.2.6 Gouda Refractories B.V.
In 1901, the brothers Gerhard and Arie Jacob Nagtegaal started a plant for the production of refractory bricks, located in Gouda. At that time the name of their company was Firma Gebrs. Nagtegaal which lasted until 1959, when the company started a partnership with the company De Porceleyne Fles. The new name of this partnership was NV Gouda Vuurvast. In 2008, Gouda Vuurvast became part of the RijnDijk Group (Andus Group since 2009) and the name changed to Gouda Refractories B.V. (Gouda Refractories B.V., 2020).
Currently the total production is 95,000 tonnes per year, consisting of 65,000 tonnes stone, 5,000 tonnes prefab and 30,000 tonnes concrete. These production numbers are based on 50 different types of bricks and 400 different types of concrete. The company employs 150 people and has an annual net revenue of 50 million Euros (Gouda Refractories B.V., 2017; Gouda Refractories B.V., 2020). The firing of the refractory bricks takes place in three tunnel kilns, a continuous process with a duration of a few days per batch of products (Van Ede, 2015). In 2018, new land was acquired (in total 15,000 m2) next to the plant. This enabled the realisation of new projects like a modern lab and a new office (Gouda Refractories B.V., 2018).
1.2.7 Koninklijke Mosa B.V.
Since 1883, ceramic products have been manufactured at Koninklijke Mosa B.V. (Mosa) in Maastricht. Initially only wall tiles (and other products like imitated porcelain) were
produced, but at the end of 1957 the company built a new plant for the production of floor tiles. Currently, the company owns two plants in Maastricht: Locatie Vloertegel (floor tiles) and Locatie Wandtegel (wall tiles), that produce more than 3,000 different types of tiles. The tiles production consists of an equal amount of floor and wall tiles. In addition to its two plants, Mosa owns several selling points in foreign countries and two warehouses, located in Beek and Brunssum. These warehouses have installed PV solar panels on the roof tops to help meet Mosa’s target to use 100% green electricity (Koninklijke Mosa B.V., 2017, pp. 30, 58). Mosa has installed fast firing roller kilns 2014, in which the tiles are placed horizontally. These kilns replaced the old tunnel kilns where tiles were placed vertically in batches
(Koninklijke Mosa B.V., 2017, p. 57).
The total number of employees is 600, of which 500 are employed in the Netherlands and 100 work in foreign selling offices (Bouwkroniek, 2018). The net revenues were just over 100 million Euros in 2016 (Koninklijke Mosa B.V., 2017, p. 40).
1.2.8 Steenfabriek de Rijswaard B.V.
Originally named the Stoom Pannen- en Steenfabriek de Rijswaard, the plant Steenfabriek Rijswaard was founded by F. Ridder de Huyssen van Kattendijke in Aalst in 1900. Fifteen years later, it became a limited liability company (N.V), and in 1952 the family Blei became owner of the plant which it still is today (Stichting Historie Grofkeramiek, 2020; Van Weezel, 2011). The production capacity is 130 million bricks, and the plant employs 45 people, including the plant, technical facilities and office (Steenfabriek de Rijswaard B.V., 2020). Since 2008, the plant produces its facing bricks through a new 225 meters long tunnel kiln after drying them in one of the 12 drying chambers (Brabants Dagblad, 2008). Furthermore, in 2019 the plant has covered its stockyard by a roof with solar panels (Steenfabriek de Rijswaard B.V., 2020).
1.2.9 Rodruza B.V.
The company Rodruza B.V. was founded in 1986 and currently has approx. 100 employees (Graydongo, 2020). Two of its plants are included in this report, both producing facing bricks: Steenfabriek Rossum, built in 1837 and Steenfabriek de Zandberg (located in Gendt Gld.), built in 1874. Formerly, both plants were owned by the family Terwindt that also owned the plant Steenfabriek Huissenswaard (Stichting Historie Grofkeramiek, 2020; Stichting Historie Grofkeramiek, 2020).
1.2.10 Steenindustrie Strating B.V.
Since 1855, bricks are manufactured at the plant currently known as Steenfabriek Strating. This plant is located in Oude Pekela (RTV Noord, 2018). The plant was founded by Hilbrandie and Holtman, who chose this location due to the wide availability of peat as firing fuel in the surrounding area. In 1883, the plant was acquired by Geert Strating and it has remained a family company until today. The main product of Steenfabriek Strating are facing bricks, shaped by an extruding technique and fired in a tunnel kiln which has been installed at the end of the twentieth century (Steenindustrie Strating B.V., 2020). After the financial crisis was over, the plant was able to increase its production numbers. In 2018, it produced 450 thousand bricks per week (approx. 20 million per annum) and planned to scale up to 600 thousand bricks per week (approx. 30 million per annum). The number of employees in 2018 was 26, and the total revenues nearly 5 million Euros (RTV Noord, 2018).
1.2.11 Vandersanden Nederland B.V.
The history of brick manufacturer Vandersanden goes back to 1925, when Jaak
Vandersanden built a small brick plant located in Spouwen, Belgium. The company was expanded with another brick plant in 1962, which included more modern techniques such as the firing taking place in a tunnel kiln. In the following decennia, several plants were built and taken over, all located in Belgium until the beginning of 2005, when Vandersanden expanded its business to the Netherlands by starting a joint-venture with HUWA. The plants included in this joint-venture were Steenfabriek Hedikhuizen (hand-moulded facing bricks), Steenfabriek Spijk and Steenfabriek Huissenswaard (located in Angeren). Steenfabriek Hedikhuizen was rebuilt from 2006 to 2007 with modern facilities and a new production capacity of 75 million bricks per year (Vandersanden Nederland B.V., 2020; Caprice Holding B.V., 2020).
Two year later, in 2009, the joint-venture came to an end when Vandersanden acquired all shares of Steenfabriek Hedikhuizen and Steenfabriek Spijk, and HUWA received full
ownership over Steenfabriek Huissenswaard. Moreover, this acquisition also included the brand name ‘HUWA baksteen’ of the bricks, therefore the company HUWA renamed its company to Caprice Holding B.V., with its plant Steenfabriek Huissenswaard producing ‘Caprice baksteen’ bricks starting on the first of January 2010 (Caprice Holding B.V., 2020). At the end of 2016, Vandersanden took over CRH Clay Division Netherlands, Germany and Belgium, all entities of the Irish CRH Group. In the Netherlands, three brick plants were included in this acquisition: Firstly, currently the largest plant in the Netherlands, Kleiwarenfabriek Bylandt Tolkamer, manufacturer of paving bricks. Secondly,
Kleiwarenfabriek Bylandt Kessel also known Steenfabriek Joosten, manufacturer of facing and paving bricks and thirdly Steenfabriek Façade Beek, manufacturer of facing bricks. This acquisition made Vandersanden Nederland B.V. the Dutch market leader in paving bricks. In addition, it could now produce facing bricks by an extrusion shaping technique, named: ‘strengpers stenen’. The number of employees in the Netherlands became 275 (of 600 in total). The total annual revenues are around 160 million Euros in total, of which
approximately 70 million Euros in the Netherlands (Vandersanden Nederland B.V., 2016). Steenfabriek Hedikhuizen has installed 9700 solar panels on its roof by 2018, which has a peak power of 2.6 MW. Steenfabriek Spijk installed nearly 6000 solar panels on its roof (Brabants Dagblad, 2018). The total amount of 15 thousand solar panels required an invest-ment of 3.6 million Euros which was possible with the help of SDE+ subsidies from the Dutch government (Solar Magazine, 2019). Steenfabriek Hedikhuizen annual consumes around 6.6 million m3 natural gas and approximately 5.5 million kWh (19.8 TJ) electricity. Around 35% of the electricity is supplied by its 9700 solar panels (Gemeente Heusden, 2019).
1.2.12 Wienerberger B.V.
Wienerberger B.V. is a world leader in ceramic manufacturing by producing bricks, roof tiles, pipes and other building materials. The company was founded in 1819 by Alois Miesbach. Originally, the company was only active in Austria. In 1860 the first chamber kilns were installed (replacing field kilns). This enabled a continuous operation and resulting from this, and other innovations, Wienerberger became the market leader in Austria. The company kept its businesses inside Austria’s borders until the end of the twentieth century, when the company expanded into Europe, including the Netherlands (Wienerberger B.V., 2020). The expansion of Wienerberger B.V. within the Netherlands resulted in 19 production locations. Facing and/or paving bricks are produced by 13 plants, three plants produce roof tiles and one plant produces inner wall bricks (Poriso). The total number of employees in the Netherlands is 859 by December 31, 2019, and the annual net revenues are around 200
million Euros (Wienerberger B.V., 2019; Cobouw, 2018). This report includes 18 production locations of Wienerberger B.V. (the plant Wienerberger Panningen is not included).
In 2018, Wienerberger B.V. acquired the company Daas Baksteen that was the owner of three plants, two located in Azewijn and one located in Winterswijk. Note that the two plants located in Azewijn, Steenfabriek de Nijverheid and Steenfabriek de Volharding, are registered at the same address and are registered in the EU ETS by the name: Steenfabriek de
Nijverheid (Gelderlander, 2018). Therefore, only 17 plants of Wienerberger B.V. are listed in this report. The plant located in Bemmel is the only plant of Wienerberger that fires its bricks by the traditional use of coal in 24 connecting firing chambers (Wienerberger B.V., 2020). However, in 2012 a newsletter of Stichting Historie Grofkeramiek states that the bricks are fired with natural gas and occasionally coal is added (Stichting Historie Grofkeramiek, 2012). With regards to energy efficiency, Wienerberger states that several locations already have decreased their use of electricity or natural gas. For instance, the plant in Bemmel did a heat scan through the plant to see where heat is ‘leaking’. Kijfwaard West applies smart drying (monitoring moisture levels and temperature) and has replaced its ventilation fans by more efficient blades (Wienerberger B.V., 2019, pp. 19, 20).
1.3 Estimated production volumes and EU ETS CO
2emissions per location
An estimation of the production volumes in 2016 of the production locations is provided in Table 2. The estimated production capacity and the registered EU ETS emissions in 2016 is also provided. The production volumes were derived from the EU ETS emissions (see for more information regarding the calculation method Appendix A).
The total CO2 emissions for the ceramic industry that are derived from the EU ETS emissions were quite similar for the past few years, fluctuating closely around 500 thousand tonnes per year. Comparing these emissions with the total annual emissions of Dutch companies
registered at the EU ETS shows that the ceramic industry is responsible for less than 0.6% (see Table 1). Mostly bricks are produced (85% of total production), of which facing bricks (placed in the outer wall of a building) cover more than half of the ceramic production in the Netherlands.
Table 1. Total annual CO2 emission numbers for the ceramic industry in the
Netherlands and percentage of total emissions in the Netherlands (EU ETS, 2020)
Year 2015 2016 2017 2018 2019
tCO2eq emissions 477,308 489,757 497,589 519,006 500,134
% of Dutch ETS emissions 0.51 0.52 0.54 0.59 0.60 Table 2 provides an overview of the calculated production for 2016, production capacity, and EU ETS registered greenhouse gas (GHG) emissions (CO2eq) for 2016. Both the calculated production and production capacity are rounded to the nearest 5 kt. The total yearly production capacity of the companies in the table is estimated to be approximately 3.4 million tonnes.
The calculated production values are based on limited available public data (see Appendix A) and are given as ranges. Both the production capacity and production values have not been confirmed by the Dutch ceramic industry and should be treated as indicative values.
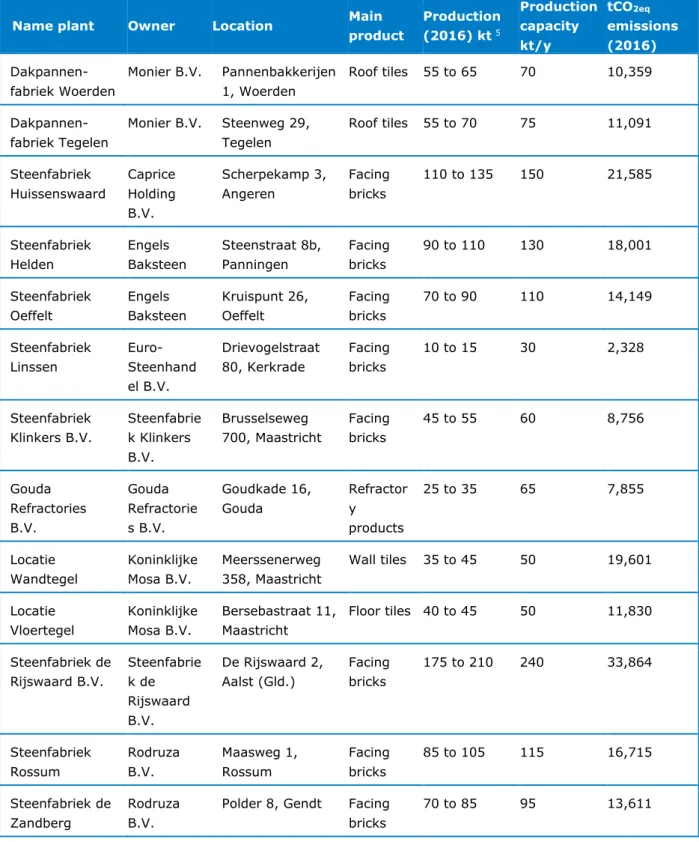
Table 2 Overview of all production plants covered in this report, including their company, location, main product, calculated production, calculated production capacity and EU ETS registered CO2eq emission (Dutch emissions authority, 2020).
Name plant Owner Location Main product Production (2016) kt 5 Production capacity kt/y tCO2eq emissions (2016) Dakpannen-fabriek Woerden Monier B.V. Pannenbakkerijen 1, Woerden Roof tiles 55 to 65 70 10,359 Dakpannen-fabriek Tegelen Monier B.V. Steenweg 29, Tegelen Roof tiles 55 to 70 75 11,091 Steenfabriek Huissenswaard Caprice Holding B.V. Scherpekamp 3, Angeren Facing bricks 110 to 135 150 21,585 Steenfabriek Helden Engels Baksteen Steenstraat 8b, Panningen Facing bricks 90 to 110 130 18,001 Steenfabriek Oeffelt Engels Baksteen Kruispunt 26, Oeffelt Facing bricks 70 to 90 110 14,149 Steenfabriek Linssen Euro-Steenhand el B.V. Drievogelstraat 80, Kerkrade Facing bricks 10 to 15 30 2,328 Steenfabriek Klinkers B.V. Steenfabrie k Klinkers B.V. Brusselseweg 700, Maastricht Facing bricks 45 to 55 60 8,756 Gouda Refractories B.V. Gouda Refractorie s B.V. Goudkade 16, Gouda Refractor y products 25 to 35 65 7,855 Locatie Wandtegel Koninklijke Mosa B.V. Meerssenerweg 358, Maastricht Wall tiles 35 to 45 50 19,601 Locatie Vloertegel Koninklijke Mosa B.V. Bersebastraat 11, Maastricht Floor tiles 40 to 45 50 11,830 Steenfabriek de Rijswaard B.V. Steenfabrie k de Rijswaard B.V. De Rijswaard 2, Aalst (Gld.) Facing bricks 175 to 210 240 33,864 Steenfabriek Rossum Rodruza B.V. Maasweg 1, Rossum Facing bricks 85 to 105 115 16,715 Steenfabriek de Zandberg Rodruza B.V.
Polder 8, Gendt Facing bricks
70 to 85 95 13,611
Name plant Owner Location Main product Production (2016) kt 5 Production capacity kt/y tCO2eq emissions (2016) Steenfabriek Strating Steenindus trie Strating B.V. Gelmswijk 4, Oude Pekela Facing bricks 20 to 25 35 4,321 Kleiwaren-fabriek Bylandt Tolkamer Vandersan den Nederland B.V. Bijland 5, Tolkamer Paving bricks 175 to 210 235 34,056 Steenfabriek Spijk Vandersan den Nederland B.V. Spitsedijk 24, Spijk Paving bricks 145 to 175 195 28,453 Steenfabriek Hedikhuizen Vandersan den Nederland B.V. Bokhovenseweg 8, Hedikhuizen Facing bricks 75 to 95 140 14,980 Kleiwarenfabriek Bylandt Kessel Vandersan den Nederland B.V. Kanaalweg 1, Kessel Paving bricks 35 to 45 50 7,001 Kleiwarenfabriek Façade Beek Vandersan den Nederland B.V. Stationsstraat 106, Beek Facing bricks 45 to 55 60 8,477 Steenfabriek Poriso Wienerberg er B.V. Kranenpool 4, Brunssum Inner wall bricks 75 to 95 105 14,985 Steenfabriek Kijfwaard West Wienerberg er B.V. Kijfwaard 10, Pannerden Paving bricks 125 to 150 165 24,290 Steenfabriek de Nijverheid Wienerberg er B.V. Terborgseweg 30, Azewijn Facing bricks 105 to 130 145 20,723 Steenfabriek Haaften Wienerberg er B.V.
Crob 3, Haaften Facing bricks 60 to 70 80 11,477 Steenfabriek Zennewijnen Wienerberg er B.V. Waalbandijk 18, Zennewijnen Paving bricks 85 to 105 115 16,547 Steenfabriek Erlecom Wienerberg er B.V. Erlecomsedam 110, Erlecom Facing bricks 75 to 90 100 14,797 Steenfabriek Wolfswaard Wienerberg er B.V. Wolfswaard 2, Opheusden Facing bricks 75 to 95 100 14,834 Steenfabriek Thorn Wienerberg er B.V.
Meers 38, Thorn Facing bricks
Name plant Owner Location Main product Production (2016) kt 5 Production capacity kt/y tCO2eq emissions (2016) Steenfabriek Kijfwaard Oost Wienerberg er B.V. Kijfwaard 10, Pannerden Paving bricks 60 to 75 85 11,990 Dakpanfabriek Janssen-Dings Wienerberg er B.V. Kaldenkerkerweg 11, Tegelen Roof tiles 60 to 70 80 11,478 Dakpanfabriek Narvik Deest Wienerberg er B.V. Munnikhofse- straat 4, Deest Roof tiles 40 to 50 55 7,996 Steenfabriek de Vlijt Wienerberg er B.V. Misterweg 174, Winterswijk Facing bricks 45 to 55 60 8,886 Steenfabriek Heteren Wienerberg er B.V. Steenoord 16, Heteren Paving bricks 40 to 50 55 8,174 Steenfabriek Schipperswaard Wienerberg er B.V. Prins Willemsweg 1, Echteld Paving bricks 25 to 30 35 5,148 Dakpanfabriek Narvik Tegelen Wienerberg er B.V. Trappistenweg 7, Tegelen Roof tiles 45 to 55 60 8,499 Steenfabriek Nuance Wienerberg er B.V. Heukelom 4, Afferden (L.) Facing bricks 30 to 40 45 6,317 Steenfabriek Bemmel Wienerberg er B.V. Buitenpolder 10, Haalderen Facing bricks 30 to 35 35 5,438 Steenfabriek Douveren (recently closed) Douveren Wolfsweg 75, Eygelshoven Facing bricks <5 Unknown 73
2 Ceramic production
processes
The production of ceramics is divided into four categories, based on the defined categories by the BREF for the ceramic industry (EC, 2007) that are relevant to ceramic manufacturing in the Netherlands:
• Bricks and roof tiles, • Floor tiles;
• Wall tiles;
• Refractory products.
This section provides an overview of the ceramic manufacturing processes. First, section 2.1 elaborates on the general processes from raw material to the end product used for ceramic production, and which of these processes are included in the research of this MIDDEN report. Section 2.1 also discusses the emissions that occur during ceramic production.
Sections 2.2, 2.3 and 2.4 explain the production processes for bricks and roof tiles, wall and floor tiles and refractory products, respectively. At the end of each these sections a figure is provided with the material, energy and CO2 emissions flows.
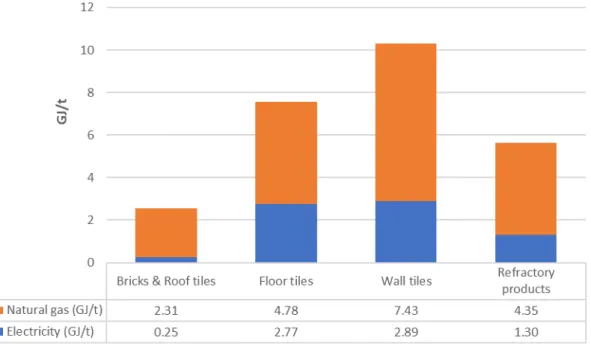
Figure 4 provides an overview of the energy input that is required for the ceramic production process of each product category. Note that these values are in part derived from European data (EC, 2007). The energy consumption of Dutch ceramic plants may therefore deviate from Figure 4 whose values should be treated as indicative values.
Figure 4. Energy input per fuel per tonne product of each category, based on the analysis in the chapter and Appendix A.
2.1 General description of production processes and
emissions
2.1.1 Production processes
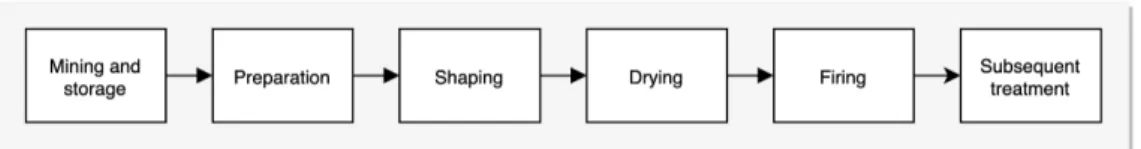
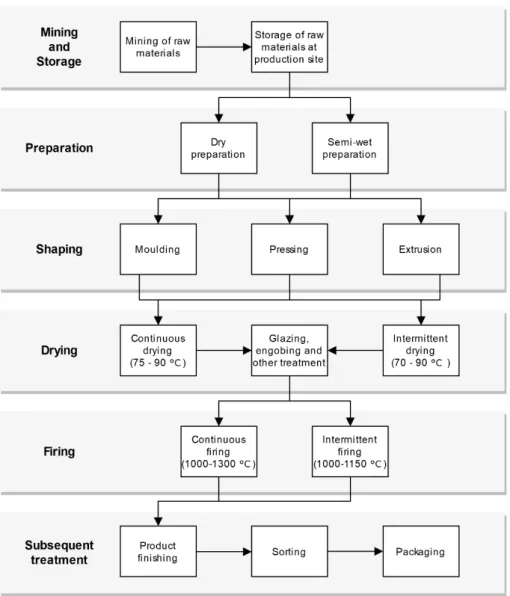
The manufacturing process of ceramic products is subdivided in six general process steps (see Figure 5): mining and storage, preparation, shaping, drying, firing and subsequent treatment. Only processes taking place within the plants are covered in this MIDDEN report. The first block, ‘mining and storage’, will therefore be shortly described in this section but is not included in this research in terms of energy consumption.
Figure 5. General overview production processes ceramic plants.
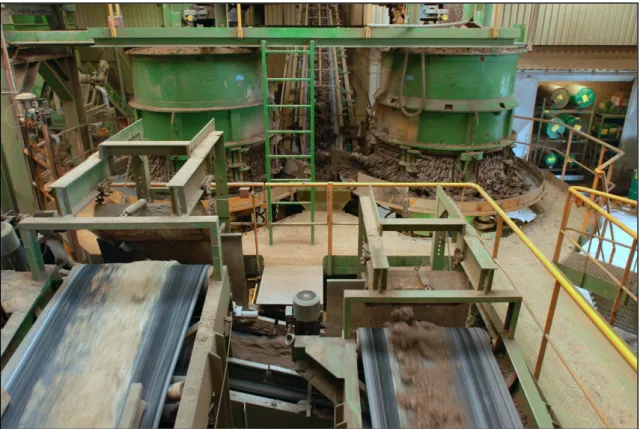
Before the manufacturing process, raw material needs to be mined or quarried. In the Netherlands, clay material is often extracted from embanked floodplains. These clay minerals, named ‘plastic clays’, consist of single or more clay types that are hydrated aluminium silicates resulting from the weathering of rocks. The aluminium silicates are often formed by condensing two structural units: silica sheets and aluminium hydroxide (or gibbsite sheet). The exact properties and related characteristics like plasticity and water content of these raw materials differ per location from where it is extracted. Furthermore, mineral modifiers, named non-plastics, are used as raw material. These can already be in the extracted clay (e.g. red clay due to iron oxide content) or added later in the preparation process (EC, 2007, pp. 13, 14). Figure 6 shows a storage yard where extracted clay can be stored.
The first manufacturing process within the plant is preparation of the clay raw material. This includes increasing the water content for higher plasticity and addition of supplementary materials. Furthermore, different types of clay raw material may be mixed. The exact preparation differs per product and will be explained more in detail in sections 2.2, 2.3 and 2.4.
Pre-dried material (also named ‘green ware’ (EC, 2007, p. 229)) is shaped into the desired dimensions of the end product, taking into account that the material will shrink during drying and firing. Shaping is performed mechanically by all plants in the Netherlands with different techniques. Examples of such techniques are mechanical moulding, hydraulic pressing and extruding.
The shaped green ware is dried at temperatures ranging from 70 to 90 degrees Celsius. Part of the required heat is provided from hot air extracted from the firing process. The most important aspect of the drying process is to remove water (decreasing the content to less than 1%) from the green ware. If this is not done accordingly, the shaped green ware risks to crack during the firing process. Evaporated water from the drying process is condensed and used to increase the moister content of the raw materials. In addition, water for cleaning machines is filtered to be re-used. As a result, the plants have a nearly closed water system.
Firing of the shaped green ware takes place in intermittent or continuous kilns. Before firing, the shaped green ware is placed or stacked in specific patterns to create a batch of products that can simultaneously be fired. The temperature reached at maximum firing is more than 1000 °C. The required temperature depends on the sintering stages, breakdown of the lattice structures of the clay raw material, followed by recrystallisation and glassy phases
(vitrification) (EC, 2007). The main fuel used for reaching this firing temperature is natural gas, which is mixed with air before entering the burner system. The added air might be preheated to save energy (TCKI, 2020). After the maximum temperature has been reached, the fired product is cooled down by clean air, which becomes hot air and is ventilated to the drying process.
The last general process step, ‘subsequent treatment’, ends at the stockyard (‘tasveld’ in Dutch) or warehouse of the plant, where packaged end products are stored. Any material of product losses from the first to last process step are recycled by most plants. The specific processes for the different ceramic products are explained in more detail in sections 2.2, 2.3 and 2.4.
Figure 6. Storage yard (in Dutch ‘kleidepot’) where extracted clay is stored, often closely located to the ceramic plant (KNB, 2020).
2.1.2 Emissions
CO2 is emitted during ceramic production from burning fuels like natural gas (fuel emissions), or from chemical reactions of carbonates (process emissions, see Figure 7). These chemical reactions are also referred to as calcination.
Figure 7. Chemical reactions resulting in process emissions (EC, 2007, p. 58). The amount of process emissions depends on the raw materials used and can therefore differ significantly between plants, despite producing the same type of products.
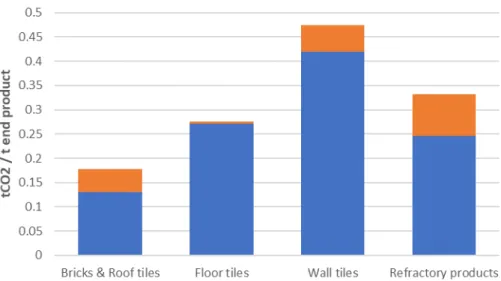
The three main processes that emit fuel related CO2 are: spray drying (only wall and floor tiles), drying6 and firing. These three processes are assumed to all use natural gas as energy source. Figure 8 states the calculated average CO2 emissions per tonne end product. At the end of each of the sections below, energy and material flow diagrams are given that include the CO2 emissions numbers for each category in more detail. Note that the emission
numbers rely on general European process data (EC, 2007) as a source. The specific CO2 emissions of Dutch ceramic plans may therefore deviate from Figure 8.
Figure 8. CO2 emissions per tonne of end product per product type. Blue part of the
bar are emissions from burning fuels and orange part are the process emissions. This graph is based on the analysis in this chapter and Appendix A.
In addition to CO2 emissions, fluorine, chlorine, sulphur and nitrogen oxides (NOx, including both NO and NO2) emissions are present during the manufacturing processes. Currently, these emissions are reduced via flue gas treatment installations. Together with other adjustments, this has reduced the fluorine emissions by 80% between 1993 and 2000. Therefore, these emissions are currently in compliance with the Dutch emission guidelines (KNB, 2020).
2.2 Brick and roof tile production process
The manufacturing processes of the bricks and roof tiles is represented by 33 plants in this report, 28 brick (facing, paving and inner wall bricks) manufacturers and 5 roof tile
manufacturers (Figure 9). Some plants produce more than one type of brick, e.g. both facing and paving bricks. For these cases, their main product is taken as reference for their type of production (for more information per plant see Table 2).
Figure 9. Number of plants producing bricks or roof tiles. The total production capacity of these plants together approximates 3,200 thousand tonnes (see Table 2).
This section describes the general processes for bricks and roof tiles production. The exact processes used by the Dutch ceramic plants may deviate from these general processes.
2.2.1 Production processes
Because the manufacturing processes of both bricks and roof tiles are relatively similar, they are explained here using the same process flow diagram (Figure 10). During the shaping phase, one of three techniques can be applied which determines the characteristics of the end product. Extra treatment is optional in the form of glazing or engobing (a fine-grained layer of ceramic mass). Drying and firing takes place in an intermittent or continuous way.
Figure 10. Production processes bricks and roof tile manufacturers.
Preparation
The preparation process is defined as dry or semi-wet, depending on the water content of the material. For the semi-wet preparation process extra water (or sometimes steam) is added. Both dry and semi-wet preparation can be split into three similar parts:
1. Reducing particle size; 2. Adding additives and;
3. Homogenisation of the mass.
For the dry preparation process, with the material having a low plasticity, hammer or roller mills are used to reduce the particle size. During milling, additives are added to maintain a good plasticity (e.g. hydrated lime). In the semi-wet preparation process, with a water content of around 20%, the hard materials are crushed to get a specific particle size (roof tiles need a lower particle size than bricks). The type of crusher depends on the
characteristics of the raw material. Sand can be added to this process to improve the
moulding, enhance the colour and generate a specific surface texture. In addition, lava, chalk and oxides are added for specific colours (Caprice Holding B.V., 2020).
Both dry and semi-wet preparation need mixing in the end for homogenisation. This is achieved by shredders, mixers or kneaders. The final water content is on average 20% (EC, 2007, pp. 39, 40).
Figure 11. Preparation process of a ceramic plant (KNB, 2020).
Shaping
Three different shaping methods are used by the bricks and roof tile manufacturers in the Netherlands: moulding, pressing and extruding. Each of these methods determines important properties of the end product (e.g. surface irregularities). In brick manufacturing in the Netherlands, different names are given for bricks depending on the used shaping method: ‘handvorm’ bricks for moulding, ‘vormbak’ bricks for pressing and ‘strengpers’ bricks for extruding. In addition, the size of the end product is determined by the shaping process. Due to the differences in sizes, the production of bricks is often expressed in Waal format (WF), which is a standardised size brick with a weight of around 1.84 kg (KNB, 2017).
Moulding (or hand-moulding) is the original method of shaping, dating back more than 10,000 years. Individual clots of clay are, in current days mechanically, thrown in pre-sanded moulds. The moulds are pre-sanded to ensure the moulded piece of clay comes out easily. This method requires relatively little power compared to pressing and extruding, though the clay needs to contain more water than for the other two shaping methods. Because of this, more energy is needed for the drying process to lower the water content (EC, 2007, p. 20). The water content after moulding is 30-35%, according to DOWN TO EARTH BV (DOWN TO EARTH BV, 2013). Some companies use a shaping method named Wasserstrich, which is moulding without adding sand but by wetting the mould with water beforehand (Vandersanden Nederland B.V., 2020; Rodruza B.V., 2020).
Closely related to moulding is the second shaping technique: pressing. The pre-sanded moulds, also named die boxes, are filled with clay and pressed by pistons, usually driven mechanically (EC, 2007, p. 19). A machine used for this technique in The Netherlands is ‘De Boer vormbandpers’ with 17 moulds that can be used at the same time. This machine can also shape green ware by means of the hand-moulding explained above (Caprice Holding B.V., 2020).
Extrusion, the third technique, is different from the two above techniques because the raw material is extruded through a die instead of shaping it by a mould or die box. Before clay is forced through the die by an extrusion auger, any remaining air in the chamber between the raw material and auger is vacuumed (EC, 2007, p. 20). After extrusion, the formed column is cut into pieces by thin metal wires (Steenindustrie Strating B.V., 2020). The raw material used for extruding bricks is different, because fatter and drier clay is required, resulting in denser bricks with smooth edges. This is also showed by the water content which is only 17-22% after shaping (DOWN TO EARTH BV, 2013). Nevertheless, the temperature in the firing process should be at minimum 60 °C higher than for moulded and pressed bricks
(Vandersanden Nederland B.V., n.d.). The extrusion technique can also be used for roof tile production (Bouwtotaal, 2019).
Drying
The drying process can be subdivided in intermittent and continuous drying. According to the BREF, intermittent drying is mainly performed in drying chambers, where drying one batch of green ware lasts up to 40 hours with temperatures from 70 to 90 °C. Continuous drying takes place in tunnel or fast dryers, which can last from less than 8 to close to 72 hours (depending on the length of the tunnel dryer and production rate) and demands
temperatures from 75 to 90 °C. The water content after drying should be less than three percent (EC, 2007, p. 41). The hot (clean) air needed for drying comes mainly from the cooling section of the firing process, where bricks are cooled down (see Figure 12). Any additional required hot air is provided by natural gas burners or generated from a gas-fired combined heat and power (CHP) installation. Natural gas is for (almost) all plants the main heating source.
Plants that, according to literature, make use of a CHP are: Steenfabriek de Rijswaard, Steenfabriek Huissenswaard (Caprice Holding B.V., 2020; Steenfabriek de Rijswaard B.V., 2020) and Steenfabriek Spijk (Provincie Gelderland, 2015). Note that it has been confirmed by the Dutch ceramic industry that some plants use a CHP, but it has not been confirmed which plants specifically.
After drying, additional treatment can be applied based on specific client requirements (Bouwtotaal, 2019). Extra treatment can be glazing, engobing (a fine-grained layer of ceramic mass), and other decorating techniques, being applied by dipping or pouring on the surface of the green ware. This treatment is usually applied after the drying process - and sometimes even after the firing process (EC, 2007, p. 23).
Firing
Similar to drying, firing can be applied in an intermittent or continuous matter. Intermittent kilns offer flexibility compared to tunnel kilns and therefore are more suitable for e.g. special shaped bricks or roof tile fittings that are produced in lower numbers (EC, 2007, p. 25). The use of chambers also enables a batch of roof tiles to be closed off from oxygen (and add nitrogen) resulting in a blue coloured end product. This is named ‘smoren’ in Dutch (Bouwtotaal, 2019).
Most of the brick and roof tile plants in the Netherlands are assumed to make use of continuous tunnel kilns. As shown by Figure 12, each batch of bricks is pushed or pulled through three phases within a tunnel kiln. First the batch is heated by flue gases (the firing kiln exhaust), then fired by natural gas to reach a maximum temperature for sintering. Finally, the bricks are cooled down.
For efficiency, the process uses a counter-current flow of air to allow cool air to cool down the bricks. The heat air is then partly ventilated away to the drying process and partly moves
as hot air towards the firing section. The ratio in thermal energy requirement between drying and firing is roughly 50/50.
In general, plants have flue gas treatment installations in place to filter the flue gases to meet environmental standards for among others, NOx and fluoride emissions.
A tunnel kiln is usually over 150 meters long and a maximum temperature is reached of 1000 to 1300 °C (EC, 2007, pp. 41, 42; Van Weezel, 2011; Wingas, 2020).
Figure 12. Three phases of the firing process in a tunnel kiln: heating-up, firing and cooling down zone. Source: captured and translated from (Ecosys, 2014, p. 36).
Subsequent treatment
Examples of subsequent treatment are surface smoothing, creation of extra holes that were not possible during the shaping process, and sometimes a retro look is required by the customer. To achieve this, bricks are thrown together in a drum machine to remove sharp edges and decrease similarities.
After any product finishing techniques, the bricks or roof tiles are sorted and packaged (see Figure 13) to be stored at the stockyard, which can be covered by a roof to prevent moisture and algae damaging the finished products.
Figure 13. Packaging machine of bricks (KNB, 2020).
2.2.2 Material, energy and CO2 emissions flows
Figure 14 provides the material, energy and CO2 emissions flow diagrams for brick
manufacturers and roof tile manufacturers. The calculations and used sources are provided in Appendix A. The use of CHP is not included in the calculations and flow diagrams because this technology is not commonly used. Note that the calculations use European data (EC, 2007). As the energy consumption of the Dutch ceramic mills may deviate, the given values should be treated as indicative values.
Figure 14. Flow diagram of the manufacturing process of bricks and roof tiles, including material, energy and CO2 emissions flows. Applicable to plants without
2.3 Wall and floor tiles production processes
Different processes are used for wall and floor tiles due to the differences in requirements (e.g. frost resistance for outdoor tiles) which requires specific raw materials and extra process steps. This results in two main types of ceramic tiles which both use raw materials like clay, sand, marl, felspar, broken ware and recycled tiles. The first type are pottery tiles (‘aardewerk tegels’ in Dutch) that are mainly used for wall tiles. The second type, ‘porcelain tiles’, are tougher than pottery tiles and have a higher wear resistance. In addition, porcelain tiles are frost resistant, which pottery tiles are not. This makes porcelain tiles applicable to both walls and floors, including high traffic zones like shopping malls.
This section describes the general processes for wall and floor tiles production. The exact processes used by the Dutch ceramic plants may deviate from these general processes.
2.3.1 Production processes
Figure 15 shows the manufacturing processes for floor and wall tiles. The main difference between the two processes is that wall tiles require a double firing process and glazing. Floor tiles only require fast firing to receive full sintering.
Figure 15. Production processes wall and floor tiles
Preparation and shaping
The raw materials are milled and mixed to reach a homogenized substance. Floor tiles need a different bottom and top layer, so two substances are created for that product.
Drying
To decrease the water content the particle size of the substances are reduced even more by removing embedded water, for which spray drying is applied. This method, taking place before the shaping process, sprays hot air through the substance. As a result, granulation takes place: fine droplets are formed and form highly uniform granules that facilitate accurate filling of the pressing dies. The moisture content decreases from approx. 30% to 6% and the required temperature within the spray dryer is 350-450 °C, requiring an energy consumption of 1.1 – 2.2 GJ/t (EC, 2007, pp. 17, 61, 120).
The shaping of floor and wall tiles, which for floor tiles is in fact adding two layers of substance together, is done by isostatic pressing with a pressure of 400 tonnes per 30x30 cm.
After shaping the tiles, the second step of drying is applied to further decrease the water content. This process is done with a temperature of 90 °C. The drying duration per batch of tiles is three hours (Bouwkroniek, 2018) and the residual water content is less than 1 percent (EC, 2007, p. 62).
Firing and subsequent treatment
Firing takes place in a fast firing roller kiln (also named ‘modern roller hearth kiln’) with a temperature of up to 1230 °C to ensure the tiles become fully sintered. The tiles are horizontally placed on ceramic rollers instead of the old method where tiles are stacked vertically in tunnel kilns. As shown in Figure 15, wall tiles have an extra process step: biscuit firing7 and glazing. This is necessary for optimal colouring and shining properties. Whereas floor tiles are immediately fired at a temperature of 1230 °C, wall tiles are first biscuit fired at a temperature of 1100 °C. At the same time the glazing material is prepared, which is a glassy substance that consists of melted feldspars. After the wall tiles are biscuit fired, glazing is applied by moving the tiles through a curtain of glazing. When the glazing has dried, the tiles are another time fired at a temperature of 1100 °C (Bouwkroniek, 2018). After cooling down, the dimensions of the tiles are adjusted if required and some types of floor tiles could be ground or polished, recycling any material if possible. Finally, the tiles are packaged and stored at one of the warehouses (EC, 2007).
Figure 16. The outside of fast firing roller kilns (KNB, 2020).
2.3.2 Material, energy and CO
2 emissions flowsFigure 17 and Figure 18 show the material, energy and CO2 emissions flow diagram of floor and wall tiles, respectively. The calculation method of the values in the flow diagrams and used sources are provided in Appendix A. The amount of residual heat extracted from the firing section used for drying could not be determined. Note that the calculations use European data (EC, 2007). As the energy consumption of the Dutch ceramic mills may deviate, the given values should be treated as indicative values.
Figure 17. Flow diagram of the manufacturing process of floor tiles, including material, energy and CO2 emissions flows.
Figure 18. Flow diagram of the manufacturing process of wall tiles, including material, energy and CO2 emissions flows.
2.4 Refractory products production processes
This section describes the general processes for refractory products production. The exact processes used by the Dutch ceramic plants may deviate from these general processes.
2.4.1 Production processes
First the raw material is milled to predefined particle sizes, then additives are added together and mixed to obtain a homogenized material. In total, 7 to 10 different types of materials and ingredients are used as raw material input. The shaping process is applied by mechanical pressing in moulds and both the drying and firing takes place in tunnel kilns. Both the drying and firing process use natural gas. Drying requires a temperature of 100 °C and firing a temperature of 1700 °C. After the firing process, which takes 2 to 3 days, the refractory product is cooled down and given subsequent treatment based on the customers’ requirements (Van Ede, 2015).
2.4.2 Material, energy and CO2 emissions flows
Figure 19 shows the material, energy and CO2 emissions flow diagram of refractory products. The calculations and used sources are provided in Appendix A. Note that the calculations use European data (EC, 2007). As the energy consumption of the Dutch ceramic mills may deviate, the given values should be treated as indicative values.
Figure 19. Material, energy and CO2 emissions flow diagram of refractory products.
Material amounts are taken from the BREF example of production of periclase chromite bricks (EC, 2007, p. 112).
3 Ceramic products
and applications
This section describes the applications and markets of the Dutch ceramic industry covered by this MIDDEN report.
3.1 Main products and applications
3.1.1 Bricks
Brick products are produced in large quantities and are mostly used in the construction sector. The main subtypes for bricks are facing bricks, paving bricks and inner wall bricks. Facing bricks are commonly used for the external walls of domestic and commercial properties. They are used for surfaces that are exposed to weather conditions. The
appearance of such surfaces is important. Inner wall bricks on the other hand are used for the part of the building structure facing inwards. Paving bricks are used to be laid flat on the ground. They are designed specifically to last when installed to withstand all weather
conditions.
Figure 20. From left to right: facing bricks, paving bricks, and inner wall bricks. Facing and paving bricks source: (KNB, 2020), inner wall bricks source:
(Architectenweb, 2020).
3.1.2 Roof tiles
Roof tiles are designed to withstand harsh weather conditions and are designed specifically to keep out rain. Since the 16th century, hollow roof tiles (‘holle pannen’ in Dutch) are produced in the Netherlands, improved in around 1900 (named ‘verbeterde holle pannen’) followed by another improvement in 1935 which renamed the roof tiles into ‘Opnieuw Verbeterde Holle’ (OVH). These roof tiles have specific dimensions of 36 cm (Bouwtotaal, 2019). Other types of roof tiles are ‘flat’ roof tiles, such as the Tuile du Nord (BMI Monier, 2020), and the ‘tegelpan’, a roof tile that is cross laid (Wienerberger B.V., 2020).
Figure 21. Glazed roof tiles. Source: (KNB, 2020)
3.1.3 Wall and floor tiles
A ceramic tile is a thin and usually square or rectangular object made from clay and other inorganic materials, that is generally used as covering for floors or walls. The tile sides range from a few centimetres to 60 to 100 cm sides. Their thickness can vary from around 5 mm to 25 mm. Maintenance and renovation is an important aspect of ceramic tile usage (EC, 2007).
Figure 22. Floor and wall tiles. Source: (KNB, 2020)
3.1.4 Refractory products
Refractory bricks are used for inner linings of ovens, for example in the steel or glass industry. Due to the high temperatures in such ovens, these bricks must be able to
withstand extremely high temperatures. This is already indicated by the high temperatures to fire this product (around 1700 °C), explained in section 2.4. The main users of these refractory products are industrial installations using high temperature processes, such as petrochemical industry, non-ferro producers, and users of combustion installations (Buisman, 2016).
3.2 Markets
The Dutch ceramic industry serves both the domestic market as well as other countries that are located nearby. Serving countries further away will not be cost effective for bulk products (i.e. bricks and roof tiles) due to the relatively heavy weight of the products and low value, and competition in countries where clay is also highly available. Ceramic tiles and refractory products, however, are exported globally.
For bricks, exports averaged around 20% of the total annual production in 2014 (RVO, 2014). Especially the UK is an import trading country for the Dutch ceramic industry (RVO, 2014). In 2019, the total sales of the Dutch bricks for the building sector declined. This was the result of the uncertainties concerning Brexit, which affected export results. Another important factor was the debate regarding the nitrogen emission and PFAS8 deposition policy and its impact on the building sector.
For ceramic tiles, the main application is within buildings in the Netherlands, but also abroad. Export to other European countries, but also North America and countries in the Middle East, is expected to grow considerably.
Aside from the clients in the Netherlands, refractory products are shipped to countries such as the USA, South-Africa, Australia, and Saudi Arabia (Buisman, 2016).
8 Per- and polyfluoroalkyl substances, a collection of substances that, if present in high concentration in soil,
4 Options for
decarbonisation
The Dutch climate agreement (‘Klimaatakkoord’) introduced in 2019, has set as a target for the Dutch industrial sector to abate its CO2eq emissions by 19.4 Mt by 2030 compared to 2015 (Klimaatakkoord, 2019, p. 83). The long-term goal is to reduce the total CO2eq emissions in the Netherlands by at least 95% compared to 1990 emissions levels
(Klimaatakkoord, 2019). In addition to these targets, gas extraction from the Groningen gas reservoirs will be phased out as soon as possible, potentially already in 2022. These
developments are relevant for the ceramic production in the Netherlands, which is energy intensive with high temperatures and uses Groningen gas as its main fuel.
For the last decades, energy efficiency improvements have been made in the ceramic sector, accelerated by the MJA-agreements (Meerjarenafspraken), resulting in more efficient kiln designs and drying techniques. In addition, the drying and firing process has become a continuous process (creating a stable energy demand). However, further decarbonisation is required to achieve net zero (fuel) CO2 emissions. The KNB has constructed a ‘Technology Roadmap’ (KNB, 2020b). This roadmap will, among others, elaborate on the energy transition and carry out research for the ceramic industry.
Different options for decarbonisation are described in this section, categorised according to the overview in Figure 24. The relevant categories are fuel substitutions, process design, use of residual energy and CO2 capture and storage (or utilisation).
Figure 24. Different CO2 abatement categories identified by MIDDEN.
Table 3 provides an overview of the different decarbonisation options that are applicable to the ceramic industry in the Netherlands.
Table 3 Overview of abatement options, including the category, relevant process, maximum CO2 abatement and availability.
Name option Category Process(es) Maximum COabatement 2 Availability
Green gas Fuel
substitution
Drying/Firing 74% Commercially
available
Hydrogen Fuel
substitution
Drying/Firing 74% Lab scale
Electric heating Fuel substitution
Drying/Firing 74% Concept
Microwave radiation Fuel substitution
Drying/Firing 74% Concept
Heat exchange Use of residual energy
Drying 26% Pilot scale
Heat pump Use of residual
energy
Drying 26% Commercially
available (for the relevant temperature) Hybrid drying Use of residual
energy
Drying Varies Pilot scale
Ultra-deep geothermal
Process design Drying 26% Commercially
available, but not yet in The Netherlands Extended tunnel kiln Process design Firing 26% Commercially
available
CCS or utilisation CCS or re-use Firing 90% Commercially
available9
Lighter bricks Product design Firing Unknown Concept
4.1 Fuel substitutions
Alternative carbon neutral fuels such as green gas and hydrogen, and renewable electricity can substitute the natural gas that is used for firing and drying by the ceramic plants in the Netherlands. Stichting Technisch Centrum voor de Keramische Industrie (TCKI)10 and DNVGL already are testing the impact of hydrogen on a laboratory scale, to measure the impact on the product.
9 Transport and storage is not available at the locations of the ceramics plant.