National Energy
Outlook 2016
General picture
The National Energy Outlook (NEV - Nationale
Energieverkenning) 2016 outlines the state of the Dutch energy system in an international context.
The NEV describes developments in the Dutch energy system from 2000 to the present, as well as expectations until 2035. As evaluation year for the Energy Agreement, 2016 is an important year for the Dutch energy transition. The NEV provides the quantitative basis for this evaluation. Moreover, this year also sees the preparation of a policy agenda for the Netherlands, in which the lines are plotted for long-term policy. The NEV takes into account the position of the Netherlands in the north-west European energy market and the international development of energy prices. Energy demand and supply, greenhouse gas emissions, the contribution of energy activities to the national product and employment are all taken into consideration. This NEV thus provides an evidence base for political decision-making as well as the public debate on energy. This is the third NEV to be published. This edition pays particular attention to the impact of the measures included in the Energy Agreement. The differences between this edition and the NEV 2015 are also discussed.
This NEV makes five general observations.
1. Lower energy prices
Compared with the NEV 2015, the expected future prices of oil, gas and coal in global markets are significantly lower. These prices have fallen sharply recently. The expectation is that prices will once again reach the 2013 level around or after 2030. According to projections,
the wholesale price of electricity will remain at its current low level until 2020, and will then gradually increase and reach the 2010 level around 2030. Until that time, a high CO2 price is also not
expected in European emissions trading - only after 2030 will it begin to increase somewhat, according to current projections. This is obviously beneficial for citizens’ energy bills, which have been calculated until 2020. The effect of prolonged low energy prices is mainly reflected in shifts in the production mix, net electricity imports and the related emissions. For the share of renewable energy and energy savings, the calculated effects are limited.
2. Energy demand continues to decrease
The final energy demand remained virtually unchanged between 2000 and 2008 and then fell by 10 percent by 2015. This concerns demand from end users, excluding energy that is used as a raw material. Subdued economic growth played a role in this decrease in demand. According to projections, the economy is expected to pick up again in the coming years. Nevertheless, the demand for energy continues to fall, but more slowly than in recent years. Energy consumption for heating is also declining, particularly in
the built environment and in the agricultural sector. This is partly due to the rate of energy conservation forecast for the coming years, which is about half a percentage point higher than in recent years. Since recent additional policy commitments will be increasingly approaching their maximum effect by 2020 and there are few further tightening measures planned for after 2020, the rate of conservation will start to even out.
3. Major differences
The NEV 2015 spoke of a turning point in the Dutch energy supply. This overall picture has not changed significantly this year. What is considerably more striking than last year, however, is the variety of developments in the different sections of the energy system. The growth of the share of renewable energy being used for the electricity supply is one of the fastest ongoing developments. The roll-out of offshore wind energy especially seems very successful, and is set to continue to be so in the years ahead. Relatively less progress has been made with regard to energy consumption. In some cases, future steps are still in the exploratory phase, so their effects are not always visible in the forecasts. Regarding heat supply, many plans are currently being developed at national and local level, but only minor changes in consumption are visible in the actual forecast. Relatively small policy changes such as the Sustainable Energy Investment Subsidy Scheme (ISDE - Investeringssubsidie duurzame energie) and the tax shift are yet to have much of an impact. And only modest steps have been taken for the transport sector and industry. It is expected that these sectors will continue to use oil and gas in the long term.
4. Tough system
The NEV clearly shows that it is relatively difficult to manage change in the energy system and reduce greenhouse gas emissions through changes in policy and agreements between social actors. For example, we expect to see a net increase in energy saving in 2020 as a result of new measures included in the Energy Agreement. At the same time, however, this increase is not
that significant since some of the existing measures are predicted to be less effective by 2020. An example of this is the slowdown that has been observed in zero-on-the-meter renovations as part of the ‘Stroomversnelling’ programme.
Little progress has been made regarding efforts to improve the level of sustainability of the energy supply, despite the tightening of policy after the NEV 2015. External factors play an important role here. For example, on the one hand we have witnessed a more favourable picture emerging about the costs and potential of offshore wind energy, and on the other, little progress in the timely deployment of onshore wind energy due to complex discussions in a number of provinces.
It’s a different story for the reduction of greenhouse gasses. National emissions will drop sharply until 2020, but will then start to stabilise. This is mainly due to the effect of the reduction in energy consumption and the growth of renewable energy on national emissions being masked by volatile activity in the (conventional) energy sector. These fluctuations are caused by the dynamics of the electricity markets in neighbouring countries. The above examples demonstrate that making the Dutch energy
supply more sustainable is no easy task and it will take time. It is a complex interplay of technical, economic and social changes, unfolding both in the Netherlands and abroad, which can only be set on the right track if there is a large, long-term and coherent effort from all stakeholders.
5. Uncertainty on the one hand, Paris on the other
The energy and climate policies of our neighbouring countries are plagued by uncertainty. In Germany, the costs involved in energy transition are necessitating a reorientation of policy. In Britain, a clear, long-term policy has been developed, but it is proving difficult to define an appropriate plan for the short term. Brexit has increased uncertainty in this regard. In the run-up to the Climate Conference in Paris in 2015, France implemented powerful, long-term policy, but it is unclear whether nuclear energy will maintain its important role in the future. In light of the uncertain developments in the countries surrounding us, the Paris climate agreement is at least a guiding development.
Major challenges
The Netherlands also faces a major challenge. The Energy Agreement has obviously lead to tremendous policy dynamics. According to the projections, the share of renewable energy shows signs of strong growth and the target for 2023 is in sight. The target for 2020, however, will probably not be met. Steps are being taken as part of the effort to increase energy savings, but the expectation is that the target for 2020, as stipulated in the Energy Agreement, will also not be met. It should be noted, however, that a number of the announced measures are yet to be developed (and have their effects calculated). In a long-term perspective, it is especially noticeable how much there is still to do in the Netherlands. European leaders have agreed on the objective to reduce European greenhouse gas emissions by
80-95 percent by 2050 compared to 1990. As specified in the Energy Report 2015, the Dutch government remains committed to this agreement. This NEV illustrates that the Netherlands achieved a 12 percent reduction in 2015, and although a rapid further decline to 23 [20-26] percent is expected by 2020, this further reduction is then expected to slow down in both established and proposed policy scenarios. By 2035, the expectation is that there will be a 30 percent total reduction in greenhouse gas emissions compared to 1990. It is therefore plausible that additional reductions will have to be made in order to achieve the EU target by 2050.
Two policy variants
The NEV gives the most plausible forecast based on established and proposed policy.
The vision of the future reflected in the NEV is a representation of the most plausible developments in economics, demography, prices, markets, technology and policy, based on insights available on 1 May, 2016. The NEV provides forecasts for two different ‘policy variants’, taking into account both policies implemented by the Dutch government and measures and activities of other parties in society. The 'established policies’ variant is based on actual, officially published measures and agreements, or ones which are otherwise as binding as possible. The ‘proposed policies’ variant goes a step further and covers public, planned measures and agreements that had not yet been officially established on 1 May, but were concrete enough to include in the calculations. The biggest difference in
policy assumptions between established and proposed policies concerns the measures in the intensification package, adopted in the Energy Agreement in May 2016. The introduction of an energy savings obligation and a plan to save energy in energy-intensive industries are not included because these measures have not yet been developed into concrete policy proposals. Throughout the NEV, the ‘proposed policies’ variant takes precedence and the ‘established policies’ variant is only used to further illustrate a point, where relevant. Where relevant and possible, uncertainties relating to the energy system are translated into bandwidths in projections for the
most important indicators. This includes energy saving, the share of renewable energy and greenhouse gas emissions.
Key figures
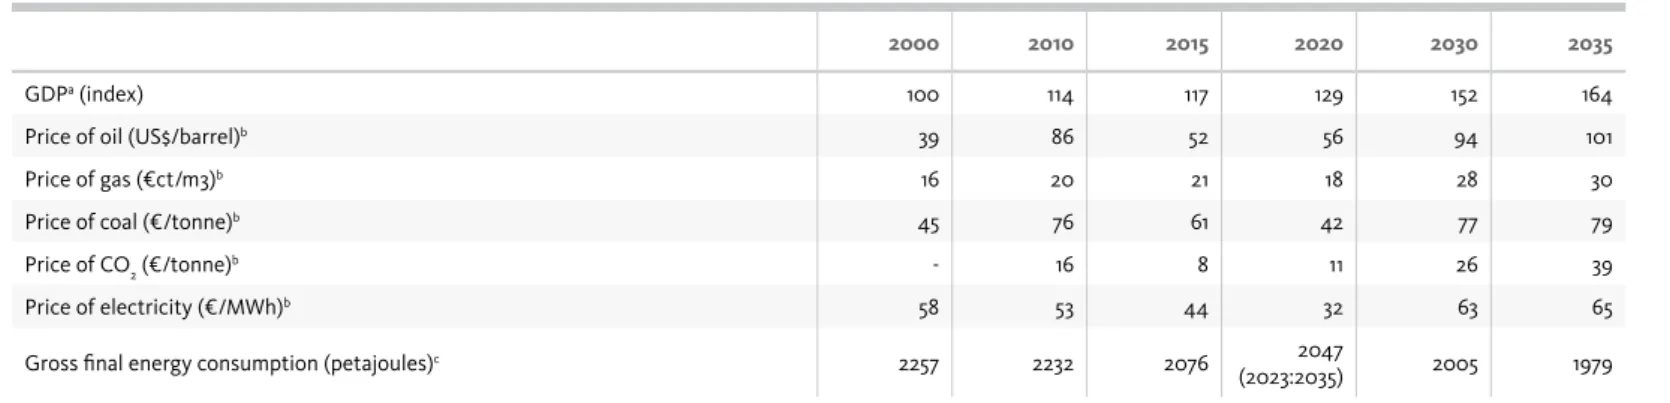
The table below (S.1) shows the key figures in the NEV 2016. The table lists a number of important input variables used by the NEV, such as global energy prices and European CO2 prices. The table also highlights important achievements and projected outcomes.
Table S.1 Core table for the National Energy Outlook 2016 proposed policies variant
2000 2010 2015 2020 2030 2035
GDPa (index) 100 114 117 129 152 164
Price of oil (US$/barrel)b 39 86 52 56 94 101
Price of gas (€ct/m3)b 16 20 21 18 28 30
Price of coal (€/tonne)b 45 76 61 42 77 79
Price of CO2 (€/tonne)b - 16 8 11 26 39
Price of electricity (€/MWh)b 58 53 44 32 63 65
Gross final energy consumption (petajoules)c 2257 2232 2076 2047
2000 2010 2015 2020 2030 2035 Renewable energy (petajoules) (calculation method as per EU directive) 35 92 119 (2023:313)253 412 503 Renewable energy (petajoules) (‘actual production’ calculation method) - - - (2023:316)258 - -Share of renewable energy (%) (calculation method as per EU directive) 1,6 3,9 5,8 (2023:15,812,5c,dc,d) 20,6 25,4
Share of renewable energy (%) (‘actual production’ calculation method) - - - (2023:15,912,7c,dc,d) -
-Rate of energy saving (% per year) - 1,1e - 1,5f 0,9g
-Energy savings according to EU -Energy Efficiency Directive (cumulative petajoules
2014-2020) - - - 520 -
-Energy savings resulting from measures in the -Energy Agreement (petajoules) - - - (2016:14)68 - -Total greenhouse gas emissions (megatonnes of CO2 equivalents) 220 214 196h 171 168 155
Reduction in greenhouse gases compared to 1990 (%) 1 4i 12 23 24 30
Greenhouse gas emissions from non-ETS sectors (megatonnes of CO2 equivalents) - 129 102h 95 86 83
Energy-related employment (x1000 working years) - 127 154 171 -
-Net additional employment as a result of the Energy Agreement, cumulatively from
2014-2020 (x1000 working years) - - - 91 -
-a Source: CPB, Centr-al Economic Pl-an 2016, Medium-Term Outlook 2018-2021. b Constant prices in 2015
c Temperature corrected value
d This also includes the outcome of the recent tender for the wind farm in Borssele. The other projection values that were affected by this could no longer be adjusted (see footnote 1)
e Average 2000-2010 f Average 2013-2020 g Average 2021-2030
h Preliminary emission figures (Source: CBS, Dutch Pollutant Release and Transfer Register)
Developments since the NEV 2015
Prices for oil, coal and gas adjusted downwardsPrices for energy carriers are historically highly volatile and are largely determined by global developments. Expectations concerning energy prices are therefore very uncertain. Since the NEV 2015, expectations have been sharply revised downwards. As such, this edition of the NEV stipulates that the expected oil price per barrel in 2020 is 56 USD compared to 89 USD last year, thus amounting to 94 USD in 2030 instead of 140 USD. The reasons behind this adjustment in the short term are excess supply in the market, the increase in the production of unconventional oil in North America and the changed position of OPEC, which has decided not to implement production restrictions under the current circumstances. As a result of stagnating and reduced global demand, coal and gas prices have also been adjusted downwards. By establishing a more credible global climate policy, which is connected to the Paris Convention, the demand for conventional energy is also expected to fall in the longer term and prices will also be lower than previously expected. Oil, coal and gas prices are all partly dependant on the same factors, such as the aforementioned climate policy and the development of the world economy.
Wholesale price of electricity under pressure
Climate policy in Europe affects the price of conventional electricity production. In the coming years, the anticipated price for CO2 in European emission trading is expected to remain low and will only begin to rise somewhat in the mid-2020s, because the huge
reserve of carbon credits runs out then. By virtue of these price developments and the increase in wind and solar energy, the wholesale price of electricity remains under a lot of pressure; it has halved compared to ten years ago. The price of electricity is expected to remain at the current low level until 2020. It is then expected to rise gradually and to have doubled by 2030 compared to the current level. According to model outputs, the price difference between Germany and the Netherlands will become increasingly small by 2020, and wholesale prices will be around the same level thereafter.
Policy in (north-west) Europe uncertain
Germany has been stimulating the production of renewable energy for many years and its citizens play an important role in that process. This policy, however, entails high costs, which has led to a number of adjustments. The question is whether citizens can continue to play an active role in practice once these adjustments have been made. In recent years, the United Kingdom has developed a strong and clear policy focused on the long term, addressing both greenhouse gas emissions and the structure of the electricity market. A climate law prescribes a gradual reduction in greenhouse gas emissions in order to meet a predetermined target. Various policy instruments focus on investment in low-emission energy. However, it is very difficult to get these investments off the ground and to implement follow-up steps that lead to an actual reduction in emissions. In Belgium, there is a lack of long-term policy and there are fundamental uncertainties which make investment in the electricity supply unattractive. These uncertainties are due to a succession of decisions regarding the future of nuclear energy. In the run-up to the Climate Conference in
Paris, France adopted a wide range of specific policy measures. Of all the neighbouring countries, it is here that momentum seems the strongest. But even in France, the reality is more complicated; the difficult issue of the future of nuclear power is still unresolved.
Energy consumption continues to fall
The final energy consumption is highest in the built environment (33 percent in 2014), followed by industry (28 percent) and traffic and transportation (23 percent). In 2014/15, this final demand was at its lowest since 2000. If we consider the scenario based on established policies, demand is expected to fall slightly in the long run - after a slight increase between 2020 and 2025. This decrease is slightly larger when basing expectations on the proposed policies scenario. As a result, the level of consumption for this year is slightly lower than indicated in the NEV 2015. The continuous drop in energy consumption is down to a small decrease in heat consumption, while electricity consumption is virtually constant. Looking at sectors individually, there is an especially sharp decrease in the service sector and to a lesser extent in households and agriculture. The remaining consumption, in the industry and traffic and transport sectors, is more or less constant.
Energy mix is changing rapidly
Table S.2 shows the primary energy consumption according to energy source. Total consumption is expected to decrease in the period leading up to 2020. It is then expected to remain roughly constant until 2030, before declining further. In the period between now and 2035, natural gas will gradually become less important.
Table S.2. Primary energy consumption according to energy source proposed policies variant
(Petajoules) 2000 2015 2020 2035 Oil 1173 1173 1212 1253 Natural gas 1517 1191 1040 885 Coal 325 516 326 292 Renewablesa 52 136 276 491 Miscellaneous 72 88 92 35 Net electricity
imports 65 (import) 40 (import) 75 (import) -74 (export)
Total 3204 3144 3020 2882
a The level of renewable energy consumption in primary terms differs from the gross final consumption of renewable energy that is shown in Table S.1 due to differences in definitions used.
Consumption levels have been decreasing since 2000 because less gas is being used for the production of electricity, and households and industry are also using less. The decline in natural gas
consumption is stronger than the decline in total consumption and is partly offset by the increasing consumption of renewable energy. In the past year, the low price of coal and the commissioning of new coal-fired power plants have resulted in a record level of coal consumption. Taking into account the closure of old coal-fired power plants, the co-firing of biomass and market conditions, by 2020 the use of coal will have been reduced by more than a third compared to 2015. As a result of the discontinuation of subsidies for the co-firing
of biomass and changing market conditions, the use of coal will then rise again in the following period and reach about 400 petajoules by 2027. After that year, coal consumption will decrease steadily. The Netherlands is expected to become a net exporter of electricity just before 2025.
Decline and revival of the use of coal in the electricity production mix
Between now and 2020, the closure of old coal-fired power plants, the low cost of German renewable electricity and additional connections to Germany will result in the reduced deployment of Dutch coal-fired power plants. This is one of the major reasons behind the expected reduction in CO2 emissions in the Netherlands in the period up to 2020. The nuclear power phase-out means that nuclear power plants will no longer be used in Germany after 2020. That, in combination with the increase of renewable energy in the Netherlands, will generate a decrease in net imports from Germany to the Netherlands. As of 2025, total electricity exports from the Netherlands will outstrip imports. As a result, production at coal-fired power plants in the Netherlands will increase. In turn, this will increase the amount of CO2 emissions in the Netherlands after 2020, despite the increase in renewable electricity production. If the production of renewable electricity continues to grow as projected, the use of coal is expected to decline after 2027. However, this development is uncertain and sensitive to changes in energy prices and policies.
In the electricity market, we are witnessing a sharp drop in decentralised power and heat production due to an unfavourable relationship between gas and electricity prices. This drop is especially
evident in the horticultural sector. Central electricity production will decrease somewhat up to 2020, and will then start to pick up again. Assuming that the SDE+ subsidies will continue, the production of renewable electricity will continue to increase, meaning that conventional plants will be used less frequently after 2030.
Production of renewable energy is increasing rapidly, 2023 target in sight
In 2015, the share of renewable energy increased from 5.5 to 5.8 percent (provisional statistic). During the next few years, the share of renewable energy will grow rapidly, boosted by the commitments included in the Energy Agreement. However, it does not yet appear as though the target of 14 percent for the share of renewable energy will be met by 2020. According to the definition that was agreed upon by the European Member States, a share of 12.5 percent1
is expected in 2020 (bandwidth of 10.1 - 12.7 percent). In the 'actual production’ scenario, in accordance with the calculation method used in the NEV 2014, the Netherlands will reach the 12.7 percent mark in that year (bandwidth 10.4 - 13.0 percent). Both percentages are slightly
1 In order to reflect the latest insights regarding the development of the offshore wind sector, the shares of renewable energy indicated in this summary diverge from the values from the integral assessment in this NEV. After completion of the integral assessment, it was revealed that the tender offer for plots 1 and 2 at Borssele was considerably lower than was initially expected. In addition, more electricity was produced than expected. This has led to the awareness that, in the future, tenders can be cheaper and more electricity can be produced. Expectations regarding the share of renewable energy have therefore been adapted based on this understanding. Other projection values which are also influenced by this understanding, however, could not be adjusted in time.
higher than estimated in the previous NEV, mainly due to higher production levels from smaller installations ('other renewables’) and the decrease in total energy consumption. In 2023, a share of 15.8 percent is expected according to EU methodology (13.3 - 16.8 percent), and a share of 15.9 percent is expected if the ‘actual production’ scenario is used (13.4 - 16.8 percent). In the period until 2023, it is expected that there will be several positive and negative developments in relation to the NEV 2015. Developments in offshore wind, small-scale renewable energy production and total energy consumption will all have favourable impacts on the share of renewable energy, while the slightly less rapid growth of solar power, limited opportunities for industrial fermentation, and less heat production from waste incineration plants will be unfavourable. On balance, this NEV does not portray a materially different picture for 2023 than the previous NEV: given the uncertainties that will characterise the period up until 2023, the target of a 16 percent share of renewable energy can be achieved.
After 2023, the share of renewable energy in the ‘proposed policies’ variant will continue to grow to 20.6 percent by 2030. This can mainly be explained by the presumed continuation of the SDE+ scheme, which supports the continued growth of offshore wind and renewable energy in the built environment.
Local energy generation is increasing
In the Netherlands, we are seeing a growing number of local energy collectives that focus on energy production, energy saving and collective purchasing of solar panels and energy. A growing number
of cooperatives are focussing on the development of collective solar and wind projects. In 2015, the contribution made by these cooperatives was modest: 1 percent of the total peak power of all solar panels in the Netherlands and 3 percent of the total capacity of onshore wind energy came from these cooperatives. These percentages are set to increase sharply in the coming years. In 2016, an increase from 13 megawatts in 2015 to 20 megawatts of solar PV is expected. The installed capacity of collective wind projects is expected to grow from 82 megawatts in 2015 to 232 megawatts in 2018.
Energy saving target outlined in the Energy Agreement not expected to be achieved
With an expectation of 68 petajoules, the target set in the Energy Agreement to save an additional 100 petajoules of energy, will probably not be met. The bandwidth for this projection is 37-99 petajoules, partly due to the uncertainty regarding the precise implementation of certain measures, and partly due to policy-inde-pendent factors. Households will achieve a saving of 10 petajoules, while the service sector will save 16 petajoules. The agriculture and horticultural sector will save 10 petajoules; industry will achieve a saving of 12 petajoules. The share of energy savings in the transport sector will be 19 petajoules. The scope of these savings figures should not only be considered in relation to the total energy consumption by sector, but also in relation to the savings potential that has already been realised. These 68 petajoules are the result of a very large number of policy instruments. However, on closer inspection, a large part will be achieved as a result of two types of effort, namely; better enforcement of the Environmental Management Act (16.1
petajoules) and the European instrument that sets CO2 standards for cars (12.3 petajoules). These two instruments achieve more than 40 percent of the estimated savings result (68 petajoules) from the Energy Agreement. The contribution of European instruments to this savings result is 19 percent. Certain measures from the intensifica-tion package, such as the energy savings obligaintensifica-tion scheme and a plan for energy conservation in the major industries, were still insuf-ficiently developed by 1 May 2016 to be included in the assessment. However, if they are shaped and structured effectively, they may be able to make a positive contribution to the savings result.
The Netherlands complies with the obligation under Article 7 of the Energy Efficiency Directive
Article 7 of the Energy Efficiency Directive requires that the Netherlands saves 482 petajoules cumulatively on end usage in the period from 2014 to 2020 on the basis of domestic policy. This obligation has a different scope and different level of ambition than the energy savings target stipulated in the Energy Agreement. Based on proposed policy, the Netherlands is expected to save 520 [474-636] petajoules cumulatively. Based on the estimate impact of the ‘proposed policies’ scenario, the Netherlands will probably meet its obligation imposed by Article 7. As in the previous NEV, an important caveat here is that there is still discussion in Europe as to which savings a Member State is allowed to include.
Greenhouse gas emissions rise in 2015, drop sharply by 2020 and stabilise by 2030
In 2014, the national greenhouse gas emissions were 16 percent
lower than in 1990 (a reduction from 222 to 187 megatonnes of CO2 equivalents). According to preliminary figures, emissions increased in 2015 by 9 megatonnes due to relatively cooler weather and the commissioning of new coal-fired power plants. Consequently, the reduction percentage dropped to 12 percent compared to 1990. Between 2015 and 2020 greenhouse gas emissions are expected to fall to 171 [165-178] megatonnes of CO2 equivalents, resulting in a 23 percent [20-26] reduction in greenhouse gases between 1990 and 2020. The main reasons for the decline between 2015 and 2020 (approximately 20 megatonnes of CO2 equivalents) are
the previously described changes in electricity production from coal and gas. After 2020, emissions from conventional electricity production will start to increase again. This development, coupled with end-use sectors producing slightly lower emissions, will ensure that the national emissions level will then first increase slightly until around 2026. After that, the level of emissions will fall slightly to 168 [150-186] megatonnes of CO2 equivalents in 2030, resulting in a 24 percent [16-32 percent] reduction in greenhouse gases between 1990 and 2030.
Greenhouse gas emissions from 1990-2020 almost reduced to level imposed by judicial ruling
Given the upwardly adjusted emissions in 1990 and the new estimates, the national level of greenhouse gas emissions will have decreased between 1990 and 2020 by 23 percent (20-26 percent) in the ‘proposed policies’ scenario. The projection value of 23 percent thereby comes close to the 25 percent reduction imposed on the
Dutch state by the court in 2015. The calculated bandwidth of 20 to 26 percent, however, indicates that there is a lot of uncertainty. Between the projection value (23 percent) and the ruling (25 percent) there is set to be an absolute difference of 4 megatonnes of CO2 equivalents by 2020, surrounded by a calculated uncertainty bandwidth from -1 to 12 megatonnes. As such, the reduction between 1990 and 2020 could, in principle, even end up being 1 megatonne higher than necessary to meet the target set in the ruling, or 12 megatonnes of CO2 equivalents lower than required.
The calculated bandwidth does not include all the factors that may be relevant in this context. Uncertainties surrounding domestic consumption of energy, the production of renewable energy and electricity interconnection capacities with other countries have been included in the calculations. However, this bandwidth does not take into account the uncertainty associated with the demand for electricity and capacity development of energy production abroad. These factors can greatly affect the deployment of power plants in the Netherlands and the associated emissions (see Section 1.3 in the NEV main text for an explanation of uncertainties [in Dutch]). Furthermore, weather conditions are not included in the bandwidth either. Weather conditions can greatly affect the level of emissions in a particular year, but are not relevant for analysing the target range in a European context. The question is, to what extent will the possible variation in emissions due to weather conditions affect the judicial ruling. After 2020, the reduction percentage will fluctuate between 21 and 24 percent compared to 1990. This is due to the expected dynamics
on the north-west European electricity market and the consequently varying electricity production in the Netherlands from coal and gas (see above).
Decrease in greenhouse gas emissions from 1990-2020 now estimated to be much higher than in previous NEV reports
In the NEV 2016, the reduction percentage for greenhouse gas emissions between 1990 and 2020 (23 percent) is more than 4 percentage points higher than in the previous NEV (19 percent) and more than 6 percentage points higher than in the NEV 2014 (17 percent). Just under half (40 percent) of the increase in reduction percentage since the NEV 2014 can be explained by adjustments in the historic emissions inventories and slightly more than half (60 percent) by adjustments to projected emissions. The projected emissions have been adjusted to account for changing perceptions of 'policy external' factors and the impact of policies.
European target for non-ETS emissions from 2013-2020 expected to be reached and exceeded by a significant margin
In the ‘proposed policies’ variant, the annual non-ETS emissions are expected to fall from 102 megatonnes of CO2 equivalents in 2015 (provisional figure) to 95 [92-99] megatonnes of CO2 equivalents in 2020. In the same variant, the cumulative non-ETS emissions in the period from 2013 to 2020 will end on 800 megatonnes of CO2 equivalents. This is well below the European reduction target for the Netherlands of 920 megatonnes of CO2 equivalents for this period. The Netherlands can also use 4 megatonnes worth of foreign carbon credits to meet the target.
The Netherlands to become net importer as a result of less gas production
For many years, between 70 and 80 billion cubic meters of natural gas were extracted from Dutch soil per year, but this dropped to 66 billion cubic meters in 2014 and 51 billion cubic meters in 2015. Net gas exports fell sharply in 2014 and 2015. Over the coming years, if production levels from the Groningen field reach and remain at the maximum permissible level of 24 billion cubic meters, the Dutch production level will initially decrease slightly due to the depletion of small fields. The Groningen gas that is not recovered as a result of the production ceiling being lowered can still be produced later. The Netherlands will therefore be able to meet its own gas needs for longer than previously assumed. Production from the Groningen field will eventually fall after 2025 due to depletion. Due to the further restriction on the maximum permitted production levels at the Groningen field to 24 billion cubic meters, it is expected that the Netherlands will only start to import more gas than it exports between 2030 and 2035. The NEV 2015 predicted this tipping point would come five years earlier, since the estimation was based on a maximum production level of 33 billion cubic meters for the coming years.
Shifting investments in the energy system
The energy supply is highly capital intensive. Energy-related activities make up 5 percent of the gross national product and account for 10 percent of investments. Investments in renewable energy and energy saving are strongly on the rise. In 2014,
approximately 50 percent of energy-related investments were made
in the conventional energy sector and by 2020 this is expected to drop to 20 percent. The share of renewable energy and energy conservation will increase from about 30 percent in 2014 to 60 percent in 2020. The rest of the investments are made in energy networks, which are increasingly influenced by the energy transition.
Employment target outlined in the Energy Agreement expected to be achieved
In 2015, conventional energy accounted for 50 percent of total energy-related employment (78,000 full-time equivalents, FTEs), the energy networks for 19 percent (30,000 FTEs), and renewable energy and energy conservation for 31 percent (49,000 FTEs). By 2020, total energy-related employment will have increased to around 171,000 FTEs, an increase of 14,000 FTEs compared to 2015. More than 73,000 of the FTEs will be related to renewable energy and energy saving. In the Energy Agreement, it was agreed that the Netherlands would aim to add an extra 90,000 working years from 2014 to 2020. This concerns additional jobs that will be generated in that period and, therefore, is represented as a net figure. According to estimates, the increase in net employment between 2014 and 2020 will be 91,000 working years, thereby achieving this goal.
ECN P.O. Box 1, 1755 ZG Petten The Netherlands Contact: +31 (0) 88 515 4949 energieverkenning@ecn.nl ecn.nl pbl.nl cbs.nl rvo.nl